15-3 Illinois Map: First Attempt

The goal of this map is to reduce the number of Republican representatives in Illinois from the current 11 to 3.  I must admit that my ideal would be for every single state to have a non-partisan commission to do redistricting.  Doing partisan maps such as this is indeed playing “ugly.”  However, as long as Republicans continue to push the envelope on this issue (including unprecedented mid-decade remaps like the one in Texas) there is no reason the Democratic Party should not likewise draw partisan maps in the states where it controls the process.

This is my first try at Illinois using Dave’s Application.  It’s really a type of “first-draft” for me because the Application currently does not provide partisan data.  I focused here more on demographics — making sure the three African-American majority seats and single Hispanic majority seat are preserved, as well as creating a second Hispanic-majority seat.  In several past diaries on Illinois, I read comments that a second seat might not be viable.  However, I think a viable second seat can be created without too much trouble on the south side of Chicago — one that’s at least 63% Hispanic (under this proposed plan) while preserving the north side seat (which is 59% Hispanic under this map).  I intentionally made the “south-side” seat relatively more Hispanic as that area is composed mostly of Mexican-Americans, while the “north-side” seat encompasses people of mostly Puerto Rican descent who are all citizens and therefore does not need to be as Hispanic.  

The partisan goal here was to basically create a 15-3 map (as I feel that is very doable in Illinois), but since the partisan data isn’t in the Application yet, it was a very tedious process trying to get to the right balance.  To a large extent, I first drew the general outlines of districts and only then applied partisan precinct-level data from various county sources (see links at bottom of diary).  Once drawn, it was very time-consuming to adjust the precincts and data.  Therefore, some of my districts are not really as Democratic as I would like them to be.  Getting them more Democratic would be much easier with the partisan data in the Application, as you could easily try and try again to get just the right balance.  The Application is truly invaluable in doing this right, and I feel that once the partisan data is in the system, a much better map can be constructed.  Nevertheless, here’s the first draft.  Since I will likely do this again once the partisan data is input into the system, I really welcome comments on how to make Illinois truly a lock-proof 15-3 plan.  This is the Democrats biggest chance to really make a Democratic map this cycle — one that may have an effect on whether we win back the House next year.

I tried to draw many of the districts in a manner whereby the Democratic incumbents get to keep as many of their constituents as possible, while the GOP incumbents’ districts are basically torn apart by the map — if that means a Democrat will subsequently have a better chance at taking over a district.  While individual GOP districts are torn apart, counties and communities are not. The resulting map is overall actually less gerrymandered than the current map, with the new map trying to keep counties and communities within the same district. Under the existing map, there are 149 “county-fragments” in Illinois, while under the proposed map here the number of “county-fragments” goes down to 134 (granted, the number of districts goes down from 19 to 18).  The  Obama – McCain (2008) numbers are drawn from actual precinct data — though imperfect because it didn’t match in a small portion of cases (kind of like the partisan data in the Application for Maryland, where there’s still a number of precincts that don’t match and/or missing data), and in a very small number of cases in rural Illinois, I had to estimate the numbers because county data (Bureau, Carroll, Jersey, Perry and Vermilion) was not available online.  The bottom line, therefore, for my Obama – McCain numbers is that I feel that they are accurate to maybe +/- 1 percentage point (but not perfect as would be with the Application).  I tried to also provide Kerry – Bush (2004) numbers for the districts, but here the effort is pure estimation using larger geographical subsets like wards and townships (it was just too tedious to do this by precinct) … so those numbers should be looked at in that light, though I feel they are still probably not off by more than a couple points from reality.  (My population deviation is no more than +/- 938 persons per district).

Photobucket

Photobucket

Photobucket

To start, I’d like to discuss what happens to the GOP incumbents under this plan … The first 8 districts here are ones where the goal is to bump out the Republican incumbent and replace them with a Democrat (first 7), or in the case of IL-19, the district just disappears with reapportionment and makes a Republican disappear with it.

IL-6: Roskam’s district is divided among the new IL-6 (about 1/3) and IL-14 (about 1/3), with the remaining 1/3 divided among IL-4, IL-5, IL-7 and IL-9.  His Wheaton home remains in the new IL-6, but a larger portion of the revamped district comes out of Lipinski’s current IL-3.  So the most likely result is a Roskam – Lipinski matchup, which is likely to go to Lipinski (for reasons discussed under “District 6” below) … or a Roskam – Foster matchup, with Foster having an advantage as he would represent more than half of the new IL-14, which now becomes significantly more Democratic.

IL-8: Over half of Walsh’s current IL-8 remains within the boundaries of the new district (although not Walsh’s home).  (The rest is split among IL-5, IL-9, IL-10, IL-14 and IL-16.)  The revamped IL-8 becomes significantly more Democratic than the current version.

IL-10: Dold’s current district is split up among several new districts: the new IL-10 gets about 1/3 (including Dold’s home in Kenilworth), the new IL-9 gets about 1/3 while the remaining 1/3 is split among IL-5 and IL-8.  The new IL-10 becomes significantly more Democratic than the current version.

IL-11: Only about 1/4 of Kinzinger’s current district remains inside the revamped IL-11.  About 2/5 goes to the new IL-13, which becomes a much more Democratic district (67% Obama).  The rest is shared between the new IL-2 (including Kinzinger’s home area in Kanakee Co.), the new IL-1 and the new IL-16.

IL-13: Biggert’s district is basically annihilated.  About 1/4 remains in the new IL-13.  About 1/4 (including Biggert’s home area around Hinsdale) goes to IL-7, while the remaining 1/2 is almost equally divided in three and attached to the new IL-1, IL-6 and IL-14.

IL-14: About 1/2 of Hultgren’s current district remains under the new lines.  About 1/4 goes to IL-5 and 1/4 to IL-11 (with a small part to IL-16 and IL-17).  Hultgren’s home remains in the district, which is made significantly more Democratic.

IL-17: A little over 1/3 of the current IL-17 remains under the new lines (Schilling’s home in Colona is excluded).  Another 1/3 becomes part of the new IL-18, while the remainder is split between IL-12, IL-15 and IL-16.  The Democratic percentage goes up by several points.

IL-19 (Shimkus) disappears from Illinois with reapportionment; however, Shimkus could choose to run in the new IL-18, as his home is in Madison Co.

The last 3 districts created are ones which are designed to stay in GOP hands.  They are made to be basically “sink” areas, which contain as many Republicans as possible … These include IL-15 (Johnson), IL-16 (Manzullo) and IL-18 (Schock or Shimkus).    

Now, to a detailed discussion of individual districts …

District 1:

Proposed District Demographics: 52% black; 40% white; 5% hispanic

Current District: Obama 87; McCain 13

Proposed District: Obama 76; McCain 23

Current District: Kerry 83; Bush 17

Proposed District: Kerry 71; Bush 29 (Estimate)

Incumbent(s): Rush

Rush gets to keep 61% of his current constituents.  About 15% of the new district (population-wise) comes out of territory currently a part of IL-13, while 14% comes out of IL-11.  The remainder is attached from areas currently a part of IL-2, IL-3 and IL-7.

District 2:

Proposed District Demographics: 51% black; 38% white; 10% hispanic

Current District: Obama 90; McCain 10

Proposed District: Obama 78; McCain 21

Current District: Kerry 84; Bush 16

Proposed District: Kerry 72; Bush 28 (Estimate)

Incumbent(s): Jackson; Kinzinger

Jackson gets to keep 56% of his current constituents.  About 20% of the new district comes out of territory currently a part of IL-11 (including Kinzinger’s home area), 12% comes out of IL-1, while 11% is taken out of IL-15.

District 3:

Proposed District Demographics: 63% hispanic; 28% white; 5% black

Current District: Obama 64; McCain 35

Proposed District: Obama 78; McCain 20

Current District: Kerry 59; Bush 41

Proposed District: Kerry 73; Bush 27 (Estimate)

Incumbent(s): None

The current IL-4 is split exactly in half by this plan: 49% of the new IL-3 comes out of territory currently in IL-4 (while the new IL-4 also gets to keep 49% of the existing IL-4).  40% of the proposed IL-3 comes out of the current IL-3, while the remainder is formed out of parts of IL-1, IL-2 and IL-7.  In the meantime, about 44% of the existing IL-3 goes into the new IL-6 and becomes the largest chunk of that revamped district; therefore, Lipinski basically gets to keep his district while a second Hispanic district can still be created here (encompassing people largely of Mexican descent).  The 63% hispanic – 28% white ratio here should ensure that a Hispanic rep is elected.

District 4:

Proposed District Demographics: 59% hispanic; 29% white; 6% black; 5% asian

Current District: Obama 85; McCain 13

Proposed District: Obama 77; McCain 22


Current District: Kerry 79; Bush 21

Proposed District: Kerry 70; Bush 30 (Estimate)

Incumbent(s): Gutierrez

As discussed above, Gutierrez gets to keep 49% of his current constituents.  About 30% of the new district comes out of territory currently a part of IL-5, while 11% comes out of IL-9.  The remainder is attached from areas currently a part of IL-6 and IL-7.  This new district isn’t “as Hispanic” as the new IL-3, as people of Puerto Rican descent are already citizens and so the Hispanic: white ratio does not need to be as large in order for a Hispanic rep to be elected here.

District 5:

Proposed District Demographics: 74% white; 16% hispanic; 7% asian

Current District: Obama 73; McCain 26

Proposed District: Obama 62; McCain 37


Current District: Kerry 67; Bush 33

Proposed District: Kerry 54; Bush 45 (Estimate)

Incumbent(s): Quigley

Quigley gets to keep 48% of his current constituents.  About 27% of the new district comes out of territory currently a part of IL-14, while 11% comes out of IL-6.  The remainder is attached from areas currently a part of IL-4, IL-7, IL-8, IL-9 and IL-10.

The Democratic percentage does down significantly as the lines are changed.  However, it should be noted that Quigley won with 71% this past November under the current lines, with the GOP candidate at 25% and the Green party candidate at 4%.  Even if the Democratic percentage is reduced by a dozen points or so, a competent Democrat like Quigley should still win rather comfortably here.  (Having said that, once the partisan data is put into the Application, I would like to make this district a tad more Democratic).

District 6:

Proposed District Demographics: 81% white; 9% hispanic; 5% asian

Current District: Obama 56; McCain 43

Proposed District: Obama 56; McCain 43

Current District: Kerry 47; Bush 53

Proposed District: Kerry 49; Bush 51 (Estimate)

Incumbent(s): Lipinski, Roskam

About 44% of the new district’s population is comprised of current constituents of Lipinski’s IL-3, while about 31% are currently a part of Roskam’s IL-6 (18% come out of the current IL-13, while the rest are transferred from IL-1, IL-4 and IL-7.)  Overall, 57% of the new IL-6 would be in Cook Co. and 43% in DuPage Co.  I believe that the advantage in such a situation goes to Lipinski.  Even during the recent GOP wave, Lipinski won his district with 70% of the vote, with the GOP candidate at 24% and the Green party candidate at 6%.  He was one of only two Illinois Democrats who had a higher winning percentage in 2010 than Obama had in 2008 in their district (the other was Costello, and Lipinski did better among the two).  In the meantime, Roskam won his district by “only” a 64-36 ratio in November of last year.  I think that the numerical breakdowns discussed above in combination with Lipinski’s conservadem qualities would make him the prefect candidate for the revamped IL-6.

District 7:

Proposed District Demographics: 51% black; 36% white; 6% hispanic; 6% asian

Current District: Obama 88; McCain 12

Proposed District: Obama 78; McCain 21

Current District: Kerry 83; Bush 17

Proposed District: Kerry 72; Bush 28 (Estimate)

Incumbent(s): Davis, Biggert

Davis gets to keep 61% of his current constituents.  About 27% of the new district comes out of territory currently a part of IL-13 (including Biggert’s home area), while the remainder is attached from areas currently a part of IL-1, IL-3, IL-4, IL-5 and IL-6.

District 8:

Proposed District Demographics: 65% white; 21% hispanic; 7% black; 6% asian

Current District: Obama 56; McCain 43

Proposed District: Obama 59; McCain 40

Current District: Kerry 44; Bush 56

Proposed District: Kerry 49; Bush 51 (Estimate)

Incumbent(s): None

Unlike other GOPers, Walsh gets to keep more of his territory — 55% in this case (although not his Winnetka home).  The reason is simple — it’s also Melissa Bean’s territory, and she may decide to run again.  She lost by only a point in November (one of the few races where the Green party candidate screwed the Democrat this past election).  The district is made several points more Democratic (as territory is added from adjoining districts: 25% from IL-10 — basically the very Democratic Waukegan and North Chicago, and 21% from IL-16 – more Democratic parts of McHenry Co. like Crystal Lake).  The increase in Democratic numbers in combination with Obama being on top of the ticket in 2012 should make this revamped district a great comeback opportunity for Bean.

District 9:

Proposed District Demographics: 71% white; 14% asian; 10% hispanic

Current District: Obama 72; McCain 26

Proposed District: Obama 63; McCain 36


Current District: Kerry 68; Bush 32

Proposed District: Kerry 57; Bush 43 (Estimate)

Incumbent(s): Schakowsky

Schakowsky gets to keep 52% of her current constituents.  About 37% of the new district comes out of territory currently a part of IL-10 (basically the Cook Co. portion of that district), while the remainder is attached from areas currently a part of IL-6 and IL-8.

Schakowsky won with 66% last November, with the GOP candidate at 31% and the Green party candidate at 3%.  I really don’t see her losing under these new lines.

District 10:

Proposed District Demographics: 76% white; 8% asian; 8% hispanic; 6% black

Current District: Obama 61; McCain 38

Proposed District: Obama 65; McCain 33

Current District: Kerry 53; Bush 47

Proposed District: Kerry 57; Bush 43 (Estimate)

Incumbent(s): Dold, Walsh

Dold gets to keep only 32% of his current constituents.  About 21% of the new district comes out of territory currently a part of IL-8, 20% comes out of IL-9, 13% out of IL-7 and 12% out of IL-5.  The district becomes several more points (about 4 points) more Democratic, as it expands southward into lake-side Chicago neighborhoods — and in combination with Obama being on top of the ticket, a good Democratic candidate would be likely to take this district back in 2012.

District 11:

Proposed District Demographics: 79% white; 8% black; 8% Hispanic

Current District: Obama 53; McCain 45

Proposed District: Obama 56; McCain 43

Current District: Kerry 46; Bush 53

Proposed District: Kerry 48; Bush 52 (Estimate)

Incumbent(s): Johnson

It should be noted that Kinzinger no longer lives in this district.  Johnson does and, in fact, areas in his current IL-15 form the largest percentage (42%) of the new district’s population.  27% comes out of the current IL-11, while 27% comes out of IL-14.  The remainder is attached from areas currently a part of IL-16 and IL-18.  Johnson could conceivably still run and win here, but the new IL-15 would seem to present a much better opportunity for Johnson (discussed below).  The proposed IL-11  encompasses no less than three major college towns: Champaign-Urbana (Univ. of Illinois); Bloomington (Illinois State Univ. and Illinois Wesleyan Univ.) and DeKalb (Northern Illinois Univ.)  Ideally, the enthusiasm shown by that demographic in 2008 will repeat itself next year, and would make this a Democratic pick-up.

District 12:

Proposed District Demographics: 78% white; 17% black

Current District: Obama 54; McCain 44

Proposed District: Obama 57; McCain 41

Current District: Kerry 52; Bush 48

Proposed District: Kerry 55; Bush 45 (Estimate)

Incumbent(s): Costello

Costello gets to keep 82% of his current constituents.  About 12% of the new district comes out of territory currently a part of IL-17, while the remainder is attached from areas currently a part of IL-18 and IL-19.  The district becomes more Democratic as it expands into the central part of Springfield, while a few more conservative counties in the south are wholly or partly detached.

District 13:

Proposed District Demographics: 58% white; 22% black; 15% hispanic

Current District: Obama 54; McCain 45

Proposed District: Obama 67; McCain 32

Current District: Kerry 45; Bush 55

Proposed District: Kerry 59; Bush 40 (Estimate)

Incumbent(s): None

About 42% of the new district’s population comes out of territory currently a part of IL-11, 29% comes out of IL-13, and 28% comes out of IL-2 (with a sliver out of IL-1).  Neither Kinzinger nor Biggert live within the current lines, and even if they did it would be hard to win in a revamped 67% Obama district.  Only question becomes which local Democrat could run here (Halvorson comeback ?).

District 14:

Proposed District Demographics: 60% white; 26% hispanic; 7% asian; 6% black

Current District: Obama 55; McCain 44

Proposed District: Obama 60; McCain 39

Current District: Kerry 44; Bush 55

Proposed District: Kerry 49; Bush 50 (Estimate)

Incumbent(s): Hultgren

Hultgren gets to keep 51% of his current constituents.  The reasoning is the same as with IL-8 above — the new lines may present a great comeback opportunity for Foster.  (32% of the new district comes out of the current IL-6, 13% out of IL-13, and the rest from IL-8).  The roughly half of IL-14 that remains under the new lines encompasses the most Democratic parts of IL-14.  In fact, in November while losing in the district overall by 51-45 (with the Green candidate at 4%), Foster won the half that remains here by roughly 54-42-4.  (He had big margins in Aurora and Elgin, and lost smaller areas like Batavia and the western townships of DuPage Co. by much smaller margins.)  In addition, the areas attached to the new IL-14 from IL-6, IL-13 and IL-8 are relatively more Democratic parts of those districts.  For example, during the 2006 matchup between Roskam and Duckworth in IL-6, Duckworth won the Bloomingdale Township and Wayne Township parts of IL-6, as well as Hanover Township in northwestern Cook Co.

During the 2008 election, Biggert won the Naperville part of IL-13 against Harper, but it was the closest Harper came to Biggert in DuPage Co. in that election (he lost the township by less than 2,000 votes out of approx. 40,000 cast there.)  So, all in all, Democrats have performed quite well in recent House elections in almost every corner of the new IL-14.

District 15:

Proposed District Demographics: 94% white

Current District: Obama 48; McCain 50 (Current IL-19 is Obama 44; McCain 54)

Proposed District: Obama 42; McCain 56

Current District: Kerry 41; Bush 59 (Current IL-19 is Kerry 39; Bush 61)

Proposed District: Kerry 36; Bush 64 (Estimate)

Incumbent(s): None (but designed for Johnson)

Johnson gets to keep 36% of his constituents if he decides to run here.  A larger percentage, 53%, comes out of the current IL-19 (which is set to disappear entirely as Illinois loses a House seat), but Shimkus’ home area around Collinsville is outside of the new district’s lines, and it would make more sense for Shimkus to run in the new IL-18, and for Johnson to run in this new hyper-Republican district.  (11% of the new district’s population comes out of the current IL-12, while a sliver comes out of IL-17).

District 16:

Proposed District Demographics: 90% white; 6% hispanic

Current District: Obama 53; McCain 45

Proposed District: Obama 47; McCain 52

Current District: Kerry 44; Bush 55

Proposed District: Kerry 39; Bush 61 (Estimate)

Incumbent(s): Manzullo, Schilling

Manzullo gets to keep 42% of his current constituents, but the new district also includes areas currently in IL-18 (34% of new district’s population), as well as smaller parts of IL-8, IL-11, IL-14, IL-15 and IL-17.  This could turn into a 2-way matchup between Manzullo and Schock (with Schilling living in the new district, but representing very little of it.)

District 17:

Proposed District Demographics: 77% white; 11% black; 8% hispanic

Current District: Obama 56; McCain 42

Proposed District: Obama 59; McCain 39

Current District: Kerry 51; Bush 48

Proposed District: Kerry 52; Bush 47 (Estimate)

Incumbent(s): Schock (but district not designed for him)

The new IL-17 runs from Rockford to Peoria.  It is formed out of parts of the current IL-17 (39% of new district); IL-16 (36%); IL-18 (23%); and IL-14 (2%).  The lines are intentionally scrambled to mess up the chances of any particular GOP congressman from running here: Schilling represents IL-17 today, but doesn’t live in the revamped version, while Schock lives here under the new lines but would represents only 23% of the new district’s population.  The overall Democratic numbers also go up several points.  All this is done to better Democratic chances in taking back IL-17 in 2012.

District 18:

Proposed District Demographics: 91% white; 5% black

Current District: Obama 48; McCain 50

Proposed District: Obama 48; McCain 51

Current District: Kerry 42; Bush 58

Proposed District: Kerry 42; Bush 58 (Estimate)

Incumbent(s): Shimkus

This new district is yet another one that really messes with the Illinois GOP.  It will ultimately elect a Republican, but it’s anyone’s guess as to which one will it be.  The district encompasses almost equal thirds of the current IL-17 (Schilling) – 33%; IL-18 (Schock) – 33%; and IL-19 (Shimkus) – 32% of the new district’s population (2% comes out of IL-15).   So, we could possibly see a GOP primary here with three incumbents.

PS. I’m working on diaries for Arkansas, West Virginia and one predicting what the commission may do in California; should post later this week.

Sources for data:

http://www.chicagoelections.co…

http://www.cookcountyclerk.com…

http://dupageelections.com/pag…

http://results.enr.clarityelec…

http://results.enr.clarityelec…

http://www.kanecountyelections…

http://www.co.mchenry.il.us/de…

http://www.voterockford.com/

http://elections.winnebagocoun…

http://www.ci.peoria.il.us/res…

http://www.co.peoria.il.us/dis…

http://www.becvote.org/pastres…

http://www.mcleancountyil.gov/…

http://www.champaigncountycler…

http://www.co.stephenson.il.us…

http://www.co.sangamon.il.us/e…

https://spreadsheets.google.co…

Maryland: Effective 8-0 Plan

I have yet once again redone my Maryland map.  I’m using the “original” version of Dave’s Application here as I did the map a while back but just haven’t had the chance to do the write-up.

Bottom line: there’s no reason not to do an 8-0 map, knowing that the GOP will do something similar in a number of states.  Democrats still have the trifecta in Maryland (we actually picked up a few seats in the state Senate here in November, btw !)

I had several goals in mind for this map:

– VRA: Both African-American-majority districts must have black population that is at least 1.5 times the size of the white population in those districts (to ensure representation).  The map does really well in this respect.  The black population in both MD-4 and MD-7 goes down from 57% and 59%, respectively, under the existing 2002 map — to 51% and 57%, respectively, under the proposed map here.  HOWEVER, because of the way the districts are reconfigured (expanding to include a lot more GOP-leaning territory in the northern part of the state) the proportion of African-Americans as a percentage of the Democratic primary vote in both districts goes up from approximately 70% now to approximately 80% under the proposed plan.

– Incumbency: Keep at least 50% of each Democratic incumbent’s current territory (population-wise) in the new district.  The percentages that each district gets to keep are below:

MD-1 – 66%

MD-2 – 70%

MD-3 – 62%

MD-4 – 53%

MD-5 – 74%

MD-6 – 49%

MD-7 – 55%

MD-8 – 78%

As you can see, it looks pretty good.  Other than the two minority-majority districts, each Democratic incumbent would get to keep at least 62% of their constituents.  This is important in any realistic redistricting plan for Maryland.  Although their districts get to keep only 53% and 55% of their existing constituents, Donna Edwards and Elijah Cummings should still be quite happy with their new districts for the reason discussed under “VRA” above.  In the case of MD-7 it should be noted that many areas in the eastern part of Baltimore City which were previously part of the district (prior to 2002) are now “returned” back to the district. So, while Cummings does not currently represent those constituents, the areas would likely be quite receptive to having him as a representative.  (I should also note that Steny Hoyer’s new district also contains territory which he has represented prior to 2002 — accounting for another 6% of the population —  so, in effect, the proposed MD-5 here includes 80% of territory Hoyer is currently representing or has represented in the past).

– Keep different parts/regions of the state “intact”.  This includes keeping the Eastern Shore whole in one district (same goes for Southern Maryland), keeping MD-2, MD-3 and MD-7 in the Baltimore orbit, while keeping MD-4, MD-5 and MD-8 in the Washington, DC orbit.  Likewise, I wanted to keep more communities intact.  Under the map here, the only incorporated cities that are split are Baltimore City (for obvious reasons), Mount Airy (because it is already split between two counties), and Hyattsville (although now it would only be split between two districts and not three like under the existing map).

Also, wanted to minimize county fragments and ensure that each district “corresponds” to a region or county.  Listed below is the largest jurisdiction (percentage of  district’s population) that each district is comprised of (you can look up the whole break-down under each district further down):

MD-1 – 62% Eastern Shore

MD-2 – 62% Baltimore County

MD-3 – 64% Anne Arundel and Howard Counties

MD-4 – 68% Prince George’s County

MD-5 – 76% Southern Maryland and Prince George’s Co.

MD-6 – 55% Montgomery County

MD-7 – 59% Baltimore City

MD-8 – 78% Montgomery County

As you can see, Montgomery Co. (the state’s largest) would form the majority of two Congressional districts under this plan.

– Partisanship (last, but not least !): Each new district must ensure that a Democrat is elected.  The percentages are discussed below the maps:

Photobucket

Photobucket

Photobucket

Photobucket

Photobucket

District 1:

Current District:  Obama 40; McCain 58

Proposed District:  Obama 56; McCain 43

Proposed District Demographics: 68% white; 25% black

Population: Eastern Shore 62%, Prince George’s Co. 20%, Anne Arundel Co. 18%

The 56% Obama percentage here would more than ensure that Frank Kratovil could make a comeback in 2012.

District 2:  

Current District:  Obama 60; McCain 38

Proposed District:  Obama 59; McCain 39

Proposed District Demographics: 66% white; 25% black

Population: Baltimore Co. 62%, Baltimore City 22%, Harford Co. 17%

District 3:  

Current District:  Obama 59; McCain 39

Proposed District:  Obama 59; McCain 39

Proposed District Demographics: 68% white; 19% black

Population: Howard Co. 33%, Anne Arundel Co. 31%, Baltimore Co. 26%, Baltimore City 10%

District 4:

Current District:  Obama 85; McCain 14

Proposed District:  Obama 72; McCain 27

Proposed District Demographics: 51% black; 33% white; 12% Hispanic

Population: Prince George’s Co. 68%, Carroll Co. 24%, Howard Co. 6%, Montgomery Co. 2%

District 5:

Current District:  Obama 65; McCain 33

Proposed District:  Obama 60; McCain 39

Proposed District Demographics: 59% white; 29% black

Population: Southern Maryland 47%, Prince George’s Co. 29%, Anne Arundel Co. 24%

District 6:

Current District:  Obama 40; McCain 58

Proposed District:  Obama 59; McCain 40

Proposed District Demographics: 66% white, 14% black, 10% Hispanic

Population: Montgomery Co. 55%, Frederick Co. 29%, Washington Co. 16%

District 7:  

Current District:  Obama 79; McCain 20

Proposed District:  Obama 69; McCain 30

Proposed District Demographics: 57% black; 38% white

Population: Baltimore City 59%, Baltimore Co. 24%, Harford Co. 17%

District 8:  

Current District:  Obama 74; McCain 25

Proposed District:  Obama 65; McCain 34

Proposed District Demographics: 63% white; 13% hispanic; 11% black; 11% asian

Population: Montgomery Co. 78%, Western Maryland 19%, Frederick Co. 3%

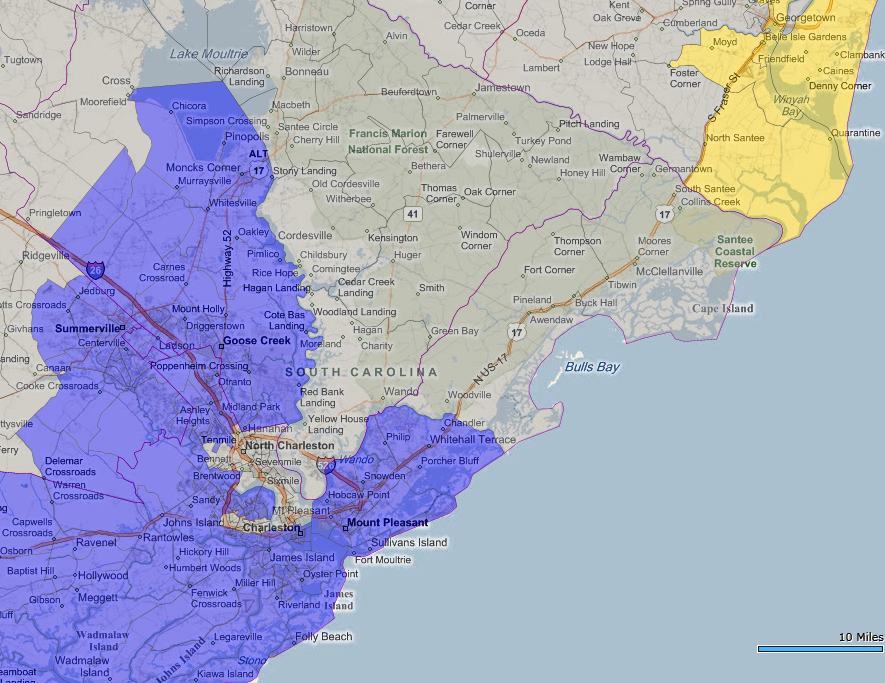
South Carolina: Two Compact African-American Districts

After the recent election, Democrats will now hold only one out of six seats in South Carolina — the black-majority SC-6.  With the upcoming reapportionment, the state is slated to add one seat.  I believe that under the Voting Rights Act, the Department of Justice should push hard to make sure that the new South Carolina seat is a black-majority district — as long as the new seat is drawn to be compact.  Frankly, in the case of South Carolina and several other states in the “Deep South”, I think the only way to have another Democratic representative there is to draw another black-majority seat.

Photobucket

Source: http://www.nola.com/news/index…

Over a year ago, I drew a plan for Louisiana where an additional compact black-majority seat is added (even as the state is set to lose one of its seats):

link is here — http://www.swingstateproject.c…

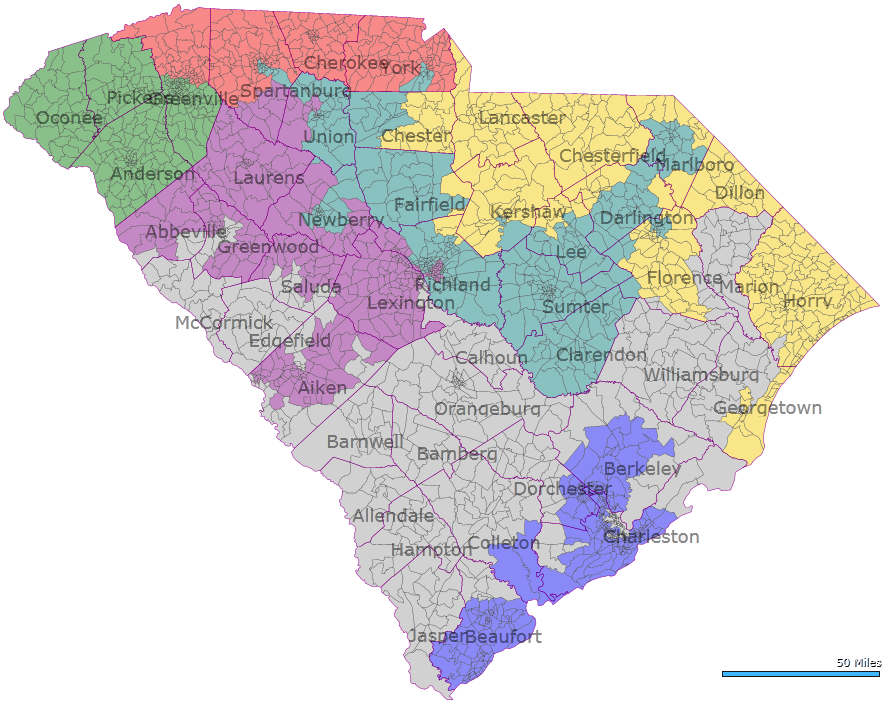
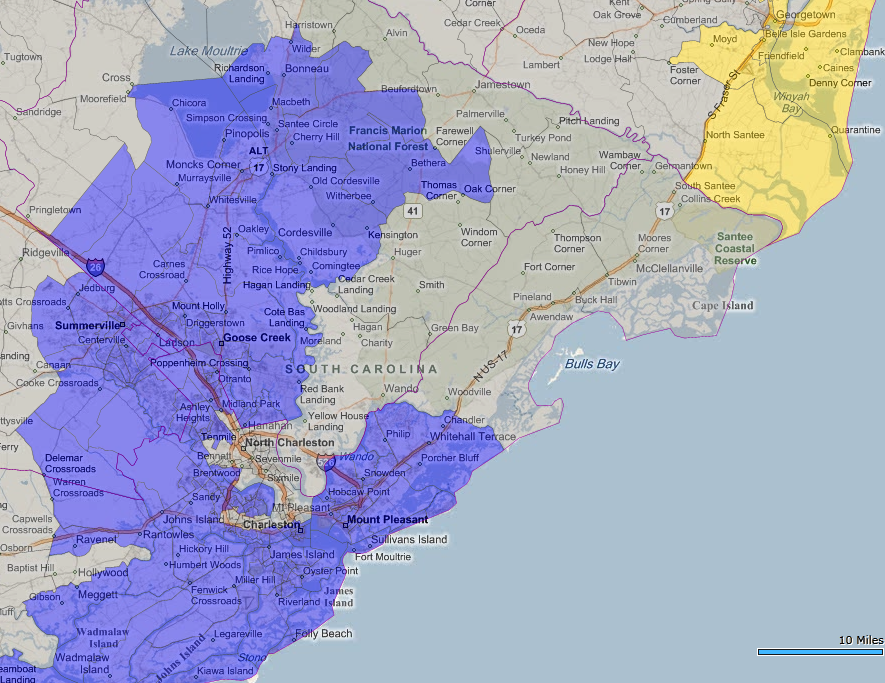
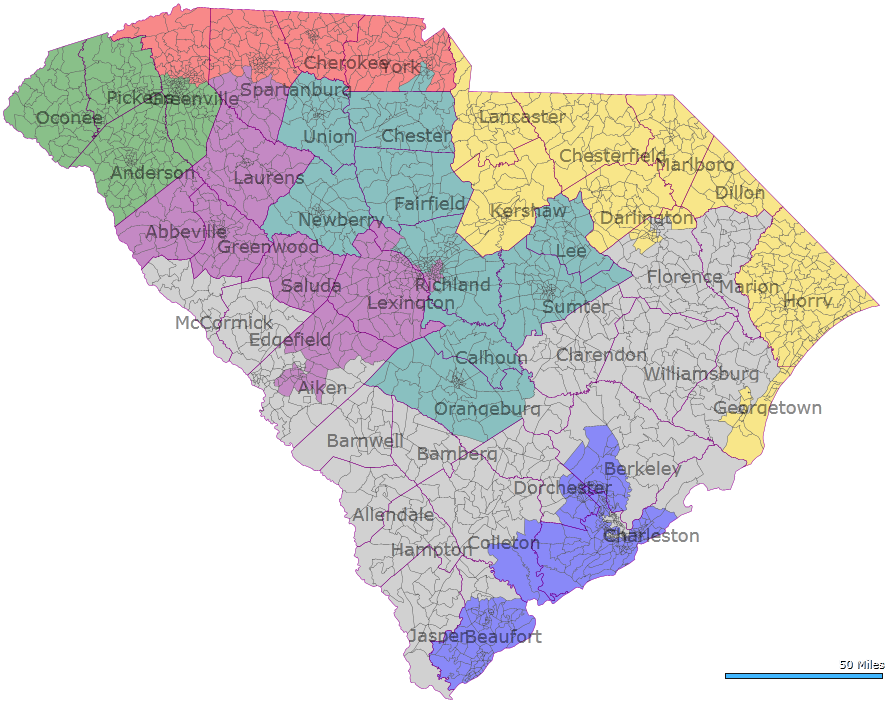
Fortunately, it appears that it would be quite easy to draw an additional seat in South Carolina that is also compact.  In this diary I have drawn two versions of a map: the first produces two seats that are both at least 55% black, while the second version has two seats that are at least 51% black.  I think that both would pass under VRA and DOJ requirements.  Version 1 is a little more creative, but certainly no more so than existing districts like FL-3 or NC-12.  Version 2 is more strict in criteria like following county lines and would easily pass muster.  Dave’s Application does not appear to have partisan breakdowns for South Carolina, but my “guestimates” for the two new black districts are approximately 62-63% Obama under Version 1, and 58-59% Obama under Version 2.

VERSION 1:

Photobucket

Photobucket

District 1: Blue — 73% white; 18% black

District 2: Violet — 77% white; 17% black

District 3: Green — 76% white; 17% black

District 4: Red — 79% white; 13% black

District 5: Yellow — 73% white; 21% black

District 6: Gray — 55% black; 40% white

District 7: Teal — 56% black; 38% white

VERSION 2:

Photobucket

Photobucket

District 1: Blue — 72% white; 19% black

District 2: Violet — 75% white; 19% black

District 3: Green — 76% white; 17% black

District 4: Red — 76% white; 16% black

District 5: Yellow — 70% white; 24% black

District 6: Gray — 51% black; 44% white

District 7: Teal — 51% black; 43% white

Obama’s Approval by State

There is nothing original about this short diary.  I just wanted to make you aware of an interesting Gallup survey from yesterday that measures President Obama’s approval in all 50 states:

Here’s the link:  http://www.gallup.com/poll/141…

You should go to “page 2” in the survey for a chart showing approval/disapproval by state. Also, here’s a map from the survey above:

Photobucket

The Gallup labeling appears slightly misleading to me because, while in all the states marked as “below average” Obama does have a net negative approval, in all the states marked as “above average” AS WELL AS in all the states marked as “average” his approval is a net positive.

The only “unpleasant surprises” to me are New Hampshire and Missouri.  On the other hand, there are a number of pleasant surprises, including Ohio, Colorado, South Dakota, Virginia, North Carolina, Florida, Georgia, Mississippi and Texas.  The map almost looks like a very plausible near-future electoral college configuration to me, with the lightest green states going GOP, and the medium green and dark green ones going Democratic — maybe plausible in 2016 or 2020, that is !

California Redistricting: 48 Democrats in Compact Districts

In a previous diary, I said that I was not going to post this plan for California because I thought it’s a “dummymander” in terms of Democratic prospects … I still think that (at least when compared to the previous map I drew for the state) … However, when I looked at the plan again, it appears to guarantee no less a number of Democrats than the current (2002) plan.  So, while the plan here may be a “dummymander”, it is not a bigger “dummymander” than the existing plan.  In other words, if this plan were adopted, Democrats would still be assured of having at least as many seats in California as we have today — BUT with the added possibility (and in many cases, a probability) of an extra 14 Democratic seats.  So, I will post the map I drew after all.

This is my second attempt at California since the partisan data by precinct became available in Dave’s Application.  My first attempt is here ….

http://www.swingstateproject.c…

I decided to do the new map to see just how many Democratic districts you can create using a lower Democratic “threshold” — in this plan, I wanted each Democratic district to be at least 55% Obama (maximum 44% McCain), as opposed to the 62% Obama (maximum 37% McCain) I used in my first map.  Under the “55% plan” you can create 48 Democratic districts for California (as opposed to 43 Democratic districts under the “62% plan”.)

I still strongly believe that having the 62% Obama minimum is a better plan for California, as the “55% plan” might lead to the partial “dummymander” (a good number of the 55-57% Obama districts here would have voted for Bush in 2004, whereas every single one of the 43 Democratic districts created under the “62% plan” would have voted for John Kerry).  Nevertheless, the “55% plan” results in generally more compact districts, and of course, 5 more possible Democrats than the “62% plan”.  Also, even under the “55% plan” a total of 34 districts are at least 58% Obama, which is better than the current (2002) plan that has only 33 districts that are at least 58% Obama.  So, in that sense, in a worst-case scenario, we would still have 34 districts pretty much as solid Democratic ones, even if the other 14 districts that are 55%-57% Obama somehow went GOP (actually, there’s one 54% Obama – 44% McCain district that I left as such because that’s the max. Democratic percentage you could do in that area without messing with county lines / compactness; only two districts are 55% Obama, while the remainder are all at least 56% Obama).

The 5 GOP districts that remain under this plan all went 58% – 62% McCain: they are CA-2 (Wally Herger); CA-21 (Devin Nunes); CA-41 (Jerry Lewis); CA-42 (Gary Miller); and CA-52 (Duncan Hunter).

The plan produces more compact districts, in terms of keeping counties and communities intact.  It has only 112 “county-fragments” (please see my first attempt above for the lengthy explanation if you’re not sure what those are), as opposed to the current (2002) plan that has a total of 120 “county-fragments”.  (The 112 includes one tiny sliver of Santa Clara Co. that has only 130 persons but is needed to connect the Alameda and Stanislaus parts of CA-11.)  The 1992 plan that was a non-partisan commission-drawn plan based largely on geographic compactness also had only 112 fragments, and this was when California only had 52 districts, so the plan here with 53 districts is technically more geographically compact — in terms of keeping counties and communities intact — than the non-partisan commission-based plan of the 1990’s (of course, my goal is still to produce as many Democratic seats as possible, which was not the goal of the 1992 plan !).  

The “55% plan” also creates a total of 15 Hispanic majority districts and 4 Hispanic plurality districts (there are currently only eight Hispanic representatives from California), three Asian-plurality districts, one African-American-plurality district (currently there are none in California), and 13 additional seats that are minority-majority (with no particular racial / ethnic minority dominant) … so a grand total of 36 minority-majority districts for the state (68% of the 53 districts).  The population deviation per district is +/- 2,000 persons.  Demographic info. is shown only as far as the majority or plurality racial/ethnic group.

Under this new plan the districts of most Democratic incumbents remain very safe Democratic seats.  McNerney’s district becomes safer (goes from 54% Obama to 60% Obama).  The only exceptions are Blue Dogs Cardoza and Costa, whose districts go from 59% and 60% Obama, respectively to 54% and 55% Obama; but the Blue Dogs should be able to handle this.  Matsui, Baca and Loretta Sanchez also get districts that are only 56% Obama/42% McCain – but I think they should be able to handle those also with good campaigns.  Last, but not least, Howard Berman also gets a 56% Obama/42% McCain district that now includes a good part of the current CA-22 (Kevin McCarthy); a match-up between the two would likely produce a race with a massive infusion of money.  On the bright side for Berman, the district I create for him is not Hispanic-majority, and perhaps he would see a Hispanic Democratic primary challenge against him as a bigger threat that a potential match-up with a high-profile Republican ?  The trade-off to all this is ofcourse that many new Democratic districts are created out of current GOP districts – several of the new districts are ones where a Democrat is virtually assured of winning: for example, Gallegly (CA-24) and Dreier (CA-26) both become 61% Obama districts, while Calvert (CA-44) becomes 62% Obama.

Anyhow, here’s my “55% Obama plan”:

Photobucket

Photobucket

Photobucket

District 1:

Incumbent: Mike Thompson (D)

Current District:  Obama 66; McCain 32

Proposed District:  Obama 62; McCain 35

Demographics, estimated 2006-2008: 68% white

Includes all of Napa, Lake, Glenn and Butte Counties, and part of Sonoma Co. – Santa Rosa, Sonoma, Rohnert Park

District 2:  

Incumbent: Wally Herger (R)

Current District:  Obama 43; McCain 55

Proposed District:  Obama 40; McCain 58

Demographics, estimated 2006-2008: 76% white

Includes all of Modoc, Shasta, Tehama, Lassen, Plumas, Sierra and Yuba Counties, and western part of Placer Co.

District 3:  

Incumbent: Dan Lungren (R)

Current District:  Obama 49; McCain 49

Proposed District:  Obama 56; McCain 42

Demographics, estimated 2006-2008: 54% white

Includes all of Colusa, Yolo and Sutter Counties, and part of Sacramento Co. including part of City of Sacramento

District 4:  

Incumbent: Tom McClintock (R)

Current District:  Obama 44; McCain 54

Proposed District:  Obama 56; McCain 42

Demographics, estimated 2006-2008: 59% white

Includes all of Nevada, El Dorado, Amador, Alpine and Mono Counties, eastern part of Placer Co. and part of Sacramento Co. including part of City of Sacramento

District 5:  

Incumbent: Doris Matsui (D)

Current District:  Obama 70; McCain 28

Proposed District:  Obama 56; McCain 42

Demographics, estimated 2006-2008: 58% white

Includes part of Sacramento Co. – including Folsom, Citrus Heights and part of the city of Sacramento

District 6:

Incumbent: Lynn Woolsey (D)

Current District:  Obama 76; McCain 22

Proposed District:  Obama 70; McCain 28

Demographics, estimated 2006-2008: 75% white

Includes all of Del Norte, Siskiyou, Humboldt, Trinity and Mendocino Counties, and most of Sonoma and Marin Counties

District 7:  

Incumbent: George Miller (D)

Current District:  Obama 72; McCain 27

Proposed District:  Obama 68; McCain 31

Demographics, estimated 2006-2008: 41% white

Includes all of Solano Co. and northern part of Contra Costa Co.

District 8:  

Incumbent: Nancy Pelosi (D)

Current District:  Obama 85; McCain 12

Proposed District:  Obama 85; McCain 13

Demographics, estimated 2006-2008: 45% white

Includes most of San Francisco

District 9:  

Incumbent: Barbara Lee (D)

Current District:  Obama 88; McCain 10

Proposed District:  Obama 80; McCain 18

Demographics, estimated 2006-2008: 39% white

Includes part of Alameda Co. – Berkeley, Dublin, Livermore and most of Oakland, and part of Contra Costa Co. – Moraga, Orinda, San Ramon

District 10:

Incumbent: John Garamendi (D)

Current District:  Obama 65; McCain 33

Proposed District:  Obama 69; McCain 30

Demographics, estimated 2006-2008: 55% white

Includes central part of Contra Costa Co. and San Rafael in Marin Co.

District 11:  

Incumbent: Jerry McNerney (D)

Current District:  Obama 54; McCain 44

Proposed District:  Obama 60; McCain 39

Demographics, estimated 2006-2008: 54% white

Includes part of Alameda Co. – Pleasanton and part of Oakland, almost all of Stanislaus Co. and sliver of Santa Clara Co.

District 12:  

Incumbent: Jackie Speier (D)

Current District:  Obama 74; McCain 24

Proposed District:  Obama 74; McCain 24

Demographics, estimated 2006-2008: 47% white

Includes part of San Francisco and most of San Mateo Co.

District 13:

Incumbent: Pete Stark (D)

Current District:  Obama 74; McCain 24

Proposed District:  Obama 75; McCain 23

Demographics, estimated 2006-2008: 33% asian

Includes part of Alameda Co. – Fremont, Newark, Union City, Hayward, San Leandro, Alameda, and part of Oakland

District 14:  

Incumbent: Anna Eshoo (D)

Current District:  Obama 73; McCain 25

Proposed District:  Obama 71; McCain 28

Demographics, estimated 2006-2008: 42% hispanic

Includes part of San Mateo Co. – Menlo Park, Atherton, East Palo Alto, Portola Valley and part of Redwood City, part of Santa Clara Co. – Palo Alto, Mountain View, Los Altos, Los Altos Hills and part of San Jose, and most of Merced Co.

District 15:  

Incumbent: Mike Honda (D)

Current District:  Obama 68; McCain 30

Proposed District:  Obama 68; McCain 30

Demographics, estimated 2006-2008: 42% asian

Includes part of Santa Clara Co. – Milpitas, Santa Clara, Sunnyvale, Cupertino, Saratoga and part of San Jose

District 16:  

Incumbent: Zoe Lofgren (D)

Current District:  Obama 70; McCain 29

Proposed District:  Obama 68; McCain 31

Demographics, estimated 2006-2008: 39% white

Includes part of Santa Clara Co. – Campbell, Los Gatos, Morgan Hill, Gilroy and part of San Jose

Photobucket

Photobucket

District 17:

Incumbent: Sam Farr (D)

Current District:  Obama 72; McCain 26

Proposed District:  Obama 65; McCain 33

Demographics, estimated 2006-2008: 65% white

Includes all of Santa Cruz Co. and San Luis Obispo Co., and coastal areas of Monterey Co.

District 18:  

Incumbent: Dennis Cardoza (D)

Current District:  Obama 59; McCain 39

Proposed District:  Obama 54; McCain 44

Demographics, estimated 2006-2008: 47% Hispanic

Includes all of Calaveras, Tuolumne, Mariposa and Madera Counties, and most of cities of Fresno and Merced

District 19:  

Incumbent: George Radanovich (R) (retiring)*

Current District:  Obama 46; McCain 52

Proposed District:  Obama 56; McCain 42

Demographics, estimated 2006-2008: 61% hispanic

Includes all of San Benito Co., inland part of Monterey Co. (including Salinas area), and western part of Fresno Co.

* District is completely “relocated” to another part of the Central Valley

District 20:

Incumbent: Jim Costa (D)

Current District:  Obama 60; McCain 39

Proposed District:  Obama 55; McCain 43

Demographics, estimated 2006-2008: 55% hispanic

Includes all of Kings Co., western part of Kern Co. including part of Bakersfield, and part of Los Angeles Co. (Lancaster, Palmdale)

District 21:  

Incumbent: Devin Nunes (R)

Current District:  Obama 38; McCain 60

Proposed District:  Obama 36; McCain 62

Demographics, estimated 2006-2008: 50% white

Includes all of Tulare Co., eastern part of Fresno Co., and part of Kern Co.

District 22:  

Incumbent: Kevin McCarthy (R)*

Current District:  Obama 42; McCain 56

Proposed District:  Obama 55; McCain 44

Demographics, estimated 2006-2008: 39% white

Includes all of San Joaquin Co. and Riverbank in Stanislaus Co.

* District is completely “relocated” to another part of the Central Valley.

District 23:  

Incumbent: Lois Capps (D)

Current District:  Obama 66; McCain 32

Proposed District:  Obama 61; McCain 38

Demographics, estimated 2006-2008: 50% white

Includes all of Santa Barbara Co. and northern part of Ventura Co.

Photobucket

Photobucket

Photobucket

Photobucket

Photobucket

District 24:  

Incumbent: Elton Gallegly (R)

Current District:  Obama 51; McCain 48

Proposed District:  Obama 61; McCain 38

Demographics, estimated 2006-2008: 56% white

Includes southern part of Ventura Co., and part of Los Angeles Co. – Malibu, Santa Monica, Venice part of Los Angeles

District 25:  

Incumbent: Howard McKeon (R)

Current District:  Obama 49; McCain 48

Proposed District:  Obama 57; McCain 41

Demographics, estimated 2006-2008: 50%+ hispanic

Includes all of Inyo Co., and part of San Bernardino Co. – Ontario, Fontana, Adelanto, Victorville, Hesperia and Barstow

District 26:  

Incumbent: David Dreier (R)

Current District:  Obama 51; McCain 47

Proposed District:  Obama 61; McCain 37

Demographics, estimated 2006-2008: 56% hispanic

Includes part of Los Angeles Co., including El Monte, La Puente, Irwindale, Baldwin Park, Covina, Azusa, Glendora, San Dimas, LaVerne and Claremont

District 27:  

Incumbents: Brad Sherman (D)

Current District:  Obama 66; McCain 32

Proposed District:  Obama 60; McCain 38

Demographics, estimated 2006-2008: 43% white

Includes part of Los Angeles Co. – including part of San Fernando Valley and northern part of the county

District 28:  

Incumbent: Howard Berman (D)

Current District:  Obama 76; McCain 22

Proposed District:  Obama 56; McCain 42

Demographics, estimated 2006-2008: 48% hispanic

Includes eastern part of Kern Co. (including part of Bakersfield), and part of Los Angeles Co. (including part of San Fernando Valley)

District 29:  

Incumbent: Adam Schiff (D)

Current District:  Obama 68; McCain 30

Proposed District:  Obama 70; McCain 28

Demographics, estimated 2006-2008: 45% white

Includes part of Los Angeles Co. – Burbank, Pasadena, and part of City of Los Angeles

District 30:  

Incumbent: Henry Waxman (D)

Current District:  Obama 70; McCain 28

Proposed District:  Obama 63; McCain 36

Demographics, estimated 2006-2008: 69% white

Includes part of Los Angeles Co. – Beverly Hills, West Hollywood, Calabassas, Hidden Hills, Agoura Hills, Westlake Village, part of City of Los Angeles, and most of Santa Clarita

District 31:  

Incumbent: Xavier Beccera (D)

Current District:  Obama 80; McCain 18

Proposed District:  Obama 81; McCain 17

Demographics, estimated 2006-2008: 71% hispanic

Includes part of City of Los Angeles, Huntington Park, Cudahy and Maywood

District 32:  

Incumbent: Judy Chu (D)

Current District:  Obama 68; McCain 30

Proposed District:  Obama 60; McCain 38

Demographics, estimated 2006-2008: 44% asian

Includes part of Los Angeles Co. –  Monterey Park, Alhambra, South Pasadena, San Marino, Temple City, San Gabriel, Rosemead, Arcadia, Walnut, Diamond Bar, La Habra Heights

District 33:  

Incumbent: Diane Watson (D) (retiring)

Current District:  Obama 87; McCain 12

Proposed District:  Obama 82; McCain 16

Demographics, estimated 2006-2008: 59% hispanic

Includes part of Los Angeles Co. – Lawndale, Culver City, and parts of City of Los Angeles, Inglewood and Hawthorne

District 34:  

Incumbent: Lucille Roybal-Allard (D)

Current District:  Obama 75; McCain 23

Proposed District:  Obama 70; McCain 28

Demographics, estimated 2006-2008: 59% hispanic

Includes part of Los Angeles Co. –  Downey, Bellflower, Bell Gardens, Commerce, Vernon, Glendale and part of City of Los Angeles

District 35:  

Incumbent: Maxine Waters (D)

Current District:  Obama 84; McCain 14

Proposed District:  Obama 81; McCain 17

Demographics, estimated 2006-2008: 38% black

Includes part of Los Angeles Co. –  Palos Verdes peninsula, Santa Catalina Island/Avalon, and parts of Carson, Inglewood, Hawthorne and City of Los Angeles

District 36:  

Incumbent: Jane Harman (D)

Current District:  Obama 64; McCain 34

Proposed District:  Obama 65; McCain 33

Demographics, estimated 2006-2008: 53% white

Includes part of Los Angeles Co. – Torrance, Gardena, Lomita, Redondo Beach, Manhattan Beach, Hermosa Beach, El Segundo, and part of City of Los Angeles

District 37:  

Incumbent: Laura Richardson (D)

Current District:  Obama 80; McCain 19

Proposed District:  Obama 61; McCain 37

Demographics, estimated 2006-2008: 37% hispanic

Includes part of Los Angeles Co. –  most of Long Beach, and part of Orange Co. – Westminster, Cypress, La Palma

District 38:  

Incumbent: Grace Napolitano (D)

Current District:  Obama 71; McCain 27

Proposed District:  Obama 68; McCain 29

Demographics, estimated 2006-2008: 77% hispanic

Includes part of Los Angeles Co. –  Norwalk, Whittier, La Mirada, Santa Fe Springs, Montebello, Pico Rivera, East LA, and part of City of Los Angeles

District 39:  

Incumbent: Linda Sánchez (D)

Current District:  Obama 65; McCain 32

Proposed District:  Obama 62; McCain 36

Demographics, estimated 2006-2008: 54% hispanic

Includes part of Los Angeles Co. –  Lakewood, Cerritos, Paramount, Lynwood and South Gate, and part of Orange Co. – Buena Park, La Habra and parts of Fullerton and Anaheim

District 40:  

Incumbent: Ed Royce (R)*

Current District:  Obama 47; McCain 51

Proposed District:  Obama 56; McCain 42

Demographics, estimated 2006-2008: 50%+ hispanic

Includes part of San Bernardino Co. – Chino, Chino Hills, Montclair, Upland, Rancho Cucamonga, and part of Los Angeles Co. – Pomona, La Puente

* District is completely “relocated” from Orange County to part of San Bernardino and Los Angeles Counties

Photobucket

Photobucket

District 41:  

Incumbent: Jerry Lewis (R)

Current District:  Obama 44; McCain 54

Proposed District:  Obama 39; McCain 59

Demographics, estimated 2006-2008: 62% white

Includes central and eastern parts of San Bernardino Co. (Apple Valley, Yucca Valley, Twentynine Palms, Needles) and part of Riverside Co. (Calimesa, Norco, Murrieta, Temecula, Canyon Lake)

District 42:  

Incumbent: Gary Miller (R)

Current District:  Obama 45; McCain 53

Proposed District:  Obama 40; McCain 58

Demographics, estimated 2006-2008: 69% white

Includes part of Orange Co. – San Juan Capistrano, Mission Viejo, Rancho Santa Margarita, Lake Forest, Vila Park, Yorba Linda, Brea, and parts of San Clemente, Fullerton, Anaheim and Orange

District 43:  

Incumbent: Joe Baca (D)

Current District:  Obama 68; McCain 30

Proposed District:  Obama 56; McCain 42

Demographics, estimated 2006-2008: 51% hispanic

Includes part of San Bernardino Co. – City of San Bernardino, Colton, Rialto, Highland, Loma Linda, Redlands, Big Bear Lake and part of Yucaipa

District 44:  

Incumbent: Ken Calvert (R)

Current District:  Obama 50; McCain 49

Proposed District:  Obama 62; McCain 36

Demographics, estimated 2006-2008: 51% hispanic

Includes part of Riverside Co. – City of Riverside, Moreno Valley and part of Corona

District 45:  

Incumbent: Mary Bono (R)

Current District:  Obama 52; McCain 47

Proposed District:  Obama 58; McCain 41

Demographics, estimated 2006-2008: 54% hispanic

Includes part of Riverside Co. – Perris, Lake Elsinore, Palm Springs, Desert Hot Springs, Cathedral City, Indio, Coachella, Blythe, Banning, Beaumont and San Jacinto

District 46:  

Incumbent: Dana Rohrabacher (R)

Current District:  Obama 48; McCain 50

Proposed District:  Obama 57; McCain 41

Demographics, estimated 2006-2008: 42% white

Includes part of Los Angeles Co. –  Compton and parts of Carson and City of Los Angeles, and part of Orange Co. – Seal Beach, Huntington Beach, Fountain Valley and Newport Beach

District 47:  

Incumbent: Loretta Sanchez (D)

Current District:  Obama 60; McCain 38

Proposed District:  Obama 56; McCain 42

Demographics, estimated 2006-2008: 59% hispanic

Includes part of Orange Co. – parts of Santa Ana, Orange, Tustin, Garden Grove, Stanton and Anaheim

District 48:  

Incumbent: John Campbell (R)

Current District:  Obama 49; McCain 49

Proposed District:  Obama 56; McCain 42

Demographics, estimated 2006-2008: 47% white

Includes part of Orange Co. – Irvine, Costa Mesa, Laguna Beach, Laguna Niguel, Laguna Hills, Laguna Woods, Aliso Viejo, Dana Point, and parts of Santa Ana and San Clemente

District 49:

Incumbent: Darrell Issa (R)

Current District:  Obama 45; McCain 53

Proposed District:  Obama 58; McCain 40

Demographics, estimated 2006-2008: 61% white

Includes part of San Diego County – Camp Pendleton, Oceanside, Vista, Carlsbad, Encinitas, Solana Beach, Del Mar and part of San Diego (La Jolla, Mission Beach, Ocean Beach, UCSD area, Hillcrest)

District 50:  

Incumbent: Brian Bilbray (R)

Current District:  Obama 51; McCain 47

Proposed District:  Obama 58; McCain 40

Demographics, estimated 2006-2008: 43% white

Includes part of San Diego County – San Marcos, Escondido, and part of City of San Diego

District 51:  

Incumbent: Bob Filner (D)

Current District:  Obama 63; McCain 35

Proposed District:  Obama 59; McCain 40

Demographics, estimated 2006-2008: 56% hispanic

Includes all of Imperial Co., and part of San Diego County – southern part of San Diego, Chula Vista, Imperial Beach, El Cajon

District 52:  

Incumbent: Duncan Hunter (R)

Current District:  Obama 45; McCain 53

Proposed District:  Obama 37; McCain 61

Demographics, estimated 2006-2008: 74% white

Includes part of San Diego County – Poway, Santee, and part of Riverside Co. – Hemet, Indian Wells, Palm Desert

District 53:  

Incumbent: Susan Davis (D)

Current District:  Obama 68; McCain 30

Proposed District:  Obama 59; McCain 40

Demographics, estimated 2006-2008: 51% white

Includes part of San Diego County – part of City of San Diego, Coronado, Lemon Grove, La Mesa

By what margin will Bob Shamansky win?

View Results

Loading ... Loading ...

Maryland: One More Map

OK … this is probably my last attempt at redrawing my home state of Maryland.   I feel that this is my best plan yet.  I create eight solid Democratic districts (58% or more Obama each) while making each district as compact as possible.

There’s just one problem — Steny Hoyer may not be happy (?).  However, the best way to get 8 Democrats out of Maryland AND to create very compact districts at the same time is to draw the map this way, where parts of the current MD-4 and MD-5 are combined.  The new MD-4 combines much of Prince George’s Co. with southern Maryland and is majority black.  It is drawn for Donna Edwards; African-Americans would comprise approximately 63% of the Democratic primary vote there (white voters about 32%).  Hoyer (who lives in St. Mary’s Co.) can move and run in the new MD-5 which includes much of northern PG Co. and northern and central Anne Arundel Co.  Northern PG was Hoyer’s home base in the past and, at one point or another in his career, Hoyer has represented about 43% of the new MD-5, so it would not be a stretch for him to run there.  The new MD-7 also remains majority black, and African-Americans would comprise approximately 60% of the Democratic primary there.   Other than Hoyer, the plan keeps the home of each incumbent in their district.  The population deviation ranges from 4 to 848 persons per district.

Maps:

Photobucket

Photobucket

Photobucket

Photobucket

Photobucket

District 1

60% Obama, 39% McCain (currently 40% Obama, 58% McCain)

61% white, 33% black

All of Eastern Shore; southern part of Anne Arundel Co.; central part of Prince George’s Co.

District 2

58% Obama, 40% McCain (currently 60% Obama, 38% McCain)

69% white, 22% black

All of Harford Co.; northern part of Baltimore Co.; northern and central parts of Baltimore City

District 3

58% Obama, 41% McCain (currently 59% Obama, 39% McCain)

63% white, 25% black

All of Howard Co. and Carroll Co.; western part of Baltimore Co.; one precinct in PG to maintain equal population of districts

District 4

75% Obama, 24% McCain (currently 85% Obama, 14% McCain)

50%+ black, 39% white

All of southern Maryland; southern and central parts of Prince George’s Co.

District 5

59% Obama, 40% McCain (currently 65% Obama, 33% McCain)

57% white, 24% black, 12% hispanic

Northern part of Prince George’s Co.; northern and central parts of Anne Arundel Co.; most of Takoma Park in Montgomery Co.

District 6

62% Obama, 36% McCain (currently 40% Obama, 58% McCain)

59% white, 15% black, 12% asian, 12% hispanic

Northern part of Montgomery Co.; northern and central parts of Frederick Co.

District 7

67% Obama, 31% McCain (currently 79% Obama, 20% McCain)

50%+ black, 44% white

Eastern part of Baltimore Co.; most of Baltimore City

District 8

61% Obama, 37% McCain (currently 74% Obama, 25% McCain)

69% white, 11% black; 10% hispanic

All of western Maryland; southern part of Frederick Co.; southern part of Montgomery Co.

(PS.  In my last diary, I indicated that I was working on a very compact plan for California in which as many Democratic districts as possible are created.  I did come up with a plan with 48 Democratic seats for the state (each district is at least 55% Obama) with very compact districts that adhere to county lines and actually have less county fragments than even the bipartisan, commission-drawn map of the 1990’s  However, I will not post my plan as I strongly believe that the resulting map is in effect a “dummymander”; 55% Obama districts are just not strong enough to assure Democratic representation in California.)  

Redrawing Maryland: Congressional and Legislative Districts

The following is my latest attempt to draw new district lines for Maryland.  Lately, I have thought about this and have tried to find a way to reconcile my desire for more Democrats with the idea that districts should nevertheless adhere to some form of geographic “coherence”.  The goal of this diary is therefore to create cleaner lines for both Congressional and Legislative Districts in Maryland, while at the same time, increasing the number of Democratic representatives.

I am also working on yet another plan for California, using the same goals as for Maryland above.  Due to work and family responsibilities, it may be a while though before it’s ready … so for now, here’s my home state Maryland:

Congressional Districts

I have previously worked with the idea of eight Democratic seats for Maryland:

http://www.swingstateproject.c…

and …  http://www.swingstateproject.c…

Although, you can indeed create plans for the state where each of the eight districts is at least 58-59% Obama (while preserving the two black-majority districts), the resulting maps seem just way too convoluted to me in retrospect …

In my new plan here, I create seven solid Democratic districts (60% or more Obama each) while trying to preserve relatively neat lines.  I tried to break up as few counties as possible, and, as you can see, the resulting lines certainly look cleaner than the current map.  Under the current map, there are 40 “county-fragments” in the Maryland congressional map (for example, Anne Arundel Co. has 4 “county-fragments”: parts of Districts 1, 2, 3 and 5), while under the proposed plan here that number declines to 36 “county-fragments.”  More importantly, the new districts overall look a lot less gerrymandered and a lot more compact than the current map.

I also tried to ensure that MD-7 is at least 55% black (not just 50%+) to ensure continued African-American representation.  MD-4, on the other hand, is made to be only 50%+ black; that district is much more diverse (only 23% white under the new lines, compared to 39% for the new MD-7), and more Democratic (85% Obama under the new lines, compared to 72% Obama for the new MD-7), so 50%+ black is really all that’s needed for MD-4.

For the two most “high-profile” Maryland Congressmen, Hoyer and Van Hollen, I drew the districts to be 65% Obama, while for Ruppersberger and Sarbanes, they will be 61% Obama (this is still higher than the current Obama percentages for both MD-2 and MD-3).  I also have a hunch that Hoyer may like his new district more than his current one; the new district is just as Democratic as the current one, but the black percentage goes down from 34% to 29% thereby lessening a serious Democratic primary challenge to Hoyer in the future.

I tried to ensure that at least 50% of each new district’s population is made up out of current constituents in that district.  Indeed, in 4 of the 8 districts (MD-2, MD-5, MD-6 and MD-8) at least 68% of the new population is the same as in the current district.  In MD-1 and MD-4, around 60% are transferred.  In MD-3, Sarbanes gets to keep 55% of his constituents. In MD-7 Cummings gets to keep a bit over 50% of his constituents, although this percentage does not include large swaths of the city that are African-American, but which are part of MD-2 under the current lines (all in all, the lines in Baltimore City looks very compact compared to the current plan).

The new MD-1 includes all of the Eastern Shore, but the Democratic percentage still shoots up to 60% Obama, with the addition of hyper-Democratic areas on the western shore.  MD-6 preserves the three Western Maryland Counties (though Bartlett’s home area in Frederick is no longer in the district), and becomes a 63% McCain district.

The plan preserves the hometowns of each of Maryland’s seven Democratic incumbents in their respective districts.  The population deviation for my map ranges from +/- 224 to 859 persons per district.

Photobucket

Photobucket

Photobucket

Photobucket

Photobucket

District 1

60% Obama, 38% McCain (currently 40% Obama, 58% McCain)

60% white, 33% black

All of Eastern Shore; southern part of Anne Arundel Co. including part of Annapolis; central and eastern parts of Prince George’s Co. including Upper Marlboro, Largo/Kettering, Mitchellville, Lanham/Seabrook, New Carrollton, Glenarden, Landover Hills and part of Bowie.

The Democratic percentage here surges under this remap.  At one moment, I looked at the new district and thought “Michael Steele”.  However, the district is 60% Obama, and as demonstrated by Davis v. Sparks in the recent Alabama Governor’s primary, African-Americans vote based on the issues and not race.  (Btw, Steele only managed to get 15-17% of the black vote in Maryland in 2006 — and not 25% as some exit polls indicated — and his “reputation” with black and Democratic voters has since then deteriorated; I honestly think he’d be lucky if he got 10% of the Maryland black vote these days.)  And besides, in a Kratovil vs. Steele matchup (if Kratovil survives 2010), Kratovil would still have the home-turf advantage of representing the Shore (59% of the district). So, bottom line, I’m not too worried about Steele.

District 2

61% Obama, 37% McCain (currently 60% Obama, 38% McCain)

64% white, 26% black

Parts of Baltimore City; part of Baltimore Co. including Cockeysville, Timonium/Lutherville, Carney, Rosedale, Dundalk, Essex, Middle River, Catonsville, Randallstown, Reisterstown, Owings Mills; southern part of Harford Co. including Edgewood, Joppatowne, Aberdeen and Havre de Grace.  

The new district is now confined to only three counties, as the Anne Arundel Co. part is taken out, and the lines look a lot cleaner.  Many black precincts in Baltimore City are taken out and attached to the new MD-7, but to compensate, progressive white areas (Charles Village, for ex.) in the city are added, as well as some very Democratic areas in the western part of Baltimore County — the end result is that the Democratic percentage actually goes up slightly.  69% of the new district’s residents are current Ruppersberger constituents.

District 3

61% Obama, 37% McCain (currently 59% Obama, 39% McCain)

65% white, 21% black, 7% asian, 5% hispanic

All of Howard Co.; part of Baltimore City.; part of Baltimore Co. including Towson, Pikesville, Woodlawn/Lochearn, Arbutus and Halethorpe; part of Anne Arundel Co. including Glen Burnie, Brooklyn Park, Linthicum, Severn, Fort Meade, Odenton and Crofton.  

The new district is a lot more compact than the current one, and the Democratic percentage goes up a few points.

District 4

85% Obama, 14% McCain (currently 85% Obama, 14% McCain)

50%+ black, 23% white, 17% hispanic, 8% asian

Parts of inner Prince George’s Co. including Fort Washington, Oxon Hill, Forest Heights, Temple Hills, District Heights, Forestville, Suitland, Seat Pleasant, Capitol Heights, Cheverly, Brentwood, Mount Rainier, Hyattsville/Chillum, Adelphi, Langley Park, parts of central and eastern Montgomery Co. (including the greater Silver Spring area, Derwood and Washington Grove).  

The lines are changed somewhat, but Donna Edwards still gets to keep 61% of her current constituents and the hyper-Democratic nature of the district does not change at all (this is my home district, btw !).

District 5

65% Obama, 34% McCain (currently 65% Obama, 33% McCain)

55% white, 29% black, 8% hispanic, 5% asian

All of Southern Maryland (Calvert, St. Mary’s and Charles Counties); parts of Prince George’s Co. including Bladensburg, Riverdale, University Park, College Park, Berwyn Heights, Greenbelt, Beltsville, Laurel and part of Bowie; part of northern Montgomery Co.  

Hoyer gets to keep 68% of his current constituents.  Like I already mentioned, Hoyer may like this district more than his current one because of the decreased likelihood of a Democratic primary challenge — the current MD-5 is 34% black while the new one is 29% black (blacks as a percentage of the Democratic primary vote probably approach 50% under the current lines).

District 6

35% Obama, 63% McCain (currently 40% Obama, 58% McCain)

90% white, 5% black

All of Western Maryland (Garrett, Allegany and Washington Counties); all of Carroll Co.; northern part of Baltimore Co.; central and northern parts of Harford Co. including Bel Air area; northernmost sliver of Frederick Co. around Emmitsburg.

District 7

72% Obama, 27% McCain (currently 79% Obama, 20% McCain)

55% black, 39% white

Most of Baltimore City, part of Anne Arundel Co. including Pasadena, Severna Park, Arnold, Millersville, Davidsonville and the Annapolis area.

The new MD-7 combines the most Democratic and African-American parts of Baltimore City with some of the most Republican parts of Anne Arundel County.  Blacks comprise 55% of the electorate here, but likely a much higher percentage (about 70-75%) of the Democratic primary electorate.

District 8

65% Obama, 34% McCain (currently 74% Obama, 25% McCain)

65% white, 12% hispanic, 11% asian, 10% black

Parts of central and southern Montgomery Co. including Rockville, Gaithersburg, Wheaton, Takoma Park, Chevy Chase, Kensington, Bethesda and Potomac; most of Frederick Co.  

Van Hollen gets to keep 69% of his current constituents.  The Democratic percentage declines from 74% Obama to 65% Obama, but Van Hollen or any other competent Democrat should win easily here.  If Connie Morella ran under these lines in 2002, she might have won, but a lot has changed over the last eight years in terms of political preferences and voting patterns in this area.

Legislative Districts

Now, on to the Legislative Districts map.

Each legislative district in Maryland elects one Senator and three Delegates.  In most districts, the three Delegates are elected at large from the whole district, while in some areas the districts are divided into sub-districts (generally in more sparsely populated areas of the state, or when a sub-district is created to provide a better opportunity for minority population representation).  The sub-districts can be of two types: 1) three one-Delegate sub-districts — like District 1 in the plan below, or 2.) one two-Delegate sub-district combined with one one-Delegate sub-district — like District 11 in the plan below.

A while back, I took a whack at this:

http://www.swingstateproject.c…

However, I still feel that the lines can be more refined.  My goal here was to create more Democratic seats, while at the same time making the lines cleaner.  Under the current map, there are 85 “county-fragments” in the Maryland legislative map (for example, Anne Arundel Co. has 6 “county-fragments”: Districts 30, 31, 32, 33-A, 33-B, and part of District 21), while under the proposed plan here that number declines to 73 “county-fragments.”

The population deviation for my map ranges from +/- 1,900 persons per district.  Sorry if some of the information here is a rehash from my earlier diary on redrawing Maryland’s legislative lines, but there are also some significant changes here from that earlier attempt.

The bottom line for this plan is that two Democratic Senators and six Democratic Delegates (in Districts 9 and 31) are likely to be added to the Maryland Legislature under the new lines, while an additional two Democratic Senators and six Democratic Delegates (in various districts — discussed below) may possibly be added (those numbers factor in the possible loss of several Democratic Delegates in District 34).  Also, up to eighteen current Democratic representatives in marginal seats are given stronger Democratic districts.

So, all in all, a potential gain of sixteen Democratic representatives for the next decade, as well as eighteen current Democrats made stronger.

Also, up to six  black representatives and three Hispanic representatives may be added to the state’s delegation under the plan.  Overall, eight new minority-majority districts are created (even though a number of those in Montgomery Co. have no single dominant ethnic/racial minority group).

Photobucket

Photobucket

Photobucket

Photobucket

Photobucket

Photobucket

Photobucket

Photobucket

Photobucket

District 1 – Western Maryland

New district: 93% white; 33% Obama (current district 32% Obama)

The only real change here is to divide into sub-districts a little differently from the current map:

1A – Garrett County, part of Allegany; 98% white; 28% Obama (current district 27% Obama)

1B – Frostburg and Cumberland; 89% white; 7% black; 40% Obama (current district 34% Obama)

1C – parts of Allegany and Washington Counties; 93% white; 31% Obama (current district 36% Obama)

I am not sure why the sub-districts are currently drawn as they are.  This re-drawing should shore up the one Democratic representative in this whole district, Kevin Kelly of 1B; his redrawn district will now include most of Cumberland and will be about 6 percentage points more Democratic than before.

District 2 – Washington County

New district: 83% white; 12% black; 45% Obama (Obama percentage is same as in current district)

No major changes here except to reconfigure the sub-districts.  Instead of three sub-districts, the new plan has only two:

2A – Hagerstown; 79% white; 13% black; one Delegate; 57% Obama

2B – more rural remainder of District 2; 84% white; 11% black (about 45% of the black population in this district is in the state prison located here); two Delegates; 40% Obama

District 3 – City of Frederick and southern Frederick County

New district: 71% white; 14% black; 8% hispanic; 5% asian; 56% Obama (current district 54% Obama)

The major change here is to get rid of the sub-districts.  A district that is 56% Obama (and becoming more Democratic as time goes on as more people from outside Frederick Co. stream in) should be able to elect three Democratic Delegates, instead of the current two in 3A (City of Frederick) and the Republican-turned-Independent in 3B (southern Frederick Co.).  Right-wing GOP Senator Alex Mooney may be on the way out in the November election (he won in 2006 with only 52% of the vote, and this district has experienced an influx of less conservative people moving in since then); the increase in the Democratic percentage (from 54% to 56% Obama) should help also once the new lines are in place in 2012.

Bottom line for District 3: Possible addition of Democratic Senator (if the incumbent survives 2010) and one Democratic Delegate.


District 4
– Frederick County, parts of Washington and Carroll Counties

New district: 91% white; 38% Obama (current district 37% Obama)

The sub-districts are eliminated and the new District 4 is now confined mostly to Frederick County (previously about one-third of the district was in Carroll Co.)   The only areas outside the county (necessary to preserve equal population of the district) will be Smithsburg in Washington Co. and Mt. Airy which straddles the Carroll Co./Frederick Co. line.  The GOP is expected to dominate here.

District 5 – Carroll County

New district: 92% white; 32% Obama (current district 33% Obama)

Like with District 4, the sub-districts are eliminated and the district will now be completely confined to Carroll County, instead of stretching out into northern Baltimore County.  GOP stronghold.

District 6 – Dundalk, Sparrows Point, parts of eastern Baltimore City

New district: 68% white; 27% black; 55% Obama (current district 45% Obama)

This area is a traditional blue-collar Democratic stronghold that has shifted to the right over the decades (your quintessential Reagan Democrat country).  The current District 6 is the only district in the state of Maryland (out of 47) where John Kerry performed better than Obama.  Democrats still win here locally, but in order to make the district safer for the future, the Democratic percentage is increased by 10 percentage points.  This is done in tandem with combining parts of eastern Baltimore City with the Baltimore County portion of the district.  

It should be noted that the break-down here is almost exactly such that the Baltimore City portion could be made into a sub-district electing one Delegate (the new Delegate would likely be an African-American Democrat, as that part is 61% black and voted 90% for Obama) while the Baltimore Co. part could be a two-Delegate sub-district.  However, such a move might be politically risky.  The Baltimore Co. part voted only 41% Obama and could realistically elect two Republicans at some point in the future if made into a sub-district.  Therefore, I am keeping the new District 6 without sub-districts.

District 7 – northern Baltimore County

New district: 88% white; 5% black; 36% Obama (current district 39% Obama)

The new district combines most current areas of the district with territory in northern-most Baltimore Co. which was previously part of District 5.  The new district will now be confined entirely within Baltimore Co. (it currently stretches into Harford) and it becomes even more Republican than the current form.

District 8 – Parkville, Overlea, Rosedale, White Marsh

New district: 71% white; 19% black; 5% asian; 52% Obama (current district 48% Obama)

The current district is represented by a Democratic Senator, two Democratic Delegates and one Republican Delegate.  The Republican won by a smidge last time, and the increase in the Democratic percentage (48% Obama to 52% Obama) should help here.

Bottom line for District 8: Possible addition of one Democratic Delegate, and the existing Democratic representatives are made stronger.

District 9 – Howard County (Ellicott City, most of Columbia)

New district: 62% white; 16% black; 14% Asian; 5% hispanic; 61% Obama (current district 43% Obama)

The new District 9 is a really good example of how you can make a district more compact, yet more Democratic at the same time.  The current district stretches across Howard and Carroll Counties and is quite Republican.  The new district is confined entirely to Howard Co. and is a lot more Democratic.

Bottom line for District 9: Very probable addition of Democratic Senator and three Democratic Delegates (the current Senator is Allan Kittleman, minority (GOP) leader).

District 10 – parts of Baltimore Co. (Milford Mill, Lochearn, Randallstown) and Carroll Co. (Eldersburg)

New district: 52% black; 41% white; 66% Obama (current district 87% Obama)

The new district stretches along the Liberty Road corridor from just outside the Baltimore City line into Carroll County.  The district is assured of continuing to elect an all African-American Democratic delegation as approximately 70-75% of the Democratic primary vote here is black, and the district overall is about two-thirds Democratic.

District 11 – northwestern Baltimore County

New district: 54% white; 37% black; 70% Obama (current district 66% Obama)

Remains solidly Democratic.  I have divided the new district into two sub-districts:

11A – one-Delegate district; area between Pikesville, Reisterstown and Mays Chapel; 80% white; 11% black; 5% asian; 55% Obama

11B – two-Delegate district; parts of Randallstown, Reisterstown and Owings Mills; 50%+ black; 40% white; 80% Obama

The creation of sub-district 11B will likely add two African-American legislators to the state’s delegation.  In the meantime, because of the way the lines are drawn, one or two of the current three Delegates here could run in the new District 42 which now will include a substantial part of Pikesville.  The 55% Obama percentage in 11A should not be a concern, as this is a safe Democratic district, particularly on the local level.  (John Kerry actually did better than Obama in several precincts of the new 11A, so Obama’s 55% percentage is not some sort of Democratic “ceiling” for the area, as it would be in other districts.)

Bottom line for District 11: Probable addition of two African-American Delegates.


District 12
– southwestern Baltimore County (Arbutus, Halethorpe, Catonsville, Woodlawn); part of eastern Howard County

New district: 65% white; 24% black; 6% asian; 58% Obama (same as current district)

The new district covers much of the same area as the current configuration.  The major difference is that a progressive part of Columbia (what’s now sub-district 12B) is taken out.  To compensate, most of majority black Woodlawn is added and the district’s partisan make-up remains unchanged.

District 13 – Howard County (Savage, North Laurel, part of Columbia)

New district: 63% white; 19% black; 10% asian; 5% hispanic; 62% Obama (current district 65% Obama)

This district stays quite similar to the current configuration.  District 13 was represented in the state Senate by a Republican, Sandy Schrader, prior to the 2006 election (even when the three Delegates were all Democrats).  Schrader won in 2002 with 51% of the vote, but received only 44% in her re-election attempt in 2006. This district has definitely moved in the Democratic direction over the years, and the slight decline in Democratic performance here under the proposed lines (from 65% Obama to 62% Obama) will still leave this a safe Democratic seat.

Districts 14, 15, 16, 17, 18, 19, 20 and 39 – Montgomery County

We next move to Montgomery County, where the district lines change relatively little under my map. The all-Democratic delegation here (8 Senators and 24 Delegates) is something I am very proud of (I live in Silver Spring).  I attempted to create sub-districts here which could be designed to elect minority representatives, but my efforts were futile, as the minority population is very diverse and scattered throughout the county.  Nevertheless, five of my new districts here become “minority-majority” (four are about 49% white, while District 14 is 49.6% white); District 20 is already “minority-majority”, so under this plan 6 out of 8 Montgomery Co. districts will be “minority-majority”.  This is all probably a moot issue in Montgomery, as even under the current lines, the county already has a very multi-ethnic delegation, with black, Hispanic, and Asian (east Asian, south Asian, as well as Middle Eastern-origin) representatives … and several openly gay representatives also.

New District 14: Burtonsville, Damascus, White Oak

50% white; 27% black; 13% asian; 9% hispanic; 67% Obama (current district 65% Obama)

New District 15: Potomac, Poolesville, Clarksburg

67% white; 18% asian; 7% hispanic; 7% black; 66% Obama (current district 65% Obama)

New District 16: Bethesda, Chevy Chase, Garrett Park

77% white; 10% asian; 8% hispanic; 73% Obama (current district 74% Obama)

New District 17: Rockville, Gaithersburg

49% white; 20% hispanic; 17% asian; 12% black; 71% Obama (Obama percentage is same as in current district)

New District 18: Wheaton, Derwood, Kensington, part of Silver Spring

49% white; 21% hispanic; 17% black; 11% asian; 73% Obama (current district 76% Obama)

New District 19: Aspen Hill, Leisure World, Olney, Brookeville

49% white; 19% black; 18% hispanic; 12% asian; 70% Obama (current district 68% Obama)

New District 20: Silver Spring, Takoma Park

41% white; 24% black; 22% hispanic; 11% asian; 81% Obama (current district 85% Obama)

New District 39: Germantown, Montgomery Village

49% white; 19% black; 15% asian; 15% hispanic; 71% Obama (Obama percentage is same as in current district)

The lines in Prince George’s County are reconfigured somewhat to provide more opportunities for African-American and Hispanic representatives to be elected there:

District 21 – northern Prince George’s County (Laurel, Greenbelt, Berwyn Heights, Glenarden)

New district: 53% black; 28% white; 9% hispanic; 7% asian; 84% Obama (current district 75% Obama)

The new district is now completely contained within PG Co.  I just don’t think that it makes sense to have a district stretch from College Park all the way to Odenton in Anne Arundel County (as does the current District 21).  The new district becomes majority black, and is likely to elect several African-American representatives in the future.

District 22 – northern Prince George’s County (College Park, Beltsville, New Carrollton, Landover Hills, Cheverly, Brentwood, Mount Rainier)

New district: 53% black; 23% white; 16% hispanic; 6% asian; 85% Obama (Obama percentage is same as in current district)

Senator Paul Pinsky may have no trouble getting re-elected here, but if he retires, this district is likely to elect an African-American Senator.  The new district becomes majority black, and is likely to elect several more African-American representatives in the future (currently, two of the three Delegates here are white).

District 23 – parts of Prince George’s Co. (Seat Pleasant, Capitol Heights, Upper Marlboro) and Anne Arundel Co. (Crofton, southern part of county)

New district: 51% black; 44% white; 69% Obama (current district 81% Obama)

Since this re-map made District 21 confined to PG Co., the new District 23 has to play the opposite role and reach outside PG, into Anne Arundel County.  The new district becomes majority black, and most registered Democrats here are black (as a good part of the white population in Anne Arundel is Republican).  Therefore, the district is likely to add African-Americans to its legislative delegation in the future.

Districts 24, 25, 26 – eastern, central and southern Prince George’s Co.

New District 24: Bowie; Mitchellville; Largo/Kettering; 65% black; 26% white; 85% Obama (current district 98% Obama)

New District 25: District Heights, Forestville, Suitland; 82% black; 11% white; 95% Obama (current district 96% Obama)

New District 26: Oxon Hill, Temple Hills, Fort Washington; 79% black; 11% white; 5% asian; 93% Obama (current district 94% Obama)

District 27 – Calvert County and southern Prince George’s Co.

New district: 65% white; 28% black; 61% Obama (current district 71% Obama)

The new district is more in line with using county boundaries as district boundaries than the current District 27, now taking in all of Calvert County (Calvert has experienced some of the highest population growth in the state, and will now account for about two-thirds of the new district).  The rest of the new district will be a Prince George’s Co.-based minority-majority sub-district.  Thus, the major change here is that sub-district 27A will now have one Delegate, instead of two, and 27B will have two instead of one.  

Senate Leader Mike Miller should be quite happy with the new lines, as his seat becomes more Calvert-based (his home) and it is less likely that he will be challenged in the Democratic primary by an African-American in the future.

27A – one Delegate; southern Prince George’s County and several precincts in Calvert to preserve equal population; 55% black; 38% white; 76% Obama (current sub-district is 81% Obama)

27B – two Delegates; most of Calvert Co.; 80% white; 14% black; 49% Obama (current sub-district is 47% Obama)

Even though sub-district 27B voted 49% Obama and 50% McCain, it should be noted that the current Delegate, Democrat Sue Kullen, won with 57% of the vote in 2006. Republican Anthony O’Donnell (the House minority leader from southern Calvert, currently in sub-district 29C) could also run here, but even if he were to win, his gain here would be effectively offset by his disappearance from District 29.

District 28 – Charles County

New district: 53% white; 38% black; 63% Obama (same as in current district)

The lines here change only insofar that several precincts in the eastern part of the county are taken out to preserve equal population.

District 29 – St. Mary’s County, part of Charles Co.

New district: 73% white; 20% black; 47% Obama (current district 44% Obama)

The new district is more compact than the current one.  The sub-districts are eliminated, and I’m hopefully optimistic that all three Delegates will be Democrats despite the 47% Obama – 51% McCain breakdown of the new district (currently both Delegates in 29A and 29B, which are areas almost entirely in St. Mary’s County, are Democrats elected with 65 and 64 percent of the vote; Anthony O’Donnell (GOP) won 29C — which straddles both St. Mary’s and Calvert Counties — with 60% but his sub-district becomes split in half between the new District 27 and the new District 29.)

District 30 – greater Annapolis area in Anne Arundel Co.

New district: 74% white; 16% black; 6% hispanic; 54% Obama (current district 52% Obama)

The lines here are tweaked somewhat in order to make the district a bit more Democratic. The current district is represented by a Democratic Senator and two out of three Delegates are also Democrats (including House Speaker Michael Busch).  The lone Republican, Delegate Ron George, won by 53 votes last time (or one-tenth of a percentage point), and so the change from 52% Obama to 54% Obama may be helpful in the future — assuming George makes it through 2010 under the current lines, which is not guaranteed.

Bottom line for District 30: Possible addition of one Democratic Delegate (if the sole Republican is not defeated by the time the new lines come into being).


District 31
– parts of Anne Arundel Co. (Glen Burnie, Brooklyn Park, Severn)

New district: 67% white; 21% black; 5% hispanic; 5% asian; 53% Obama (current district 40% Obama)

The political composition of this Anne Arundel district changes significantly under this re-map.  Most of the Glen Burnie parts currently in District 32 are added — so that Glen Burnie will now be basically all in one district instead of being split in half between Districts 31 and 32 — while most of hyper-Republican Pasadena is detached.  The result is a district that goes from 40% Obama to 53% Obama.  

It is quite likely that all four Republican representatives will disappear under the new lines, and will be replaced by four Democrats.  The GOP Senator here, Bob Jones University graduate Bryan Simonaire, won last time with only 51% of the vote, and he lives in Pasadena, now outside the district.  The three GOP Delegates all won by relatively small margins also, and two of the three also live in Pasadena.  

The one Delegate whose home remains in the new 31st is Don Dwyer, a rabidly right-wing homophobe who makes Simonaire appear like a moderate in comparison (Dwyer is so right-wing that he has effectively taken himself out of the Republican caucus, as they are apparently not conservative enough for him, though he remains a Republican.)  Dwyer won re-election by 25 votes last time (even the current 58% McCain district had barely the stomach for him), and it’s far from assured that he will win in 2010.  If he does make it this coming November, the new lines and district composition will pose a very formidable obstacle for him in 2014.  

This area is traditionally quite Democratic, but parts contain many conservative Reagan Democrats.  In that light, the 53% Obama of the proposed District 31 should not be seen as a Democratic ceiling for the district. (Disclosure: I grew up in Brooklyn Park, and my mom still lives there, hence this long entry re. District 31 … that, and the fact that the odious Don Dwyer is still a representative there.)

Bottom line for District 31: Probable addition of Democratic Senator and three Democratic Delegates.  Several of the current District 32 Democratic representatives live in what under this remap becomes part of District 31, so they can run here, while new Democrats can be elected in the new 32nd.

District 32 – parts of Anne Arundel Co. (Linthicum, Ferndale, Odenton, Fort Meade, Maryland City), part of  Howard Co. (Elkridge)

New district: 64% white; 22% black; 6% hispanic; 6% asian; 54% Obama (Obama percentage is same as in current district)

Like the current incarnation, the new district encompasses much of northwestern Anne Arundel County.  The district also crosses over into a part of Howard County, in order to maintain equal population.  


District 33
– parts of Anne Arundel Co. (Pasadena/Lake Shore, Severna Park, Millersville, Gambrills, Davidsonville)

New district: 88% white; 5% black; 36% Obama (current district 43% Obama)

The new District 33 combines the most Republican communities of Anne Arundel County into one district.  The two current sub-districts are eliminated.  GOP representatives from both the current 33rd and the current 31st are all put together into this district.

District 34 – parts of Harford and Cecil Counties

New district: 88% white; 7% black; 39% Obama (current district 48% Obama)

The new district becomes considerably less Democratic.  This is the only such occurrence under this plan where existing Democrats may be endangered because of the remap, but it is the price to pay for relatively high growth in this part of the state.  There’s not much that can be done geographically to shore up Democrats here, as the district is “tucked” into a corner of the state; nevertheless, I did manage to create a new Democratic-leaning District 46 — discussed later — out of the southern portion of the current District 34; the downside is that what remains in District 34 is less Democratic.  The current political balance here is a GOP Senator, and three Democratic Delegates.  I have redrawn the sub-districts so that they correspond to county lines (a two-delegate sub-district for Cecil, and a one-delegate sub-district for Harford):

34A – one-Delegate district; Harford Co.; 86% white; 8% black; 37% Obama

34B – two-Delegate district; Cecil Co.; 89% white; 6% black; 41% Obama

District 35 – Harford County, including Bel Air area

New district: 92% white; 31% Obama (same as in current district)

Remains somewhat similar to the current district which is a GOP stronghold; the sub-districts are eliminated.

District 36 – Upper Eastern Shore (all of Kent, Queen Anne’s and Caroline Counties and part of Cecil Co.)

New district: 85% white; 10% black; 39% Obama (current district 41% Obama)

District 37 – Lower Eastern Shore (all of Talbot, Dorchester and Somerset Counties and part of Wicomico Co.)

New District: 64% white; 31% black; 48% Obama (current district 46% Obama)

Currently, three out of four representatives here are Republicans.  Under the new lines, the district becomes 48% Obama – 51% McCain.

37A – one Delegate; Salisbury and Princess Anne areas; 54% black; 40% white; 59% Obama; the sub-district remains black-majority, but the lines look cleaner than under the current map; the sub-district should continue to elect an African-American Democrat.

37B – two Delegates; all of Talbot and Dorchester, and part of Somerset; 75% white; 20% black; 43% Obama.

District 38 – Lower Eastern Shore (all of Worcester Co., and part of Wicomico Co.)

New District: 81% white; 14% black; 43% Obama (current district 41% Obama)

The new 38th is quite similar to the current district (but without the sub-districts).  The district here currently elects a GOP Senator and GOP Delegate in sub-district 38A, while 38B elects two Democrats, even though that area is even more Republican than 38A.  The two Democrats include one legislator from Salisbury and a former mayor of Ocean City, so personal popularity likely plays a part, especially in the case of the latter.  The remap eliminates the sub-districts, while the Democratic percentage goes up a bit overall, but the political consequences remain anyone’s guess.

District 39 – see earlier entry under Districts 14, 15, etc. (Montgomery County)

Districts 40, 41, 43, 44, 45 – Baltimore City

Due to stagnant population growth, Baltimore City has to lose one of its current districts, and the 46th is the only logical candidate.  (Also, as already discussed, the eastern-most part of the city will be combined with adjoining parts of Baltimore County into a new 6th District.)  The other five districts are reconfigured but still keep the basic shape and identity of their current incarnations (I intentionally keep each district at 63-64% African-American):

New District 40: west-central Baltimore

64% black; 29% white; 90% Obama (current district 93% Obama)

New District 41: northwest Baltimore

63% black; 33% white; 86% Obama (current district 87% Obama)

New District 43: northeast Baltimore

63% black; 31% white; 89% Obama (current district 91% Obama)

New District 44: southwest and south Baltimore

63% black; 33% white; 86% Obama (current district 92% Obama)

New District 45: east-central Baltimore

63% black; 28% white; 84% Obama (current district 90% Obama)

District 42 – Towson, Timonium, Cockeysville, Pikesville, Carney

New District: 77% white; 11% black; 7% asian; 54% Obama (current district 53% Obama)

The current district is represented in the Senate by a Democrat.  However, two out of three Delegates are Republicans.  The trick in this part of central Baltimore Co. was to make District 8 somewhat more Democratic, without making District 42 less Democratic.  Therefore, the new District 42 was expanded into more Democratic areas around Pikesville.  Both Republican delegates won here by small margins last time, and the 54% Obama percentage should not necessarily be seen as a Democratic ceiling (in a couple of precincts in Pikesville Kerry actually performed better than Obama), so this district may provide good Democratic pick-up opportunities in the future.

District 46 – parts of Baltimore Co. (Middle River, part of Essex) and southern part of Harford Co. (Edgewood, Joppatowne, Aberdeen, Havre de Grace)

New District: 64% white; 27% black; 54% Obama

This district is a newly-created one to account for population growth in the area (and it replaces the old 46th which was based in Baltimore City).  It was initially surprising to me that you could create a new, compact district here that is at the same time quite Democratic.  I was afraid that the new district would have to be a GOP stronghold, thus causing an automatic loss of a Democratic Senator and three Democratic Delegates.  But there is apparently a robust Democratic presence in this area. Interestingly, the Harford Co. part of the district voted 56% Obama – 42% McCain, while the Baltimore Co. part split 49% – 49%.

District 47 – parts of northern Prince George’s County (Hyattsville/Chillum, Adelphi, Langley Park, Riverdale, Edmonston, Bladensburg, University Park)

New District: 47% hispanic; 36% black, 11% white; 87% Obama (current district 92% Obama)

I tried to create a Hispanic-majority district here, but that is basically not possible unless you cross county lines to encompass a couple precincts in Montgomery Co. (you can thus create a 51% Hispanic district in Maryland).  Since my goal was to split as few counties as possible, I instead created an all-Prince George’s Co. seat that has a  47% Hispanic plurality and may become hispanic-majority over the next decade.  The current District 47 has already elected a Delegate who is Hispanic, and this new district may help to increase Hispanic representation (Hispanics seem to be largely under-represented in the state legislature).

Redrawing California: More Democratic and Hispanic Representatives

(I have cross-posted this diary on Calitics)

This is my first attempt at California since the partisan data by precinct became available in Dave’s Application.  

My diaries are often long, and it takes me a while to get to the point.  So, I will summarize the bottom line here:

* 43 solidly Democratic districts created; in each McCain gets 37% of vote or less (currently there are 34 Democratic representatives from California, and 1 of the 34 holds a swingy seat)

* Remaining 10 districts to GOP, with possibility that 2 of the 10 go our way at some point in the next decade

* 19 Hispanic majority districts created; 18 of the 19 are at least 55% Hispanic, so that a Hispanic representative has a real chance of being elected (currently, there are only 8 Hispanic representatives from California).   An additional 13 seats are minority-majority (with either an Asian or African-American plurality or no particular racial/ethnic minority dominant).

Now, back to the more lengthy explanation …

I wanted to create as many minority-majority or minority-plurality districts as possible.  Although in most states an increase in the number of minority-majority districts would have an inverse relationship with an increase in the number of Democratic districts, in California that relationship appears complimentary: an increase in Democratic districts goes hand-in-hand with an increase in Hispanic and other minority-majority or minority-plurality districts.

There’s one issue here that is a bit tricky.  The dataset with the Obama/McCain partisan numbers also uses 2000 census demographics.  Under the 2000 census, California was 47% white and 32% Hispanic.  However, more recent data, from the 2006-2008 American Community Survey indicates that the state was approximately 42% white and 37% Hispanic.  The ACS data does not go down to the census block level, and therefore Dave’s Application relied on Census 2000 data, to the block level, to generate racial/ethnic composition data for each precinct for the partisan data model.  On the other hand, the original dataset without partisan numbers does appear to use the more recent numbers — down to the county level (I am not sure if the ACS 2006-2008 data was used, but the resulting percentages correspond almost exactly to what the ACS numbers look like — 42% white; 37% Hispanic).

Therefore, for the purpose of this diary, I will list the demographic data for each district using the exact (yet older) demographic data, but will also provide estimated numbers using the newer (though more geographically inexact) data.  I was able to do this by “redrawing” my map from the partisan model into the original matrix without the partisan data.  So, please keep in mind that the 2006-2008 demographic numbers are just estimates, though they are closer to the current demographic situation than the 2000 data.  

To make sure that a Hispanic-majority district has enough of a minority population to provide an opportunity to elect a minority-representative, I set a benchmark for myself of at least 55% Hispanic (under the more recent estimated data) AND the Hispanic population should be at least 2 times as large as the next largest ethnic/racial group (so a district that is 55% Hispanic and 27% white would work, but 55% Hispanic and 30% white would not work).   All my Hispanic-majority districts fit the criteria except for two which are both 55% Hispanic and 28% white and one that is 50+% Hispanic and 25% white.

There are currently only eight Hispanic representatives from California.  Under this plan, that number is likely to be at least doubled.  10 new Hispanic-majority districts are created.  In addition, two other districts have enough of a Hispanic population to elect a Hispanic representative at some point in the near future.  The plan also creates three new Asian-plurality districts, three minority-majority districts (with no particular minority group that’s dominant) and strengthens CA-35 as an African-American-plurality district.

Another goal I had in mind when drawing this plan, was to keep as many counties intact as possible.  The current (2002) plan has a total of 120 “county-fragments” in the plan.  For example, the current CA-1 has 7 fragments: the whole counties of Del Norte, Humboldt, Mendocino, Lake, and Napa (that’s 5), as well as parts of Sonoma and Yolo (2 more).  Under the proposed plan here, I have 121 “county-fragments” (and that includes one tiny sliver of Sacramento Co. that’s in my CA-4, and is therefore a “fragment” only because I tried to use a small population deviation (+/- 500 persons) for each of my districts.)  Therefore, my plan is technically not any more gerrymandered than the existing plan if looking at gerrymandering through the prism of how counties are split among districts.

Last, but not least … the partisan numbers for my map …

The current map of California is, for all practical purposes, a Republican gerrymander.  It was designed in 2002 as a “bipartisan compromise” between the two parties (even though Democrats were in charge), but today the faulty map is the only thing keeping so many Republican Congressmen in office from a state that is as Democratic as California.  To demonstrate — in 2008, 31 out of 34 Democratic Representatives won by at least 68% of the vote, while 13 out of 19 Republicans won with a winning percentage of 58% or less (including four GOPers who won with 51% or less).

One of the arguments the Democrats who designed the current map made was that it was “impossible” to create any additional Democratic seats without endangering the Democratic seats that were created.  This argument is basically bs.  As you can see from this proposal and the map below, the CA-45 that I create is made up entirely out of territory currently in GOP districts.  

Photobucket

The proposed CA-45 encompasses parts of the current CA-45, CA-44, CA-41 and CA-49, and the resulting district is 65 Obama – 34 McCain.  The district is also quite compact and confined entirely to one county – Riverside.  Thus, it was very possible to create at least one more Democratic seat in 2002, since the creation of such a district would have had no effect on any Democratic seats that were created, as all the territory comes only out of GOP areas.  (Btw, if you are a little more creative with the lines, a district entirely within Riverside Co. that takes territory only out of currently GOP-held districts can be created that is 68 Obama – 30 McCain.  The theoretical district would extend a bit more into the city of Riverside, and lose territory elsewhere; however, in my proposed map here I wanted to put most of those Democratic Riverside areas into a new CA-48 that is also designed to be a new Democratic district.)

Another example of how California Democrats could have drawn a better map in 2002 is below.  The Democrats could have created a district in San Diego Co. that is 55 Obama – 44 McCain using only territory that comes out of the current CA-50, CA-52 and CA-49, all Republican districts.  What’s more, is that the theoretical district would arguably do a better job of keeping communities together, as the northern third of the city of San Diego would now be in only one district instead of being split between CA-50 and CA-52, and much of the northern and eastern boundaries of the district would correspond almost exactly to the northern and eastern boundaries of the city.

Photobucket

Although the theoretical district would be politically competitive, and not as much of a slam-dunk Democratic district as the proposed CA-45 above, it would have likely been Democratic-held today (with all other things being equal) since it would be approximately 7 points more Democratic than the current CA-50 (Francine Busby lost the special 2006 election by only 4 points and Nick Liebham lost his 2008 race by 5 points).  (Btw, in this proposed plan I decided to draw somewhat different lines in San Diego Co. and came up with three San Diego-based districts that are all 62 Obama – 37 McCain).

The examples above are not the only ones, but are just an illustration of the existing plan’s gutlessness.  The Democrats in 2002 apparently spent millions to create such a plan; it’s really a travesty that it wound up being a gerrymander that over-represents GOP strength in the state.

The proposed plan in this diary creates 10 new solidly Democratic districts.  All existing and new Democratic seats now become ones where McCain had at most 37% of the vote in 2008.  I feel that is enough of a cushion (basically 24-25 points Obama over McCain) to ensure Democratic representation.  Btw, the numbers for California as a whole were almost exactly 62% Obama; 37% McCain. (I’m classifying McNerney’s seat as currently “Republican” since it was designed that way in 2002, and could still go GOP depending on the political climate, currently being only a 54% Obama district).  I also tried to keep the geographic/political base of each Democratic incumbent intact while designing this plan.

If this plan was implemented, Democrats would be basically assured of 43 House of Representatives seats from California, with the possibility of picking up another two at some point over the next decade.  Of course, all now depends on whether Jerry Brown can win in November, and even if he wins — how bold are California Democrats willing to be.

For those arguing that Republicans should somehow have more than 10 seats from California, I reference you to three points:  1). the current plan is tilted towards the GOP and is not representative of the partisan nature of California; likewise, there are not enough Hispanic and other minority-majority districts in the state, and in order to create a map that better represents minority populations, more Democratic districts need to be created;  2). until both parties stop using gerrymandering as a political tool, there is no reason why Democrats should disarm unilaterally; and  3.) look at the recent health care debate and see just how EVERY little seat mattered !  With nine or ten more California Democrats in the House helping Pelosi, the process would have likely gone a whole lot smoother, and we would have never been even close to that precipice of defeat …

Anyhow, here’s the plan:

Photobucket

Photobucket

Photobucket

District 1:

Incumbent: Mike Thompson (D)

Current District:  Obama 66; McCain 32

Proposed District:  Obama 64; McCain 34

Proposed District Demographics:

2000 Census: 73 white ; 2 black ; 1 native american ; 3 asian ; 18 hispanic ; 3 other

Estimated 2006-2008: 67 white ; 2 black ; 1 native american ; 4 asian ; 23 hispanic ; 2 other

Includes all of Napa, Lake, Colusa and Glenn Counties, part of Sonoma Co. – Santa Rosa, Sonoma, Rohnert Park, Cotati, Sebastopol, and part of Butte Co. – Chico, Oroville, Paradise

District 2:  

Incumbent: Wally Herger (R)

Current District:  Obama 43; McCain 55

Proposed District:  Obama 41; McCain 57

Proposed District Demographics:

2000 Census: 78 white ; 2 black ; 2 native american ; 4 asian ; 11 hispanic ; 3 other

Estimated 2006-2008: 74 white ; 2 black ; 2 native american ; 4 asian ; 15 hispanic ; 3 other

Includes all of Siskiyou, Modoc, Shasta, Tehama, Lassen, Plumas, Sierra, Nevada, Yuba and Sutter Counties, part of Sacramento Co. and part of Butte Co. – Gridley, Biggs

District 3:  

Incumbent: Dan Lungren (R)

Current District:  Obama 49; McCain 49

Proposed District:  Obama 63; McCain 35

Proposed District Demographics:

2000 Census: 52 white ; 9 black ; 1 native american ; 13 asian ; 20 hispanic ; 4 other

Estimated 2006-2008: 46 white ; 10 black ; 1 native american ; 16 asian ; 24 hispanic ; 4 other

New minority-majority district

New Democratic district

Includes all of Yolo Co., and part of Sacramento Co. – Citrus Heights and part of city of Sacramento

District 4:  

Incumbent: Tom McClintock (R)

Current District:  Obama 44; McCain 54

Proposed District:  Obama 43; McCain 55

Proposed District Demographics:

2000 Census: 83 white ; 1 black ; 1 native american ; 3 asian ; 10 hispanic ; 3 other

Estimated 2006-2008: 79 white ; 2 black ; 1 native american ; 4 asian ; 11 hispanic ; 2 other

Includes all of Placer, El Dorado, Amador, Calaveras, Tuolumne and Mariposa Counties, and small sliver of Sacramento Co.

District 5:  

Incumbent: Doris Matsui (D)

Current District:  Obama 70; McCain 28

Proposed District:  Obama 63; McCain 35

Proposed District Demographics:

2000 Census: 60 white ; 9 black ; 1 native american ; 11 asian ; 15 hispanic ; 4 other

Estimated 2006-2008: 53 white ; 10 black ; 1 native american ; 13 asian ; 20 hispanic ; 4 other

Includes part of Sacramento Co. – incl. most of the city of Sacramento

District 6:

Incumbent: Lynn Woolsey (D)

Current District:  Obama 76; McCain 22

Proposed District:  Obama 72; McCain 26

Proposed District Demographics:

2000 Census: 78 white ; 2 black ; 2 native american ; 3 asian ; 12 hispanic ; 3 other

Estimated 2006-2008: 74 white ; 2 black ; 2 native american ; 4 asian ; 16 hispanic ; 3 other

Includes all of Del Norte, Humboldt, Trinity, Mendocino and Marin Counties, and part of Sonoma Co. – Petaluma, Windsor, Healdsburg, Cloverdale

District 7:  

Incumbent: George Miller (D)

Current District:  Obama 72; McCain 27

Proposed District:  Obama 66; McCain 33

2000 Demographics: 53 white ; 11 black ; 1 native american ; 12 asian ; 19 hispanic ; 5 other

Estimated 2006-2008 Demographics: 47 white ; 11 black ; 1 native american ; 13 asian ; 25 hispanic ; 4 other

Includes all of Solano Co. and part of Contra Costa Co. – Martinez, Pleasant Hill, Concord, Clayton, Pittsburg

District 8:  

Incumbent: Nancy Pelosi (D)

Current District:  Obama 85; McCain 12

Proposed District:  Obama 85; McCain 13

Proposed District Demographics:

2000 Census: 42 white ; 9 black ; 0 native american ; 31 asian ; 15 hispanic ; 3 other

Estimated 2006-2008: 45 white ; 7 black ; 0 native american ; 31 asian ; 15 hispanic ; 2 other

Includes most of San Francisco (district expands into Sunset District to maintain equal population)

District 9:  

Incumbent: Barbara Lee (D)

Current District:  Obama 88; McCain 10

Proposed District:  Obama 74; McCain 25

Proposed District Demographics:

2000 Census: 54 white ; 17 black ; 0 native american ; 12 asian ; 14 hispanic ; 3 other

Estimated 2006-2008: 48 white ; 16 black ; 0 native american ; 15 asian ; 18 hispanic ; 3 other

Includes part of Alameda Co. – Berkeley, Albany, Emeryville, Dublin, Livermore and part of Oakland, and part of Contra Costa Co. – Moraga, Orinda, Danville, San Ramon, Oakley

District 10:  

Incumbent: John Garamendi (D)

Current District:  Obama 65; McCain 33

Proposed District:  Obama 65; McCain 33

Proposed District Demographics:

2000 Census: 57 white ; 11 black ; 1 native american ; 11 asian ; 17 hispanic ; 4 other

Estimated 2006-2008: 49 white ; 11 black ; 0 native american ; 13 asian ; 23 hispanic ; 3 other

New minority-majority district

Includes part of Contra Costa Co. – Richmond, San Pablo, El Cerrito, Hercules, Pinole, Lafayette, Walnut Creek, Antioch, Brentwood, and part of Sacramento Co. – Isleton, Galt, Folsom

District 11:  

Incumbent: Jerry McNerney (D)

Current District:  Obama 54; McCain 44

Proposed District:  Obama 66; McCain 33

Proposed District Demographics:

2000 Census: 54 white ; 9 black ; 1 native american ; 12 asian ; 20 hispanic ; 4 other

Estimated 2006-2008: 49 white ; 8 black ; 0 native american ; 15 asian ; 24 hispanic ; 3 other

New minority-majority district

New Democratic district
– that may sound strange, but this district was designed in 2002 as a GOP seat.  It has moved towards the Democrats since then, but there’s a reasonable chance the incumbent Democrat could be defeated under the current lines at some point in the future.  The proposed plan significantly increases the Democratic percentage here.

Includes part of Alameda Co. – Piedmont, Pleasanton and part of Oakland, and part of San Joaquin Co. – Tracy, Manteca, Ripon, Escalon, Lodi and part of Stockton

District 12:  

Incumbent: Jackie Speier (D)

Current District:  Obama 74; McCain 24

Proposed District:  Obama 74; McCain 24

Proposed District Demographics:

2000 Census: 50 white ; 3 black ; 0 native american ; 26 asian ; 16 hispanic ; 4 other

Estimated 2006-2008: 48 white ; 2 black ; 0 native american ; 30 asian ; 17 hispanic ; 3 other

Includes part of San Francisco and part of San Mateo Co. – Daly City, Brisbane, South San Francisco, Colma, San Bruno, Pacifica, Half Moon Bay, Millbrae, Burlingame, Hillsborough, Foster City, San Mateo, Belmont, San Carlos, Woodside and part of Redwood City

District 13:

Incumbent: Pete Stark (D)

Current District:  Obama 74; McCain 24

Proposed District:  Obama 75; McCain 23

Proposed District Demographics:

2000 Census: 36 white ; 8 black ; 1 native american ; 28 asian ; 22 hispanic ; 5 other

Estimated 2006-2008: 32 white ; 7 black ; 0 native american ; 33 asian ; 25 hispanic ; 3 other

New Asian-plurality district

Includes part of Alameda Co. – Fremont, Newark, Union City, Hayward, San Leandro, Alameda, and part of Oakland

District 14:  

Incumbent: Anna Eshoo (D)

Current District:  Obama 73; McCain 25

Proposed District:  Obama 63; McCain 35

Proposed District Demographics:

2000 Census: 59 white ; 3 black ; 1 native american ; 9 asian ; 24 hispanic ; 3 other

Estimated 2006-2008: 54 white ; 3 black ; 0 native american ; 11 asian ; 30 hispanic ; 2 other

Includes part of San Mateo Co. – Menlo Park, Atherton, East Palo Alto, Portola Valley and part of Redwood City, part of Santa Clara Co. – Palo Alto, Mountain View, Los Altos, Los Altos Hills, Monte Sereno, part of Merced Co. – Los Banos, Gustine, and part of Stanislaus Co. – Turlock, Hughson, Waterford, Oakdale, Riverbank and part of Modesto (A bit over 50% of the new district is in Silicon Valley, while the remainder is in the Central Valley.)

District 15:  

Incumbent: Mike Honda (D)

Current District:  Obama 68; McCain 30

Proposed District:  Obama 69; McCain 29

Proposed District Demographics:

2000 Census: 44 white ; 2 black ; 0 native american ; 35 asian; 15 hispanic ; 3 other

Estimated 2006-2008: 38 white ; 2 black ; 0 native american ; 42 asian ; 16 hispanic ; 2 other

New Asian-plurality district

Includes part of Santa Clara Co. – Milpitas, Santa Clara, Sunnyvale, Cupertino, Saratoga and part of San Jose

District 16:

Incumbent: Zoe Lofgren (D)

Current District:  Obama 70; McCain 29

Proposed District:  Obama 68; McCain 31

Proposed District Demographics:

2000 Census: 45 white ; 3 black ; 1 native american ; 20 asian ; 27 hispanic ; 3 other

Estimated 2006-2008: 39 white ; 3 black ; 0 native american ; 25 asian ; 30 hispanic ; 2  other

Includes part of Santa Clara Co. – Campbell, Los Gatos, Morgan Hill, Gilroy and part of San Jose

Photobucket

Photobucket

District 17:

Incumbent: Sam Farr (D)

Current District:  Obama 72; McCain 26

Proposed District:  Obama 63; McCain 35

Proposed District Demographics:

2000 Census: 67 white ; 2 black ; 1 native american ; 4 asian ; 22 hispanic ; 3 other

Estimated 2006-2008: 63 white ; 2 black ; 1 native american ; 5 asian ; 27 hispanic ; 2 other

Includes all of Santa Cruz Co., part of Monterey Co. – Monterey, Carmel, Pacific Grove, Del Rey Oaks, Sand City, Seaside, Marina, part of San Luis Obispo Co. – Paso Robles, Atascadero, Arroyo Grande, and part of Santa Barbara Co. – Lompoc, Buelton, Solvang

District 18:  

Incumbent: Dennis Cardoza (D)

Current District:  Obama 59; McCain 39

Proposed District:  Obama 61; McCain 37

Proposed District Demographics:

2000 Census: 34 white ; 4 black ; 1 native american ; 7 asian ; 50+ hispanic ; 3 other

Estimated 2006-2008: 29 white ; 4 black ; 1 native american ; 7 asian ; 59 hispanic ; 2

other

New Hispanic-majority district

Includes all of San Benito Co., part of Monterey Co. – Salinas, Gonzales, Soledad, Greenfield, King City, part of Merced Co. – Merced, Atwater, Livingston, Dos Palos, and part of Fresno Co. – Firebaugh, Mendota, San Joaquin, Coalinga, Huron, Kerman and part of city of Fresno

District 19:  

Incumbent: George Radanovich (R) (retiring)

Current District:  Obama 46; McCain 52

Proposed District:  Obama 45; McCain 53

Proposed District Demographics:

2000 Census: 40 white ; 2 black ; 1 native american ; 4 asian ; 50+ hispanic ; 2 other

Estimated 2006-2008: 35 white ; 2 black ; 1 native american ; 4 asian ; 56 hispanic ; 1 other

New Hispanic-majority district


Includes part of Madera Co. – Madera, Chowchilla, part of Fresno Co. – Sanger, Reedley, Orange Cove, Kingsburg, part of Clovis and part of the city of Fresno, and part of Tulare Co. – Tulare, Porterville, Lindsay, Farmersville, Woodlake, Dinuba

The territory contained in the proposed district is already over 50% Hispanic even under the 2000 Census numbers; it is estimated to be at least 56% Hispanic today.  The problem for Democrats is that a large proportion of the Hispanic population is undocumented and/or unregistered (also there’s a sizeable historical Portuguese population here which “skews” the Hispanic numbers).  Nevertheless, with demographic change over the next decade, this district can quickly turn our way despite the current GOP status (like CA-47 did in the 1990’s; remember Loretta Sanchez v. Bob Dornan)

District 20:  

Incumbent: Jim Costa (D)

Current District:  Obama 60; McCain 39

Proposed District:  Obama 61; McCain 37

Proposed District Demographics:

2000 Census: 22 white ; 8 black ; 2 native american ; 7 asian ; 59 hispanic ; 2 other

Estimated 2006-2008: 20 white ; 8 black ; 1 native american ; 6 asian ; 64 hispanic ; 1 other

Includes all of Kings Co.,  part of Fresno Co. – Fowler, Selma, Parlier and part of city of Fresno, and part of Kern Co. – Delano, McFarland, Wasco, Arvin and part of Bakersfield

District 21:  

Incumbent: Devin Nunes (R)*

Current District:  Obama 42; McCain 56

Proposed District:  Obama 66; McCain 33

Proposed District Demographics:

2000 Census: 31 white ; 6 black ; 1 native american ; 14 asian ; 45 hispanic ; 3 other

Estimated 2006-2008: 25 white ; 6 black ; 1 native american ; 16 asian ; 50+ hispanic ; 2 other

* District is completely “relocated” to another part of the Central Valley.  Most of Nunes’ current district is split between the new CA-19 and the new CA-22.

New Hispanic-majority district

New Democratic district

Includes part of Santa Clara Co. – part of San Jose, part of Stanislaus Co. – Newman, Patterson, Ceres and part of Modesto, and part of San Joaquin Co. – Lathrop and most of Stockton

District 22:  

Incumbent: Kevin McCarthy (R)

Current District:  Obama 38; McCain 60

Proposed District:  Obama 34; McCain 64

Proposed District Demographics:

2000 Census: 70 white ; 3 black ; 1 native american ; 4 asian ; 19 hispanic ; 3 other

Estimated 2006-2008: 65 white ; 3 black ; 1 native american ; 4 asian ; 24 hispanic ; 2 other

Includes part of Madera Co., part of Fresno Co. – part of Clovis, part of Tulare Co. – Exeter, Visalia, and part of Kern Co. – Shafter, California City, Tehachapi, Ridgecrest and part of Bakersfield

District 23:  

Incumbent: Lois Capps (D)

Current District:  Obama 66; McCain 32

Proposed District:  Obama 62; McCain 36

Proposed District Demographics:

2000 Census: 57 white ; 2 black ; 1 native american ; 4 asian ; 34 hispanic ; 2 other

Estimated 2006-2008: 53 white ; 2 black ; 0 native american ; 5 asian ; 39 hispanic ; 2 other

Includes part of San Luis Obispo Co. – Morro Bay, San Luis Obispo, Pismo Beach, Grover Beach, part of Santa Barbara Co. – Santa Maria, Guadalupe, Santa Barbara, Carpinteria, and part of Ventura Co. – Ojai, Santa Paula, Filmore, Simi Valley and part of Oxnard

Photobucket

Photobucket

Photobucket

Photobucket

District 24:  

Incumbent: Elton Gallegly (R)

Current District:  Obama 51; McCain 48

Proposed District:  Obama 62; McCain 37

Proposed District Demographics:

2000 Census: 63 white ; 3 black ; 1 native american ; 6 asian ; 26 hispanic ; 3 other

Estimated 2006-2008: 57 white ; 2 black ; 0 native american ; 7 asian ; 31 hispanic ; 2 other

New Democratic district

Includes part of Ventura Co. – Ventura, Port Hueneme, Camarillo, Moorpark, Thousand Oaks, and most of Oxnard, and part of Los Angeles Co. – Malibu, Santa Monica, Venice part of Los Angeles

District 25:

Incumbent: Howard McKeon (R)

Current District:  Obama 49; McCain 48

Proposed District:  Obama 63; McCain 35

Proposed District Demographics:

2000 Census: 30 white ; 7 black ; 1 native american ; 9 asian ; 50+ hispanic ; 2 other

Estimated 2006-2008: 28 white ; 6 black ; 1 native american ; 9 asian ; 55 hispanic ; 1 other

New Hispanic-majority district

New Democratic district

Includes all of Alpine, Mono and Inyo Counties, part of San Bernardino Co. – Adelanto, Victorville, and part of Los Angeles Co. – Baldwin Park, Irwindale, El Monte, Azusa, Covina, Claremont and parts of Pomona, Palmdale, Monrovia and Duarte

District 26:  

Incumbent: David Dreier (R)

Current District:  Obama 51; McCain 47

Proposed District:  Obama 62; McCain 37

Proposed District Demographics:

2000 Census: 24 white ; 6 black ; 1 native american ; 12 asian ; 55 hispanic ; 2 other

Estimated 2006-2008: 21 white ; 5 black ; 0 native american ; 12 asian ; 60 hispanic ; 1 other

New Hispanic-majority district

New Democratic district

Includes part of Los Angeles Co. – La Puente, South El Monte, Industry, West Covina, and part of Pomona, and part of San Bernardino Co. – Chino, Chino Hills, Montclair, and parts of Upland and Rancho Cucamonga

District 27:  

Incumbents: Brad Sherman (D)

Current District:  Obama 66; McCain 32

Proposed District:  Obama 64; McCain 34

Proposed District Demographics:

2000 Census: 54 white ; 5 black ; 1 native american ; 8 asian ; 29 hispanic ; 3 other

Estimated 2006-2008: 52 white ; 5 black ; 0 native american ; 9 asian ; 32 hispanic ; 2 other

Includes part of Kern Co. – Taft, Maricopa and part of Bakersfield, and part of Los Angeles Co. – part of Santa Clarita and part of the city of Los Angeles – parts of San Fernando Valley and Hollywood

District 28:  

Incumbent: Howard Berman (D)

Current District:  Obama 76; McCain 22

Proposed District:  Obama 64; McCain 34

Proposed District Demographics:

2000 Census: 26 white ; 7 black ; 1 native american ; 6 asian ; 58 hispanic ; 2 other

Estimated 2006-2008: 25 white ; 6 black ; 0 native american ; 6 asian ; 62 hispanic ; 1 other

Includes part of Los Angeles Co. – San Fernando, Lancaster, part of city of Los Angeles – San Fernando Valley, and part of Palmdale

This district is very likely to elect a Hispanic representative at some point in the near future

District 29:  

Incumbent: Adam Schiff (D)

Current District:  Obama 68; McCain 30

Proposed District:  Obama 63; McCain 35

Proposed District Demographics:

2000 Census: 49 white ; 7 black ; 1 native american ; 9 asian ; 31 hispanic ; 4 other

Estimated 2006-2008: 48 white ; 6 black ;  0 native american ; 10 asian ; 33 hispanic ; 2 other

Includes part of Los Angeles Co. – Burbank, Pasadena, Sierra Madre, Bradbury, Glendora, San Dimas, La Verne and part of Los Angeles

District 30:  

Incumbent: Henry Waxman (D)

Current District:  Obama 70; McCain 28

Proposed District:  Obama 64; McCain 34

Proposed District Demographics:

2000 Census: 71 white ; 3 black ; 0 native american ; 10 asian ; 13 hispanic ; 3 other

Estimated 2006-2008: 69 white ; 2 black ; 0 native american ; 11 asian ; 16 hispanic ; 2 other

Includes part of Los Angeles Co. – Beverly Hills, West Hollywood, Calabassas, Hidden Hills, Agoura Hills, Westlake Village, part of Los Angeles – parts of Bel Air and San Fernando Valley, and most of Santa Clarita

District 31:  

Incumbent: Xavier Beccera (D)

Current District:  Obama 80; McCain 18

Proposed District:  Obama 72; McCain 26

Proposed District Demographics:

2000 Census: 25 white ; 5 black ; 1 native american ; 13 asian ; 53 hispanic ; 4 other

Estimated 2006-2008: 24 white ; 4 black ; 0 native american ; 14 asian ; 56 hispanic ; 2 other

Includes part of Los Angeles Co. – Glendale, La Canada Flintridge, and part of city of  Los Angeles

District 32:  

Incumbent: Judy Chu (D)

Current District:  Obama 68; McCain 30

Proposed District:  Obama 62; McCain 36

Proposed District Demographics:

2000 Census: 22 white ; 2 black ; 1 native american ; 42 asian ; 32 hispanic ; other

Estimated 2006-2008: 20 white ; 2 black ; 0 native american ; 45 asian ; 32 hispanic ; 1 other

New Asian-plurality district

Includes part of Los Angeles Co. –  Monterey Park, Alhambra, South Pasadena, San Marino, Temple City, San Gabriel, Rosemead, Arcadia, Walnut, Diamond Bar, La Habra Heights, part of Montebello and part of Los Angeles

The district becomes plurality Asian.  Many Hispanic-majority areas of the current CA-32 are detached in order to create the new Hispanic-majority CA-25 and CA-26 just to the north and east of the new CA-32.

District 33:  

Incumbent: Diane Watson (D) (retiring)

Current District:  Obama 87; McCain 12

Proposed District:  Obama 83; McCain 16

Proposed District Demographics:

2000 Census: 11 white ; 24 black ; 1 native american ; 11 asian ; 52 hispanic ; 2 other

Estimated 2006-2008: 11 white ; 21 black ; 0 native american ; 11 asian ; 56 hispanic ; 1 other

New Hispanic-majority district

Includes part of Los Angeles Co. – Lawndale, Culver City, and parts of Los Angeles, Inglewood and Hawthorne

District 34:  

Incumbent: Lucille Roybal-Allard (D)

Current District:  Obama 75; McCain 23

Proposed District:  Obama 70; McCain 28

Proposed District Demographics:

2000 Census: 26 white ; 6 black ; 1 native american ; 11 asian ; 54 hispanic ; 2 other

Estimated 2006-2008: 24 white ; 5 black ; 0 native american ; 12 asian ; 57 hispanic ; 1 other

Includes part of Los Angeles Co. –  Downey, Bellflower, Signal Hill, Vernon, Maywood, Bell Gardens, and parts of Los Angeles and Long Beach

District 35:  

Incumbent: Maxine Waters (D)

Current District:  Obama 84; McCain 14

Proposed District:  Obama 82; McCain 16

Proposed District Demographics:

2000 Census: 15 white ; 43 black ; 1 native american ; 9 asian ; 31 hispanic ; 2 other

Estimated 2006-2008: 15 white ; 40 black ; 0 native american ; 9 asian ; 34 hispanic ; 2 other

New African-American plurality district – yes, that may sound strange, but the current CA-35 is already over 50% Hispanic; this plan combines the most African-American parts of several districts into one; otherwise, there’s a good chance a black representative may not hold a single seat in southern California at some point during the next decade, as much of south-central LA has become Hispanic-majority

Includes part of Los Angeles Co. –  Rancho Palos Verdes, Rolling Hills, Rolling Hills Estates, Avalon, and parts of Compton, Carson, Inglewood, Gardena and Hawthorne and Los Angeles (south central area and San Pedro)

District 36:  

Incumbent: Jane Harman (D)

Current District:  Obama 64; McCain 34

Proposed District:  Obama 64; McCain 35

Proposed District Demographics:

2000 Census: 58 white ; 5 black ; 0 native american ; 16 asian ; 17 hispanic ; 4 other

Estimated 2006-2008: 58 white ; 4 black ; 0 native american ; 18 asian ; 18 hispanic ; 2 other

Includes part of Los Angeles Co. – Palos Verdes Estates, Torrance, Lomita, Redondo Beach, Manhattan Beach, Hermosa Beach, El Segundo, and parts of Gardena and Los Angeles – Pacific Palisades, Brentwood, West LA and area around LAX

District 37:  

Incumbents: Laura Richardson (D)

Current District:  Obama 80; McCain 19

Proposed District:  Obama 69; McCain 29

Proposed District Demographics:

2000 Census: 21 white ; 11 black ; 1 native american ; 11 asian ; 54 hispanic ; 2 other

Estimated 2006-2008: 21 white ; 10 black ; 0 native american ; 12 asian ; 57 hispanic ; 1 other

New Hispanic-majority district


Includes part of Los Angeles Co. –  Paramount, Huntington Park, Bell, Cudahy, and parts of Los Angeles and Long Beach, and part of Orange Co. – Los Alamitos, Cypress, La Palma

District 38:  

Incumbent: Grace Napolitano (D)

Current District:  Obama 71; McCain 27

Proposed District:  Obama 62; McCain 36

Proposed District Demographics:

2000 Census: 25 white ; 2 black ; 1 native american ; 8 asian ; 62 hispanic ; 2 other

Estimated 2006-2008: 23 white ; 1 black ; 0 native american ; 8 asian ; 66 hispanic ; 1 other

Includes part of Los Angeles Co. –  Whittier, Norwalk, La Mirada, Santa Fe Springs, East LA, and parts of Los Angeles, Montebello and Pico Rivera, and part of Orange Co. – Fullerton, La Habra

District 39:

Incumbent: Linda Sánchez (D)

Current District:  Obama 65; McCain 32

Proposed District:  Obama 62; McCain 36

Proposed District Demographics:

2000 Census: 24 white ; 3 black ; 1 native american ; 15 asian ; 55 hispanic ; 2 other

Estimated 2006-2008: 22 white ; 3 black ; 0 native american ; 16 asian ; 58 hispanic ; 1 other

Includes part of Los Angeles Co. –  Lakewood, Hawaiian Gardens, Artesia, Cerritos, and parts of Los Angeles and Pico Rivera, and part of Orange Co. – Buena Park, Stanton and part of Anaheim

District 40:  

Incumbent: Ed Royce (R)

Current District:  Obama 47; McCain 51

Proposed District:  Obama 42; McCain 56

Proposed District Demographics:

2000 Census: 58 white ; 1 black ; 1 native american ; 19 asian ; 18 hispanic ; 2 other

Estimated 2006-2008: 53 white ; 1 black ; 0 native american ; 23 asian ; 21 hispanic ; 2 other

Includes part of Orange Co. – Brea, Yorba Linda, Placentia, Garden Grove, Fountain Valley, Newport Beach and part of Anaheim

Photobucket

Photobucket

Photobucket

Photobucket

Photobucket

District 41:  

Incumbent: Jerry Lewis (R)

Current District:  Obama 44; McCain 54

Proposed District:  Obama 40; McCain 58

Proposed District Demographics:

2000 Census: 69 white ; 4 black ; 1 native american ; 3 asian ; 19 hispanic ; 3 other

Estimated 2006-2008: 62 white ; 4 black ; 1 native american ; 5 asian ; 26 hispanic ; 2 other

Includes part of San Bernardino Co. – Hesperia, Apple Valley, Barstow, Needles, Twentynine Palms, Yucca Valley, Big Bear Lake, Yucaipa, Grand Terrace, and parts of

Upland and Redlands, and part of Riverside Co. – Banning, Beaumont, Calimesa

District 42:  

Incumbent: Gary Miller (R)

Current District:  Obama 45; McCain 53

Proposed District:  Obama 43; McCain 55

Proposed District Demographics:

2000 Census: 72 white ; 1 black ; 0 native american ; 9 asian ; 14 hispanic ; 3 other

Estimated 2006-2008: 68 white ; 1 black ; 0 native american ; 11 asian ; 17 hispanic ; 2 other

Includes part of Orange Co. – San Clemente, Dana Point, San Juan Capistrano, Laguna Niguel, Laguna Woods, Laguna Hills, Lake Forest, Orange, Villa Park, Mission Viejo, Rancho Santa Margarita

District 43:  

Incumbent: Joe Baca (D)

Current District:  Obama 68; McCain 30

Proposed District:  Obama 65; McCain 33

Proposed District Demographics:

2000 Census: 28 white ; 13 black ; 1 native american ; 4 asian ; 50+ hispanic ; 2 other

Estimated 2006-2008: 22 white ; 12 black ; 0 native american ; 5 asian ; 59 hispanic ; 2 other

Includes part of San Bernardino Co. – city of San Bernardino, Colton, Rialto, Fontana, Highland, Loma Linda, part of Redlands

District 44:

Incumbent: Ken Calvert (R)

Current District:  Obama 50; McCain 49

Proposed District:  Obama 43; McCain 55

Proposed District Demographics:

2000 Census: 66 white ; 4 black ; 1 native american ; 4 asian ; 23 hispanic ; 2 other

Estimated 2006-2008: 56 white ; 4 black ; 1 native american ; 6 asian ; 32 hispanic ; 2 other

Includes part of Riverside Co. – Norco, Corona, Canyon Lake, Murrietta, San Jacinto, Hemet, and part of city of Riverside

District 45:  

Incumbent: Mary Bono (R)

Current District:  Obama 52; McCain 47

Proposed District:  Obama 65; McCain 34

Proposed District Demographics:

2000 Census: 33 white ; 10 black ; 1 native american ; 4 asian ; 50+ hispanic ; 2 other

Estimated 2006-2008: 28 white ; 9 black ; 1 native american ; 4 asian ; 57 hispanic ; 2 other

New Hispanic-majority district

New Democratic district

Includes part of Riverside Co. – Moreno Valley, Perris, Lake Elsinore, Palm Springs, Desert Hot Springs, Cathedral City, Indio, Coachella, Blythe and part of city of Riverside

District 46:  

Incumbent: Dana Rohrabacher (R)

Current District:  Obama 48; McCain 50

Proposed District:  Obama 64; McCain 34

Proposed District Demographics:

2000 Census: 27 white ; 10 black ; 1 native american ; 7 asian ; 54 hispanic ; 1 other

Estimated 2006-2008: 24 white ; 9 black ; 0 native american ; 8 asian ; 58 hispanic ; 1 other

New Hispanic-majority district

New Democratic district

Includes part of Los Angeles Co. –  Lynwood, South Gate, and parts of Compton, Carson and city of Los Angeles, and part of Orange Co. – Seal Beach, Westminster, Huntington Beach

District 47:  

Incumbent: Loretta Sanchez (D)

Current District:  Obama 60; McCain 38

Proposed District:  Obama 62; McCain 36

Proposed District Demographics:

2000 Census: 33 white ; 2 black ; 1 native american ; 12 asian ; 51 hispanic ; 2 other

Estimated 2006-2008: 28 white ; 2 black ; 0 native american ; 13 asian ; 55 hispanic ; 1 other

Includes part of Orange Co. – Santa Ana, Irvine, Costa Mesa, Tustin, Laguna Beach, Aliso Viejo

District 48:  

Incumbent: John Campbell (R)*

Current District:  Obama 49; McCain 49

Proposed District:  Obama 62; McCain 36

Proposed District Demographics:

2000 Census: 33 white ; 8 black ; 1 native american ; 5 asian ; 50+ hispanic ; 2 other

Estimated 2006-2008: 27 white ; 7 black ; 0 native american ; 7 asian ; 58 hispanic ; 2 other

* District is completely “relocated” to another part of Southern California

New Hispanic-majority district

New Democratic district

Includes part of San Bernardino Co. – Ontario, and parts of Fontana and Rancho Cucamonga, and part of Riverside Co. – part of city of Riverside and part of Corona

District 49:  

Incumbent: Darrell Issa (R)

Current District:  Obama 45; McCain 53

Proposed District:  Obama 47; McCain 51

Proposed District Demographics:

2000 Census: 59 white ; 4 black ; 1 native american ; 6 asian ; 28 hispanic ; 3 other

Estimated 2006-2008: 54 white ; 3 black ; 0 native american ; 6 asian ; 34 hispanic ; 2 other

Includes part of San Diego County – Oceanside, Vista, Carlsbad, San Marcos, Escondido, Camp Pendleton

This district becomes slightly more Democratic, and there’s a chance it may go our way sometime during the next decade if demographic changes here proceed along the current path.

District 50:  

Incumbent: Brian Bilbray (R)

Current District:  Obama 51; McCain 47

Proposed District:  Obama 62; McCain 37

Proposed District Demographics:

2000 Census: 60 white ; 4 black ; 1 native american ; 14 asian ; 17 hispanic ; 3 other

Estimated 2006-2008: 57 white ; 4 black ; 0 native american ; 16 asian ; 20 hispanic ; 3 other

New Democratic district

Includes part of San Diego County – northern part of San Diego, Del Mar, Solana Beach, Encinitas and coastal areas of Carlsbad and Oceanside

District 51:  

Incumbent: Bob Filner (D)

Current District:  Obama 63; McCain 35

Proposed District:  Obama 62; McCain 37

Proposed District Demographics:

2000 Census: 24 white ; 7 black ; 1 native american ; 13 asian ; 53 hispanic ; 3 other

Estimated 2006-2008: 21 white ; 6 black ; 1 native american ; 13 asian ; 57 hispanic ; 2 other

Includes all of Imperial Co., and part of San Diego County – southern part of San Diego, Chula Vista, Imperial Beach, Lemon Grove

This district is very likely to elect a Hispanic representative at some point in the near future

District 52:  

Incumbent: Duncan Hunter (R)

Current District:  Obama 45; McCain 53

Proposed District:  Obama 38; McCain 60

Proposed District Demographics:

2000 Census: 75 white ; 2 black ; 1 native american ; 3 asian ;16 hispanic ; 2 other

Estimated 2006-2008: 71 white ; 2 black ; 1 native american ; 4 asian ; 20 hispanic ; 2 other

Includes part of San Diego County – Poway, Santee, and part of Riverside Co. – Temecula, La Quinta, Indian Wells, Palm Desert, Rancho Mirage

District 53:  

Incumbent: Susan Davis (D)

Current District:  Obama 68; McCain 30

Proposed District:  Obama 62; McCain 37

Proposed District Demographics:

2000 Census: 53 white ; 9 black ; 1 native american ; 7 asian ; 27 hispanic ; 3 other

Estimated 2006-2008: 51 white ; 8 black ; 1 native american ; 8 asian ; 30 hispanic ; 3 other

Includes part of San Diego County – central part of San Diego, Coronado, La Mesa, El Cajon

And that’s it for my plan … Thanks for comments and suggestions.

Historical Perspective on Mid-Term Elections

(This diary is more of a rant on my part — a response, if you will, to some of the fatalistic analysis I see on a lot of progressive sites these past several weeks …)

By now we all should know how the tiniest of election margins can sometimes have gigantic political consequences.  After all, a 537-vote margin in Florida in 2000 ushered in eight long and painful years for this country and for the world.  When looking at the 2010 mid-terms it has become the norm for Democrats as of late to look at the upcoming elections only in terms of defense.  A lot of our focus seems to be just on minimizing losses – by trying to figure out how not to lose this or that particular seat.  There seems to be a lot of emphasis on looking at depressing poll numbers (a new one showing a Democrat losing in this or that particular state seems to pop up almost every day from Rasmussen) and on the seemingly incessant reminder from all quarters that “the party in power always loses seats in mid-term elections.”  What’s missing, in my opinion, is an equal focus on offense for the Democratic Party and realizing that nothing is inevitable and nine months is still an eternity in politics.  I will use House races in this diary to demonstrate what I’m talking about …

Historically, in most mid-terms, the losing party, has nevertheless almost always managed to score some victories that run against the prevailing political currents.  I got the maps below from Wikipedia, but I had to make a number of corrections as some of the information was not accurate.  I only include the “first-term mid-terms” here, as “second-term mid-terms” have a little different dynamic due to the “six-year itch” that often works more strongly against the party in power … but you can easily look up all this information yourself if you want more details about particular elections in the past (a note re. the maps: Truman wasn’t elected in 1944, but, for all practical purposes, 1946 was like the middle of his first term).

Photobucket

Photobucket

To complement the maps above, here are unemployment figures for November of each year (for 1934 and 1946, only yearly averages are provided):

1934: 21.7

1946: 3.9

1954: 5.3

1962: 5.7

1966: 3.6

1970: 5.9

1978: 5.9

1982: 10.8

1990: 6.2

1994: 5.6

2002: 5.9

My point here is that if we do go on offense (as well as defense) and a truly anti-Democratic wave materializes, our losses will more likely be significantly smaller than if we’re just playing defense alone.  Oftentimes, surprising and counter-intuitive victories can be the factor that separates a “loss” from a “wipeout”.  In fact, when looking at House elections in the middle of a President’s first term over the last 75 years or so, you can see that in most cases, losses in certain geographic areas have more often than not been offset by wins in other areas.  

For example, in 1970 Nixon’s GOP lost seats in 16 different states, but the losses were somewhat minimized by GOP wins in states as varied as California, Montana, Colorado, Oklahoma, Virginia and New York.  In 1978, Carter’s Democrats lost seats scattered across 15 different states, but those losses were offset by Democratic gains in states as diverse as Michigan, Washington, South Dakota, Connecticut, Maryland and Florida.  Going back to 1934, FDR’s losses in parts of the midwest were actually more than offset by some big wins in the northeast, particularly in Pennsylvania where 11 (sic) Democrats took over previously GOP-held seats (without Pennsylvania, the Democrats would have had a net loss of seats that year !  Incidentally, Pennsylvania also added Democrats in 1932 and 1936 House elections, going from having 33 Republicans and 3 Democrats prior to the 1932 election to 7 Republicans and 27 Democrats after the 1936 election).

In fact, in all of U.S. History there has only been one election of any kind (mid-term or not) where the “losing” party did not gain a single Senate, House or Governor’s seat from the “winning” party: 2006.  (In 2006, the GOP did not take over a single seat from the Democrats in Senate, House or Governor’s races; the next closest was 1938, which was a big GOP year, and the Democrats did not pick up a single Republican Senate or House seat, but they still managed to take the Governorships of California, Maryland and North Dakota away from the GOP.  Even during the 1994 GOP landslide, Democrats took over four previously Republican-held House seats and also picked up the Governorship of Alaska.)

Anyhow, I hope you get the picture re. how some elections can have more than just one political current going.  (1982 has to be looked at in a slightly different prism, in my view.  The 11% unemployment in November of that year was certainly the main factor.  But also, a new set of districts due to reapportionment and redistricting was a factor as well.  Phil Burton’s gerrymander in California was probably by itself instrumental in an additional six Democratic seats.)  This aspect of elections (dealing with political counter-currents) is just one point I want to make.  Perhaps more importantly, is how we handle elections which indeed seem like they will turn out to be wave elections.

Some first-term mid-terms are indeed wave elections.  1994 is perhaps the best example (I personally like 2006 better, but again, I’m trying to limit this diary to “first-term mid-terms”), and we often think of 1994 when comparing it to 2010.  But even in a worst-case scenario, like 1994, it is imperative that we study the history.  Because — even in that GOP landslide, a relatively small number of votes may have made the difference between a “loss” and a “wipeout”.   Now, this part is not shown on the map above — on which 1994 indeed looks like the wipeout that it was.  But if you look behind the picture, so to speak, you can see that even in the landslide, a little more effort on the part of Democrats may have made a huge difference:

First of all … the power of incumbency.  The following Democratic incumbents won contested elections in 1994 in districts that were quite conservative (ones which Bill Clinton lost by 1% or more in 1992); the incumbents’ winning margin is listed (please note that only districts that were contested by a Republican are shown):

AL-3: Glen Browder 63.6 – 36.4

AL-5: Robert Cramer 50.5 – 49.5

GA-9: Nathan Deal 57.9 – 42.1 (Deal changed parties after the election)

IN-3: Timothy Roemer 55.2 – 44.8

KY-6: Scotty Baesler 58.8 – 41.2

MI-10: David Bonior 62.2 – 37.7

MS-3: Sonny Montgomery 67.6 – 32.4

MS-4: Michael Parker 68.5 – 31.5 (Parker changed parties after the election)

MS-5: Gene Taylor 60.1 – 39.9

MO-4: Ike Skelton 67.8 – 32.3

NC-8: Bill Hefner 52.4 – 47.6

ND-AL: Earl Pomeroy 52.3 – 45.0

PA-6: Tim Holden 56.7 – 43.3

SC-5: John Spratt 52.1 – 47.8

SD-AL: Tim Johnson 59.8 – 36.6

TX-4: Ralph Hall 58.8 – 39.8

TX-11: Chet Edwards 59.2 – 40.8

TX-14: Greg Laughlin 55.6 – 44.4 (Laughlin changed parties after the election)

TX-17: Charles Stenholm 53.6 – 46.3

UT-3: Bill Orton 59.0 – 39.9

VA-2: Owen Pickett 59.0 – 40.9

VA-4: Norman Sisisky 61.6 – 38.4

VA-5: Lewis Payne 53.3 – 46.7

In most cases, the above incumbents won rather comfortably.  On the other hand, the following districts were open seats in 1994 and went GOP — despite being not as conservative as the first group above (all the districts below were won by Clinton in 1992, or Clinton came within 1% or less of winning in the case of KS-2 and NC-5):

IL-11: George Sangmeister, retired

KS-2: Jim Slattery, resigned to run for Governor

ME-1: Thomas Andrews, resigned to run for Senate

MI-8: Bob Carr, resigned to run for Senate

MN-1: Tim Penny, retired

NC-5: Stephen Neal, retired

NJ-2: William Hughes, retired

OH-18: Douglas Applegate, retired

OK-2: Mike Synar, defeated in primary

OR-5: Michael Kopetski, retired

TN-3: Marilyn Lloyd, retired

TN-4: Jim Cooper, resigned to run for Senate

WA-2: Al Swift, retired

It is quite likely that many of the seats above would have stayed Democratic if the incumbent had not retired.  If, theoretically, all 13 stayed in Democratic hands, then there would have been no “Republican Revolution” in 1994, as the Democrats would have maintained an effective majority (with a 217 D – 217 R split, and Bernie Sanders of Vermont).

Therefore, it is imperative that retirements be minimized.  This is perhaps already obvious.  

The second point … always be in fighting mode.  A lot of House districts were lost in 1994 by relatively small margins.  All the districts listed below were won by the GOP in 1994 by about 6 points or less (most, though not all, were Democratic incumbents who were defeated):

WI-1: Mark Neuman (R) 49.4 – Peter Barca (D) 48.8, margin 1120 votes

NC-4: Fred Heineman (R) 50.4 – David Price (D) 49.6, margin 1215

NV-1: John Ensign (R) 48.5 – James Bilbray (D) 47.5, margin 1436

CA-22: Andrea Seastrand (R) 49.3 – Walter Capps (D) 48.5, margin 1563

NE-2: Jon Christensen (R) 49.9 – Peter Hoagland (D) 49.0, margin 1766

NJ-8: William Martini (R) 49.9 – Herbert Klein (D) 48.6, margin 1833

KY-1: Ed Whitfield (R) 51.0 – Thomas Barlow (D) 49.0, margin 2462

OH-6: Frank Cremeans (R) 50.9 – Ted Strickland (D) 49.1, margin 3402

WA-5: George Nethercutt (R) 50.9 – Tom Foley (D) 49.1, margin 3983

PA-21: Phil English (R) 49.5 – Bill Leavens (D) 46.9, margin 4643

CA-49: Brian Bilbray (R) 48.5 – Lynn Schenk (D) 46.0, margin 4686

GA-7: Bob Barr (R) 51.9 – George “Buddy” Darden (D) 48.1, margin 5287

WA-9: Randy Tate (R) 51.8 – Mike Kreidler (D) 48.2, margin 5382

AR-4: Jay Dickey (R) 51.8 – Jay Bradford (D) 48.2, margin 6099

WA-1: Rick White (R) 51.7 – Maria Cantwell (D) 48.3, margin 6444

OK-2: Tom Coburn (R) 52.1 – Virgil Cooper (D) 47.9, margin 6536

OR-5: Jim Bunn (R) 49.8 – Catherine Webber (D) 46.8, margin 7354

NC-3: Walter Jones (R) 52.7 – Martin Lancaster (D) 47.3, margin 7451

MA-6: Peter Torkildsen (R) 50.5 – John Tierney (D) 47.4, margin 7471

PA-13: Jon Fox (R) 49.4 – Marjorie Margolies-Mezvinsky (D) 45.2, margin 8181

IN-8: John Hostettler (R) 52.4 – Frank McCloskey (D) 47.6, margin 8672

NH-2: Charlie Bass (R) 51.4 – Dick Swett (D) 46.0, margin 8878

TX-9: Steve Stockman (R) 51.9 – Jack Brooks (D) 45.7, margin 9710

ME-1: James Longley (R) 51.9 – Dennis Dutremble (D) 48.1, margin 9943

OH-19: Steve LaTourette (R) 48.5 – Eric Fingerhut (D) 43.5, margin 10296

NY-1: Michael Forbes (R) 52.5 – George Hochbrueckner (D) 46.5, margin 10345

KS-4: Todd Tiahrt (R) 52.9 – Dan Glickman (D) 47.1, margin 12287

IA-4: Greg Ganske (R) 52.5 – Neal Smith (D) 46.4, margin 13111

That’s 28 districts above, or more than 50% of the total GOP gain of 54 seats.  If those districts went Democratic instead of GOP (and I’m not using the word “switched”, because some of the above, like CA-22, PA-21, AR-4 and MA-6, were GOP-held prior to 1994), the Democrats would have remained in the majority with a 232 D- 202 R margin, instead of winding up with a losing margin of 230 R – 204 D.

If only the first 13 districts on the list hadn’t gone GOP, the Democrats would have maintained a majority (217 D – 217 R split, and Bernie Sanders of Vermont).  The first 13 districts on the list have an average Republican – Democratic margin of only 50.1% – 48.3%.  This is all a theoretical exercise, of course, because there were other factors like party-switchers, but the point remains that the results in even a dozen or so close-margin seats can have profound political consequences.  The combined GOP over Democratic margin in the first 13 districts above is only 38,778 voters.  So, in effect (and yes, theoretically) if about 19,400 voters (out of over 71 million votes cast in House elections in 1994) had voted differently, there would have been no “Republican Revolution” that year.

And yes, I realize that many Democrats won their races by the same slight margins that year, and so the GOP gains could have been even larger — but that is not the point.   My point is that if the political climate was overall just a little better for the Democrats that year (just a few points) the whole election could have gone differently (and the climate could have been a little better if Bill Clinton made some better choices) – and/or if the Democrats had made just a little more of an effort (better candidates, more funds, less retirements, better turnout, etc.), it may have gone differently … According to one analysis, http://archive.fairvote.org/re… , most eligible voters did not participate in the 1994 election.  “… only 17 of the 56 Republicans who won seats held by Democrats (in 1994) had higher vote totals than losing Republicans had won in those districts in 1992 suggest the impact of voter turnout.”

The bottom line — even if we’re looking at a bad year, we should not be afraid to go on the offense in states and districts across the country.  Chances are that minimizing retirements as well as having good Democratic candidates, campaigns and turnout will minimize any losses that our party may incur (and we may even be in store for a big, happy surprise like in 1934).  There’s nothing like a good campaign – just look at Scott Brown’s recent victory in Massachusetts, or something just as impressive to me – the near-defeat of Barry Goldwater in Arizona — by a Democrat ! — in 1980 of all years ! (Goldwater won a razor-sharp victory only after all the absentees had been counted).

If, on the other hand, we’re just playing defense and adopt a fatalistic outlook towards November 2010, our losses are likely to be greater.  The President also needs to make the right choices over the next nine months – in order to create as favorable a climate for the Democratic Party to succeed in November (and that includes not alienating his base and thus depressing turnout !) … so, good luck to the Democrats … but don’t forget go on offense and fight like hell over the next nine months and don’t be afraid of history; nothing is inevitable in elections.

Contest Entry: Redistricting New York – 26 Safe Democrats

I decided to do a partisan gerrymander for the contest which pretty much locks in 26 Democrats and 2 Republicans for the state.  All 26 Democratic seats were won by Obama with at least 58% of the vote, and McCain got at most 41%.  This is, in effect, making each Democratic district at least a “+10 D” seat since Obama beats McCain by at least a 17 point margin for each of the 26 seats, while Obama beat McCain nationally by about 7 points, and essentially assures that a Democrat will represent each of the 26 seats in Congress.

The remaining two seats are ceded to the GOP.  One is NY-26 in western New York, and the other is a reconfigured NY-24 in the eastern part of upstate.  It was sad to sacrifice Michael Arcuri in this manner, but it makes all the neighboring seats safe and then some, by spreading more Democrats outward to other seats.  It’s nothing personal against Arcuri; it was just easiest to do it this way for me geographically, and since Arcuri had a hard time at reelection in 2008, he may not be that safe in future elections anyhow.

Despite the highly gerrymandered lines, each district strives to maintain at least a decent portion of the territory currently in the district (including, ofcourse, each incumbent’s home).  The notable exceptions are Arcuri’s district (discussed under NY-24 below) and Peter King’s district on Long Island, which is obliterated.  About 26% of King’s district becomes part of NY-2; about 26% becomes part of NY-4; 8% goes to NY-5, and 5% to NY-18.  (The Democratic percentage in NY-2 and NY-4, nevertheless, goes UP to 60% Obama in each district, while remaining above the 60% level in both NY-5 and NY-18).

The largest part of the current NY-3, about 35% (including King’s home in Seaford/Oyster Bay) goes to NY-6, but King would have no chance there, as the district is 50%+ African-American and voted 71% for Obama.  Thus, King’s district is geographically torn into pieces and destroyed.

In the meantime, Eric Massa’s NY-29 in upstate is renamed NY-3 (thanks to MattTX2 for the inspiration from his contest entry !  as well as the inspiration for intertwining upstate districts  in the eastern part of the state with areas in metro NYC.  Btw, as far as I’m concerned, I’m OK if others take parts of my plan to use in their remaps.  I mean, I like the competition of the contest, but one goal for us all is to draw the best map possible for New York and show just what can be done.)

Several technical notes:  

BIG NOTE TO CONTEST JUDGE:  please note that in the drf.xml file I sent you (and reflected on the maps here) I have switched districts 5 and 6 because of the better color differentiation (yellow/green) from neighboring districts on the maps.  So, what’s tagged as “District 5” in the program is really District 6 … and vice versa.

I decided to have an even stricter population difference than the contest calls for; all my districts vary by no more than 2,000 persons from the ideal population; the contest rules accept up to around 7,000.  However, I have 1,760 persons unaccounted for in my plan.  Yes, I know to use the “next unassigned” button, but the program just can’t seem to find the missing geographical bits (I was successful at finding a bunch of missing precincts through “unassigned”, but with the last 1,760 persons, it just points to areas already designated for a specific district).  Anyhow, the missing area(s) voted 84% for Obama, so perhaps one of my districts could be even more Democratic than what’s in this plan ? oh well !)

Here’s my plan:

MAPS:

Photobucket

Photobucket

Photobucket

District 1:

Incumbent: Timothy Bishop

Current District:  Obama 52; McCain 48

Proposed District:  Obama 59; McCain 41

Population: 701,005

Demographics: white 70; black 11; native am. 0; asian 2;  hispanic 15; other 2

Encompasses the eastern half of Long Island.  Entire district is confined to Suffolk Co., mostly the eastern portion but with some very Democratic areas in western Suffolk added (parts of Islip and Babylon) to bring up the Democratic percentage.

District 2:  

Incumbent: Steve Israel

Current District:  Obama 56; McCain 43

Proposed District:  Obama 60; McCain 40

Population: 701,072

Demographics: white 67; black 15; native am. 0; asian 3; Hispanic 12; other 2

The new district is centered on western Suffolk Co. and eastern Nassau Co., including most of Huntington, and parts of Babylon, Islip, Oyster Bay and Hempstead.  The Democratic percentage goes up with the addition of very Democratic areas in Hempstead.

District 3 (Old 29):

Incumbent: Eric Massa

Current District:  Obama 48; McCain 51

Proposed District:  Obama 58; McCain 41

Population: 700,442

Demographics: white 87; black 8; native am. 0; asian 2; hispanic 2; other 1

The current NY-29 is renamed NY-3.  The new district encompasses parts of Buffalo and Erie Co., then stretches south and east along the Pennsylvania border to include Massa’s home in Corning, and then goes northeast to include the Ithaca area.  Adding Ithaca and parts of Buffalo makes the district a lot more Democratic, and I think including Ithaca is a nice complement for the progressive Massa.

District 4:  

Incumbent: Carolyn McCarthy

Current District:  Obama 58; McCain 41

Proposed District:  Obama 60; McCain 40

Population: 701,554

Demographics: white 58; black 11; native am. 0; asian 11; hispanic 15; other 6

The district retains much of the current territory in Nassau, including McCarthy’s home in the Mineola part of North Hempstead, but the borders are made more gerrymandered in order to maintain the current Democratic advantage.  In order to make the district overall even more Democratic than the current version, part of the district is extended into Queens.

District 5:  

Incumbent: Gary Ackerman

Current District:  Obama 63; McCain 36

Proposed District:  Obama 63; McCain 37

Population: 698,427

Demographics: white 43; black 6; native am. 0; asian 22; hispanic 27; other 2

The new district is quite similar to the current one, including parts of Queens and northern Nassau Co. (North Hempstead).  The district is extended eastward a bit, further into northern Nassau (northern part of Oyster Bay), but loses some southern areas in Queens and Nassau.  The partisan breakdown remains very much the same.

District 6:

Incumbent: Gregory Meeks

Current District:  Obama 89; McCain 11

Proposed District:  Obama 71; McCain 29

Population: 701,198

Demographics: white 38; black 50+; native am. 0; asian 1; hispanic 7; other 3

The new NY-6 contains much of the territory of the current NY-6 (Jamaica, St. Albans, etc.), but is reconfigured in a manner to maximize the obliteration of Peter King’s district.  Basically, the most Democratic parts of NY-6 are combined with the most Republican parts of NY-3 (including King’s home base).

Despite the new unorthodox appearance with the district hugging the water in many areas, a person can actually walk from one part of the district to any other part via land or bridges.  You start out in the Queens heart of the district; can walk west into the Brooklyn extension or take the Cross Bay Blvd. south over Jamaica Bay to the Rockaway area (Meeks home is in Far Rockaway); then go east along the Atlantic shore, hop over another bridge to Long Beach (the district is very narrow here, btw, only one precinct deep hugging the ocean); from there you can hop over several more bridges and islands to Jones Beach Island.  Then, you can go in either of two directions.  1.) Go further east towards Oak Beach, and can then go over the Robert Moses Causeway either south to Fire Island or north to the Long Island mainland around West Islip where part of the district continues along the shore back towards Amityville, or 2.) go north from Jones Beach Island across Wantagh State Parkway to the mainland and Seaford/Oyster Bay — what today is the heart of NY-3 and Peter King’s base in Nassau.

District 7:  

Incumbent: Joseph Crowley

Current District:  Obama 79; McCain 20

Proposed District:  Obama 73; McCain 27

Population: 699,421

Demographics: white 51; black 10; native am. 0; asian 9; hispanic 26; other 4

Contains parts of Queens (Astoria, part of Woodside), Brooklyn (Greenpoint, part of Williamsburg) and parts of the Bronx and Manhattan.  All areas are connected by land or bridges – specifically, the series of highways and bridges on Randalls Island connects the Bronx, Manhattan and Queens parts of the district which are across water from each other.  The Democratic percentage goes down somewhat, but the district remains very safely Democratic.

District 8:  

Incumbent: Jerrold Nadler

Current District:  Obama 74; McCain 26

Proposed District:  Obama 73; McCain 26

Population: 700,314

Demographics: white 59; black 6; native am. 0; asian 17; hispanic 14; other 4

The new district contains territory same as or similar to the current district – a combination of very progressive areas in Manhattan (Nadler’s home base on the Upper West Side, Chelsea, Tribeca) and relatively more conservative  parts of Brooklyn (areas like Bensonhurst and Bay Ridge).  The Brooklyn Bridge connects the Manhattan and Brooklyn parts of the district.  The partisan breakdown does not change much.

District 9:  

Incumbent: Anthony Weiner

Current District:  Obama 55; McCain 44

Proposed District:  Obama 60; McCain 40

Population: 698,687

Demographics: white 55; black 10; native am. 0; asian 15; hispanic 16; other 5

The new NY-9 contains parts of Queens (including Weiner’s home in Forest Hills), Brooklyn, and Nassau Co.  The Democratic percentage goes up, as the district no longer includes most of the Orthodox Jewish conservative parts of Brooklyn.

District 10:  

Incumbent: Edolphus Towns

Current District:  Obama 91; McCain 9

Proposed District:  Obama 80; McCain 19

Population: 700,702

Demographics: white 32; black 50+; native am. 0; asian 4; hispanic 11; other 3

The new Brooklyn-based district is largely similar to the current one, and includes areas like Bedford-Suyvesant, parts of Canarsie and East New York. The Democratic percentage goes down as the new district expands to include more conservative parts of Brooklyn (including Orthodox Jewish areas), and into more GOP-friendly territory on the Rockaway peninsula in Queens.

District 11:  

Incumbent: Yvette Clarke

Current District:  Obama 91; McCain 9

Proposed District:  Obama 76; McCain 24

Population: 701,845

Demographics: white 33; black 50+; native am. 0; asian 4; hispanic 9; other 3

Similar situation to NY-10 above; Brooklyn-based district; newly added Orthodox Jewish areas make the Democratic percentage go down, but at 76% Obama, it’s a very safe Democratic seat.  The new district includes African-American majority areas east of Prospect Park, the eastern part of Flatbush and Brownsville, then extends to the Orthodox areas around Ocean Parkway and Borough Park, and goes south all the way south to Brighton Beach.

District 12:  

Incumbent: Nydia Velázquez

Current District:  Obama 86; McCain 13

Proposed District:  Obama 85; McCain 15

Population: 698,381

Demographics: white 20; black 12; native am. 0; asian 14; hispanic 50+; other 4

The new district is concentrated along the Brooklyn-Queens border.  It expands north further into Queens, and also goes across Manhattan Bridge from Brooklyn to include part of the Lower East Side of Manhattan. The Hispanic percentage increases from the current 48% to 50%+.

District 13:

Incumbent: Michael McMahon

Current District:  Obama 49; McCain 51

Proposed District:  Obama 61; McCain 39

Population: 699,033

Demographics: white 63; black 9; native am. 0; asian 6; hispanic 20; other 2

The new NY-13 includes all of Staten Island.  It then goes over the Verrazano Bridge to include some of the most Democratic (though mostly non-minority) areas in Brooklyn including parts of Park Slope, Brooklyn Heights and Sunset Park.  No inclusion of any part of Manhattan was necessary to increase the Democratic percentage significantly (again, thanks to MattTX22 for the inspiration !).

District 14:  

Incumbent: Carolyn Maloney

Current District:  Obama 78; McCain 21

Proposed District:  Obama 81; McCain 18

Population: 701,165

Demographics: white 70; black 4; native am. 0; asian 15; hispanic 9; other 2

The new district is now confined entirely to Manhattan, as the Queens areas are taken out.  The district includes areas like the Upper East Side, Midtown and the East Village.  It becomes marginally even more Democratic than the current progressive stronghold.

District 15:  

Incumbent: Charles Rangel

Current District:  Obama 93; McCain 6

Proposed District:  Obama 79; McCain 20

Population: 699,529

Demographics: white 29; black 26; native am. 0; asian 3; hispanic 40; other 2

The new district includes Harlem and other areas in northern Manhattan.  It then follows Broadway out into the Bronx, and then Highway 87 up through Yonkers, and into Rockland Co.  The district remains minority-majority (71%) though, as with the current district, no racial/ethnic group has a clear majority by itself.

District 16:  

Incumbent: José Serrano

Current District:  Obama 95; McCain 5

Proposed District:  Obama 93; McCain 7

Population: 700,289

Demographics: white 5; black 30; native am. 0; asian 2; hispanic 60; other 2

Remains similar to the current district, including much of the South Bronx and central parts of the Bronx around the zoo.  The Hispanic percentage remains at the 60% level required by the contest rules.

District 17:

Incumbent: Eliot Engel

Current District:  Obama 72; McCain 28

Proposed District:  Obama 63; McCain 36

Population: 699,291

Demographics: white 65; black 10; native am. 0; asian 3; hispanic 20; other 2

The new district includes much of the same territory in the Bronx (including Engel’s home in Riverdale), and Westchester and Rockland Counties, but also expands north into more conservative areas upstate (parts of Orange, Sullivan, Delaware and Broome Counties) as well as south into more progressive areas on the west side of Manhattan.  In effect, the new district forms most of New York’s border with New Jersey.  The district becomes somewhat less Democratic, but is still very safe.

District 18:  

Incumbent: Nita Lowey

Current District:  Obama 62; McCain 38

Proposed District:  Obama 61; McCain 39

Population: 700,775

Demographics: white 62; black 20; native am. 0; asian 3; hispanic 13; other 2

NY-18 remains very similar in partisan preference to the current district, but the borders change rather dramatically.  Many parts of Westchester are still there (including Lowey’s home in Harrison, Rye and parts of New Rochelle), but the new district also includes a part of the northern Bronx and jumps across Long Island Sound to encompass northern parts of Long Island – most of Glen Cove, and areas east along the shore into Suffolk Co. (Smithtown and part of Brookhaven).  I figured that Lowey might be OK with such a district, since back in the 1990’s she represented a district that also combined rather disparate areas (parts of Westchester combined with parts of the Bronx and Queens).  Sorry, there’s no existing bridge to connect the two major parts of the new district (Westchester and Long Island) but there is a proposal to have a bridge or tunnel built (from Rye to Glen Cove and/or Oyster Bay) ! — http://en.wikipedia.org/wiki/L…

District 19:  

Incumbent: John Hall

Current District:  Obama 51; McCain 48

Proposed District:  Obama 60; McCain 40

Population: 701,088

Demographics: white 60; black 11; native am.0; asian 4; hispanic 23; other 2

The new NY-19 becomes more Democratic as it’s extended southward towards NYC.  The district runs from Hall’s home in Dover in the very northern part of the district, through Dutchess, Putnam and Westchester Counties (including parts of White Plains and New Rochelle) and then into a part of the northern Bronx.  Inevitably the Democratic percentage goes up to levels where just about any Democrat should be safe.

District 20:  

Incumbent: Scott Murphy

Current District:  Obama 51; McCain 48

Proposed District:  Obama 59; McCain 40

Population: 698,825

Demographics: white 75; black 13; native am. 0; asian 3; hispanic 7; other 2

In a fashion very similar to NY-19 described above, the NY-20 starts near Murphy’s home in Glens Falls, then follows the Hudson Valley south towards NYC, stopping just short of actually entering the city, but still including very Democratic Mount Vernon, just over the NYC line in Westchester.

District 21:  

Incumbent: Paul Tonko

Current District:  Obama 58; McCain 40

Proposed District:  Obama 58; McCain 41

Population: 701,643

Demographics: white 81; black 7; native am. 0; asian 2; hispanic 8; other 2

The new district continues to include a good part of the Albany area, including Tonko’s home in Amsterdam, as well as all of Schenectady and parts of Albany.  It then follows the Hudson Valley south to Peekskill, ending in Westchester and Rockland Counties.  The partisan breakdown remains pretty much the same as the current district.

District 22:  

Incumbent: Maurice Hinchey

Current District:  Obama 59; McCain 39

Proposed District:  Obama 58; McCain 41

Population: 700,768

Demographics: white 81; black 8; native am. 0; asian 2; hispanic 7; other 2

The new NY-22 is similar in many ways to the current district.  It includes areas from Binghamton and Broome Co. to Hinchey’s home area in Ulster Co. around Hurley and Kingston.  Also included are all of Chemung and Tioga Counties and parts of Chenago, Otsego, Delaware, Sullivan and Orange Counties, as well as Poughkeepsie and Beacon in Dutchess Co.  The Democratic percentage here remains very similar to the current district.

District 23:  

Incumbent: Bill Owens

Current District:  Obama 52; McCain 47

Proposed District:  Obama 58; McCain 41

Population: 700,802

Demographics: white 91; black 4; native am. 0; asian 1; hispanic 2; other 1

The new district combines the more Democratic parts of the current NY-23 (St. Lawrence, Franklin, Clinton and most of Essex Co.) with Democratic territory further south around Saratoga Springs and including most of Albany.  Now, either Doug Hoffman or Jim Tedisco could try to run against Owens, but either would have a hard time, as the Democratic percentage goes up significantly.

District 24:  

Incumbent: Michael Arcuri

Current District:  Obama 51; McCain 48

Proposed District:  Obama 44; McCain 54

Population: 700,042

Demographics: white 94; black 2; native am. 0; asian 1; hispanic 2; other 1

The new district includes a large swath of territory in the eastern part of upstate New York, including all or parts of 19 counties.  Arcuri had a close call during his 2008 re-election bid, so it’s likely he would lose here.  The new NY-24 actually includes much of Arcuri’s current territory (except, notably his home in Utica, which goes into the new NY-25 to make that district more Democratic), but the new partisan breakdown would be too much to handle.  However, not all hope is lost.  Perhaps Doug Hoffman, who lives just outside the borders of the new NY-24, can run here instead and we can have a repeat of NY-23 from this past November !  Most of DeDe Scozzafava’s legislative district is also included here, as is most of the district of State Senator Darrell Aubertine, who perhaps might be the only Democrat who could launch a possibly successful campaign here.

District 25:  

Incumbent: Daniel Maffei

Current District:  Obama 56; McCain 43

Proposed District:  Obama 58; McCain 41

Population: 700,401

Demographics: white 86; black 7; native am. 1; asian 2; hispanic 3; other 2

NY-25 continues to include all of Syracuse and Onondaga Co.  Also included under the new lines is most of Cayuga, Seneca, and Madison Counties, Geneva in Ontario Co., and

Utica in Oneida Co.  The Democratic percentage goes up a bit.  Even though Arcuri’s home in Utica is included here, as well as the counties west of Onondaga which are also currently in NY-24, most of the territory comes out of Maffei’s current NY-25, and the new district is designed with Maffei in mind.

District 26:  

Incumbents: Christopher Lee

Current District:  Obama 46; McCain 52

Proposed District:  Obama 41; McCain 57

Population: 698,894

Demographics: white 95; black 2; native am. 0; asian 1; hispanic 2; other 1

This new district combines much of Lee’s base in Erie Co. with other hyper-Republican areas in the western part of upstate New York – including all or parts of 16 different counties.  The Republican percentage goes up significantly, as the vast majority of GOP precincts in this part of the state are packed into the district

District 27:  

Incumbent: Brian Higgins

Current District:  Obama 54; McCain 44

Proposed District:  Obama 58; McCain 41

Population: 700,771

Demographics: white 82; black 11; native am. 1; asian 1; hispanic 4; other 1

This Buffalo-based district remains very similar to the current configuration.  The Democratic percentage is made higher with the addition of more of Buffalo.  Also included are Niagara Falls, Tonawanda and areas south of Buffalo in Erie and Chautauqua Counties.

District 28:

Incumbent: Louise Slaughter

Current District:  Obama 69; McCain 30

Proposed District:  Obama 60; McCain 39

Population: 701,210

Demographics: white 77; black 13; native am. 0; asian 3; hispanic 5; other 2

This is one of the few districts that is actually made more compact by this plan.  NY-28 is now almost completely confined to Rochester and Monroe Co. (including the most Democratic parts, ofcourse) with a sliver protruding south to Geneseo  (home of SUNY-Geneseo) in Livingston Co.  The Democratic percentage goes down, but the seat remains safe for a Democrat.

So that’s my plan for New York.  Thanks.