Graphic Anatomy of Victory: Illinois (w/maps)

his is the eight in a series of diaries depicting the Democratic victory in this year’s midterm elections. Other diaries in this series can be seen here.

Already covered have been New England, NY, NJ, MD, and DE, PA, OH, IN, MI, and Wisconsin.

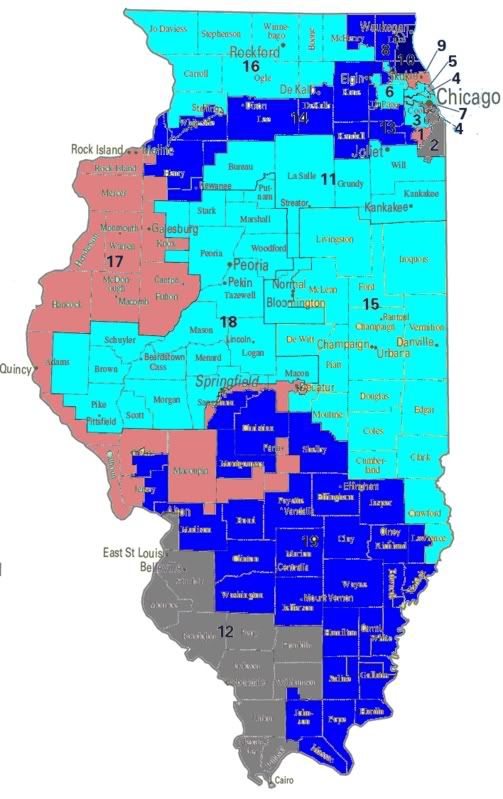
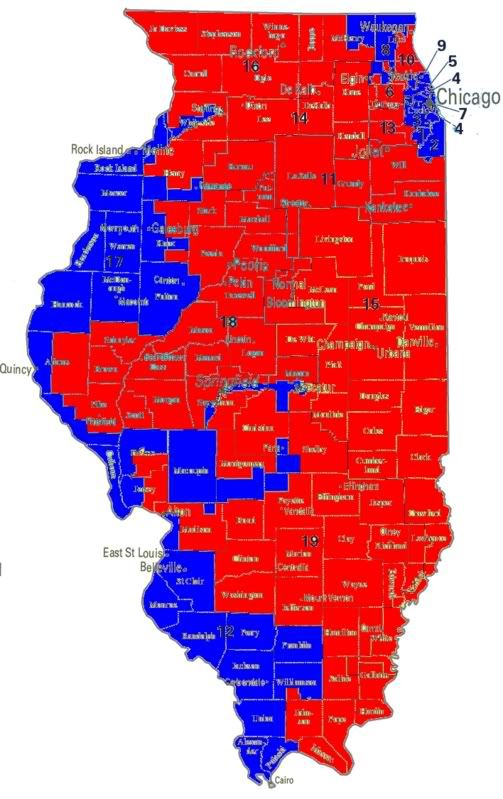
Today’s diary will focus on Illinois. As always first up are the seat control maps, no seats changed hands in Illinois.

Illinois
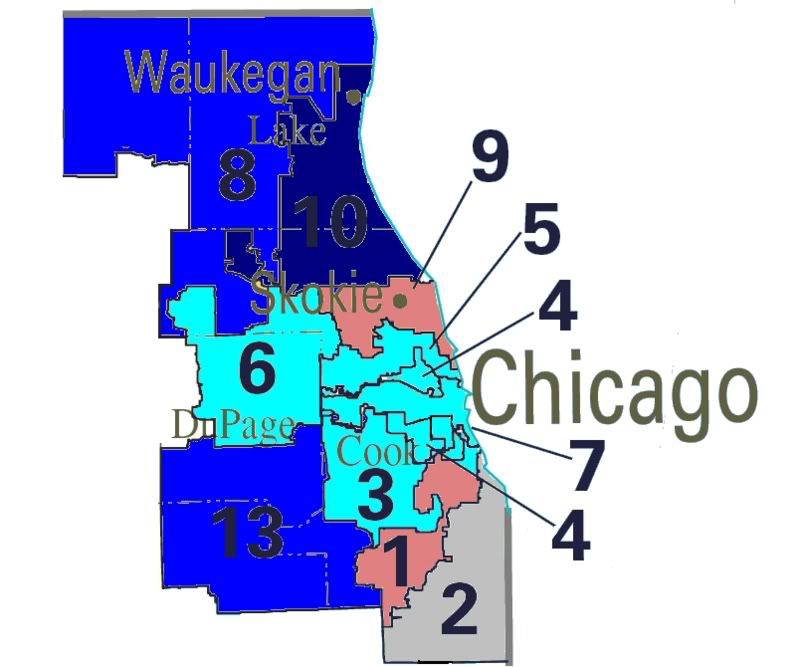
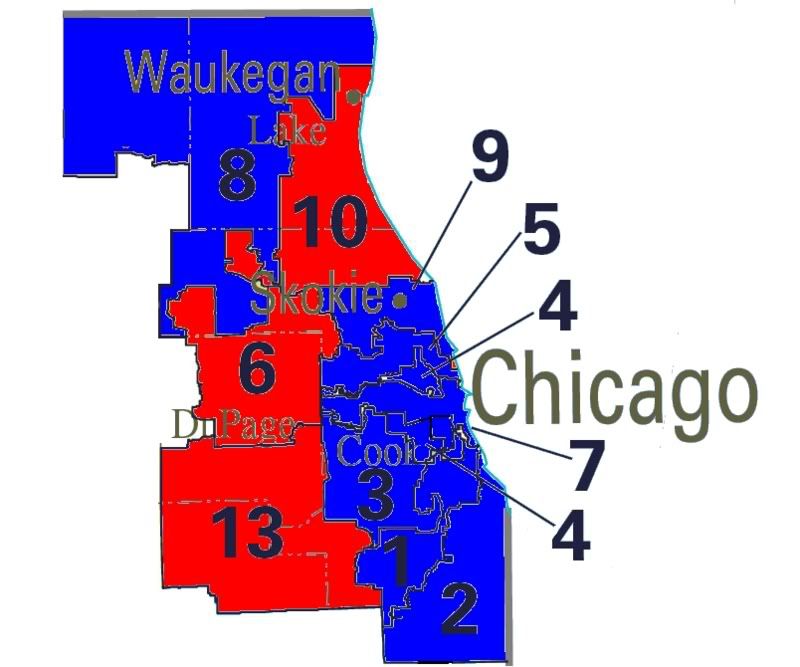
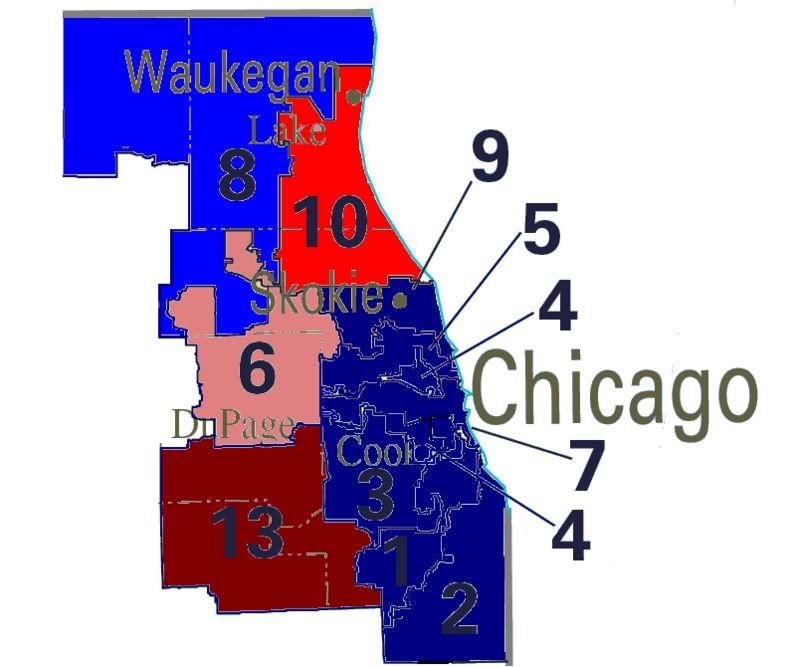
Chicago Metro Area
 

Of the 3,453,132 votes cast in the 2006 US House races in
Wisconsin,  1,986,431  votes (57.5%) were cast for Democratic candidates, while 1,443,076 votes (41.8%) were cast for Republicans.  Including unopposed races that Democrats had an 15.7% vote total advantage, a 3.9% improvement over 2004.  

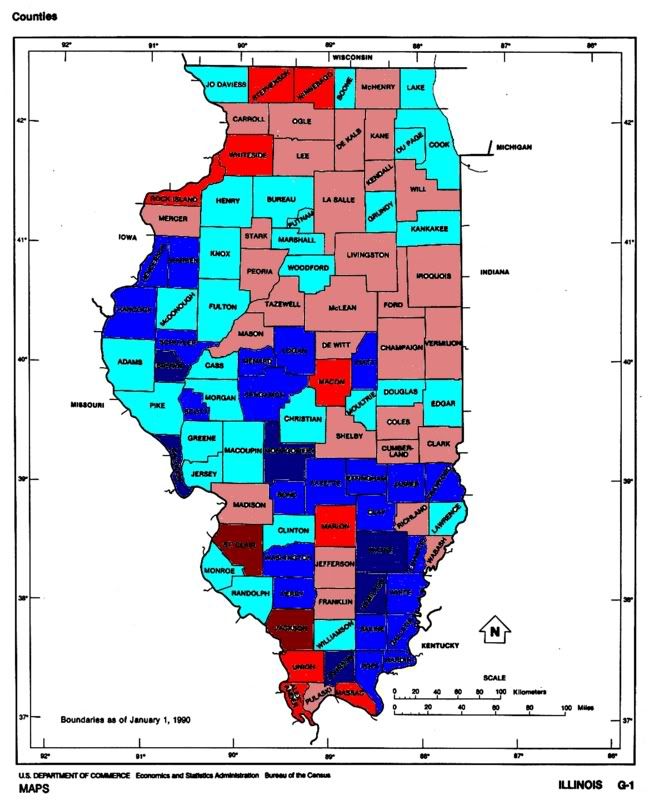
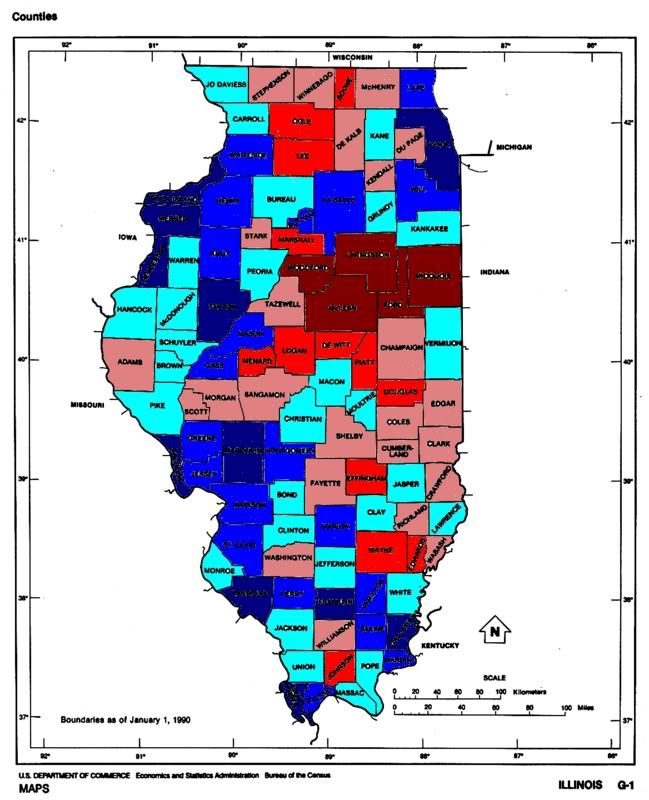
2006 Vote Margins

The deepest blue indicates a Democratic vote share over 60%, medium blue 55-60%, light blue 50-55%, pink 45-50%, medium red 40-45%, deep red 40% or less.

As is clear from the map Cook county (Chicago) is both a Democratic powerhouse, and is not clear Cook County is by far the most populous county in the state.  With 2,710,118 registered voters, Cook County is home to over 1/3rd (36.7%) of registred voters in Illinois. Expanding to the full Chicago MSA (Metropolitan Statistical Area, includes Cook, DeKalb, DuPage, Grundy, Kane, Kendall, Lake, McHenry, and Will counties) the Chicago area is home to 4,530,906 voters, or 61.4% of the state’s
registered voters. Excluding the Chicago area, Illinois bears a strong resemblance to Ohio and Indiana, with Republican areas in the center of the state, and ancestral Democratic districts in the southern part of the state.

The two closest races in the state were located in Chicago’s northwestern suburbs. In the closest race, the IL-06, Republican Peter Roskam scored a narrow  4,810 vote margin (2.7% ) over Iraq war vet Tammy Duckworth. In the IL-10, Democrat Dan Seals was defeated by Republican incumbent Mark Kirk by  14,731 vote margin (6.8%).  

Turning to vote shar gainse between the 2004 and 2006 elections, the IL-10 saw the Democratic vote share surge.

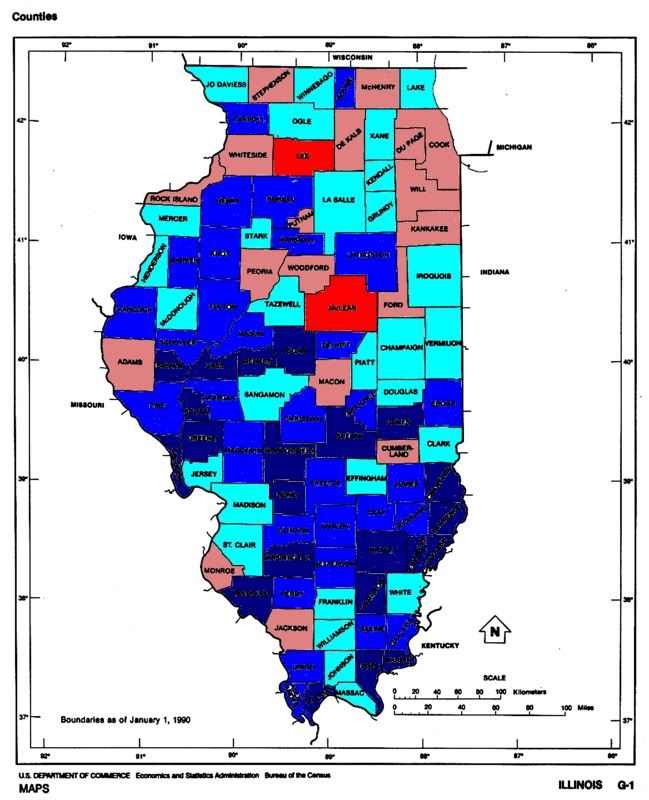
2006 Vote Gains

The deepest blue indicates a Democratic vote gain of over 10%, medium blue 5-10%, light blue 0-5%, pink 0 to -5%, medium red -5 to -10%, deep red -10% or less.

The IL-02 and IL-12 are both grayed out because in one of the two years the district was uncontested. Again, the most impressive Democratic vote gain was in the IL-10 where the Democratic vote share rose from 35.7% in 2004 to 46.6%.  As well, Democrats in both the IL-14 and IL-18 saw the Democratic vote share rise by 6.8%, with Democratic candidates raising vote totals from the low
30’s in 2004 to just around 40% this year. In general, while the Chicago area is largely a static area as Democratic vote shares top out as the area has been transformed to a Democratic stronghold, downstate and in the river counties there is a still a large potential for growth.

As a result of this dynamic, further gains in the Chicago area will likely come from get out the vote campaigns, while downstate populist economic messages might offer the potential to convert rural Republicans worried about the exodus of factory jobs that have hit the state.

Looking at differences in turnout between 2004 and 2006, something very important about the Chicago area emerges.

2004
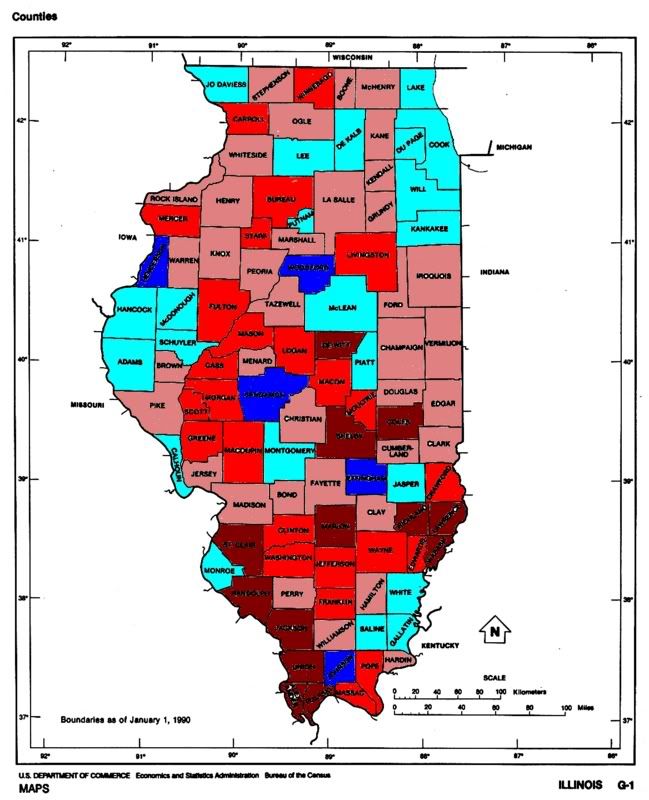
2006

These maps show deviation from statewide turnout. The deepest blue indicates a turnout of 10% or more over the state average, medium blue 5-10%, light blue 0-5%, pink 0 to-5%, medium red -5 to -10%, deep red -10% or less of the statewide turnout average.

Statewide turnout in the 2006 election was 48.6%, a 22.7% drop off from the 2004 turnout at 71.6%.  The most obvious change between the two years comes in the Chicago area with turnout in Cook County and neighoring DuPage and Will counties turnout dropping by more than a quarter. With victory in the Chicago are largely falling to the effectiveness of campaigns in turning out the vote, this augurs well for Democratic opponents in the IL-06 and IL-10 in 2008.  As turnout in these counties increases due to the presidential election in 2008, Democrats downticket in the Chicago area stand to benefit.  Looking at this another way, below I’ve created a map that demonstrates the midterm dropoff.


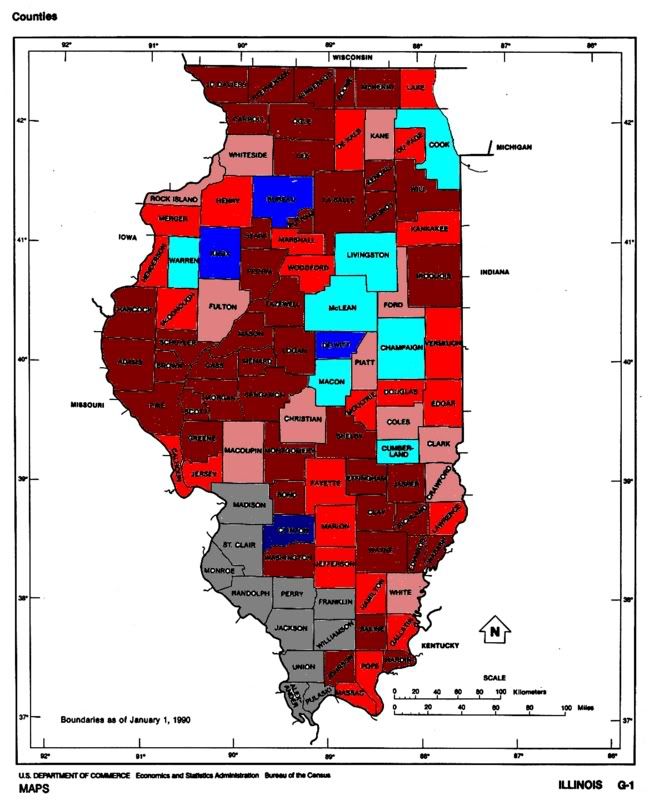
Midterm dropoff
Shading indicates deviation from 2006 statewide dropoff of 22.7% from 2004 election. The deepest blue indicates a dropoff of 10% or more over the state average, medium blue 5-10%, light blue 0-5%, pink 0 to-5%, medium red -5 to -10%, deep red -10% or less  

On this map, the more blue the county is shaded the less variation in turnout between 2004 and 2006.  More so than the other maps this shows the magnitude of the midterm dropoff effect in the Chicago area.  While turnout in Chicago are dropped by more than a quarter, downstate while turnout did drop, it did so only by about 10%.  Thus, the biggest driver behind the midterm effect in Illinois was the Chicago region.  Basically, what emerges is a divide between urban Chicago where turnout determines who wins elections, while downstate victory will depend on the ability of Democrats to win over enough Republican voters to overcome the slight Republican lean of much of the region. Using the vote share totals from the Comptroller, Secretary of State, and Treasurer races, I’ve created a measure of base Democratic performnace,which I’ve mapped below.

The deepest blue indicates a base Democratic vote share over 60%, medium blue 55-60%, light blue 50-55%, pink 45-50%, medium red 40-45%, deep red 40% or less.

Top 5 Democrat Counties

County        % DEM  Region

Cook        74.6%  Chicago
Gallatin    68.0%  Southern
Calhoun        65.0%  Western
Rock Island    64.5%  Western
Alexander    64.1%  Southern

Bottom 5 Democrat Counties       

County        % DEM  Region

Ford        31.5%    Central
Iroquios    33.4%   Central
Livingston        34.2%    Central
Woodford    35.0%   Central
McClean        39.6%   Central

Again, Cook County emerges as the deepest blue part of the state.  Other areas of Democratic strenght can be found in the Rock Island, East St Louis, and Cairo areas. Republican strenth is concentrated in the east central area of the state, with most of the red areas of the state being competitive.  Slightly more than 5% of Illinois voters live in counties where Republicans, as measured by base partisanship, constitute more than 55% of the electorate.  While Democrats have grown incredildly strong in the Chicago area, for the most part in the rest of the state Democratic congressional candidates significantly underperformed the base partisanship.

Congressional Democratic Performance
The deepest blue indicates a Democratic congressional vote share over 10% or more over the base, medium blue 5-10%, light blue 0-5%, pink 0-5%, medium red -5-10%, deep red -10% or less.

Counties included in the IL-12 are grayed out because the Democrat in that district ran unopposed.  Looking at the state, it’s clear that Democratic candidates have significant room for growth throughout the state.  The measure of base partisanship I’ve constructed is the mean of three low profile state races where voters most often vote for the party rather than the person.  While many people use the Presidential or Governor vote share as a measure of partisanship, that is misleading.  Because the purpose of a measure of base partisanship is measure the effect of party cues on voters, yet in those high profile races party cues play very little role in determining vote choice. In low profile state races party cues constitute the principal way in which voters choose who to vote for.

Looking back on what we’ve covered today, two themes emerge.  

1. Chicago is a mature electorate.  In Cook County, Democrats are dominant, and the large dropoff in midterm elections augurs well for 2008.

2.  In the rest of the state, Democrats are underperforming by a large margin.  Voters who lean Democratic, voting for Democratic candidate for Secretary of State, Comptroller, and Treasurer, are not voting for Congressional Democrats. Democrats took 57.8% of the state’s congressional vote, and constitute 60.3% of the state’s electorate when using base partisanship measures. If Democrats succeed in breaking through to rural voters who choose Democrats for low profile races, but give their vote to Republicans for Congress 2-3 seats above and beyond those identified earlier could come into play.

In this series I have created a race tier system that is I will explain in the next few sentences. Tier 0 races are those where the Democratic candidate won by a margin of less than 5%, the presumption being that incumbency grants an advantage of 5-10% that with the fundraising advantage that comes with holding office should be sufficient for these candidates to defend their seats without funding from the party.  The assumption that incumbency gives a 5-10% advantage drives the classification of the pickup categories.  Tier 1 races are those where the incumbent won by less than 5% in 2006, while tier 2 races are those where Republicans won by less than 10%. Looking at Illinois there is one Tier 1 race, and one Tier 2 race.

Tier 0

Race   D%       R%        Margin        2006 D Cand.

No races meet the criteria for this tier.

Tier 1

Race      D%      R%     Margin    2006 D Cand.

IL-06     48.6    51.4   2.7%      Tammy Duckworth

Tier 2

Race      D%      R%     Margin    2006 D Cand.

IL-10     46.6    53.4   6.8%      Dan Seals

And finally the running totals for the series.

Tier 0 (5)

CT-02, NY-19, NH-1, IN-09, WI-08

Tier 1 (10)

CT-04, IL-06, NJ-07, NY-25, NY-26, NY-29, OH-2, OH-15, PA-06, MI-07

Tier 2 (5)

OH-01, PA-15, IL-10, IN-03, MI-09

States Covered

CT, IL,IN, MA, MD,ME, MI, NH, NJ, NY, OH,PA, RI, WI, VT
PA-18: Tim Murphy (R) Under Federal Investigation

The scandals just never end.  According to local media, Republican Rep. Tim Murphy of Pennsylvania is under federal investigation surrounding allegations that some of his legislative staffers were forced into doing campaign work on government time:

According to the congressional ethics manual, campaign matters must be handled by a separate staff.

But some former workers say that wasn’t the case.

“There were several times when staff was asked and basically pressured into doing campaign activities,” said Jayne O’Shaughnessy, a former staffer for Murphy.

Documents obtained by KDKA at least suggest that.

One document is a campaign planning timeline, which appears to require “D.O.” meaning district office employees go door-to-door.

It’s a document that Murphy took from KDKA Investigator Andy Sheehan when he showed it to him in November.

“This is my personal materials. I don’t know how you got this, but this is my personal materials. I’m taking it back,” said Murphy.

Just in case you forgot about that wonderfully absurd moment last month wherein Congressman Murphy “reclaimed” his “personal materials”, check out this hysterical news clip on YouTube.

Murphy’s district, the 18th, has a slight Republican lean (Cook rates it as R+2.2), but Clinton won this area handily in the ’90s.  I would suggest that recruiting a strong challenge to Murphy should be high on the To Do List of local and state Democrats for 2007.

(Thanks to walja for the scoop.)

Graphic Anatomy of Victory: Wisconsin (w/maps)

This is the eight in a series of diaries depicting the Democratic victory in this year’s midterm elections. Other diaries in this series can be seen here.

Already covered have been New England, NY, NJ, MD, and DE, PA, OH, IN, and Michigan.

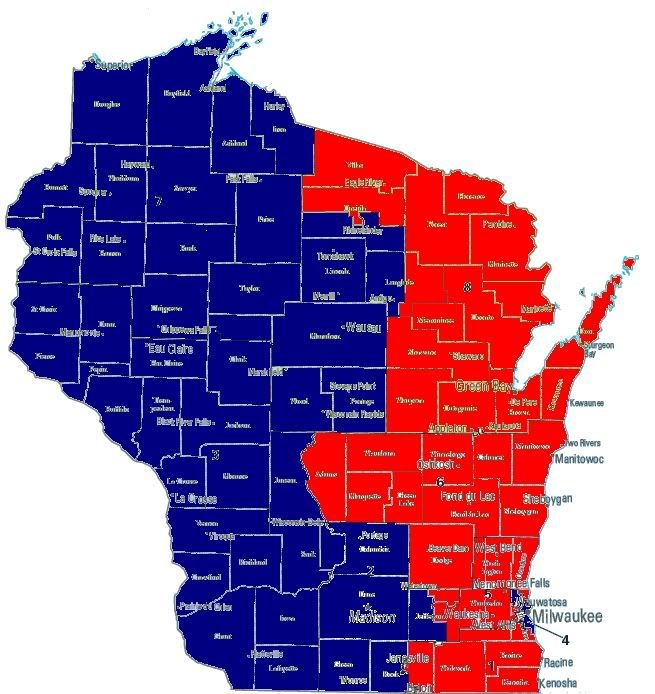
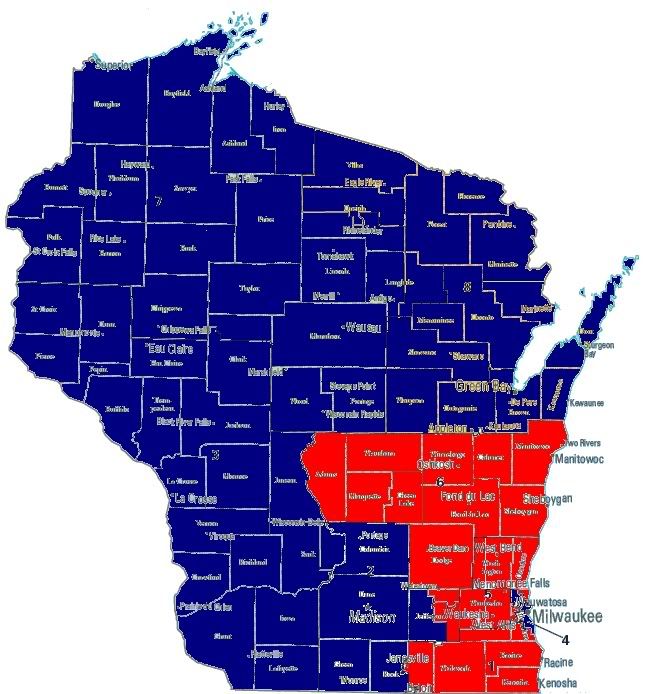
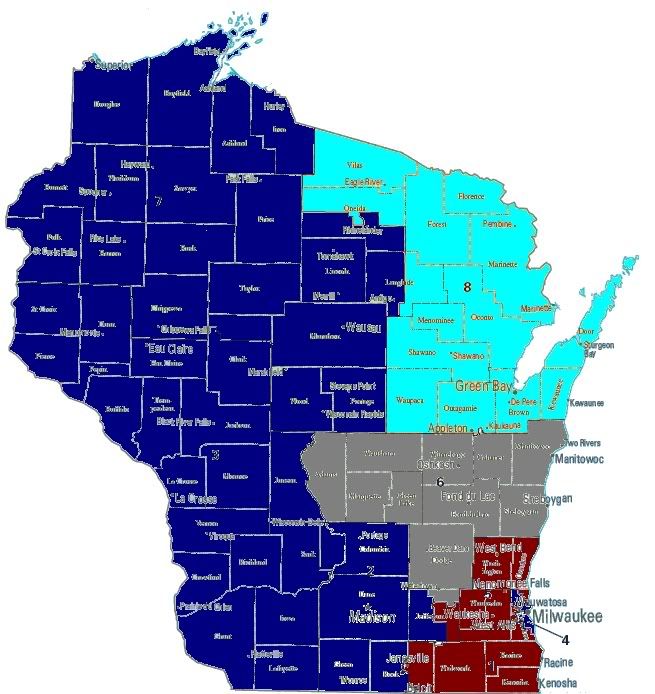
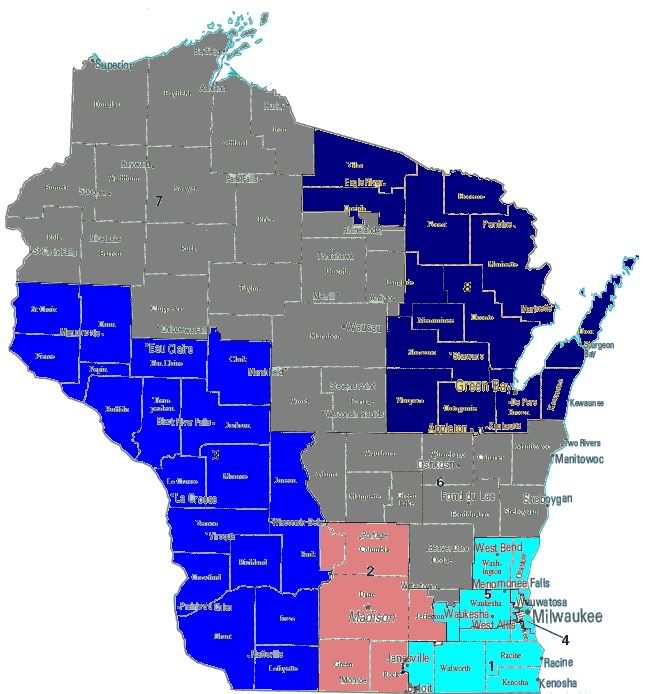
Today’s diary will focus on Wisconsin. As always first up are the seat control maps.

2004

2006

Of the  1,852,619 votes cast in the 2006 US House races in Wisconsin,  1,001,254 votes (54%) were cast for Democratic candidates, while  836,054 votes (45.1%) were cast for Republicans.  Including unopposed races that Democrats had an 8.9% vote total advantage, a 5.1% improvement over 2004.  

2006 vote totals for the the race in the WI-06 are not currently available online, so the numbers above don’t include that district.

2006 Vote Margins

The deepest blue indicates a Democratic vote share over 60%, medium blue 55-60%, light blue 50-55%, pink 45-50%, medium red 40-45%, deep red 40% or less.

Democrat Steve Kagen won in the open seat in the WI-08 defeating Republican State Assembly Speaker John Gard by 6,608 votes (2.4%).  This represents a 21.4% surge over the 2004 Democratic vote share (29.8%) in this district.  Coming in at over $4 Million , Democrat Steve Kagen spent $1.7 Million of his own money outspending Republican John Gard by over $100,000.

All other races in Wisconsin were won by margins of over 10%.

2006 Vote Gains

The deepest blue indicates a Democratic vote gain of over 10%, medium blue 5-10%, light blue 0-5%, pink 0 to-5%, medium red -5 to -10%, deep red -10% or less.

2006 vote totals for the WI-06 where the Republican went unchallenged are unavailble, and the WI-07 is grayed out because there was no 2004 Republican challenger.

The most impressive vote gain was in the WI-08 as was mentioned above. In the WI-02, there was a 0.4% shift towards the Republican, while  Democrats made an 8.4% gain in the WI-02, yielding  much large Democratic margin of victory than in 2004.  In the Milwaukee suburbs, Democrats made 4.8% and 4% gains in the WI-01 and WI-05 respectively.  However, the Republican margin of victory in these districts was over 25% in 2006.

In this series I have created a race tier system that is I will explain in the next few sentences. Tier 0 races are those where the Democratic candidate won by a margin of less than 5%, the presumption being that incumbency grants an advantage of 5-10% that with the fundraising advantage that comes with holding office should be sufficient for these candidates to defend their seats without funding from the party.  The assumption that incumbency gives a 5-10% advantage drives the classification of the pickup categories.  Tier 1 races are those where the incumbent won by less than 5% in 2006, while tier 2 races are those where Republicans won by less than 10%.  It’s really quite simple.

Tier 0

Race   D%       R%        Margin        2006 D Cand.

WI-08  51.2%   48.8%      2.4%          Steve Kagen  

Tier 1

Race      D%      R%     Margin    2006 D Cand.

No races meet the criteria for this tier.

Tier 2

Race      D%      R%     Margin    2006 D Cand.

No races meet the criteria for this tier.

And finally the running totals for the series.

Tier 0 (5)

CT-02, NY-19, NH-1, IN-09, WI-08

Tier 1 (9)

CT-04, NJ-07, NY-25, NY-26, NY-29, OH-2, OH-15, PA-06, MI-07

Tier 2 (4)

OH-01, PA-15, IN-03, MI-09

States Covered

CT, IN, MA, MD,ME, MI, NH, NJ, NY, OH,PA, RI, WI, VT
Senate Recruitment Thread #3 (NC, NE, NH, NM, OK)

Alright, let’s keep the ball rolling here.  Every Thursday, the Swing State Project is taking a look at five GOP-held Senate seats that are up for grabs in 2008, and asking you to submit your recruitment suggestions for each of these races.  (The first one was here and last week’s was here.)

Here is this week’s shortlist up for discussion.  Links are to the 2008 Race Tracker wiki for inspiration, and incumbents are in parens:

11) North Carolina (Elizabeth Dole)

12) Nebraska (Chuck Hagel)

13) New Hampshire (John Sununu)

14) New Mexico (Pete Domenici)

15) Oklahoma (James Inhofe)

Like David said the first time:

Don’t limit yourself to politicians. Businesspeople, community leaders, activists – even athletes or celebrities (think Heath Shuler or Al Franken) – are all fair game. Even seemingly outlandish suggestions are welcome. Would you have ever predicted that the guitarist from Orleans would now be a Congressman-elect?

However, as usual, please do limit yourself to the five races listed in this post.  I know everyone is excited to discuss the whole load of upcoming races, but the quality of discussion is enhanced greatly when we stay focused on just a few Senators at a time.  I’ve really enjoyed some of the suggestions that you have submitted so far.

So, whaddya got?

LA-Gov: Ouch

From the Political Wire:

The AP: “Call it a sign of the times for Louisiana’s embattled governor: A chance to dine with Gov. Kathleen Blanco fetched a winning bid of $1 at a recent fundraising auction hosted by a group of business leaders.”

I’ll lay it all down on the table: with one of the worst approval ratings for Governors (a 58% disapproval rating), and a serious challenge from Rep. Bobby Jindal (R) on its way for 2007, Gov. Blanco should seriously be considering facing the music and clearing the field for someone else to fight this one.  I’m not quite convinced that Democrats can hold this seat either way, but at least with Blanco off the ticket, the loss wouldn’t be quite as embarrassing.

Update: Okay, okay–I missed the part where “bidding abruptly closed” after the opening bid was accepted, shutting out other bidders.  What kind of nastiness is that?  But I still stand by the assertion that Blanco is DOA if she stays on for next November’s election.  She should bow out to save face.

SD-Sen: Keep Tim Johnson in Your Prayers

Courtesy of Hotline on Call:

Admiral John Eisold, Attending Physician of the United States Capitol said, “Subsequent to his admission to George Washington University Hospital yesterday, Senator Tim Johnson was found to have had an intracerebral bleed caused by a congenital arteriovenous malformation. He underwent successful surgery to evacuate the blood and stabilize the malformation. The Senator is recovering without complication in the critical care unit at George Washington University Hospital. It is premature to determine whether further surgery will be required or to assess any long term prognosis.”

Barbara Johnson, wife of Senator Johnson, said, “The Johnson family is encouraged and optimistic. They are grateful for the prayers and good wishes of friends, supporters and South Dakotans.

“They are especially grateful for the work of the doctors and all medical personnel and GWU hospital.”

Now is not the time to engage in ghoulish speculation over the consequences for Senate control, especially this close to the holidays.  Let’s just keep the Senator and his family in our thoughts and prayers in this trying time.

AR-Sen: Drew Pritt Not Running

Well I took nearly two months to survey a possible Senate bid. There is not a way for me to run and to win. The options are either I would lose in the primary, at best taking a third of the vote. The second option is I would win and splinter and fracture the party so much that it would take a decade or more to heal the damage. The third option is that Mike Huckabee could exploit either the first or second option to run for U.S. Senate. I am not prepared to allow any of those things to happen.

Also, unfortunately, financially I am not in a position to run or raise the money to run. Finally, the Chairman of the Arkansas Democratic Party is a good friend and someone who I admire and trust. If Jason Willett says don’t do it, I am inclined to listen, because he is a close friend.

Finally, its just not in the cards. Yes, I am mad about Mark Pryor voting the way he has voted. But unfortunately, I cannot raise the money it will take to defeat him and defeat a savvy, well-funded, Republican like Mike Huckabee in the fall.

There will be those who will get on the blogs, who do not know me, who already have attacked my character with lies and say they knew all along I would not run. You’re damned if you do and damned if you don’t with these morons. At the end of the day, a person has to look in their heart, and say am I doing the right thing?

Our democracy, and the ability to get people to run for office, is sadly becoming like this UCC Ad – http://ga3.org/ucc2/…

* We are endowed to continue to maintain democracy in our own nation. But when demagogues, and individuals with hidden agendas use tools like the internet to attack others with whom they disagree, we have a problem.

* When the value of a Senate or House candidate is not the force of their ideas but the power of the purse and their ability to raise money, we have a problem.

* When our system of government deviates from checks and balances to which lobbying group and which issue is the flavor of the month, we have a problem.

* When we refuse to acknowledge the first three problems and not hear the words of those who warn us of impending danger, we have a problem.

I will stay active. I will be a part of the process. One day, we shall overcome.

A Graphic Anatomy of Victory: Michigan (w/maps)

This is the sixth in a series of diaries depicting the Democratic victory in this year’s midterm elections.

Already covered have been New England, NY, NJ, MD, and DE, PA, OH, and Indiana.

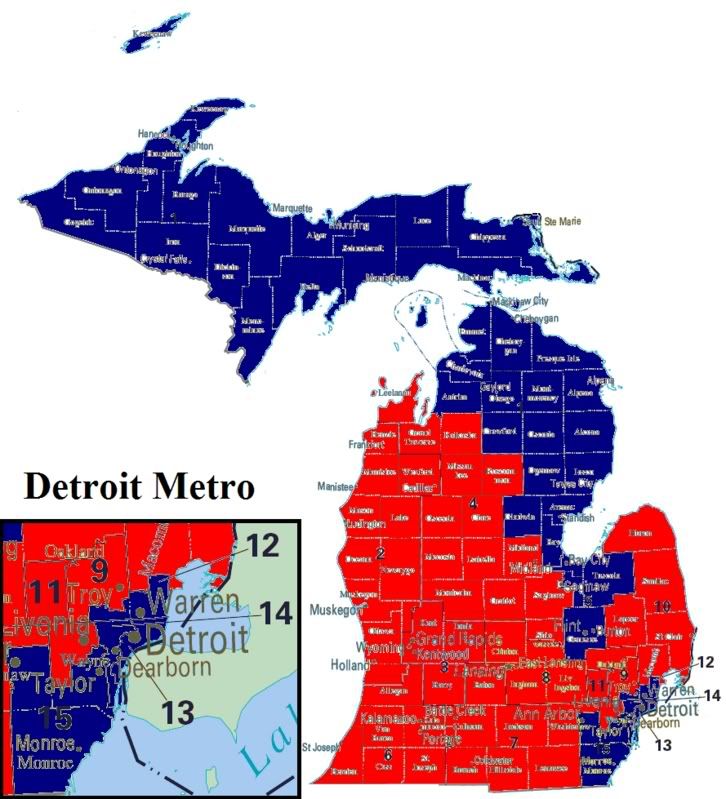
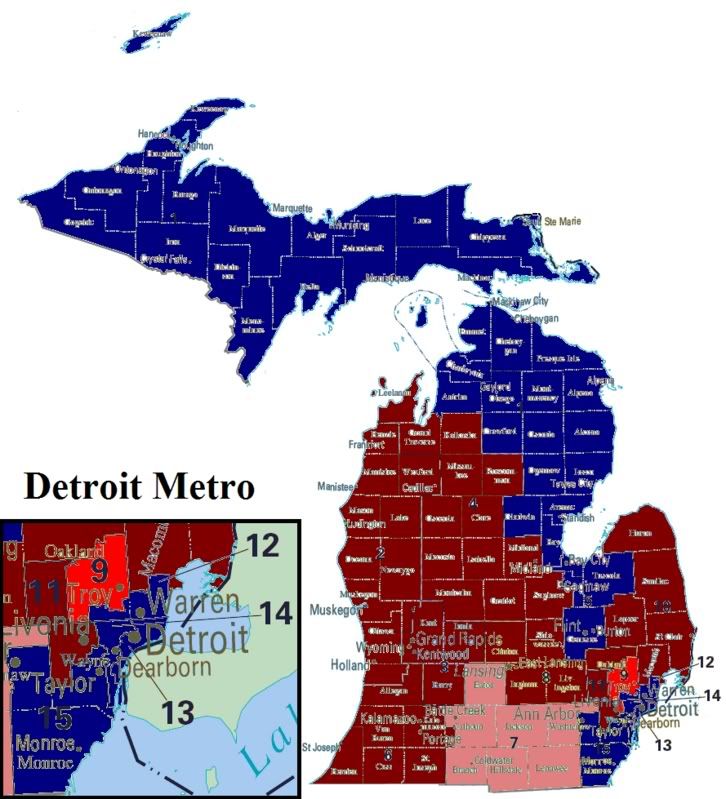
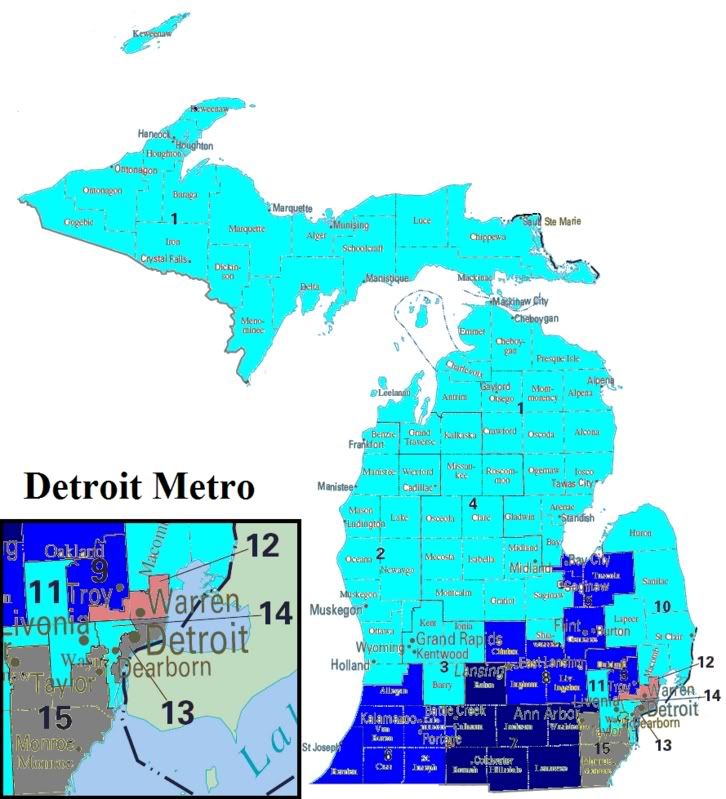
Today’s diary will focus on Michigan.  As always first up are the seat control maps, and in this case there’s only one map because no seats changed hands in 2006.

2004 & 2006

Of the  3,646,436 votes cast in the 2006 US House races in Michigan,  1,922,808 votes (52.7%) were cast for Democratic candidates, while  1,626,399 votes (48.4%) were cast for Republicans.  Including races that the Repubicans didn’t oppose in 2006, this represents a 4.1% shift from 2004, excluding the two Detroit races Republicans choose not to oppose in 2006 the modified Democratic vote share at 48.4% represents a 3.1% shift  over totals in the same 13 races in 2004. As stated above no seats changed hands.

Democrats took 6 (40%) of Michigan’s 15 Congressional districts while winning 48.4% of the state Congressional vote, rising to 52.7% if totals from the two Detroit districts left unopposed by Republicans are included. If seats were apportioned according to vote totals, i.e. proportional representation,  Compare this to Indiana where Democrats took 55.5% of the state’s Congressional seats while winning only 48.5% of the state Congressional vote.  

The difference?  

Democrats controlled redistricting in Indiana, while Republicans controlled the redistricting process in Michigan in 2000. While Democrats control both the governor’s offices and the Michigan House, Republicans retained control of the Michigan Senate.  With the redistricting process controlled by the legislature, this points to the need to put the press on Republican Michigan Senators for 2008.  However, attmempts at redistricting at this point probably would do more harm than good.  Using the fairer Democratic performace standard I’ve created below, we find that statewide Democratic performance  is at 51.8% which if reflected in the distribution of Congressional seats would create two new Congressional seats for the Democratic party.

The 50 State Strategy can’t be a one hit wonder, we have to work to get Democratic candidates elected at all levels.  If we do we’ll have strong candidates to run for office in other races.  We need to build a farm league, officeholders who’ve already represented part of the district at a another level of government who can run for Congress.  Half the fight for a challenger is getting the public to recognize your name.  If you’ve got someone who’s familiar from having already held office you’ve got a running start.  This is how the Republicans win, they build up networks that stay in place long after any one race has been finished.  

Senators and Congressional representatives who have large warchests should be asked to pay an apportionment to state parties.  And we need strong competition within the party organization to ensure that state parties aren’t controlled by a few wealthy donors to the detriment of the working public.

Returning to Michigan, there’s hope that we can take two Congressional districts without redistricting.  While there were no Congressional pickups in Michigan, Democratic candidates came within striking distance in the MI-07 and MI-09.


2006 Vote Margins
The deepest blue indicates a Democratic victory of over 60%, medium blue 55-60%, light blue 50-55%, pink 45-50%, medium red 40-45%, deep red 40% or less.

In the MI-07, Club for Growth Republican candidate Tim Walberg defeated the incumbent Republican candidate Joe Schwarz in the August primary. Walberg’s campaign faced contreversy in late October when a local paper revealed that a Walberg aide had pled guilty to child abuse charges in September.  Walberg won with a narrow 10,0017 (4.1%) margin over Democratic candidate Sharon Marie Renier.  While measures of base partisanship show that the western edge of the district leans Republican, vote totals from the Governor’s race show the impact that a high profile race with a winning message can have in the area, turning red to blue.

The second pickup opportunity for 2008 lies in the in the I-09 where incumbent Republican Joe Knollenberg faced a strong challenge from Democratic candidate Nancy Skinner.  Despite winning his district by a 18.9% margin in 2004, a poll taken in August showed Knollenberg in deep trouble.  Well under 50%, Knollenberg was running at 44% to Skinner’s 40%.  In a district dominated by the auto industry, Knollenberg’s postions for NAFTA and steel tarriffs that hurt domestic auto production ran showed a disconnect with the people back home.  Knollenberg’s 14628 (5.3%) vote margin yielded a narrow 51.5% victory him, and a great big target on his seat for 2008.


2006 Vote Gains
The deepest blue indicates a Democratic vote gain of over 10%, medium blue 5-10%, light blue 0-5%, pink 0 to-5%, medium red -5 to -10%, deep red -10% or less.

If there’s a lesson to be learned from Michigan it’s that a Democratic message that focuses on confronting the very real problems presented by corporate globalization and the dismembering of state regulatory regimes that protected workers, consumers, and the environment is a winner. Our two greatest surges came in the already mentioned MI-07 where the Democratic candidate surged by 10.1% over the 2004 Democratic performance at 36.3%.  In the MI-09, Skinner rose 6.7% over the 39.5% Democratic candidate showing in 2004. We need a populist economic message if we want to make gains in 2008.

There’s a war brewing in the party right now because of this.
Sirota’s right when he goes after the lack of geographic diversity among the pundit class and the subsequent impact that this has on the polical dialogue in this country.  We need people like Sherrod Brown to make trade an issue.  Even more damning is the piece written by Gjohnsit noting that 27 of the 29 Democratic pickups this year came from the defeat of “free trade” Republicans.  And back in Michigan, our biggest gains came against Republicans toeing to neo-liberal economic policy framework that working people don’t want.  If the Democratic leadership and the pundit clases can’t get the message they need to have their asses shipped off to the unemployment line.  Turnabout’s fair play, let’s see how they like it when they spend a year without a paying job.

But the war in the party brews, I may have to stop to take a break from the Graphic Anatomy of victory series to give this  the treatment this deserves later this week.

The point is that Democrats can win in rural areas.  Looking at a map of base Democratic performance in Michigan we see that except for the Upper Peninsula, Democratic strength is largely held in the Detroit metro area.


2006 Base Partisanship
The deepest blue indicates a Democratic base partisanship of over 60%, medium blue 55-60%, light blue 50-55%, pink 45-50%, medium red 40-45%, deep red 40% or less.

The measure of base partisanship is predicated on a belief in the role of information in politics.  Basically, where voters are unfamilar with candidates and issues they rely upon party to make their decision.  Most of us have had the moment in the polling booth when we get down to low profile races like Clerk of Courts, and having not a clue to either the candidate’s running or the issues at hand we vote the only way we know how, by party designation.  I’m planning to develop a more thorough measure that looks for low profile state races where total spending per capita was low to calculate means that give us an idea of how people vote with no other information but party.

To create the measure I’ve displayed on the map above, I took  the mean of Democratic vote share (note that all races elect 2 candidates) in the Wayne State University Board of Governors, Michigan State University Board of Trustees, and University of Michigan Board of Regents races.

Top 5 Dem Michigan Counties

CTY         Area        Base Democratic Vote

WAYNE     Detroit       69.8%
GENESEE   Detroit       62.9%
GOGEBIC   Upper Pen.    60.5%
WASHTENAW Detroit       60.2%
MARQUETTE Upper Pen.    59.4%

As you can see Democratic strength is concentrated in the Detroit metro area, and the parts of the Upper Peninsula near Wisconsion.  The Upper Peninsula is was dominated by the mining industry at the beginning of the 20th century, and continues to have a large forestry industry.  Also this is the the only area in the US where a Finnish ancestry dominates.  In many ways the Upper Peninsula belongs more culturally and demographically to Wisconsin and Minnesota than it does to Michigan.

While the red swath in western Michigan may look unconquerable, results from the 2006 Governor’s race where Democrat Jennifer Granholm prevailed prevailed over Republican Dick DeVos.  Granholm took 56.3% of the vote with DeVos taking only 42.3% of the vote despite having spent  almost $40 million of largely his own money attempting to unseat Granholm.  De Vos is heir to the Amway fortune, and was attacked by the AFL-CIO for outsourcing Michigan jobs, and has a long record of support for neo-liberal economic policies on trade and education. Looking at the returns from the 2006 Governor’s race Granholm was able to garner strong support in strongly Republican areas.


2006 Governor’s Race
The deepest blue indicates a Democratic victory of over 60%, medium blue 55-60%, light blue 50-55%, pink 45-50%, medium red 40-45%, deep red 40% or less.

Granholm’s most dramatic gains were in the Upper Peninsula where she outperformed the base Democratic vote by 16.1% in Luce county, and in the Kalamazoo area where she performed 9.6% over the base Democratic vote.  Statewide Granholm only performed 4.6% over the base Democratic vote, however her overperformace was concentrated in Republican areas denying De Vos his Republican base.

Tier 0

Race      D%      R%     Margin    2006 D Cand.

No races meet the criteria for this tier.

Tier 1

Race      D%      R%     Margin    2006 D Cand.

MI-07     46.4    50.5   4.1       Sharon Marie Renier

Tier 2

Race      D%      R%     Margin    2006 D Cand.

MI-09     46.2    51.5   5.3       Nancy Skinner

And finally the running totals for the series.

Tier 0 (4)

CT-02, NY-19, NH-1, IN-09

Tier 1 (9)

CT-04, NJ-07, NY-25, NY-26, NY-29, OH-2, OH-15, PA-06, MI-07

Tier 2 (4)

OH-01, PA-15, IN-03, MI-09

States Covered

CT, IN, MA, MD,ME, MI, NH, NJ, NY, OH,PA, RI, VT

TX-23: AP Calls it for Ciro Rodriguez

RODRIGUEZ DEFEATS BONILLA.

What a wonderful headline.

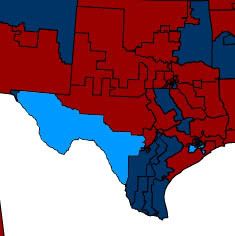
Update: Taking a cue from CNN, I’ve gone ahead and painted TX-23 a bright shade of blue on the map to signify a Republican-to-Democrat turnover:

Click on the image to see the full, 50-state carnage from Nov. 7 to today.  A big, bright slice of blue in Southwest Texas sure rounds things out nicely, doesn’t it?  Now, if only that troublesome greyish block in Florida could be taken care of…