MoveOn Punked by Chris Kelly over Facebook Privacy

I believe I used a Prodigy email address to sign an online petition calling on congress to “censure President Clinton and move on” back in 1998. As I’m sure you know, out of those efforts rose the organization MoveOn, which sent emails to my Yahoo account for years and to my gmail for the last six years or so. It has been one of my favorite organizations, through their ups and downs, for a decade.

Which is why I simply can’t fathom the blunder they made yesterday, thrusting themselves into the California Attorney General’s race to fluff former Facebook Chief Privacy Officer (best oxymoron ever) Chris Kelly. In the final days of the campaign, no less.

MoveOn’s fluffing of Kelly began yesterday morning when staffer Marika Shaub posted a link on MoveOn’s FB Group, “Facebook, respect my privacy!” Shaub urged the 180,000 members to share a note from Chris Kelly with all of their Facebook friends and later MoveOn sent an email to an unknown number of members of MoveOn’s giant list with Chris Kelly’s message (I received it twice).

As I long-time Moveon member and devoted supporter, I was shocked that MoveOn’s current leadership seems to have so little understanding of the dynamics and history of the battle for privacy. It was only back in 2007 that MoveOn went to war with Facebook, scoring a major victory for privacy by leading the organizing to shut down the infamous “Beacon” program. MoveOn was attacked repeatedly in the press by…Chris Kelly — who was not defending privacy, but defending Beacon. In fact, Kelly made so much money eroding privacy at Facebook that he’s dumped over $12,000,000 into his attempt to buy the California Democratic Party nomination for Attorney General.

If, like MoveOn apparently, you have forgotten how Chris Kelly fought MoveOn to defend Beacon, follow me after the jump. If you remember the history better than MoveOn, feel free to check out how Chris Kelly’s campaign is already using MoveOn as a validator — against attacks on Beacon, in the LA Times.

Here’s a reminder from The New York Times Chris Kelly fighting MoveOn to defend Beacon:

MoveOn’s demands could be satisfied by making the Beacon feature “opt in.” Right now, users who don’t want the information displayed need to opt out after purchases at each participating external site.

However, Chris Kelly, Facebook’s chief privacy officer, said MoveOn is “misstating the way this process works.”

He said the purchase appears only in the news feeds of confirmed friends and on the individual’s profile (users have control over who can see their profiles), not to the “world.” Mr. Kelly also pointed out that two ways to opt out, at the point of purchase on the external Web site, via a box that pops up, but fades away in under a minute and the next time they sign into their accounts. If users ignore the notification, the purchase information will be displayed, but nothing happens until the user signs in.

Chris Kelly was mocked for this over on ABC News’ site:

The argument made by Facebook in support of this is disingenuous, and uses that old trick I learned in my PR days of isolating one error in the opponent’s claim and using that to dismiss their entire argument. In this case, Chris Kelly, Facebook’s “chief privacy officer” (one of those new corporate titles that’s going to come back and bite companies) told the New York Times that MoveOn is “misstating the way this process works.” In particular, he said, the purchase is only shared with confirmed friends and on the user’s own profile, not to the “world.” At the same time, he does confirm, that if the user ignores the notification and fails to opt out, the purchase information will be automatically displayed.

And this coming from the Chief Privacy Officer of Facebook.

Chris Kelly’s attacks on MoveOn to defend Beacon made the hop across the pond, getting picked up by The Times:

A Facebook spokesperson said that MoveOn.org was “misrepresenting how Facebook Beacon works”.

He said: “Information is shared with a small selection of a user’s trusted network of friends, not publicly on the web or with all Facebook users. Users also are given multiple ways to choose not to share information from a participating site, both on that site and on Facebook.”

Earlier this year, Facebook shrugged off privacy fears when Chris Kelly, the group’s chief privacy officer, told The Times: “We have always said that information [submitted by users] may be used to target adverts.”

“Shrugged off privacy fears”?

Of course, Chris Kelly was mocked, MoveOn was right:

So far, about 13,200 out of over 55 million members have joined MoveOn’s protest group and Facebook is standing by the statements of chief privacy officer Chris Kelly, who told The Wall Street Journal that the company has been transparent with users and that it welcomes feedback from those who have concerns. According to the Journal, Kelly acknowledged that the company could change its policies based on customer reactions but that so far he says reaction has been “fairly muted.”

While the Beacon scandal was the most extreme example, the fact of the matter is user privacy was continually eroded at Facebook during the time Chris Kelly was in charge of privacy. Play with this interactive chart, click on the different years to watch what happened to privacy at Facebook.

Chris Kelly got amazing rich eroding privacy at Facebook, which MoveOn honorably fought. Until yesterday, when out of incompetence over the history of their own campaign and cluelessness over progressive politics in the largest state, they came to the aid of Chris Kelly during the final days of his $12 million vanity campaign.

Californians don’t want an Attorney General doing for Justice what Chris Kelly did for privacy. It would be nice if MoveOn were leading the charge against Chris Kelly, instead of giving him cover to defend himself against ads criticizing Chris Kelly for his role in the Beacon scandal…when he fought MoveOn.

Already this is being mentioned as an issue for November is California Democrats agree to allow Kelly to buy the nomination. Hopefully, that won’t be an issue after Tuesday.

CA-Primaries: Races to Watch

With the California primaries only days away, I decided to make a list of races worth watching this coming Super Tuesday. Cross-posted at Calitics and Democracy for California.

U.S. Senate (R) – Fiorina seems to have consolidated the “outsider” vote, seeing as she is the only one of the three that has not held elected office and it seems that being an outsider will get one far in the Republican primary (though not so much in a California general election).

Governor (R) – Exactly as I predicted, this race has unfolded to be 2006 in reverse. Whoever wins the GOP primary here will be so radioactive that many Republican voters likely will cross over to vote for Jerry Brown, like many Democratic voters did for Arnold last time. If Jerry Brown pulls similar numbers among Republicans that Arnold did among Democrats, then Brown is likely gonna win big. And I’m unsure about how indies will go, so I just went with an estimate similar to the 2006 numbers.

DEM 42%-GOP 33%-OTHER 25%

Brown: 93%/22%/60% = 61%

GOP nominee: 7%/78%/40% = 39%

Lt. Governor (D) – This race will be very interesting: a classic NorCal/SoCal matchup, between Gavin Newsom and Janice Hahn.

Lt. Governor (R) – Newly-appointed incumbent Abel Maldonado will face a tough primary with more conservative State Senator Sam Aanestad. Given that moderates have fared pretty poorly in California elections of late, I give Aanestad the edge.

Sec. of State (R) – Any race with the Birther Queen just has to be a race to watch, more so for the comedy value, though I think most Republicans don’t buy her BS, so I see Dunn getting the nomination. No matter who wins, Debra Bowen is likely a cinch for a second term.

Attorney General (D) – Very crowded primary here, with 3 term-limited Assemblymen, Torrico, Nava, and Lieu; S.F. District Attorney Kamala Harris; Facebook attorney Chris Kelly; and disgraced ex-L.A. city attorney Delgadillo, though the race seems to have narrowed to just Harris and Kelly. From what I have heard of Kelly, I am rooting for Harris.

Controller (R) – Not much drama here, but I am hoping for Tony Strickland to win so he can lose to John Chiang even worse than in 2006. Unfortunately, he is not up for reelection to the State Senate until 2012, so if he wins the nomination but loses the general, he will still be in the senate (hopefully until 2012).

Insurance Commissioner (D) – Here we have two strong candidates in term-limited assemblymen Hector De La Torre and Dave Jones. I have no preference in this race, but since Jones has more money and establishment backing, I think he’ll win the nod.

CA-11 (R) – Will David Harmer, who lost by only 10% in the more Democratic CA-10 in the special election (albeit with lower turnout) be able to make it past the primary against Tony Amador and be more competitive in the general?

CA-19 (D) – I am pulling for Loraine Goodwin here. Any campaign based on health care reform is a big winner in Democratic primaries and in general elections in most parts of the state. Not sure what the HCR numbers are in this neck of the woods.

CA-19 (R) – I think I will root for Denham here, as he has won in more Democratic turf, so he is relatively saner. (And Denham is term-limited, so CA-19 run or no CA-19 run, we have a great shot at winning SD-12.) Pombo shouldn’t really be of much concern, as he has placed a distant third in the recent primary poll.

CA-26 (R) – My hometown district, where Dreier faces a primary challenge from businessman Mark Butler. While I consider Dreier to be the heavy favorite, this primary challenge could further drain his campaign coffers. If he wins the primary, Dreier has the advantage of incumbency and a year more favorable to his party (though anti-Obama sentiment is much weaker in California than elsewhere). A disadvantage Dreier has is depleted campaign coffers, from spending like crazy to win only 52% against Warner in 2008 and possibly from this primary challenge.

CA-33 (D) – Former Assembly speaker Karen Bass is likely the heavy favorite, and I hope she wins.

CA-36 (D) – Harman/Winograd redux, only with more fireworks this time around.

CA-42 (R) – Even though Gary Miller’s voting record is unabashedly conservative, he is still getting teabagged by three other Republicans. Count on yet another incumbent scoring a subpar primary performance.

CA-45 (R) – Mary Bono Mack has drawn teabag primary opposition from Clayton Thibodeau for her vote for cap-and-trade. She also voted against repealing DADT in spite of her district having the highest concentration of gays of any Republican-held district, possibly out of fear of getting teabagged. If Thibodeau upsets Bono Mack, this Obama-voting R+3 district could be put into play.

CA-47 (R) – Will Tan and Van split the Vietnamese vote, allowing Kathy Smith to sneak through?

CA-50 (D) – I like Busby, but I think her time has passed, if she couldn’t beat Bilbray in the far more Democratic-favored 2006. Attorney Tracy Emblem seems to have most of the grassroots support.

AD-05 (R) – In this open, evenly-divided suburban Sacramento seat, the Tea Party has gotten into another Republican primary, backing Craig DeLuz against party-backed Prop 8 backer Andy Pugno. I am rooting for DeLuz to win the primary so in one election we defeat a Prop H8er and increase our chances of winning this district too.

AD-30 (D) – The Parra/Florez feud continues, with Nicole’s dad Pete Parra facing off against Dean’s mom Fran Florez, who lost to Danny Gilmore, who didn’t like being an Assemblyman and that’s why he’s not running, which I at first found surprising.

AD-36 (D) – Linda Jones, who ran here in 2008, faces primary opposition from real estate broker Maggie Campbell and police officer Shawntrice Watkins. This time I am rooting for Watkins, because this Antelope Valley-centric district is very law-and-order, being the home of the Runners (Sharon and George, of “Jessica’s Law” fame), and incumbent Steve Knight also having been a police officer before being elected to the Assembly. Watkins could cut into Knight’s law-and-order advantage. Plus Watkins’ endorsement from Equality California can’t hurt either.

AD-68 (D) and (R) – I am really looking forward to an all-Vietnamese matchup here. Will be interesting to gauge the Vietnamese vote if it’s Phu Nguyen (D) vs. Long Pham (R).

And what is a California election without some ballot measures? Five are on the ballot this time.

Prop 13: Tax break to property owners for making seismic retrofits. I like seeing tax breaks used as incentives for good causes. Vote YES!

Prop 14: Top two votegetters in the primary would go on to the general election, limiting voter choices. Vote NO!

Prop 15: Repeals ban on public financing and raises fees on lobbyists to fund a public financing system for SecState election beginning in 2014. Vote YES!

Prop 16: PG&E power grab that requires a 2/3 vote to create public power districts or allow local governments to purchase their own renewable power. Vote NO!

Prop 17: Weakens consumer protections and allow car insurance companies to charge much more for late payments. Vote NO!

Redistricting Maryland, Plan A

I’m finally publishing this; what follows is Answer Guy’s first attempt at redistricting Maryland.

The objectives:

Preserve the two majority-African-American districts, one based in Baltimore, the other in Prince George’s County, per Voting Rights Act requirements. Easy enough.

Give all seven current Democratic incumbents a similar or better chance to win re-election than the current districts allow, especially in the case of MD-01. That means preserving the existing base of each incumbent as much as possible.

Keep communities of interest together as much as possible, if not too inconsistent with the above.

Create districts that avoid the ungainly shapes that many of the current Maryland districts have.  

More below the fold…

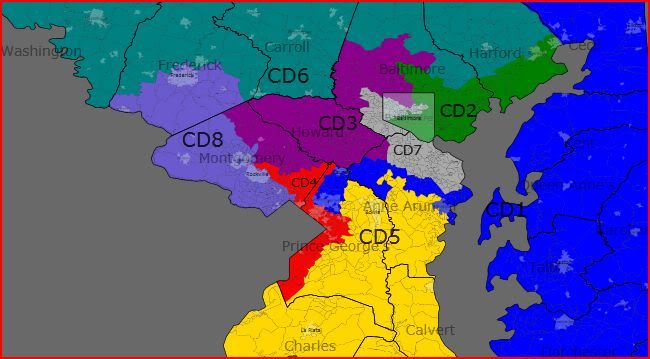
Map Overview

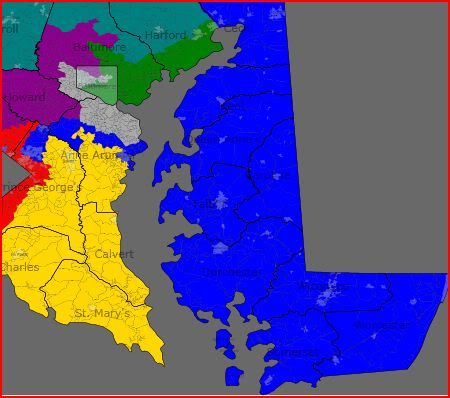
State Map

Note: Areas outside this map are in the districts you’d think they’d be in from the context.

First District

MD-01

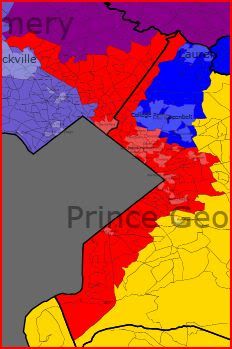
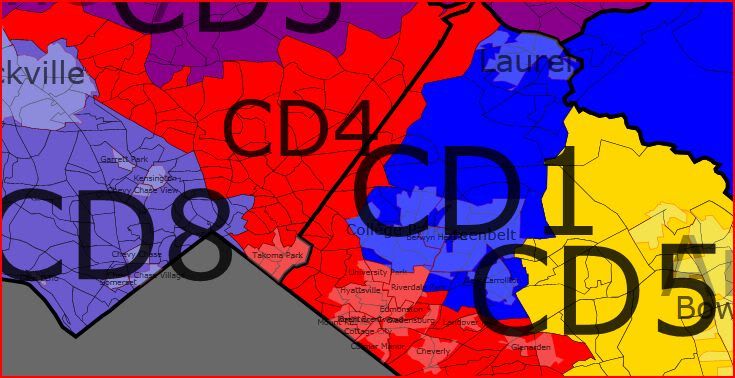
Description: All of the Eastern Shore counties – Worcester, Somerset, Wicomico, Dorchester, Talbot, Caroline, Queen Anne’s, Kent, Cecil; portions of Anne Arundel County (Annapolis, Fort Meade, portions of Odenton, East Laurel)  and northern portions (Laurel, Beltsville, College Park, Greenbelt, and New Carrollton) of Prince George’s County. Colored dark blue here.

Incumbent: Frank Kratovil (D-Stevensville)

(Note: Likely Republican MD-01 nominee Andrew Harris, who has at least a 50-50 chance of winning this November, doesn’t live anywhere near here, and the areas which supported him the most last time and will again this time aren’t either.)

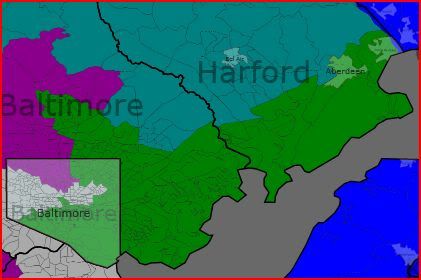
Map Change: This new MD-01 still includes the entire Eastern Shore of Maryland. But while the current MD-01 includes two chunks of land (one in Baltimore and Harford Counties, the other in Anne Arundel County) very heavy on Republicans; this MD-01 replaces those areas almost entirely (there are a few precincts in Anne Arundel in common) with territory very heavy on Democrats.  The Republican areas west of the bridges – which supported McCain in even higher numbers than the Eastern Shore did – got carved up. The Anne Arundel County portion got split, with most of it going to MD-07, but some portions going to MD-05. The Harford and Baltimore County portion got divided three ways, mostly into the new MD-06 but with small portions being picked up by MD-02 and MD-03.

1st District Pop Pct Wh Bl Hisp Asn Oth Oba McC

Shore 437958 62% 79 16 3 1 1 43 55

Anne Arundel 132950 19% 57 29 4 8 2 62 37

Prince George’s 133292 19% 33 43 13 9 2 82 17

Total 704928 66 24 6 3 1 55 44

Old District 662062 86 11 2 1 1 40 58

Projected PVI: D+2

The Good News:

This is the most altered district, and by design, turning a strong Republican district into a Democratic-leaning swing district.

This district is in a sense designed for a guy like Kratovil, who would attempt to simultaneously appeal to swing voters on the Shore to support one of their own and to the Democrats in the rest of the district. The western portion of the current 1st gave John McCain 65% of their votes; the western portion of the new 1st gave Barack Obama 68% of their votes. The Anne Arundel portion is relatively thin, mostly avoiding Republican-heavy areas in the county to reach a highly diverse and heavily Democratic chunk of northern Prince George’s County. Due to VRA compliance requirements for MD-04, this MD-01 contains only a handful of black-majority precincts (in the Landover and New Carrollton areas.) The changes would still more than double the black population of MD-01, and the Hispanic and Asian shares of the electorate also increase dramatically with the inclusion of many diverse Washington suburbs like College Park, Beltsville, Greenbelt, Laurel, and Odenton.  . Obama’s 55% showing may overstate the Democratic leanings of this district a bit – though Kratovil was able to run 10 points ahead of the national ticket at the same time, and now most of the areas that backed Harris in that contest have been removed from the district.

It’s not guaranteed not to ever elect a Republican, but it would be very difficult for an arch-conservative of the Club For Growth variety to get elected here.

The Less-Than-Good News:

On the surface, the changes are pretty much all positive for Dems. However…the potential electoral dynamics change dramatically on several levels. Because I also placed a priority on not significantly endangering any of the current Democratic seats, this isn’t a strong enough Democratic electorate to get rid of a Republican who exhibits some measure of cross-party and independent appeal, particularly during a Republican-leaning election cycle. The Eastern Shore, who represent 62% of the new district’s population, still prefers Republicans more often than not, and so do parts of the Anne Arundel County portion of the district. As I said above, the 55% showing for Obama is probably not a new normal and the partisan lean would lose a few points if non-white turnout regresses to levels more commonly seen prior to 2008.  

It’s not hard to imagine competitive Democratic primaries that pit moderates against progressives that could produce candidates that either swing voters or base voters might find unappealing. The Democrats of the current MD-01 generally lean conservative, but Democratic candidates in this MD-01 would have contend with a much more varied electorate. Kratovil, especially if he were no longer an incumbent, would almost certainly face a primary challenge from his left of some sort if he were to run here, given his voting record.  

The Shore would dominate Republican primaries, due to the lack of registered Republicans in the rest of the new district, to a point the dynamics that produce a candidate like Andy Harris (someone with trouble appealing to Shore residents or to swing voters in general) would be unlikely to materialize. GOP candidates would mostly come from the Shore and might be able to use that to their advantage.  

Ironically enough, Wayne Gilchrest almost certainly still be in Congress if he had this map two years ago; there’s no way a wingnut primary challenge would have succeeded, and he’d be tough to dislodge in a general election even in a good year for Democrats across the board like 2008. In a Republican year, it’s not hard to imagine some types of Republican winning here, though a guy like Harris would have no shot, and not just because it doesn’t go anywhere near where he lives.    

Fundraising might become a higher priority, as the new district lines cut well into the very expensive Washington media market. To reach the whole district would involve using both Baltimore-based and DC-based media. The current district, by contrast, doesn’t really include much of anything that one might describe as a proper DC suburb.  

The Bottom Line:

In a 2012 election with Obama on the ballot, with these lines, though it’s not a slam dunk by any means, I like Team Blue’s chances, whether with Kratovil or with someone else.

Second District

MD-02

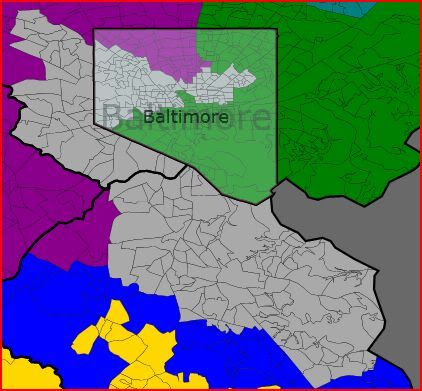
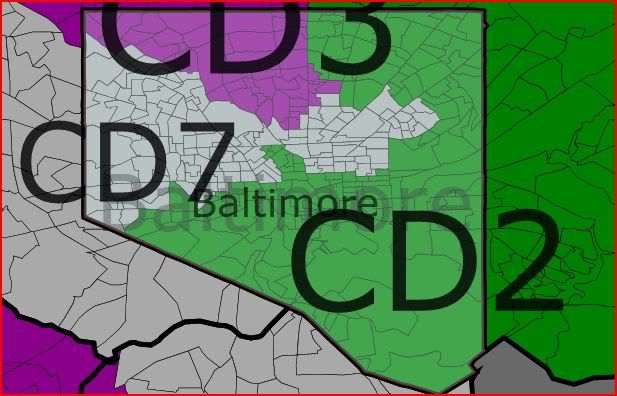
Description: Contains southern portions (Edgewood, Aberdeen, and Havre de Grace) of Harford County; eastern, northeastern, and north-central portions (Dundalk, Essex, Middle River, Parkville, Timonium, and Cockeysville) of Baltimore County;  and northeast, east, central, and southern portions of Baltimore City. Colored dark green here.  

Incumbent: C.A. Ruppersburger (D-Cockeysville)

(Note: Likely Republican MD-01 nominee Andrew Harris lives here, though most of his State Senate constituents don’t.)

Map Changes:

This new MD-02 has been made much more compact. It no longer contains any portion of Anne Arundel County and doesn’t go west of Cockeysville anymore, saying goodbye to the portions of Owings Mills and Reisterstown currently within its borders.  Containing much more of Baltimore City than previous versions of the district did, it’s now the district that includes most of the areas of Baltimore of interest to tourists – Federal Hill, the Inner Harbor/Downtown, Mount Vernon, Bolton Hill, Fells Point, Canton, Greektown, and Highlandtown. It also includes a bigger chunk of Northeast Baltimore than the current version does. The whole of southeastern Baltimore County is still here, and the Harford County portion is very similar (slightly smaller) to what is in the current district.

2nd District Pop Pct Wh Bl Hisp Asn Oth Oba McC

Baltimore City 277202 39% 45 47 4 2 1 82 17

Baltimore County 339213 48% 76 15 4 3 1 48 50

Harford 88267 13% 65 26 4 2 2 55 43

Total 704682 62 29 4 3 1 62 36

Old District 662060 66 27 2 2 1 60 38

Projected PVI: D+9

The Good News:

The addition of central Baltimore is the main reason that the new electorate moves two points to the Democrats, more than making up for the loss of some heavily Democratic northwest suburbs given to MD-03 and MD-07. This district does contain several city neighborhoods in outlying parts in northeast and far eastern Baltimore that are neither particularly liberal nor particularly Democratic, but also contains several mostly black precincts where the Republican share of the vote is in the low single digits.

The Baltimore County portion, about half the district, was carried by McCain, but many state and local Democrats, most notably incumbent Ruppersburger, have outperformed Obama significantly in these areas, particularly the East Side, in a development widely discussed in other SSP diaries about Maryland. And while Harford County as a whole may tilt Republican, the table above shows that the section of it included in MD-02 does not.

The Not-So-Good News:

This district may have been carried by Bob Ehrlich in his gubernatorial race in 2002 and looks more like the district he used to represent in the 1995-2003 period than the current MD-02 does; of the six districts designed to be relatively safe for Democrats, the Republicans have a deeper bench of officeholders at the state and local level than in any of the others.  There are signs that the east side of Baltimore County might be trending away from its traditional Democratic lean. Still, it is very hard to imagine even Ehrlich or a Republican who can duplicate his appeal winning in a district where nearly 40% of the constituents are Baltimore City residents.

As a secondary concern, this portion of Baltimore County is home to a lot of conserva-Dems who might be able to install a not-particularly-loyal Democrat into the seat in an open-seat situation if the city vote is either low or split.  

The Bottom Line:

Dutch Ruppersburger doesn’t really need the help, but this map gives him some anyway. You never know when a seat is going to become open. From a redrawing point of view, keeping this district out of northwest Baltimore County helped make it and MD-03 much more compact with more appealing shapes without affecting their respective partisan makeups much. It’s a set of communities that hang together pretty well. Should remain in the Democratic column.

Third District

MD-03

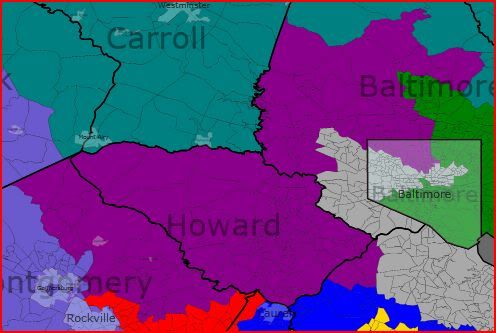
Descriptions: Contains northern and northwest portions of Baltimore City, northern and western portions (Towson, Pikesville, Owings Mills, Reisterstown, Randallstown) of Baltimore County, all of Howard County, northwestern portions (Jessup, Hanover) of Anne Arundel County, and northeastern portions (Damascus, Laytonsville, Olney, Burtonsville) of Montgomery County. Colored purple here.

Incumbent: John Sarbanes (D-Towson)

Map Changes:

These are dramatic changes as well, as the new MD-03 is mostly pushed out of Baltimore (and pushed out of downtown entirely) and Annapolis yet is still made more Democratic, mostly by adding new territory in the west via moving more into Washington suburbs.

The seemingly arbitrary pockets of East Baltimore are gone; what remains is more cohesive and more easily definable set of northern and northwestern city neighborhoods. Roughly from east to west, they are Waverly, Charles Village, Guilford, Homeland, Roland Park, Hampden, Mt. Washington, and upper portions of Park Heights; most are predominantly white (Park Heights and Waverly are mostly black while Charles Village is one of the most integrated parts of Baltimore) and relatively liberal.

The Baltimore County portion does contain some conservative exurban areas in northern Baltimore County (Sparks and Pheonix areas) but is concentrated mostly in more urban Towson and Pikesville. Some precincts to the west and northwest of Baltimore are instead in the black-majority MD-07, but this portion of MD-03 does contain some majority-black precincts. The Arbutus/Halethorpe/Landsdowne area in southern Baltimore County has been removed.

Howard County, previously split with MD-07, is now included in its entirety.

A small portion of Anne Arundel County does remain, but it now goes nowhere near Annapolis, instead staying close to the B-W Parkway.

The addition that sticks out most is the new territory in Montgomery County, about 130K residents, mostly outer suburbanites. There are a few precincts that carry Silver Spring, Rockville or Gaithersburg addresses, but this MD-03 contains none of either of the cities of Rockville or Gaithersburg, and nothing particularly close to the core of Silver Spring, as everything here is well outside the Beltway.

Things had to change for several reasons. One is that the population distribution in the state is shifting away from Greater Baltimore in general and Baltimore City in particular and some district based in or around Baltimore was inevitably going to end up with more Washington suburbanites. Another is that to fix the hideous shapes of some of the current districts required cutting off some of the more ungainly-looking appendages.  The current MD-03 is a group of pockets joined together by a series of thin strands and cleaning that up required shedding some of the pockets and filling out others; the threads running to the east were incompatible with the rest of the plan for the state, so the only direction to go was to the west.  

3rd District Pop Pct Wh Bl Hisp Asn Oth Oba McC

Baltimore City 92372 13% 61 29 3 5 1 81 17

Baltimore County 193424 27% 66 24 3 5 1 59 39

Howard/Arundel (Balt. Area) 167389 24% 63 18 5 12 2 59 39

Howard West (DC Area) 120254 17% 64 17 5 11 2 63 35

Montgomery 131144 19% 64 15 9 10 2 62 37

Total 704583 64 20 5 9 2 63 36

Old District 662062 77 16 3 3 1 59 39

Projected PVI: D+10

The Not-So-Good News:

It’s often awkward when redistricting changes a constituency this much, even if in the abstract the changes are favorable to an incumbent seeking re-election, as they are here. At some level, this would be like an open-seat race as far as about half the electorate is concerned. It might even be more awkward than usual in this case. The table lists the different components of the district; I divided Howard County into areas likely have some connection to Baltimore (roughly anything north of Route 32 and east of Route 29) and those areas unlikely to know much about Baltimore and its politics. Throw the latter in with MoCo and that’s about 36% of the district that has no Baltimore connection. Reaching them would require investing in an expensive new media market. (Though there are already probably some residents of the current MD-03 who are better reached via Washington media than Baltimore media because Washington casts a much bigger shadow.) Incumbent John Sarbanes lives in Towson in Baltimore County and his family is based in Baltimore; though his name is well-known in the western portions of the new MD-03, he himself is not.

The Good News:

From Democrats’ point of view, simply put, what could have become a potential swing district in a year with low Baltimore City turnout is made four points more Democratic. These new constituents aren’t likely to vote Republican, especially compared with what else could have been placed in this district. The Republican bench here is almost entirely confined to two areas, one in western Howard County, the other in northern Baltimore County, that have little in common with the rest of the district. The main bases of the district since the ’90s have been north Baltimore, Towson, Pikesville, and Columbia, and they’re all still here.

From Baltimore’s point of view, this is a district that even in an open-seat Democratic primary or general election is still more likely to choose a Baltimore-area representative than one from closer to DC; not only do most residents of the district live closer to Baltimore, but the DC-focused areas contain large numbers of new, less-established residents with no ties to existing political cliques. (Obviously, this isn’t good news for Montgomery County’s clout, but they’d they have no less than now.)

From Sarbanes’ own point of view, these new areas, in addition to not being of much help to future Republican opponents, aren’t especially likely to form the base for any successful region-based (notenough of them) or ideology-based (not different enough from the rest of the district to matter) primary challenges. And any Baltimore-area politician, looking at a future statewide run is going to need to be known in MoCo.

Bottom Line:

This district should be safe for John Sarbanes and is unlikely to be in danger of flipping to the Republicans should he decide to move on.

Fourth District

MD-04

Description: Portions of Prince George’s County (Ft. Washington, Oxon Hill, District Heights, Capitol Heights, Glenarden, Cheverly, Hyattsville, Langley Park) close to Washington, DC, and eastern and central portions (Takoma Park, East Silver Spring, Wheaton, White Oak, Burtonsville) of Montgomery County. Colored red here.

Incumbent: Donna Edwards (D-Fort Washington)

Map Change: This MD-04 sheds some Upper Montgomery territory to the expansion of MD-03, and cedes some of central and southern Prince George’s to MD-05. It picks up more of close-in eastern Montgomery County from MD-08 for the sake of compactness.

4th District Pop Pct Wh Bl Hisp Asn Oth Oba McC

Prince George’s 435116 62% 8 70 18 3 1 93 6

Montgomery 268281 38% 38 25 21 14 2 77 21

Total 703397 20 53 19 7 2 87 12

Old District 662062 27 57 8 6 0 85 14

Projected PVI: D+32

The Good News: This version of MD-04 is even more strongly Democratic (despite reducing the African-American share of the residents from 57% to 53%) which ranks it among the most Democratic and most liberal districts in the nation.  I did not set out to strengthen the Democratic lean here, it’s a natural consequence of removing less Democratic far-flung areas like Clarksburg and making things more compact and leaving room for the MD-03 shift chronicled above. It’s interesting from a political-demography perspective; it’s not every day you can change a district’s borders to include fewer African-Americans and yet increase the Democratic share of the vote. From Edwards; perspective, the increase in the Democratic vote in Montgomery also has the effect of making a Prince George’s County-based primary challenge tougher.

The Not-So-Good News: There are no Republican-leaning areas anywhere near here to neutralize, unless one wants push these borders way south to break up Southern Maryland or way north to get some less Democratic parts of Montgomery or Howard Counties, and I had good reasons not to do either.

Fifth District

MD-05

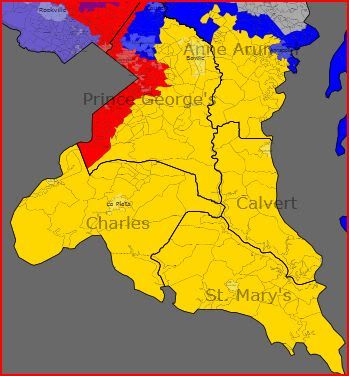
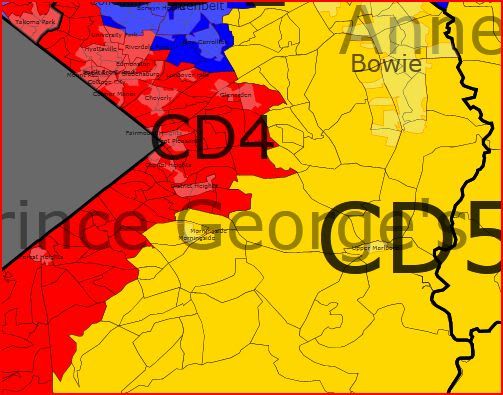
Description: Southern and central portions (Crofton, Millersville, Davidsonville, Edgewater, Deale) of Anne Arundel County; central, western and southern portions (Bowie, Seabrook, Largo, Mitchellville, Forestville, Upper Marlboro, Brandywine, Acokeek) of Prince George’s County; all of Charles County; all of Calvert County; all of St. Mary’s County. Colored yellow here.

Incumbent: Steny Hoyer (D-Mechanicsville)

Projected PVI: D+12

Map Change: Less than many districts. The new MD-05 is changed mostly to help MD-01, shedding areas in northern Prince George’s County (such as Laurel, Greenbelt, and College Park) and western and central Anne Arundel County.  It doesn’t weaken as a strong Democratic district due its new areas in central Prince George’s County left behind by MD-04, a change reflected in the demographics numbers as the proportion of African-Americans increases from 30% to 36%.

5th District

Anne Arundel 120226 17% 84 9 3 2 1 45 54

Prince George’s 252444 36% 25 65 5 3 2 87 12

Charles 140764 20% 52 39 4 2 2 64 35

St. Mary’s/Calvert 190276 27% 79 15 3 2 2 45 54

Total 703710 55 36 4 3 2 66 33

Old District 662060 60 30 4 4 0 65 33

The Good News:

A reasonably safe Democratic district (at least by 2008 metrics) moves one more point in that direction. Southern Maryland is kept together as a unit. From a pro-diversity point of view, an African-American would have a decent shot in an open seat Democratic primary here, more so than the currently existing MD-05. Though there is a reasonable Republican farm team in this district, it would be very hard to overcome the Democratic bloc vote in Prince George’s, especially as Charles County heads in a similar direction.

The Not-So-Good News:

Hoyer and the Democrats, though they still doesn’t have much reason to worry, are now slightly more dependent on the African-American vote in MD-05, meaning that a lower turnout model would move this district closer to the new MD-02 or MD-03 in partisan breakdown rather than a truly safe-in-all-circumstances seat.  This would be one of the best places in the nation for a black Republican to launch a political career.  

Our Majority Leader should be fine here, and whenever the day comes, his Democratic successor here should be as well.

Sixth District

MD-06

Description: All of Garrett, Allegany, and Washington Counties; western, northern, and eastern portions (Middletown, Thurmont, Walkersville) of Frederick County; all of Carroll County; far northern (Upperco, Parkton) and northeastern (Perry Hall, Baldwin) portions of Baltimore County; central and northern portions (Joppa, Bel Air, Jarrettsville, Pylesville) of Harford County. Colored teal blue here.

The Incumbent: Roscoe Bartlett (R-Frederick)

(Note: Republican MD-01 nominee Andrew Harris doesn’t live here, but most of his current State Senate district is in here, and so are the areas of MD-01 who supported him the most last time and will again this time.)

Map Changes:

It’s pretty obvious what happens here. The small portion of Montgomery County (mostly Damascus) is handed off to MD-03. The City of Frederick and its immediate environs, plus the area around Brunswick, are given to MD-08. The Reistertown area is now in MD-03. In exchange, the new MD-06 picks up a bunch of areas from the former MD-01, in northeastern Baltimore County and central Harford County. In partisan terms, most of the few areas left in MD-06 that were favorable, or even neutral, to Democrats are gone; all but one of the precincts in this district carried by Obama are in Hagerstown, the sole exception being a precinct in Cumberland that Obama carried by five votes.  

6th District Pop Pct Wh Bl Hisp Asn Oth Oba McC

Western Maryland 320515 89 6 2 1 1 38 60

Baltimore Exurban 383311 91 4 2 2 1 33 65

Total 703826 90 5 2 2 1 35 63

Old District 662060 92 5 1 1 0 40 58

Projected PVI: R+18

The Good News:

There are seven Democrats in an eight-member delegation. None of them have to run in this district or any portion of it. (It was not a goal of mine to make Bartlett move.)

On the upside, there could be some entertainment value the next time this seat opens up (Bartlett is no spring chicken) as the various GOP aspirants each try to out-wingnut each other. The only other real subject of potential interest is seeing if a Western Marylander can gain traction in a district where denizens of Baltimore exurbs are more numerous.

The Not-So-Good News:

There are still enough Republicans, and areas full of them, in Maryland to command one district. Here it is.  

More seriously, one consequence of generating a district like this is that Democrats, independents, and liberal-to-moderate voters in general have very little say in who gets elected to represent this district. While that’s good for the Democrats, both nationwide and in Maryland, in some sense – anyone who can survive a GOP primary in this electorate has slim chances of developing the sort of cross-party appeal a Republican would need to win statewide, and we’re talking about a state GOP that’s already skilled at cutting off its nose to spite its own face here – it’s bad from a good-government perspective. Competitive races are good for many governmental functions, and I know that exercises like this one that go on in state capitals coast-to-coast tend to make such contests less likely.

But there’s no way I’m going to unilaterally disarm.  

Bottom Line: Safe Republican; not much else to say.

Seventh District

MD-07

Description: Portions of east-central and western Baltimore City; western and southwestern portions (Lochearn, Woodlawn, Catonsville, Arbutus, Halethorpe) of Baltimore County; north-central and northeastern (Brooklyn Park, Linthicum, Severn, Glen Burnie, Pasadena, Arnold, Severna Park) portions of Anne Arundel County. Colored medium gray here.

Incumbent: Elijah Cummings (D-Baltimore)

Map Changes:

There’s a little less of Baltimore here now, MD-02 in particular grabbing a larger share; what remains is two clusters of heavily black neighborhoods (the East Baltimore is section centered just north of Johns Hopkins Hospital; the larger West Baltimore section expands westward from Druid Hill Park, and follows Reisterstown Road, Liberty Heights Avenue, Route 40, and Frederick Avenue outwards) joined by a narrow neck around where North Avenue meets Interstate 83. 95% of its votes went to Obama. Though there are some pockets of stable middle-class neighborhoods to be found here, the majority of these neighborhoods are beset by longstanding issues of poverty, crime, and urban blight.

The Baltimore County portion includes most of the majority-black suburbs to the west of Baltimore proper. The new version contracts slightly in the Interstate 70 area but expands towards Randallstown out Liberty Road. It now includes all of Catonsville and inherits the southwest corner of Baltimore County from MD-03. All in all, the Baltimore County portion of MD-07 is about evenly split between blacks and whites.

The Anne Arundel portion is inherited from MD-01, MD-02, and MD-03, and is designed to sop out Republican areas formerly assigned to those districts. Collectively, it gave 55% of its votes to John McCain.

7th District Pop Pct Wh Bl Hisp Asn Oth Oba McC

Baltimore City 267345 38% 6 91 1 1 1 95 5

Baltimore County 191107 27% 42 49 3 4 2 73 25

Anne Arundel 246238 35% 82 10 3 3 2 43 55

Total 704690 42 51 2 3 1 69 30

Old 662060 35 59 2 4 1 79 20

Projected PVI: D+15

The Good News:

Fewer wasted Democratic votes. Of the seven Democrats in the delegation, only Donna Edwards in MD-04 needed less help. It’s still VRA compliant.

As I explain below, Cummings isn’t going to be pleased. However, if he harbors statewide ambitions, introducing himself to Democrats in northern Anne Arundel County might help him emerge from what could be a crowded primary field.  

The Not-So-Good News:

Democrats are 10 points weaker here now, for three reasons – the new MD-07 has a smaller share of Baltimore City (mostly shedding racially mixed or mostly white areas with liberals more needed elsewhere), a lower percentage of African-Americans (from 59% to 51%), and a shift in suburban population from [relatively] Democrat-family portions of Howard County to more Republican-leaning portions of Anne Arundel County. There’s a bit of a polarized electorate here; you can draw a line through Baltimore County on Route 40 and then follow the southern border of Baltimore City and you’ll discover mostly black Democratic voters on the north side of the line and mostly white Republican voters on the south side. What keeps the district out of the swing category despite this is that the few exceptions to the rule – Brooklyn Park and Severn have sizable African-American populations, and Democrats do fairly well in Catonsville –  are all on the southern side of the divide.

Incumbent Eli Cummings will likely not be a happy camper, though he probably doesn’t have much to worry about. He’d have to introduce himself to a whole new set (about 40% of this district is brand new) of constituents, many of whom are strongly inclined to support his Republican opponents.  It’ll be easier to recruit Republican challengers from Anne Arundel than from any area he now represents. If an African-American could somehow emerge from a Republican congressional primary, he’d have a better chance here than in most places.

But this district still gave Obama 69% of its votes; even if that’s a vote ceiling, any GOP candidate would need to run double-digits ahead of the national ticket to even have a shot, and rare is the candidate that can accomplish such a feat, even in an open seat situation.  

Bottom Line:

This seat’s been weakened (by necessity) quite a bit but still isn’t going to show up on any GOP potential pickup lists anytime soon, with or without Cummings.

Eighth District

MD-08

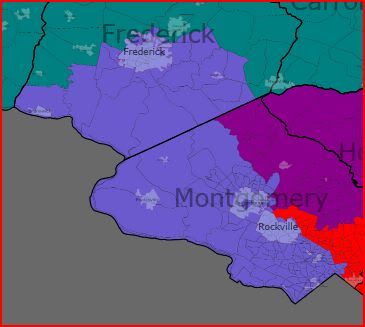
Description: Southern, central, and western portions (Silver Spring, Kensington, Chevy Chase, Bethesda, Potomac, Rockville, Gaithersburg, Germantown, Clarksburg, Poolesville) of Montgomery County; southern and central portions (Frederick City, Urbana, Brunswick) of Frederick County. Colored lavender here.

Incumbent: Chris Van Hollen (D-Kensington)

Map Changes:

MD-08 moves out of Prince George’s County and cedes a large chunk of eastern Montgomery County (Takoma Park, parts of Sliver Spring, Wheaton, White Oak) to MD-04. In exchange MD-08 moves up into Frederick County, taking the City of Frederick and its environs from MD-06. The result is a less Democratic but still safe district.

8th District

Montgomery 551255 78% 59 11 13 14 2 71 27

Frederick 152526 22% 74 12 8 5 2 53 45

Total 703781 63 12 12 12 2 68 30

Old District 662060 63 17 14 11 6 74 25

Projected PVI: D+15

The Good News:

Fewer wasted Democratic votes. As a district with Republican-leaning border areas not subject to any VRA compliance mandates, it’s a pretty obvious candidate for dilution to everyone. And even the more conservative Frederick County portion of the district was carried by Barack Obama in 2008.

The Not-So-Good News:

The Democratic bottom line shifts downward six points, which is about what one would expect when shifting 25% of a district from one of the most heavily Democratic-voting areas in the country to a 50-50 area. The Frederick area, though it’s becoming friendlier to Democrats with every cycle, has long been a source of Republican candidates for every conceivable office.

Not that I think it matters much now, but this new version of MD-08 looks a lot more like it did when Republican Connie Morella held it down in the 1990s. Had this been the playing field over the last decade worth of House elections, I imagine that there’s at least a chance she’d still be on Capitol Hill now as an increasingly lonely voice for the old Eastern-style Republican in the GOP caucus. Morella is almost certainly too old to make a comeback now, and her party has spent the intervening decade making itself extremely unappealing to voters in districts like this one anyway.  

The Bottom Line:

Van Hollen or whatever Democrat succeeds him shouldn’t have a problem getting re-elected in this district.

Extra Maps:

Baltimore

Baltimore

North of DC

DC North

East of DC

DC East

PA-St. House: Legislative Chamber to Watch

Reasonable minds can disagree on what the single most important state legislature this November is going to be, whether it’s from the perspective of affecting redistricting or just from good governance, and whether it’s from the perspective of trying to pin down a Democratic trifecta or prevent a Republican trifecta. If you’d said it was trying to take over the Texas state House, in order to keep the GOP from having a lock on the Lone Star State and forcing something of a compromise map, I’d say that was a great pick. And if you’d said defending the New York state Senate, that’s a great pick too, as controlling the trifecta there going into 2012 will result in a much better congressional map. Holding the Ohio Assembly, picking up the Michigan Senate, or even focusing on California to push those chambers past the 2/3s mark to overcome that state’s ridiculous budget requirements; those are all great too.

But, at least for now, I’ve settled on the Keystone State’s House as the key legislative chamber. With the state Senate not in a position to flip away from GOP control this year, and with the distinct likelihood of losing the gubernatorial race (if nothing else, given the state’s well-documented eight-year itch), holding the state House is the Dems’ last line of defense in the redistricting trifecta, and the best way to make sure that a compromise map is on the table for 2012. Not that the 2002 map worked out that well for the GOP — it turned out to be something of a dummymander that fell apart when a strong wind blew the other direction — but we obviously don’t want to take the chance that they might get it more right next time.

With three vacancies having been just filled via special elections on Primary Day, the Democrats currently control the House by a 104-97 margin. That’s better than the previous 07-08 cycle, where the Dems had a 102-101 edge, but still one where a stiff wind could blow control back in to GOP hands, seeing as how they need to flip only four seats to take control. (You might notice that, at 203 members, this is one of the nation’s largest legislative bodies, although they’ve still got nothing on the New Hampshire House. Constituencies are only about 60,000 residents each, meaning that the races are usually low-dollar affairs dominated by the ground game instead, and by the machines, where they’re present.)

With the primaries having wrapped up, we also have the matchups set in place for November. In addition to that generic stiff wind, here’s one other way Dems are at a disadvantage this cycle: they have a lot more open seats to defend than do the Republicans. Rather than give you one giant table of every single district, I’m going to break them down by category. Most districts aren’t even going to get discussed, seeing as how nearly half of all races — 39 Democratic seats and 46 Republican seats — aren’t being contested by a major party, and how nearly two-thirds of all seats fall outside what I think of as “swing district” territory, i.e. with a Cook PVI between D+5 and R+5. (If you’re wondering how I calculated PVI at this level, Pennsylvania has made available both 2004 and 2008 presidential data for all precincts, so thanks to jeffmd we were able to calculate percentages for all its legislative districts.)

District Rep. PVI Obama/
McCain %
Kerry/
Bush %
’08 House
D/R %
Location
107 Open
(Belfanti)
R+5 46/52 45/54 100/0 Columbia
Montour
Northumberland
137 Open
(Grucela)
R+3 51/48 45/53 100/0 Northampton
122 Open
(McCall)
R+1 50/48 49/50 64/36 Carbon
48 Open
(Solobay)
R+1 49/49 51/49 100/0 Washington
156 Open
(Smith)
D+2 56/43 50/49 53/47 Chester
114 Open
(Wansacz)
D+3 56/42 50/48 100/0 Lackawanna
Luzerne
Susquehanna
Wyoming
119 Open
(Yudichak)
D+5 56/42 55/43 100/0 Luzerne
77 Open
(Conklin)
D+6 60/38 52/47 70/30 Centre
161 Open
(Lentz)
D+6 57/41 55/44 55/45 Delaware
141 Open
(Melio)
D+13 64/35 63/36 100/0 Bucks
194 Open
(Manderino)
D+22 73/26 71/28 78/22 Montgomery
Philadelphia
195 Open
(Oliver)
D+42 93/7 92/8 91/9 Philadelphia

We’ll discuss Republican open seats below the fold, but there are only six of them, compared with twelve Dem seats. There are two bits of good news, though: two of those GOP open seats are in blue districts, compared with four here in Republican-leaning turf, so there may be some offsetting. And more importantly, three of these R+ seats here are in old-school rural Dem areas where there seems to be a sizable Democratic registration advantage, so similar to the PA-12 special election, a conservative Dem might be able to take advantage of the historic Democratic dominance at the local level even as the areas trend away at the national level.

HD-48 is very much a case in point; in fact, it’s in Washington County to the south of Pittsburgh, one of the hearts of PA-12, and its 49/49 split in 2008 and 51/49 split in 2004 very closely mirrors how the 12th (the only Kerry/McCain district in the nation, as you’ve no doubt heard) as a whole broke down. In HD-48, there were 7,488 votes for the various Dems in the primary, while there were 4,461 Republican votes. In addition, in two seats in northeastern coal country, HD-107 had 5,818 Democratic votes for the various candidates in the primary, while there were 4,088 Republican votes, and HD-122 had 6,166 Dem votes and 3,855 GOP votes. The exception among the four is HD-137, which is a more suburban seat outside of Bethlehem in the Lehigh Valley; this area, like many southeastern suburbs, moved rapidly in the Dems’ direction at the presidential level between 04 and 08, but there’s still a historic Republican advantage at the county and legislative level. Even here, though, there were 3,847 Dem votes to 3,439 GOP primary votes.

Now let’s turn to seats that aren’t open, but where a Democrat is sitting in a Republican-leaning district.

District Rep. PVI Obama/
McCain %
Kerry/
Bush %
’08 House
D/R %
Location
83 Mirabito R+12 42/57 36/63 57/42 Lycoming
56 Casorio R+12 37/62 41/59 60/40 Westmoreland
125 Seip R+11 42/57 38/61 56/44 Berks
Schuylkill
76 Hanna R+8 45/53 40/60 69/31 Centre
Clinton
74 George R+8 44/53 41/58 63/37 Clearfield
10 Gibbons R+6 43/55 45/55 55/45 Beaver
Butler
Lawrence
54 Pallone R+5 44/55 46/53 100/0 Armstrong
Westmoreland
116 Eachus R+5 46/52 45/54 100/0 Luzerne
55 Petrarca * R+5 44/55 47/52 100/0 Armstrong
Westmoreland
130 Kessler R+4 49/49 43/56 56/44 Berks
46 White R+3 45/53 49/51 63/37 Allegheny
Beaver
Washington
25 Markosek R+3 47/52 48/52 100/0 Allegheny
Westmoreland
72 Burns * R+3 47/50 48/52 53/47 Cambria
Somerset
13 Houghton R+3 51/48 44/55 48/46 Chester
73 Haluska R+2 48/50 48/51 100/0 Cambria
58 Harhai R+2 46/53 51/49 100/0 Fayette
Westmoreland
51 Mahoney * R+2 47/51 49/50 67/0 Fayette
33 Dermody R+2 47/52 50/49 51/49 Allegheny
71 Barbin R+1 51/48 49/51 50/50 Cambria
52 Kula * R+1 48/51 51/48 100/0 Fayette
Westmoreland
39 Levdansky R+1 48/51 52/48 53/47 Allegheny
Washington

These are, I would expect, for the most part conservative Dems who are well suited to their districts in rural areas or Pittsburgh’s collar counties. Between that and disparities in party strength in some of these counties, most of them have been easily re-elected in the past (see their 2008 totals) or left unopposed. In fact, note that four of them are unopposed this year; these are the ones with asterisks next to their names. This even goes as far up as R+5, where Joe Petrarca drew a pass. (Before we start patting ourselves on the back too much, there are some even more glaring omissions in terms of Republicans going uncontested in blue seats, which we’ll get to later.) Also worth a note, some of the ones who are in swingier districts (like Barbin, Dermody, and Levdansky) were the ones with the really close races in 2008, and may, depending on the quality of their challengers this year, be in more trouble than the Dems in redder districts.

Let’s look at one more table of Democrats, this time ones who are in Democratic-leaning districts but who still had close races in 2008 (“close” meaning a less than 10% margin of victory).

District Rep. PVI Obama/
McCain %
Kerry/
Bush %
’08 House
D/R %
Location
151 Taylor D+4 57/42 52/47 51/49 Montgomery
157 Drucker D+4 57/42 52/48 51/49 Chester
Montgomery
70 Bradford D+5 59/40 53/47 51/49 Montgomery
113 Murphy D+11 65/33 58/40 52/48 Lackawanna
31 Santarsiero D+0 53/46 49/50 53/47 Bucks
50 DeWeese D+3 52/46 55/44 54/46 Fayette
Greene
Washington

Note that this is a very different batch of counties than the ones in the R+ districts. Most of these Dems are in Philadelphia’s suburbs and were either elected for the first time in either 2008 or 2006, so they’re still getting entrenched in counties where, if you look below the presidential toplines, there are still a lot of historic and organizational advantages for the Republicans. These seats will be a big test of whether these counties continue their decade-long demographic-driven march toward the Democrats, or if the national environment reverses that trend. There’s also one seat here that doesn’t really match: the district of former Speaker Mike Bill DeWeese, in the state’s southwestern corner. DeWeese is an old-timer (in office since 1976) who’s gotten badly tarred with the Bonusgate brush, which probably hurt his 2008 totals and has probably only made things worse lately. Residents of this district probably got saturated with tons of ads from the next-door WV-01 primary, so they too may be primed to be in the mood to rid themselves of a long-time but shady Rep.

Seats where Democrats are on the offense over the flip…

Now let’s look at the open seats currently held by Republicans.

District Rep. PVI Obama/
McCain %
Kerry/
Bush %
’08 House
D/R %
Location
164 Open
(Civera)
D+13 66/33 60/39 0/100 Delaware
131 Open *
(Beyer)
D+3 56/42 51/49 48/52 Lehigh
Northampton
128 Open
(Rohrer)
R+5 49/50 42/57 48/52 Berks
41 Open
(True)
R+7 48/51 38/61 0/100 Lancaster
199 Open
(Gabig)
R+12 42/56 35/64 35/65 Cumberland
85 Open
(Fairchild)
R+13 41/57 34/65 30/70 Snyder
Union
108 Open
(Phillips)
R+16 38/61 31/68 23/77 Northumberland
Snyder

Obviously, there are two big possibilities here, including a D+13 seat that leaves you to wonder what it was doing in GOP hands in the first place. (The answer: HD-164 has been the seat since 1980 of Mario Civera Jr., the ranking Republican on Appropriations, and it’s in Delaware County, which is a historic GOP stronghold that still has a strong local machine even though it’s gone blue at the presidential level.) The D+3 seat, HD-131, is in the suburbs of Allentown, and just became open when GOP incumbent Karen Beyer lost her primary. A little further down, Sam Rohrer (who vacated the seat for his long-shot gubernatorial bid) put up tepid numbers in his 2008 re-election, but that may have more to do with his bad fit with his district (which is the nicer suburbs of Reading, typified by John Updike’s hometown of Shillington, not prime theo-con turf) than this district’s readiness to elect any Democrat.

Here’s the list of the Republicans who are sitting in blue districts. And, as promised, it has some races that went uncontested (marked by asterisks) that will have you wanting to pound your head into the desk…

District Rep. PVI Obama/
McCain %
Kerry/
Bush %
’08 House
D/R %
Location
177 Taylor * D+15 66/33 65/34 41/59 Philadelphia
18 DiGirolamo * D+8 58/40 58/41 33/67 Bucks
162 Miccarelli D+8 59/40 58/41 43/57 Delaware
163 Micozzie D+7 59/39 57/42 41/59 Delaware
176 Scavello * D+7 62/38 53/46 0/100 Monroe
146 Quigley D+5 59/40 52/48 47/53 Montgomery
150 Vereb D+5 58/41 53/47 43/57 Montgomery
61 Harper D+4 57/43 52/48 44/56 Montgomery
152 Murt D+3 55/44 53/47 40/60 Montgomery
Philadelphia
169 O’Brien * D+3 53/46 55/44 0/100 Philadelphia
142 Farry D+3 54/45 53/47 48/52 Bucks
172 Perzel D+2 52/47 53/46 34/66 Philadelphia
158 Ross D+1 55/44 48/52 0/100 Chester
167 Milne D+0 54/45 48/51 44/56 Chester
26 Hennessey D+0 55/44 47/52 48/52 Chester
14 Marshall D+0 50/48 52/48 41/59 Beaver
183 Harhart * D+0 53/46 49/50 0/87 Lehigh
Northampton

So… just to recap, Dems failed to put forth a candidate in a D+15 district in Philadelphia (as well as a D+8 district in lower Bucks County and a D+7 one in the Poconos). Granted, this is in NE Philadelphia, the middle-class old-school white-ethnic part of town where there’s some residual Republican organizational strength, probably left over from the Frank Rizzo area (as seen not just by Taylor’s 59-41 win in 2008 but by the continued presence in the House of his neighbors, former Speakers Mike Dennis O’Brien — also uncontested this year — and John Perzel). Still… that free pass is just lame. At any rate, Perzel, even though he might have the least-blue district in Philly, may actually be the most vulnerable GOP incumbent, if only by virtue of being the most public face of the lingering legislative pay raise debacle that left both parties looking bad.

Finally, here is a handful of Republicans who are from Republican-leaning districts who still managed to have close (i.e. less than 10% margin) races in 2008, who weren’t already accounted for in the blue-district list.

District Rep. PVI Obama/
McCain %
Kerry/
Bush %
’08 House
D/R %
Location
15 Christiana R+4 44/54 48/51 49/51 Beaver
57 Krieger R+10 40/58 41/58 48/52 Westmoreland
187 Day R+7 47/51 40/59 48/52 Berks
Lehigh
75 Gabler R+7 46/52 41/58 47/53 Clearfield
Elk

While I don’t presume to know enough about the local dynamics of these dozens of different races to the extent that I can predict outcomes, the disparities in number of open seats, and numbers of Dems in R+ seats vs. numbers of GOPers in D+ seats, suggest that the Republicans will be picking up seats here, although maybe not the net four flips needed to control the House. The real question seems to be how much these races get nationalized, and whether a favorable Republican year in general translates down to districts where there’s a historic Dem advantage (in the southwestern collar counties) or where demographics are moving in a Dem-favorable direction even while the local machinery remains in GOP hands (in the southeastern suburbs). The failure by the GOP to successfully nationalize the PA-12 special election is a good portent, but we’ll have to watch carefully.

UPDATE: By popular request, here’s the entire dataset as a Google Doc.

SSP Daily Digest: 6/4 (Afternoon Edition)

AR-Sen: I don’t know if this is outright shenanigans or innocent bureaucratic bungling, but a lot of eyebrows are being raised over a strange turn of events in Garland County that’s going to lead to long lines and voters avoiding the polls. The county, with a population of 80,000 and 42 precincts, will have a total of two polling places for the upcoming runoff election. Worth noting: Garland County (home of Hot Springs) is the most populous county in Arkansas that went for Bill Halter in the primary.

IL-Sen: The Mark Kirk story seems like it’s finally catching hold in the Chicago market. At the link, you can check out the whole “misremembered it wrong” story splashed across the front page of the Chicago Sun-Times, and watch a withering WGN news story.

WA-Sen: Dino Rossi has reported $600K in contributions in one week since announcing his bid. Anyone who is surprised by this number should get better acquainted with the term “low hanging fruit;” the interesting numbers will be the ones in future weeks to see how he does now that most of Washington’s major real estate and contracting players have, assumedly, maxed out. Also in the not-surprising file, state Sen. Don Benton dropped out of the race and endorsed Rossi. Benton was the more or less GOP frontrunner prior to Rossi’s entry, but also something of a Republican-establishment stand-in for Rossi with a lot of overlap in supporters, so there wasn’t much incentive for him to continue. Goldy correctly yawns at Benton’s departure, saying that Clint Didier (the Palin-endorsed teabagger in the race) was always the real speed bump for Rossi and one that’ll continue to pose a problem: he can’t run away from Didier and his supporters, whose enthusiasm he’ll need in November, but if he gets too close to them, he’ll lose whatever moderate image he once had, which he’ll also need in November.

CA-Gov (pdf): The last pre-primary Field Poll, or at least part of it, is out. All that they’ve released today is the Republican gubernatorial primary numbers, which are very much in line with everyone else’s numbers lately. They see Meg Whitman leading Steve Poizner 51-25, only half the 49-point lead she had in the last Field Poll in March but still certainly enough to get the job done for her on Tuesday. Keep your eyes peeled for the rest of the data.

NY-Gov: Maggie Haberman has an interesting retrospective of the big bag of Fail that was the Steve Levy campaign. She weaves together a number of threads that didn’t really make it into the national media — unwillingness to fully commit to the race, his reluctance to dip into his war chest, tabloid stories about law school friends — to paint a picture of a campaign that, in hindsight, was doomed from the outset.

AR-03: Sarah Palin (and the Susan B. Anthony List) weighed in in AR-03, adding one more “Mama Grizzly” to her trophy room. She endorsed state Sen. Cecile Bledsoe, who’s in a runoff against Rogers mayor Steve Womack for the GOP nomination in the open seat race in this safely-red district. Bledsoe only compiled about 15% of the vote in the primary, although with a huge number of candidates, that was enough to squeak by into second place.

NY-15: In case there was any doubt that a combination of age, sliminess, and having lost his Ways and Means gavel might prompt a last-minute retirement for Charles Rangel, they were laid to rest. He’ll be officially kicking off his next campaign this weekend.

OH-18: The long-unresolved GOP primary in the 18th appears to be finally over, as former state Agriculture director and 2008 nominee Fred Dailey conceded. He lost to establishment pick state Sen. Bob Gibbs by 156 votes according to certified results, and the automatic recount only changed two votes. While this is one more in a string of recent GOP primaries where the establishment candidate beat the teabagger, this, like many of those races (like, say, IN-08 and IN-09, and IN-03 and IN-05 if you want to call the woeful Souder and Burton “establishment”) where the anti-establishment candidate came within a hair of winning, and where if there had been fewer teabagger candidates spoiling the broth or things that just bounced slightly differently, the media would be talking about an entirely different narrative.

Media: So, speaking of media narratives, I’m wondering if the media are starting to dial down their “Dems are dooooomed!” narrative that’s been conventional wisdom for the last half a year. Not just because they may be noticing that the polling evidence for that is sketchy at best, but also, as this Newsweek piece points out, that they may have gotten suckered by the Democrats themselves, who seem to be engaged in the ages-old practices of expectations management, lowballing their predictions so they look like heroes later.

Ideology: 538 has some fascinating charts up as part of a new post on where states (and where the two parties within each state) fit on the liberal/conservative scale, looking at it on multiple dimensions instead of on a left/right line. West Virginia (socially conservative and economically liberal) stands out as an interesting outlier on the chart, which does a lot to explain its particular brand of politics.

AR-Sen: Halter Leads by 4

Research 2000 (6/2-4, likely voters, 5/24-26 in parens):

Blanche Lincoln (D-inc): 45 (44)

Bill Halter (D): 49 (47)

Undecided: 6 (9)

(MoE: ±4%)

One caveat here is that this sample claims that they voted for Halter over Lincoln by a 48-46 margin (with 3% for D.C. Morrison and another 3% who didn’t vote) in the first round of voting. Lincoln, as you recall, narrowly claimed a first place showing three weeks ago. However, it wouldn’t surprise me at all to see enthusiasm among Lincoln voters dimming (especially after witnessing her sadsack runoff campaign), so these numbers may not be out to lunch at all.

DailyKos decided to take a pass on polling the general election match-ups this time, but that will be the next hot topic after Tuesday.

California Redistricting (Finally) with only 7 Republicans Safe

Also posted at http://frogandturtle.blogspot….

(Beware, this post is long so read if you have time.)

First, this is finally finished! You may have seen me mention this map in some comments and I kept saying it was a couple of weeks away a few months ago. It took me a couple of months to map and write, including when half of the write up mysteriously vanished.

This is not the most realistic plan in the world but I wanted to see how big a Democratic gerrymander I could create. I tried to keep only seven Republicans safe while making the other seats winnable for the Democrats. Although 2010 is definitely looking like a bad year for the Democrats, 2012 with Obama on the ticket should be better. 2010 should be better than expected but that’s another story. I drew this map assuming California has 53 congressional districts after the census. Yes, I know that keeping only seven Republicans safe could turn into a dummymander because I weakened too many Democrats. I hope to avoid that and I made current Democrats safe. Many of  the shakier seats should trend Democratic overtime so the Democrats will be able to pick up all the seats I made for them sometime in the decade if not 2012. I created 33 Safe Democratic, 9 Likely Democratic, 3 Lean Democratic, 2 Toss Up, 1 Likely Republican and 6 Safe Republican seats. Besides the Republican district, Obama does not win less than 53% of the vote in any district that is not safe or likely Republican. He wins 53% in only one district and 54% in two. Also, I gave the Hispanics four new districts while increasing the Asian population in the 32nd (renumbered 31st) district and 15th district. I also protected two of LA’s three African American representatives. Diane Watson is retiring so I made her district more Hispanic so the 35th (renumbered 34th) and 37th (renumbered 36th) districts will be more African American but the Hispanics will get an extra district. Also, I do not have demographic numbers for 2010 unfortunately. Here are the maps:

First, here’s a map of California’s current congressional districts. http://www.govtrack.us/congres…

Here, you can scroll down and click on California’s Congressional district names for information on them. http://en.wikipedia.org/wiki/C…

Photobucket

Northern California

1st District Mike Thompson (D) St. Helena (Blue)

Obama 203,307 62% McCain 117,072 36%

Change: McCain +8

Demographics: 13% Hispanic, 78% White

Communities of Interest: Redding, Santa Rosa, Eureka

Status: Safe Democratic

I removed most of Napa County except for Thompson’s home in St. Helena. I also added most of heavily Republican Shasta County. The North Coast keeps the district safely Democratic though.

2nd District Wally Herger (R) Chico (Green)

Obama 160,489 55%, McCain 122,712 43%

Change: Obama +24

Demographics: 16% Hispanic, 5% Asian, 72% White

Communities of Interest: Redding, Chico, Davis

Status: Lean Democratic

Herger’s seat makes a big turn to the left because I removed Shasta County and Republican parts of Butte County. I added parts of Democratic Sonoma and Yolo Counties. Herger is unfamiliar with these areas so he should have trouble making inroads in them. Although he still has his home in the district, I should say he will lose by seven points to a strong challenger. Also, Herger has been criticized in the past for not being an effective congressman. A race in a district like this will shake him up.

Photobucket

Sacramento area

3rd district Dan Lungren (R) Folsom

Obama 148,675 56% McCain 110,520 42%

Change: Obama +14

Demographics: 7% African American, 14% Hispanic, 7% Asian and 67% White

Communities of Interest: Sacramento, Folsom, Citrus Heights

Status: Likely Democratic

Lungren is already shaky in his current 49%-49% seat so a 56% Obama seat would be too Democratic for him. I added parts of Sacramento where he is not entrenched while removing Republican areas outside of Sacramento County. A strong challenger in 2012 when Obama is on the ballot should be able to knock off Lungren.

4th District Tom McClintock (R) Granite Bay (Red)

Obama 149,211 41% McCain 203,357 57%

Change: McCain +6

Demographics: 8% Hispanic, 85% White

Communities of Interest: Roseville, Lincoln, Rocklin

Status: Safe Republican

The only real change is that McClintock loses the Democratic Lake Tahoe area. He gets even safer with the addition of more Republican areas.

5th District Doris Matsui (D) Sacramento

Obama 165,279 62% McCain 96,765 36%

Change: McCain +16

Demographics: 12% African American, 17% Hispanic, 16% Asian, 50% White

Communities of Interest: Sacramento, Elk Grove,

Status: Safe Democratic

Although her district picks up some moderate Sacramento suburbs, her district still remains strong for her with a base in Sacramento.

Photobucket

Greater San Francisco area

6th District Lynn Woolsey (D) Petaluma (Teal)

Obama 223,326 68% McCain 99,268 30%

Change: McCain +16

Demographics: 18% Hispanic, 5% Asian, 71% White

Communities of Interest: San Rafael, Petaluma, Napa, Yuba City

Status: Safe Democratic

First, this is my home district! I am not too pleased with this district because Central Valley Democrats will have an influence over voters next to San Francisco. The district is still anchored in the North Bay so when Woolsey retires, a North Bay Democrat will replace her. A good candidate is Jared Huffman, a liberal State Assembly member from Marin County which cast 48% of the district’s Obama votes with 1/3 of the district’s population. Marin County does not have a representative in the State Senate or the House so when Woolsey retires, Marin probably will have one in the House (finally.)

7th District George Miller (D) Martinez

Obama 182,391 68%, McCain 83,750 31%

Change: McCain +8

Demographics: 14% African American, 20% Hispanic, 14% Asian, 46% White

Communities of Interest: Vallejo, Fairfield, Pittsburg

Status: Safe Democratic

George Miller loses most of Richmond and gains all of Solano County which drops the Obama percentage a bit but Miller is still safe.

Photobucket

San Francisco/Oakland

8th District Nancy Pelosi (D) San Francisco

Obama 282,287 85%, McCain 41,850 12%

Change: McCain +0

Demographics: 8% African American, 15% Hispanic, 29% Asian, 44% White

Communities of Interest: San Francisco

Status: Safe Democratic

Keeping all of San Francisco except part of the Sunset District, the district does not change a bit.

9th District Barbara Lee (D) Oakland

Obama 249,791 84%, McCain 41,860 14%

Change: McCain +8

Demographics: 27% African American, 19% Hispanic, 14% Asian and 36% White

Communities of Interest: Oakland, Berkeley, Lafayette

Status: Safe Democratic

Lee’s district gets a bit more Republican by going into the less Democratic cities in the San Ramon Valley such as Danville and Orinda but still stays extremely safe.

10th District John Garamendi (D)

Obama 208,364 65% McCain 108,189 33%

Change: McCain +0

Demographics: 15% Hispanic, 9% Asian, 67% White

Communities of Interest: El Cerrito, Concord, Antioch, Lodi

Status: Safe Democratic

This district keeps its anchor in north-central Contra Costa County but gains mostly white but heavily Democratic neighborhoods in Oakland and goes further into the Central Valley to pick up Republican parts of San Joaquin County. Also for Garamendi, the district picks up a few more precincts in Sacramento County.

11th District Jerry McNerney (D) Pleasanton

Obama 164,551 58% McCain 115,845 40%

Change: Obama +8

Demographics: 5% African American, 19% Hispanic, 11% Asian, 61% White

Communities of Interest: Pleasanton, Oakley, Tracy

Status: Likely Democratic

McNerney gets safer. I was able to give him Democratic Castro Valley and Oakley while removing the Republican area around Lodi. I slipped in Livermore too because Tauscher does not represent the 10th anymore and she wanted Livermore in her district. McNerney also picks up a few precincts in Stockton from the 18th district. Most of McNerney’s old territory is in the district too.

12th District Jackie Speier (D) Hillsborough

Obama 216,684 74% McCain 70,455 24%

Change: McCain +0

Demographics: Hispanic 20%, Asian 27%, 46% White

Communities of Interest: South San Francisco (the industrial city,) Redwood City, Half Moon Bay

Status: Safe Democratic

The district picks up the San Mateo County coastline and part of Redwood City but besides that, the district remains the same.

13th District Pete Stark (D) Fremont

Obama 183,890 74%, McCain 58,035 24%

Change: McCain +0

Demographics: 7% African American, 25% Hispanic, 23% Asian, 40% White

Communities of Interest: Hayward, Fremont, Santa Clara

Status: Safe Democratic

Stark’s district loses some of Fremont to the plurality Asian 15th and gains minority majority areas in Sunnyvalle and Santa Clara. These changes should not affect the district much.

Photobucket

South Bay (ignore the unassigned precincts, if I assigned one, all of them would be assigned. No one lives in them either.)

14th District Anna Eshoo (D) Atherton

Obama 220,962 70% McCain 90,352 28%

Change: McCain +6

Demographics: 13% Hispanic, 17% Asian, 64% White

Communities of Interest: Mountain View, Los Altos, San Jose

Status: Safe Democratic

The district loses all of Santa Cruz County and goes into mostly white areas formerly in the 15th district. Although the changes rise the McCain percentage a bit, Eshoo is still very safe and has her home in the district.

15th District Mike Honda (D) San Jose

Obama: 170,000 70% McCain 69,345 28%

Change: Obama +4

Demographics: 18% Hispanic, 43% Asian, 31% White

Communities of Interest: Fremont, San Jose, Cupertino

Status: Safe Democratic

This is one of the two Asian plurality districts I created on the map. I added Union City and Asian parts of Fremont while removing white neighborhoods in western San Jose. Honda should be safe here.

Photobucket

Central/Southern California

16th District Zoe Lofgren (D) San Jose

Obama 130,902 67% McCain 60,558 32%

Change: McCain +6

Demographics: 13% Asian, 50% Hispanic, 29% White

Communities of Interest: Fresno, Watsonville, San Jose

Status: Safe Democratic

I think Zoe is a great representative but I had to create more districts for Hispanic representatives. This district keeps Hispanic areas in San Jose and picks up Hispanic areas in San Benito, Santa Cruz and Fresno Counties. Although 50% Hispanic is barely a majority, the number should be 54% about now and Hispanics outside her district are not used to voting for her in the primary.

17th District Sam Farr (D) Carmel (purple)

Obama 216,197 65% McCain 109,291 33%

Change: McCain +14

Demographics: 17% Hispanic, 6% Asian, 71% White

Communities of Interest: San Carlos, Santa Cruz, Monterey

Status: Safe Democratic

The district gets whiter and safer for Farr. It is interesting though having a district represent Peninsula and San Luis Obisbo communities. I removed Hispanic parts of Monterey County and San Benito County while adding Republican eastern San Luis Obisbo County as well as some white San Mateo County neighborhoods. Farr is still very safe.

18th District Dennis Cardoza (D) Atwater

Obama 96,786 61% McCain 59,722 37%

Change: Obama +4

Demographics: 6% African American, 46% Hispanic, 8% Asian, 36% White

Communities of Interest: Stockton, Modesto, Merced

Status: Safe Democratic

Cardoza loses whiter parts of Merced County and picks up more Hispanic neighborhoods in Madera County, making the district a tad more Democratic and Hispanic.

Photobucket

Fresno area

19th District George Radanovich (R) Mariposa (light green)

Obama 115,407 41% McCain 157,413 57%

Change: McCain +10

Communities of Interest: Clovis, Madera, Merced

Status: Safe Republican

Radanovich’s district was safe already but now it is even safer with the removal of Democratic parts of Fresno and the inclusion of Republican parts of Merced. Also, Yosemite National Park which is Democratic was removed.

20th District Jim Costa (D) Fresno (tan/pink)

Obama 91,480 59% McCain 61,190 40%

Change: McCain +2

Demographics: 6% African American, 55% Hispanic, 7% Asian, 27% White

Communities of Interest: Fresno, Salinas, Shafter

Status: Safe Democratic

Although Costa’s district picks up Democratic and Hispanic areas in Monterey County, the district grows more Republican as it extends into Republican white areas around Fresno formerly in the 19th district. Costa’s district is still Hispanic and Democratic.

21st District Devin Nunes (R) Tulare

Obama 70,892 53% McCain 61,228 46%

Change: Obama +22

Demographics: 63% Hispanic, 25% White

Communities of Interest: Bakersfield, Visalia, Delano

Status: Likely Democratic

This is the new Hispanic majority district in the Central Valley. Nunes’s district now takes in Hispanic parts of Fresno County and Hispanic parts of Tulare County. The district also takes in Hispanic parts of Bakersfield. This district is probably too Hispanic for Nunes so he will probably not run here. The Democrats should find a Hispanic candidate who will help increase the Obama percentage by turning out the Hispanics and having them vote more Democratic. Even if Nunes runs, he should lose.

22nd District Kevin McCarthy (R) Bakersfield

Obama 96,063 37% McCain 161,271 61%

Change: McCain +2

Demographics: 22% Hispanic, 67% White

Communities of Interest: Bakersfield, Visalia, California City

Status: Safe Republican

McCarthy’s district changes as it loses San Luis Obisbo County and picks up Republican parts of Tulare and Ventura Counties. It even goes into Simi Valley which is close to the San Fernando Valley. Nunes might run in this district because the 21st is too Democratic for him. McCarthy should win because most of his current district is in the new 22nd district.

23rd District Lois Capps (D) Santa Barbara

Obama 187,384 61% McCain 115,227 37%

Change: McCain +10

Demographics: 31% Hispanic, 60% White

Communities of Interest: San Luis Obisbo, Santa Barbara, Ventura

Status: Safe Democratic

Capps’s district gets less Democratic. I removed heavily Hispanic Oxnard and added the Republican interior of Santa Barbara County. I also added Ventura and Ojai which lean Democratic. The only place where Capps’s district is a line along the coast is in San Luis Obisbo County. Although her district becomes similar to the competitive 1990’s lines, she is entrenched enough and the areas trended Democratic enough to protect her.

Photobucket

Greater Los Angeles area

24th District Elton Gallegy (R) Simi Valley

Obama 149,125 59% McCain 100,007 40%

Change: Obama +16

Demographics: 39% Hispanic, 9% Asian, 45% White

Communities of Interest: Oxnard, Moorpark, San Fernando Valley

Status: Likely Democratic

Gallegy’s district gets much more Democratic and the Hispanic population rises from 24% to 39% with the inclusion of Oxnard, Hispanic areas in the San Fernando Valley and the loss of interior Santa Barbara County. Although Gallegy is a popular incumbent, the 24th district is too Democratic. He is also not entrenched in Oxnard and the San Fernando Valley. This should get him to retire which he has been considering. This is a good district for Brad Sherman to run in because his district is combined with the more entrenched Howard Berman. The 24th also contains part of Sherman’s current district. If Sherman ran, he would definitely win here.

25th District Buck McKeon (R) Santa Clarita

Obama 135,401 55% McCain 106,766 43%

Change: Obama +10

Demographics: 9% African American, 31% Hispanic, 51% White

Communities of Interest: Lancaster, Victorville, South Lake Tahoe

Status: Toss Up/Tilt Democratic

Although Buck McKeon does not live in the district, it belongs to him because it contains most of his old territory. It will be harder for him to win because I added the Democratic Lake Tahoe area, moved Republican Santa Clarita into the 27th and added a few Hispanic neighborhoods in the San Fernando Valley. Although McKeon is popular, the district is trending Democratic, especially around Lancaster and Palmdale. If the Democrats find a great candidate, they should be able to kick off McKeon.

26th District Vacant (D)

Obama 128,868 63% McCain 71,638 36%

Change: N/A

Demographics: 5% African American, 56% Hispanic, 8% Asian, 28% White

Communities of Interest: Upland, Glendora, San Fernando

Status: Safe Democratic

This new district is also a new Hispanic majority district. It looks like David Dreier’s (R) current district but this district picks up heavily Hispanic areas instead of areas that lean Republican. It does contain Glendora which is Republican though. Still, a Democratic should have no trouble winning here and a 56% Hispanic population (and increasing) should be enough to elect a Hispanic representative.

Photobucket

Inner LA area (I removed the numbers to make the districts easier to see. You can see the numbers in the picture above this one.)

27th District Howard Berman (D) vs. Brad Sherman (D) Green

Obama 204,550 65% McCain 104,583 33%

Change: McCain +22

Demographics: 20% Hispanic, 8% Asian, 64% White

Communities of Interest: Santa Clarita, San Fernando Valley, Burbank

Status: Safe Democratic

Berman’s district gets less Democratic with the inclusion of Santa Clarita and more white but remains heavily Democratic. Sherman has less territory here than Berman so if I were Sherman, I would run in the 24th District which has part of Sherman’s current territory.

28th District Adam Schiff (D) Burbank (originally the 29th)

Obama 179,592 68% McCain 80,069 30%

Change: McCain +0

Demographics: 6% African American, 32% Hispanic, 13% Asian, 43% White

Communities of Interest: Pasadena, Glendale, La Canada Flitridge

Status: Safe Democratic

Schiff’s district remains pretty similar with a high enough white population to keep him in office and Democratic.

29th District Henry Waxman (D) Los Angeles (originally the 30th)

Obama 245,543 68% McCain 111,756 30%

Change: McCain +4

Demographics: 10% Hispanic, 9% Asian, 76% White

Communities of Interest: Thousand Oaks, Beverly Hills, Santa Monica

Status: Safe Democratic

Waxman’s district picks up marginal Thousand Oaks and loses a few Democratic areas in the San Fernando Valley. These minor changes do not affect the district’s strong Democratic lean.

30th District Xavier Beccara (D) Eagle Rock (originally the 31st)

Obama 141,239 81% McCain 29,245 17%

Change: Obama +2

Demographics: 5% African American, 61% Hispanic, 15% Asian, 16% White

Communities of Interest: Monterey Park, Los Angeles

Status: Safe Democratic

Beccara’s district was formerly 70% Hispanic but now has less Hispanics with the inclusion of white areas formerly in Watson’s district. Beccara’s district is still heavily Hispanic and safely Democratic though.

31st District Judy Chu (D) Monterey Park (tan) (originally the 32nd)

Obama 132,559 62% McCain 78,365 36%

Change: McCain +12

Demographics: 39% Hispanic, 38% Asian, 18% White

Communities of Interest: El Monte, Temple City, Walnut

Status: Safe Democratic

I know that Asians do not vote as one bloc but I think if given the choice, they will support an Asian candidate over a Hispanic one. Chu’s district gets more Asian with a small line to Walnut and Diamond Bar and the exclusion of Baldwin Park and the vicinity. I wanted to protect communities of interest but the district had to follow the VRA. Her district gets more Republican but she is still safe.

32nd District Diane Watson (D) Los Angeles (originally the 33rd) Orange color

Obama 149,611 83% McCain 28,305 16%

Change: McCain +8

Demographics: 20% African American, 53% Hispanic, 11% Asian, 12% White

Communities of Interest: Los Angeles, Culver City, Huntington Park

Status: Safe Democratic

Watson is retiring and the Hispanic population is getting too high in Los Angeles to keep three districts with African American representatives. I removed white areas in the northern part of the district and added Hispanic areas on the east and west sides of the original 35th district while taking out some African American areas in the district’s center. The Hispanic population will keep growing so the district should elect a Hispanic.

33rd District Lucille Roybal Allard (D) Los Angeles (formerly the 34th)

Obama 123,083 66% McCain 59,211 32%

Change: McCain +18

Demographics: 74% Hispanic, 18% White

Communities of Interest: Huntington Park, Downey, La Habra

Status: Safe Democratic

Allard’s district gets more Republican with losing some Hispanic areas in Los Angeles and adding whiter Whitter and La Habra. Although La Habra is Republican, Allard’s district is still safe and Democratic.

34th District Maxine Waters (D)

Obama 202,877 88% McCain 23,877 10%

Change: Obama +10

Demographics: 43% African American, 41% Hispanic, 7% Asian, 6% White

Communities of Interest: Los Angeles, Inglewood, Gardena

Status: Safe Democratic

Waters’s district gets safer as the African American population increases from 34% to 43%. Also, something interesting is you can see how high African American turnout really was by looking at the precincts. There were 930 votes in a 92% African American precinct with 1,380 people.

35th District Jane Harman (D) Venice (formerly the 36th) Purple

Obama 192,875 62% McCain 113,650 36%

Change: McCain +4

Demographics: 26% Hispanic, 15% Asian, 51% White

Communities of Interest: Torrance, Redondo Beach, Manhattan Beach

Status: Safe Democratic

Harman’s district gets more Republican with the addition of Rancho Palos Verdes which leans Republican. Communities in the district’s northern part like Venice keep Harman safe though.

Photobucket

Orange County area

36th District Laura Richardson (D) Long Beach (formerly the 37th)

Obama 162,948 71% McCain 61,850 28%

Change: McCain +18

Demographics: 22% African American, 40% Hispanic, 11% Asian, 23% White

Communities of Interest: Carson, Compton, Seal Beach

Status: Safe Democratic

Adding Orange County communities that lean Republican such as Seal Beach and Los Alamitos make this district more Republican. They also reduce the Hispanic population by a few points though. Richardson should have no problems from Republicans in a district where McCain won 28% of the vote though.

37th District Grace Napolitiano (D) Norwalk (formerly the 38th district)(blue)

Obama 131,462 67% McCain 59,629 31%

Change: McCain +8

Demographics: 66% Hispanic, 15% Asian, 14% White

Communities of Interest: Baldwin Park, Chino Hills, Pico Rivera

Status: Safe Democratic

Grace Napolitiano (D) has her home in the 38th district but she should run here because this district has most of her current district. The district becomes a bit gerrymandered by having the 32nd cut into the middle of it. Also, her district gets Republican Chino Hills. It is still safely Democratic though.

38th District Linda Sanchez (D) Lakewood (formerly the 39th)

Obama 135,584 60% McCain 87,210 38%

Change: McCain +12

Demographics: 6% African American, 54% Hispanic, 9% Asian, 29% White

Communities of Interest: Lynwood, Bellflower, Fullerton

Status: Safe Democratic

Napolitiano should run in the 37th district so Sanchez should be safe from a primary challenge. Also, the district should be Hispanic and Democratic enough to protect her from Republicans. Her district does get weaker with the addition of Republican parts of Fullerton though.

39th District Ed Royce (R) Fullerton (formerly the 40th district)

Obama 113,574 54% McCain 93,975 44%

Change: Obama +14

Demographics: 40% Hispanic, 18% Asian, 35% White

Communities of Interest: Norwalk, Cypress, Anaheim

Status: Toss Up/Tilt Democratic

Royce’s district gets much more Democratic with the addition of Democratic parts of Anaheim, Norwalk and he loses Republican parts of Fullerton to the 42nd. Royce is pretty entrenched in his district but not in the Norwalk area so Democrats have a strong shot at replacing him. I wish I could have done more to protect communities of interest in this district though. Also, it would not be easy for a Republican to win in a 35% White district (and decreasing.)

Photobucket

Inland Empire

40th District David Dreier (R) San Dimas (formerly the 26th)

Obama 127,168 58% McCain 89,498 40%

Change: Obama +14

Demographics: 7% African American, 46% Hispanic, 7% Asian, 37% White

Communities of Interest: Pomona, Upland, Rancho Cucamonga

Status: Likely Democratic

Dreier is a pretty popular incumbent but even he will have trouble in a 58% Obama district with unfamiliar territory such as Azusa, Ontario and Pomona. He also loses the most Republican parts of his current district. Dreier will probably not run and a Democrat will win easily. If Dreier runs, he will probably not be strong enough to compete with the new Democratic areas. I hope a Hispanic politician wins this seat and although Hispanics do not make a large share of voters, there should be more in the Democratic primary.

41st District Jerry Lewis (R) Redlands

Obama 104,391 41% McCain 147,051 57%

Change: McCain +6

Demographics: 20% Hispanic, 69% White

Communities of Interest: Hesperia, Beaumont, Yucaipa

Status: Safe Republican

Lewis was extremely safe before and he gets even safer. Enough said.

42nd District Gary Miller (R) Diamond Bar

Obama 131,169 40% McCain 189,640 58%

Change: McCain +10

Demographics: 15% Hispanic, 8% Asian, 71% White

Communities of Interest: Yorba Linda, Murrieta, Rancho Santa Margarita

Status: Safe Republican

Miller loses his home but he does not have to live in this district to run. His district gets more Republican by picking up the Lake Forest area formerly in the 44th and Murrieta formerly in the 45th. He has no worries.

43rd District Joe Baca (D) Rialto

Obama 107,522 66% McCain 52,753 32%

Change: McCain +4

Demographics: 14% African American, 51% Hispanic, 5% Asian, 27% White

Communities of Interest: San Bernadino, Fontana, Ontario

Status: Safe Democratic

Baca’s district gets less Hispanic but the Hispanic population is growing quickly and he is entrenched enough to survive. He should have no problems from Republicans though.

44th District Ken Calvert (R) Corona

Obama 92,733 56% McCain 70,846 43%

Change: Obama +12

Demographics: 7% African American, 43% Hispanic, 5% Asian, 41% White

Communities of Interest: Riverside, Norco, Colton

Status: Likely Democratic

In 2008, Calvert barely won reelection but he lost Riverside County. Now with the Republican parts of Orange County removed, Calvert is in trouble. I also removed Republican areas in Riverside County too and the addition of heavily Hispanic Colton does not help Calvert either. Since Calvert was already weak, it should not be too difficult to find a challenger, get the DCCC interested and kick out Calvert.

45th District Mary Bono (R) Palm Springs

Obama 113,612 57% McCain 82,064 42%

Change: Obama +10

Demographics: 10% African American, 36% Hispanic, 46% White

Communities of Interest: Moreno Valley, Perris, San Jacinto

Status: Lean Democratic

Bono is a popular moderate incumbent but she will probably lose here. I added Democratic Perris and Lake Elsinore while removing Hemet. Also, the district has fast growing African American and Hispanic populations so if a Democrat is not reelected in 2012, a Democrat certainly will be soon.

46th District Dana Rohrabacher (R) Huntington Beach

Obama 163,591 55% McCain 127,405 43%

Change: Obama +10

Demographics: 23% Hispanic, 13% Asian, 58% White

Communities of Interest: Long Beach, Irvine, Costa Mesa

Status: Lean Democratic

Rohrabacher keeps most of his old district where he is entrenched. Still, the addition of Irvine and Democratic Long Beach areas should be enough to unseat him with a good candidate.

47th District Loretta Sanchez (D) Garden Grove

Obama 89,040 55% McCain 69,075 43%

Change: McCain +10

Demographics: 55% Hispanic, 19% Asian, 21% White

Communities of Interest: Santa Ana, Anaheim, Tustin

Status: Likely Democratic

Sanchez’s district gets less Democratic and Hispanic but Sanchez is entrenched and should win Hispanic by large margins.

48th District John Campbell (R) Irvine  Peach

Obama 135,283 48% McCain 144,225 51%

Change: McCain +3

Demographics: 21% Hispanic, 7% Asian, 65% White

Communities of Interest: Vista, Oceanside, Lake Forest

Status: Likely Republican

Yes, I know Campbell is a birther but I realized that if I tried to get rid of him, I would make other seats safer for Republicans that I wanted Democratic. Campbell’s district is mostly shifted out of the Irvine area into more conservative Vista and Oceanside. By the end of the decade, Campbell should be vulnerable but for now, he is unfortunately safe.

49th District Darrell Issa (R) Vista

Obama 113,663 39% McCain 175,745 59%

Change: McCain +12

Demographics: 18% Hispanic, 73% White

Communities of Interest: Hemet, Temecula, Poway

Status: Safe Republican

Issa’s home is not in the district but he should not mind. His district gets more Republican with the loss of Perris and Lake Elsinore.

Photobucket

San Diego

50th District Brian Bilbray (R) Carlsbad

Obama 187,575 56% McCain 144,396 42%

Change: Obama +10

Demographics: 19% Hispanic, 6% Asian, 70% White

Communities of Interest: Carlsbad, Escondido, San Diego

Status: Likely Democratic

Bilbray has faced close races in his currently marginal district but the addition of liberal parts of San Diego near the coast make the district more Democratic. He also loses more conservative areas in the east to the 53rd district. These changes should be enough to elect a Democrat.

51st District Bob Filner (D) San Diego

Obama 112,770 63% McCain 64,790 36%

Change: McCain +0

Demographics: 7% African American, 62% Hispanic, 10% Asian, 19% White

Communities of Interest: Indio, El Centro, Chula Vista

Status: Safe Democratic

I think Bob Filner is fine but I wanted another Hispanic congressman so I increased the Hispanic population from 53% to 62%. Although Filner has not faced many challenges recently, the change in population should attract a strong Hispanic candidate.

52nd District Duncan Hunter Jr. (R) Lakeside

Obama 135,237 56% McCain 101,445 42%

Change: Obama +22

Demographics: 7% African American, 29% Hispanic, 9% Asian, 51% White

Communities of Interest: La Mesa, El Cajon, Chula Vista

Status: Likely Democratic

This district undergoes one of the largest partisan changes under my plan. Duncan Hunter Jr. is new to this district. The addition of Chula Vista and Democratic parts of San Diego unfamiliar with him (and his father) will not help him. The changes should make the district Democratic enough to elect a Democrat.

53rd District Susan Davis (D) San Diego

Obama 167,156 60% McCain 107,595 38%

Change: McCain +16

Demographics: 7% African American, 24% Hispanic, 14% Asian, 51% White

Communities of Interest: Cornado, Imperial Beach, San Diego

Status: Safe Democratic

Davis’s district goes inland and therefore gets more Republican but coastal areas keep this district Democratic.

Still want more election analysis? If yes, please check out my blog http://frogandturtle.blogspot…. Thanks! I have some posts there I have not posted here yet.

By what margin will Bob Shamansky win?

View Results

Loading ... Loading ...

SSP Daily Digest: 6/4 (Morning Edition)

  • AR-Sen: We knew the SEIU wasn’t going to fuck around. Their newest (and probably final) ad buy on behalf of Bill Halter (which we mentioned yesterday) is on the order of $370K. The League of Conservation Voters is also putting down $100K for a buy of their own, also in support of Halter.
  • KY-Sen: Rand Paul, the son of Ayn Rand and a Somali warlord, must be dying inside: He actually felt compelled to call for more regulation of offshore drilling. Upon hearing this, a thousand Austrian School economists tried to jump off a bridge, but couldn’t find one as the free market had decided a bridge was unnecessary.
  • NH-Sen: Former AG Kelly Ayotte is being called to testify before a state senate committee investigating the collapse of a mortgage company called FRM which is accused of running a Ponzi scheme – and which was allowed to continue in operation while Ayotte’s department was supposedly regulating it. It’s belated, but at least someone is watching the watchmen.
  • AL-Gov: Artur Davis: “I have no interest in running for political office again. The voters spoke in a very decisive way across every sector and in every section of the state. A candidate that fails across-the-board like that obviously needs to find something else productive to do with his life.”
  • NM-Gov: Diane Denish is already out with a negative ad trying to paint GOP opponent Susana Martinez as an ineffective prosecutor, saying she went soft on DWI felons and had the worst conviction record in New Mexico. No word on the size of the buy, though the Denish campaign says, according to Heath Haussamen, that the ad “is running statewide on network and cable television.”
  • NY-Gov: Andrew Cuomo is trying to kill off the Working Families Party. He says he doesn’t want their ballot line this fall, without which the WFP has almost no hope of getting the 50,000 votes it needs to stay on the ballot for the next four years. The party is under investigation by the Manhattan US Attorney’s Office, and hyper-ventilators like the Daily News editorial page accuse it of sponsoring a “job-killing agenda,” so you might think there’s sufficient reason for Cuomo to avoid the WFP on the merits.
  • But I don’t think that adds up, because few voters pay attention to this stuff, which means that Cuomo will miss out on more votes without the WFP line than he’d risk losing by accepting the party’s endorsement – so it looks like a power play to me. (Note that state lawmakers friendly to the WFP are trying to introduce legislation which would allow a party to remain on the ballot if it got 50K votes in any statewide election, which would allow the party to bootstrap itself to, say, the Schumer or Gillibrand campaigns.)

  • FL-08: Uh, is this really an endorsement that you want? Former state House Speaker Daniel Webster, hoping to challenge Alan Grayson in the fall, secured the backing of ex-Rep. Tom Feeney. Feeney was last seen apologizing to voters for his role in the Abramoff scandal while getting his ass kicked by Suzanne Kosmas.
  • ID-01: I know we all miss Vaughn Ward terribly, but I think we’ll enjoy having Raul Labrador to kick around, too. It turns out that Labrador forgot to get his cooties vaccination, because the NRCC is keeping him in one of those glove-box containment zones. GOP brass has no plans, says Politico, to add the Lab to their Young Guns list – even though it already contains an absurd 110 names. Michael Steele, though, seems to like Raul just fine (which makes sense), sending some cash to help the Idaho GOP.
  • AL-Ag. Comm’r: May the Flying Spaghetti Monster bless Dale Peterson:
  • Boy!  We put up a tough fight in round one.  The thugs made a full court press to stop me by making hundreds of thousands of “robo calls” with lies about me.  

    Rest assured, Dummy and the thugs at ALFA will not go quietly – so expect them to launch a full-scale attack against John McMillan in the coming weeks as the July 13 runoff draws near.  Just remember, the word “truth” is not in their vocabulary.

    Because good ol’ Dale gives a RIIIIIP about Alabama, he promises that he’s “not going away.” Hooray!

  • Rasmussen: Commenters here have been all over it, but Markos lays out in bright orange letters exactly how fucked up Rasmussen’s recent polling in CT-Sen and KY-Sen has been.
  • IL-Sen: Kirk Discrepancies Keep Piling Up

    It sure looks like we misunderestimated Mark Kirk, who said of the newest revelation about discrepancies in his military record: “I simply misremembered it wrong.” The dealio this time?

    Kirk, an intelligence officer, told the Sun-Times he was never fired on as he flew over Iraq or Kosovo. He never said he was fired on, he said in reply to a question from the Sun-Times. “No, no. There’s no contradiction. I remember being illuminated by air defense.”

    Little problem, though:

    Contrary to his claim to the Sun-Times, Kirk did talk about being shot at, on Oct. 1, 2003, from the House floor. Kirk spoke so imprecisely as to be misleading. “I just returned from Iraq and the trend is for the better,” Kirk said, with his comments captured on C-SPAN. He goes on to say, “the last time I was in Iraq I was in uniform, flying at 20,000 feet and the Iraqi Air Defense network was shooting at us. That force is now gone.”

    Was Sinbad the back-seater on that F-14?

    And there’s yet another problem, this one uncovered by Markos Moulitsas. In a letter to constituents, Kirk claimed he was a veteran of Desert Storm, even though he was never deployed to Kuwait or Iraq. Markos, himself a veteran, explains:

    I was in the Army during Desert Storm, but am not a veteran of that war. Why? Because I was stationed in Germany and never deployed to Kuwait or Iraq. Kirk might argue that his efforts aided the war effort. Well, so did mine. I spent weeks shuttling supplies from depots in Germany to Frankfurt, where they were loaded onto transport planes to the Gulf. I lugged around everything from ammo to toilet paper (no joke). I spent weeks more working on my base’s post office, helping the small office handle the crush of letters and care packages being sent to deployed soldiers by their families. Seems trite, and it kind of is (and tedious as shit), but there’s little more important to a soldier than mail call. Trust me on that.

    Still, that doesn’t make me a “veteran of the Desert Storm mission”, just like it doesn’t make Kirk a veteran of that war.

    This is pretty much exactly the same thing that Kirk did with regard to Operation Iraqi Freedom – claim he was a veteran of that engagement even though he only served during that conflict. And of course, it’s pretty much exactly what Dick Blumenthal did, too. As Markos says, “Kirk served honorably. He did an important job, and by all accounts did it well. So why the need to embellish?” You could ask the same thing about Dick Blumenthal. And of course, you could also ask where the media firestorm is about Kirk. At least Blumenthal’s mis-statements were confined to one matter – Kirk’s now up to three.