SSP Daily Digest: 3/4

AZ-Sen: Sources are telling Roll Call that Rep. Trent Franks is planning to run for Sen. John Kyl’s open seat. I personally think Franks will get in – Jeff Flake definitely will not have this race to himself.

HI-Sen: Former part-term Rep. Charles Djou (I’d say we hardly knew ye, but I think we got to know him pretty well) says he’s considering a senate bid, but it sounds like he wants to wait and see what his fellow Republican (and next-door neighbor) Linda Lingle does first.

MO-Sen: Remember when Claire McCaskill said she’d co-sponsor Bob Corker’s CAP Act – the bill designed to take an axe to, among other things, Social Security? Now she’s telling her constituents in a letter that she’ll “vote against” any cuts to SS. So either she’s backtracking on her idiotic support of Corker’s bill, or she somehow thinks this pledge doesn’t conflict with that piece of legislation. In other words, she’s come to her senses – or she’s talking out of both sides of her mouth. We’ll see.

NV-Sen: The committee investigating John Ensign’s affair-and-hush-money scandal just interviewed Sen. Tom Coburn, which Politico claims is a sign that the inquiry is “intensifying,” but who knows – the whole thing could be winding down, especially since the Justice Department pathetically dropped their entire case against Ensign. I’d be surprised if any serious punishment is meted out here.

AZ-07: Some Dude Gabriela Saucedo Mercer announced a challenge to Rep. Raul Grijalva (D). Saucedo Mercer volunteered for fellow Republican Ruth McClung last time, who herself said after the election that she will “probably” run again.

CA-36: This can’t be the sort of news Republicans were hoping for: Redondo Beach Mayor Mike Gin said he’s joining the field of candidates hoping to succeed the now-departed Jane Harman. Why is this a problem? Because Gin is now the second non-Some Dude Republican running – Redondo’s elected city attorney, Mike Webb, is already in the race. If the GOP ever had any, any chance whatsoever of sneaking out a win here, it could only have happened with a single candidate to unite behind. Now, it seems impossible for one of their own to make it into a runoff, unless the Democratic field gets absurdly fractured.

MD-02: Huh. So it looks like fifth-term Dem Rep. Charles Albert Ruppersberger III – you know him as “Dutch” – already has a non-Some Dude opponent. Republican state Delegate Patrick McDonough (who is also a talk radio host) represents a reliably red district and has already managed to score Christine O’Donnell to headline a fundraiser for him. This district went 60% for Obama and 54% for Kerry, and I can’t imagine the Dem-held legislature would risk making this seat any redder if Ruppersberger looked genuinely threatened, so McDonough will have a hell of a challenge.

MI-12: Rep. Sandy Levin became the latest veteran Michigan Dem (along with Johns Dingell & Conyers, and Dale Kildee) to confirm that he’ll seek another term.

NY-26: Erie County Comptroller Mark Poloncarz has told Democratic leaders to drop his name from consideration as a possible candidate for the upcoming special election. Is it just me, or is it a little worrisome that we still seem to be so far away from choosing a nominee? Just another reason why we should have primaries for special elections in New York.

The legislature did just pass one small bit of elections reform: Once Gov. Cuomo signs the bill, special elections will now be held 70 to 80 days after their announcement by the governor (as opposed to 30 to 40 right now), to give county boards more time to handle military and overseas ballots. This was done to bring NY into better compliance with federal law, but still note that there is no specific timeframe in which a governor must actually call for a special – this law only applies to the time period after one has been called.

OH-01: Cincinnati NAACP President Christopher Smitherman tells Dave Catanese that he thinks Cincinnati Mayor Mark Mallory is “floating the idea of a run” against Rep. Steve Chabot. Mallory is black, and Smitherman notes, of course, that President Obama will be at the top of the ticket. The current OH-01 is 29% black, as strong black turnout was responsible for Steve Chabot losing in 2008.

IN-SoS: Republican Secretary of State Charlie White was just indicted on seven felony counts, “including voter fraud, perjury and theft.” White is accused of intentionally voting in a precinct he didn’t live in. Funny how after all their bogus charges of “voter fraud!!!!!!!!!!!!!!1111111111,” the one guy who actually gets hauled up on charges is nothing less than the guy responsible for ensuring the integrity of elections – and a Republican, to boot.

Idaho: Due to a court challenge, which found Idaho’s system of open primaries unconstitutional under the First Amendment, Idaho looks like it will be moving toward closed primaries – or at least, a setup where you have to register with the Republican Party in order to vote in GOP primaries.

MS Redistricting: So it looks like Mississippi may be the first state in the nation to adopt any sort of actual redistricting map – not a surprise, seeing as the state holds legislative elections later this year. The state House will vote on its own map as early as this Friday. (Click here for the map, and click here for the demographic breakdowns.) Believe it or not, the state House is actually still run by the Democrats, and predictably, Republicans don’t like their plan, calling it an incumbent protection plan for Dems. Still, it will likely pass – Dems insist all lawmakers have had a chance to give their input, and the GOP, which controls the state Senate, will need Democratic cooperation in the lower body to get their corresponding map approved.

PA St. Sen.: Craziness – local Republicans are reportedly preparing for a special election in the 40th district to replace the seemingly-doomed state Sen. Jane Orie… whose corruption case just ended in a mistrial today. But it’s not the kind of bad trial thingy a defendant typically roots for (i.e., a hung jury). Rather, the judge dismissed the jury because documents entered into evidence by the defense contained forged signatures. Said the judge to Orie’s attorney: “Ray Charles could see that those signatures were doctored.” So it seems like Orie may live to fry another day.

Race and Crime In The Big City: The Baltimore States’ Attorney Race (Conclusion)

This is the final installment in a four-part series about the 2010 Democratic Primary for States’ Attorney for Baltimore City in Maryland.

Why is this race notable? Well, the result, an upset win by challenger Gregg Bernstein over incumbent States’ Attorney Patricia Jessamy, challenged a lot of widely-held assumptions about racial dynamics in large cities and how one can win elections in the City of Baltimore and perhaps other similar jurisdictions.

Not to rehash the introduction, but since it’s been a while now… Jessamy had been pretty popular among the Black majority in Baltimore but was strongly disliked by the law enforcement community and had a feud with then-Mayor Martin O’Malley about police tactics. She was re-elected in 2006 with 71.52% of the vote against an largely unknown opponent in the Democratic primary named Aaron Fogleman who ran a minimal campaign. Fogleman nonetheless won nearly half of the White vote, and about 15% of the Black vote.  

So not many people gave Gregg Bernstein much of a chance when the campaign got off to a slow start in the spring, but the skeptics, myself included, were proven wrong…  

For a broad overview of what’s going on here, check out Part 1. For a summary of the methodology I used and what I looked for, check out Part 2. For a whole bunch of data about Baltimore elections and my attempt to put them in the context of what I expected to see when I looked at the election that was the subject of this series, check out Part 3.  

To refresh your memory, I classified Baltimore’s voting precincts (based on data from Dave’s App, which unfortunately is out of date b/c the city did a lot of precinct consolidation between 2000 and 2006) into six categories and twenty zones:

By Category:

baltbyrace

Type I: Red on the map. More than 70% White, less than 5% Hispanic and Asian population. Mostly found on the periphery of town. The Federal Hill, Mt. Washington, Roland Park, and Hampden areas consisted mostly of such precincts.

2006: Jessamy 7311 (51%), Fogleman 6932 (49%)

2010: Bernstein 10127 (79%), Jessamy 2447 (19%), Lansey 290 (2%)

Type II: Green on the map. More than 5% Hispanic. (Most of these were predominantly white, but two were otherwise predominantly black.) The lion’s share of these precincts were in Fells Point, Canton, or Highlandtown.

2006: Jessamy 1649 (50%), Fogleman 1630 (50%)

2010: Bernstein 2290 (77%), Jessamy 595 (20%), Lansey (3%)

Type III: Yellow on the map. More than 5% Asian. (Most of these were predominantly white, but two were otherwise predominantly black.) Most of these precincts were found in Downtown/Midtown or Charles Village, with a few that marginally qualified in Hampden.

2006: Jessamy 2331 (55%), Fogleman 1871 (45%)

2010: Bernstein 2994 (75%), Jessamy 898 (23%), Lansey 76 (2%)

Type IV: Gray on the map. None the above, but with more Whites than Blacks. They were scattered across town, with a cluster of them is in Northeast Baltimore.

2006: Jessamy 1706 (64%), Fogleman 976 (36%)

2010: Bernstein 1287 (58%), Jessamy 851 (38%), Lansey 91 (4%)

Type V: Teal Blue on the map. None of the above, more Blacks than Whites but Black population less than 70%. They are also scattered across town, and Northeast Baltimore has a cluster of them.

2006: Jessamy 3438 (71%), Fogleman 1386 (29%)

2010: Bernstein 1848 (48%), Jessamy 1837 (48%), Lansey 139 (4%)

Type VI: Blue on the map. More than 70% Black, less than 5% Hispanic and Asian. The West Baltimore, East Baltimore, and Forest Park/Arlington zones consist exclusively of such precincts; the Near West Baltimore, Frankford, Govans/Northwood, Waverly/Montebello, and Park Heights zones consist mostly of such precincts.    

2006: Jessamy 33413 (83%), Fogleman 6841 (17%)

2010: Jessamy 19200 (66%), Bernstein 8760 (30%), Lansey 1324 (5%)

By Neighborhood:

baltbyzone

[Note: Part 3 of this series contains more detailed descriptions of each of these clusters of neighborhoods than can be found here.]

Brooklyn/Cherry Hill [dark blue]:

2006: Jessamy 1131 (71%), Fogleman 473 (29%)

2010: Jessamy 705 (49%), Bernstein 633 (44%), Lansey 104 (7%)

Traditionally working class and racially mixed south Baltimore sums up Pat Jessamy’s whole problem in this re-election, even though she retained a bigger share of her 2006 vote total here than in the city as a whole. It was also the best-performing region for little-discussed third candidate Cheryl Lansey, also an African-American female, accused of being a spoiler candidate by Jessamy supporters.  

Federal Hill/Locust Point [dark green]:

2006: Fogleman 1013 (55%), Jessamy 823 (45%)

2010: Bernstein 1759 (86%), Jessamy 231 (11%), Lansey 58 (3%)

The whitest and generally most Republican-voting part of town (in 2006, Ehrlich topped 40% here while Steele topped 35%; in 2008, McCain fell just short of 35%, all very high for Baltimore) had already thought so little of Pat Jessamy that they voted for someone who barely campaigned over her in 2006. Bernstein swept all 10 of it’s precincts; one precinct, 24-02, gave the incumbent 4 votes of 90, her worst showing in the entire city. In context these numbers are unsurprising. But 11% is really low, and, even worse for Jessamy, this was one of only three zones to have a higher vote total in the 2010 primary than in the 2006 one.

Southwest Baltimore [purple]:

2006: Jessamy 637 (54%), Fogleman 542 (46%)

2010: Bernstein 793 (70%), Jessamy 298 (26%), Lansey 47 (4%)

This area is another part of town that tells the story in miniature. Jessamy went from carrying six of its nine precincts to carrying only one, and even in that one (20-11) she went from 62% of the vote to 46%. The big thumbs down came from precinct 25-04, one of only five precincts to be carried by John McCain.    

Edmondson [red]:

2006: Jessamy 2840 (80%), Fogleman 691 (20%)

2010: Jessamy 1668 (61%), Bernstein 963 (35%), Lansey 96 (4%)

And here’s where we learn that it was a multi-racial coalition that brought down Pat Jessamy.

Jessamy carried every precinct here but except for 28-15…but these areas supported black candidates over white ones big time (84% for Obama in his ’08 primary, 81% for Mfume in his ’06 Senate primary) in every previous election I looked at. While some of these precincts actually have sizable a sizable white minority, the ones further away from the county line don’t, and Bernstein was still getting in the 30% range in most such precincts, and that’s worth noting.

West Baltimore [mustard yellow]:

2006: Jessamy 5364 (85%), Fogleman 944 (15%)

2010: Jessamy 3056 (69%), Bernstein 1112 (25%), Lansey 241 (5%)

This one is partially about the ability of Bernstein to get at least some measure of the vote even in an area like this one (and this was his worst showing in town) where nearly everyone is both black and poor and suspicion of law enforcement tends to run high. But it’s mostly about the lack of turnout. Bernstein got 200 more votes than Fogleman did, which isn’t much; the real story is Pat Jessamy coming out of this area with a net loss of nearly 2,300 votes. That hurts.

Near West Baltimore [teal blue]:

2006: Jessamy 2539 (80%), Fogleman 641 (20%)

2010: Jessamy 1551 (64%), Bernstein 750 (31%), Lansey 116 (5%)

Same as above, but shifted five points since there are some urban gentrifiers here. I wondered if their effect would an amplification of a shift away from Jessamy. It did not.  

Downtown & Midtown [gray]:

2006: Jessamy 1107 (56%), Fogleman 874 (44%)

2010: Bernstein 1297 (60%), Jessamy (36%), Lansey 75 (3%)

I wonder if the demographics of this area may have shifted some in four years as it covers the booming Harbor East district. Either way, it went from a set of precincts that ranged between being indifferent towards and relatively friendly towards the incumbent turned hostile. In 2006 Jessamy carried 13 of these 15 precincts, tying in another, and losing one (11-05) by two votes. This time, Bernstein carried 11 of them. Even worse for Jessamy, this was the other area that cast substantially more votes in the 2010 primary than the one four years earlier, which possibly reflects the revitalization of central Baltimore vis-a-vis the rest of the city. (Interesting side note: Bernstein’s people were all over Baltimore Pride events this summer; Bernstein cleaned up in four precincts with large gay populations in Mt. Vernon and Bolton Hill that were some of Jessamy’s best predominantly white precincts in 2006.)  

East Baltimore [gray-blue]:

2006: Jessamy 3822 (85%), Fogleman 666 (15%)

2010: Jessamy 2224 (69%), Bernstein 859 (27%), Lansey 157 (5%)

See West Baltimore above. Proportions are almost exactly the same. The presence of Johns Hopkins Medical School is probably the main difference.  

Fells Point & Canton [aqua]:

2006: Fogleman 1219 (56%), Jessamy 953 (44%)

2010: Bernstein 1726 (83%), Jessamy 306 (15%), Lansey 58 (3%)

Much like Federal Hill, except with a larger Hispanic population and somewhat more liberal political outlook as a whole (it’s around 4-5 points more liberal and more Democratic than Fed Hill, Obama overperformed a little as well.) However, it had giving Jessamy her worst showing in 2006. And it was the site of the infamous Zach Sowers beating a few years back, in which Jessamy’s spokeswoman was berated for insensitivity to the family and community, so Jessamy had to know she was going to get crushed here.

Highlandtown [magenta]:

2006: Fogleman 970 (52%), Jessamy 895 (48%)

2010: Bernstein 1241 (80%), Jessamy 247 (16%), Lansey 56 (4%)

This southeastern part of town has more of a working class flavor than touristy Fells Point and yuppie haven Canton. Much like the East Side of Baltimore County (Dundalk, Essex) it borders, it’s got a reputation for Reagan Democrats none too fond of voting for black candidates. It’s where Barack Obama had his worst showing in town (Hillary Clinton got 57% of the primary vote, nearly 15 points more than any in other part of the city; John McCain got 37% of the general election vote, his best showing in the city) in 2008. Just to confuse everyone though, Pat Jessamy did carry the area in 2006, albeit barely. In 2010, Highlandtown was not Pat Jessamy’s worst area…but it was plenty bad enough at an even 16%.  

Frankford [lime green]:

2006: Jessamy 3076 (81%), Fogleman 738 (19%)

2010: Jessamy 1753 (59%), Bernstein 1059 (36%), Lansey 169 (6%)

Predominantly black (middle-class black specifically) but not monolithic, Jessamy lost 22 points and 1,300 votes here. A decent chunk of voters took the third option with Cheryl Lansey here, and in this area she was stronger where Jessamy was also strong as opposed to where Bernstein was strong, suggesting that the spoiler factor may have been key. Jessamy won 13 of the 15 precincts here, but mostly with numbers in the 50s and 60s rather than the 70s and 80s she got last time around.    

Northeast Baltimore [light blue]:

2006: Jessamy 3467 (61%), Fogleman 2172 (39%)

2010: Bernstein 2806 (60%), Jessamy 1701 (35%), Lansey 160 (3%)

Here’s one battleground where the Bernstein campaign did some heavy lifting, the area’s voting patterns doing a near-perfect 180 degree turn. Jessamy carried 18 of 22 precincts in her 2006 re-election, and Bernstein flipped all but two of them this time out for 20 of 22. There are more whites than blacks here, but neither Mfume (51% in his Senate primary) nor Obama (71% primary, 79% general) had that much trouble getting votes in this part of town; if I had to credit one part of town with being the tipping point, I’d probably cite this one as the most pivotal.

Govans/Northwood [peach]:

2006: Jessamy 5137 (82%), Fogleman 1124 (18%)

2010: Jessamy 2695 (62%), Bernstein 1524 (35%), Lansey 147 (3%)

This is where Pat Jessamy lives. Ouch. If she had gotten everyone in her own neighborhood who voted for her in 2006 to do so again, she would have squeaked by. Instead, she lost 400 votes to the white challenger, 147 votes to a random black challenger, and 1895 votes – enough by itself to put her over the top – to non-turnout. (Some people might have moved away; we’ll learn more when the new Census data emerges.) This was, incidentally, the second biggest turnout drop in the city after Park Heights; my postulate about middle-class black areas like this one holding turnout better between elections than poor areas turns out not to have held, at least in Baltimore.  

Waverly/Montebello [olive]:

2006: Jessamy 2547 (81%), Fogleman 590 (19%)

2010: Jessamy 1465 (60%), Bernstein 843 (35%), Lansey 114 (5%)

There are 12 precincts in this zone. Jessamy carried all of them both times. But instead of racking up numbers between 73-88%, they ranged from 51-70% instead. Couple that with the dropped turnout, and it spelled trouble for the incumbent as well as evidencing the fact that it wasn’t just a matter of Bernstein racking up the big numbers in white parts of town.

Roland Park, Guilford & Homeland [orange]:

2006: Jessamy 2005 (52%), Fogleman 1880 (48%)

2010: Bernstein 3082 (85%), Jessamy 534 (15%), Lansey 25 (1%)

In addition to being the wealthiest part of Baltimore, this is Bernstein’s home turf and does it ever show. Previously somewhat less hostile to Jessamy (it’s mostly liberals, and there’s just not much crime up there to complain about) than other white parts of town..one of their own put up huge numbers. (If Northwood had done for Jessamy what Roland Park did for Bernstein, Bernstein would have lost.) Bernstein’s 37 point improvement on Fogleman in this zone put him over the top.  

Charles Village [light green]:

2006: Jessamy 1000 (64%), Fogleman 554 (36%)

2010: Bernstein 873 (63%), Jessamy 462 (34%) Lansey 44 (3%)

The other big 180 reversal. It’s relatively integrated and chock full of liberals of all colors (they liked Mfume and loved Obama..but black Republican Michael Steele saw perhaps his worst numbers in the entire state there) that match the brightly colored houses that famously line some of its blocks. Jessamy won a comfortable 63% of the vote there last time.  

What happened here? Well, early this summer, an unarmed Hopkins graduate student was murdered in a robbery in broad daylight on a Charles Village street thought to be reasonably safe by a guy with a rap sheet a mile long. And people were pissed. Jessamy went to a community memorial for the student and got, to put it mildly, a very chilly reception. It was perhaps the flashpoint of the election.

Hampden [indigo]:

2006: Fogleman 937 (56%), Jessamy 733 (44%)

2010: Bernstein 1460 (87%), Jessamy 200 (12%), Lansey 21 (1%)

Bernstein did even better here than in neighboring Roland Park, not that he needed to do much to convince Hampdenites to not vote for Jessamy. The area has fewer blacks per capita than anywhere else in town and has long had a reputation for hostility towards black politicians (and towards non-politicians as well) although the reality is now somewhat more complicated by an influx of new residents and a softening of some old attitudes. Barack Obama found more support (56% primary, 72% general) than one would expect based on the old stereotypes.

But, yeah, everybody knew going in Pat Jessamy was not going to find much support here. I might have expected more than 12% though; Jessamy only got 20% in precinct 12-03, which is quite a bit more diverse than the rest of the area. Aaron Fogleman did about that well in West Baltimore and he barely campaigned. Also: note how few votes for Lansey there were here and in other mostly white areas.

Mount Washington/Cross Country [light-yellow]:

2006: Jessamy 2616 (57%), Fogleman 1988 (43%)

2010: Bernstein 2653 (73%), Jessamy 921 (25%), Lansey 74 (2%)

Pretty dramatic turnaround here too. In 2006 Jessamy won 9 of 11 precincts. The other two are part of an three-precinct [27-64, 27-65, and 27-66] cluster consisting largely of Orthodox Jews in the city’s NW corner; in general elections, McCain won all three precincts, Ehrlich won two of them, and all three were strong for Hillary in the ’08 primary.) This time around, Jessamy only carried a single precinct, 28-01, whose demographics are quite different than the others in this zone. Bernstein cleaned up in the Orthodox zone but almost as well in the rest of Cross County and even in more liberal Mount Washington Village.    

Park Heights [yellow-green]:

2006: Jessamy 2821 (82%), Fogleman 618 (18%)

2010: Jessamy 1578 (70%), Bernstein 597 (26%), Lansey 93 (4%)

The good news for Jessamy is that she held a higher percentage of her 2006 vote here than anywhere else in the city, and it’s the only part of town where Bernstein actually failed to match Fogleman’s vote total from 2006. The bad news is that turnout in this largely struggling area dropped 34% from 2006. So Jessamy’s vote margin here was nonetheless cut in half.  

Forest Park/Arlington [pink]:

2006: Jessamy 5720 (85%), Fogleman 975 (15%)

2010: Jessamy 3459 (71%), Bernstein 1265 (26%), Lansey 156 (3%)

This biggest redoubt of black middle-class voters in the city were more loyal to Pat Jessamy than her own neighbors further east, or, indeed, than anywhere else in the city. Furthermore, unlike many largely black areas, they didn’t even give Cheryl Lansey much support. But 30% fewer Forest Park-Arlington residents turned out this time around, and that spelled nearly 2,300 votes out of this area.  

So…in the final analysis, where did all this number crunching get me? I found three things that I think mattered and three things that I think didn’t.

1. Whites voted as a bloc for Bernstein in a way that they had not done for any other candidate in any of the several races I examined for this diary. I estimate Jessamy’s 2010 level of support among Whites to be somewhere around 15%, as compared with about 50% for Jessamy in 2006, about 35% for Mfume in 2006, and about 55% for Obama in the 2008 primary. I created a mathematical model whereby Shifting just 3% of the vote in the non-Type VI precincts back to Jessamy across the board (which still leaves her support among whites down near 20%, mind you) would have been enough to get her re-elected by 87 votes.

2. The deterioration of support for Jessamy among Blacks was also a contributing factor. She lost 16 points of support in Type VI precincts. I created a model whereby Jessamy’s support in Type VI precincts was raised while everything else (including the surprisng result, even knowing my source data had some noise in it, whereby Bernstein got more votes than Jessamy in Type V precincts) constant. Even when taking into account depressed black turnout (which I’ll discuss below) in a scenario when her support in the Type VI precincts is raised from 66% to 69%, still a 13-point drop, Jessamy gets re-elected by the narrowest of margins.

3. Turnout among Black voters was an issue. If the relative share of the total vote the 20 zones had held constant from 2006, even with the 2010 candidates keeping the same proportion of votes from each zone (in other words, this time I locked in Jessamy’s dismal performance in White areas and reduced performance in Black areas) the result would be reversed, with Jessamy winning over Bernstein 49-47. (I didn’t do the math on 2008, because it became obvious to me quickly that that electorate would have chosen Jessamy over Bernstein as well.)  

And three things I didn’t find to be important in the end:

1. The Lansey-as-spoiler factor. Certainly Jessamy supporters were angry with her, before and especially after the election. It’s hard to model with any confidence. Lansey’s vote total of 2011 was less than the 1456 vote margin between Bernstein and Jessamy. I know little about Cheryl Lansey and couldn’t figure out what her agenda was, other than not liking Jessamy, so that makes it tough to read voter minds. That most of her votes came from black neighborhoods suggests that Jessamy supporters had a reason to be unhappy. However, a Bernstein supporter could argue that her presence on the ballot as a third option gave people dissatisfied with Jessamy but reluctant to support a white challenger an easy way out of their dilemma and that at least some of those voters would have opted either for Bernstein or for a blank ballot. Even without Bernstein getting a single one of the the Lansey votes, Jessamy would have needed 72.5% of those votes to win. Since that figure was above her regular numbers in all but her very best precincts, I don’t think she was the difference in the election.  

2. There wasn’t enough of a difference between precincts with significant Hispanic or Asian minorities and those without them to support any effort to distinguish them from similar precincts that happen to lack significant Hispanic or Asian minorities.

3. I didn’t find any useful class-based distinctions in the data. In Black precincts, racial makeup (i.e. whether there’s much of a non-Black minority) explained the variances in election results much better than class makeup did, as usual for Baltimore elections of this type. Though there are often sizable gaps between results in White precincts in Baltimore that speak to real or perceived class differences, those were at best very muted with regards to this election, as these different neighborhoods acted in unison this time out.

Conclusion:

It took a near-perfect storm of high dissatisfaction among Whites, at least moderate dissatisfaction among Blacks, and low Black turnout to produce this surprising upset victory.  

Redistricting Maryland, Plan A

I’m finally publishing this; what follows is Answer Guy’s first attempt at redistricting Maryland.

The objectives:

Preserve the two majority-African-American districts, one based in Baltimore, the other in Prince George’s County, per Voting Rights Act requirements. Easy enough.

Give all seven current Democratic incumbents a similar or better chance to win re-election than the current districts allow, especially in the case of MD-01. That means preserving the existing base of each incumbent as much as possible.

Keep communities of interest together as much as possible, if not too inconsistent with the above.

Create districts that avoid the ungainly shapes that many of the current Maryland districts have.  

More below the fold…

Map Overview
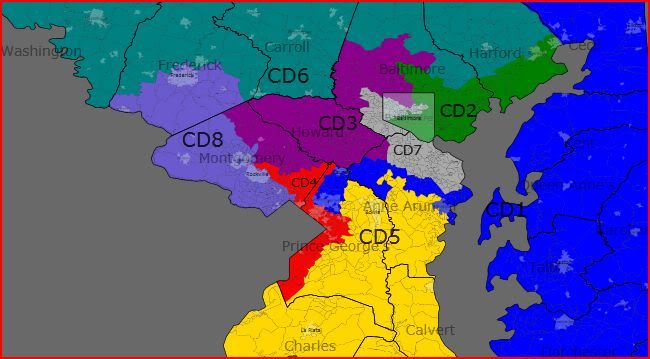
State Map

Note: Areas outside this map are in the districts you’d think they’d be in from the context.

First District
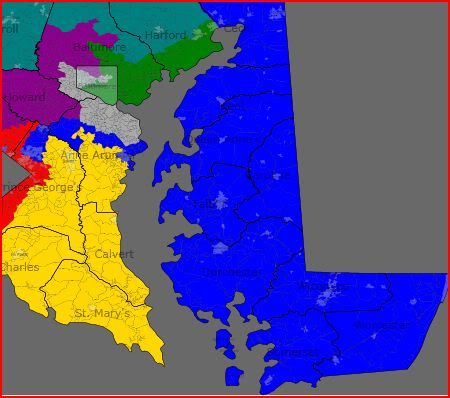
MD-01

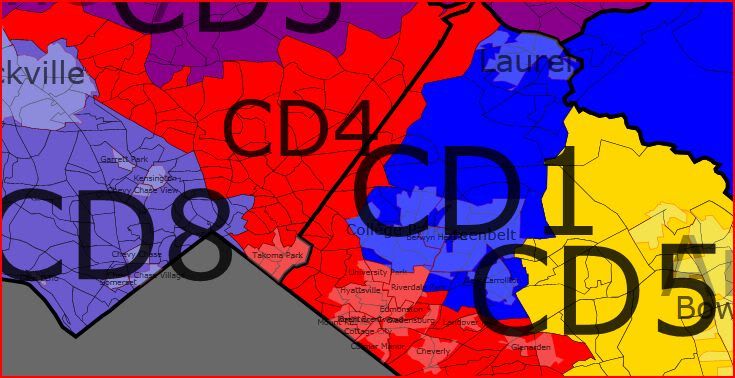
Description: All of the Eastern Shore counties – Worcester, Somerset, Wicomico, Dorchester, Talbot, Caroline, Queen Anne’s, Kent, Cecil; portions of Anne Arundel County (Annapolis, Fort Meade, portions of Odenton, East Laurel)  and northern portions (Laurel, Beltsville, College Park, Greenbelt, and New Carrollton) of Prince George’s County. Colored dark blue here.

Incumbent: Frank Kratovil (D-Stevensville)

(Note: Likely Republican MD-01 nominee Andrew Harris, who has at least a 50-50 chance of winning this November, doesn’t live anywhere near here, and the areas which supported him the most last time and will again this time aren’t either.)

Map Change: This new MD-01 still includes the entire Eastern Shore of Maryland. But while the current MD-01 includes two chunks of land (one in Baltimore and Harford Counties, the other in Anne Arundel County) very heavy on Republicans; this MD-01 replaces those areas almost entirely (there are a few precincts in Anne Arundel in common) with territory very heavy on Democrats.  The Republican areas west of the bridges – which supported McCain in even higher numbers than the Eastern Shore did – got carved up. The Anne Arundel County portion got split, with most of it going to MD-07, but some portions going to MD-05. The Harford and Baltimore County portion got divided three ways, mostly into the new MD-06 but with small portions being picked up by MD-02 and MD-03.

1st District Pop Pct Wh Bl Hisp Asn Oth Oba McC

Shore 437958 62% 79 16 3 1 1 43 55

Anne Arundel 132950 19% 57 29 4 8 2 62 37

Prince George’s 133292 19% 33 43 13 9 2 82 17

Total 704928 66 24 6 3 1 55 44

Old District 662062 86 11 2 1 1 40 58

Projected PVI: D+2

The Good News:

This is the most altered district, and by design, turning a strong Republican district into a Democratic-leaning swing district.

This district is in a sense designed for a guy like Kratovil, who would attempt to simultaneously appeal to swing voters on the Shore to support one of their own and to the Democrats in the rest of the district. The western portion of the current 1st gave John McCain 65% of their votes; the western portion of the new 1st gave Barack Obama 68% of their votes. The Anne Arundel portion is relatively thin, mostly avoiding Republican-heavy areas in the county to reach a highly diverse and heavily Democratic chunk of northern Prince George’s County. Due to VRA compliance requirements for MD-04, this MD-01 contains only a handful of black-majority precincts (in the Landover and New Carrollton areas.) The changes would still more than double the black population of MD-01, and the Hispanic and Asian shares of the electorate also increase dramatically with the inclusion of many diverse Washington suburbs like College Park, Beltsville, Greenbelt, Laurel, and Odenton.  . Obama’s 55% showing may overstate the Democratic leanings of this district a bit – though Kratovil was able to run 10 points ahead of the national ticket at the same time, and now most of the areas that backed Harris in that contest have been removed from the district.

It’s not guaranteed not to ever elect a Republican, but it would be very difficult for an arch-conservative of the Club For Growth variety to get elected here.

The Less-Than-Good News:

On the surface, the changes are pretty much all positive for Dems. However…the potential electoral dynamics change dramatically on several levels. Because I also placed a priority on not significantly endangering any of the current Democratic seats, this isn’t a strong enough Democratic electorate to get rid of a Republican who exhibits some measure of cross-party and independent appeal, particularly during a Republican-leaning election cycle. The Eastern Shore, who represent 62% of the new district’s population, still prefers Republicans more often than not, and so do parts of the Anne Arundel County portion of the district. As I said above, the 55% showing for Obama is probably not a new normal and the partisan lean would lose a few points if non-white turnout regresses to levels more commonly seen prior to 2008.  

It’s not hard to imagine competitive Democratic primaries that pit moderates against progressives that could produce candidates that either swing voters or base voters might find unappealing. The Democrats of the current MD-01 generally lean conservative, but Democratic candidates in this MD-01 would have contend with a much more varied electorate. Kratovil, especially if he were no longer an incumbent, would almost certainly face a primary challenge from his left of some sort if he were to run here, given his voting record.  

The Shore would dominate Republican primaries, due to the lack of registered Republicans in the rest of the new district, to a point the dynamics that produce a candidate like Andy Harris (someone with trouble appealing to Shore residents or to swing voters in general) would be unlikely to materialize. GOP candidates would mostly come from the Shore and might be able to use that to their advantage.  

Ironically enough, Wayne Gilchrest almost certainly still be in Congress if he had this map two years ago; there’s no way a wingnut primary challenge would have succeeded, and he’d be tough to dislodge in a general election even in a good year for Democrats across the board like 2008. In a Republican year, it’s not hard to imagine some types of Republican winning here, though a guy like Harris would have no shot, and not just because it doesn’t go anywhere near where he lives.    

Fundraising might become a higher priority, as the new district lines cut well into the very expensive Washington media market. To reach the whole district would involve using both Baltimore-based and DC-based media. The current district, by contrast, doesn’t really include much of anything that one might describe as a proper DC suburb.  

The Bottom Line:

In a 2012 election with Obama on the ballot, with these lines, though it’s not a slam dunk by any means, I like Team Blue’s chances, whether with Kratovil or with someone else.

Second District
MD-02

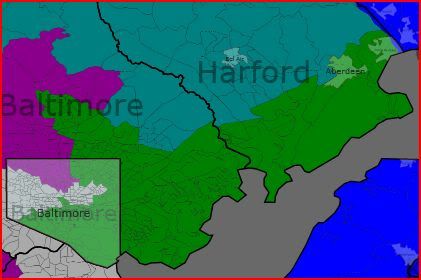
Description: Contains southern portions (Edgewood, Aberdeen, and Havre de Grace) of Harford County; eastern, northeastern, and north-central portions (Dundalk, Essex, Middle River, Parkville, Timonium, and Cockeysville) of Baltimore County;  and northeast, east, central, and southern portions of Baltimore City. Colored dark green here.  

Incumbent: C.A. Ruppersburger (D-Cockeysville)

(Note: Likely Republican MD-01 nominee Andrew Harris lives here, though most of his State Senate constituents don’t.)

Map Changes:

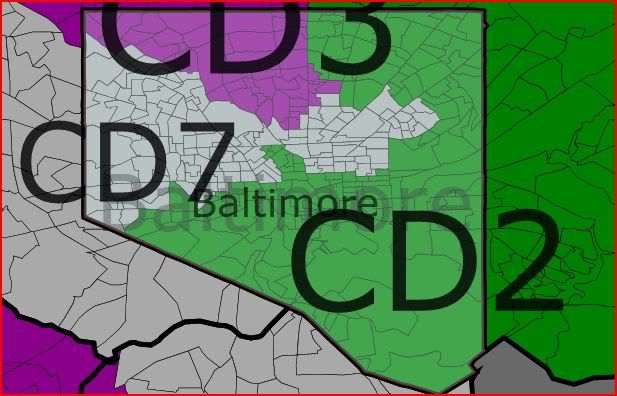
This new MD-02 has been made much more compact. It no longer contains any portion of Anne Arundel County and doesn’t go west of Cockeysville anymore, saying goodbye to the portions of Owings Mills and Reisterstown currently within its borders.  Containing much more of Baltimore City than previous versions of the district did, it’s now the district that includes most of the areas of Baltimore of interest to tourists – Federal Hill, the Inner Harbor/Downtown, Mount Vernon, Bolton Hill, Fells Point, Canton, Greektown, and Highlandtown. It also includes a bigger chunk of Northeast Baltimore than the current version does. The whole of southeastern Baltimore County is still here, and the Harford County portion is very similar (slightly smaller) to what is in the current district.

2nd District Pop Pct Wh Bl Hisp Asn Oth Oba McC

Baltimore City 277202 39% 45 47 4 2 1 82 17

Baltimore County 339213 48% 76 15 4 3 1 48 50

Harford 88267 13% 65 26 4 2 2 55 43

Total 704682 62 29 4 3 1 62 36

Old District 662060 66 27 2 2 1 60 38

Projected PVI: D+9

The Good News:

The addition of central Baltimore is the main reason that the new electorate moves two points to the Democrats, more than making up for the loss of some heavily Democratic northwest suburbs given to MD-03 and MD-07. This district does contain several city neighborhoods in outlying parts in northeast and far eastern Baltimore that are neither particularly liberal nor particularly Democratic, but also contains several mostly black precincts where the Republican share of the vote is in the low single digits.

The Baltimore County portion, about half the district, was carried by McCain, but many state and local Democrats, most notably incumbent Ruppersburger, have outperformed Obama significantly in these areas, particularly the East Side, in a development widely discussed in other SSP diaries about Maryland. And while Harford County as a whole may tilt Republican, the table above shows that the section of it included in MD-02 does not.

The Not-So-Good News:

This district may have been carried by Bob Ehrlich in his gubernatorial race in 2002 and looks more like the district he used to represent in the 1995-2003 period than the current MD-02 does; of the six districts designed to be relatively safe for Democrats, the Republicans have a deeper bench of officeholders at the state and local level than in any of the others.  There are signs that the east side of Baltimore County might be trending away from its traditional Democratic lean. Still, it is very hard to imagine even Ehrlich or a Republican who can duplicate his appeal winning in a district where nearly 40% of the constituents are Baltimore City residents.

As a secondary concern, this portion of Baltimore County is home to a lot of conserva-Dems who might be able to install a not-particularly-loyal Democrat into the seat in an open-seat situation if the city vote is either low or split.  

The Bottom Line:

Dutch Ruppersburger doesn’t really need the help, but this map gives him some anyway. You never know when a seat is going to become open. From a redrawing point of view, keeping this district out of northwest Baltimore County helped make it and MD-03 much more compact with more appealing shapes without affecting their respective partisan makeups much. It’s a set of communities that hang together pretty well. Should remain in the Democratic column.

Third District
MD-03

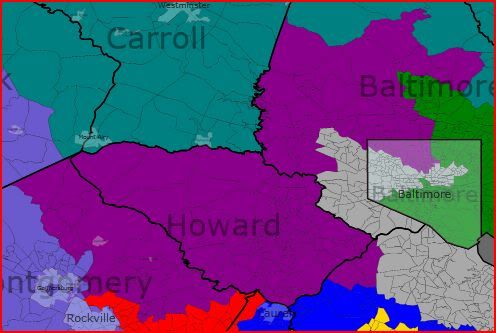
Descriptions: Contains northern and northwest portions of Baltimore City, northern and western portions (Towson, Pikesville, Owings Mills, Reisterstown, Randallstown) of Baltimore County, all of Howard County, northwestern portions (Jessup, Hanover) of Anne Arundel County, and northeastern portions (Damascus, Laytonsville, Olney, Burtonsville) of Montgomery County. Colored purple here.

Incumbent: John Sarbanes (D-Towson)

Map Changes:

These are dramatic changes as well, as the new MD-03 is mostly pushed out of Baltimore (and pushed out of downtown entirely) and Annapolis yet is still made more Democratic, mostly by adding new territory in the west via moving more into Washington suburbs.

The seemingly arbitrary pockets of East Baltimore are gone; what remains is more cohesive and more easily definable set of northern and northwestern city neighborhoods. Roughly from east to west, they are Waverly, Charles Village, Guilford, Homeland, Roland Park, Hampden, Mt. Washington, and upper portions of Park Heights; most are predominantly white (Park Heights and Waverly are mostly black while Charles Village is one of the most integrated parts of Baltimore) and relatively liberal.

The Baltimore County portion does contain some conservative exurban areas in northern Baltimore County (Sparks and Pheonix areas) but is concentrated mostly in more urban Towson and Pikesville. Some precincts to the west and northwest of Baltimore are instead in the black-majority MD-07, but this portion of MD-03 does contain some majority-black precincts. The Arbutus/Halethorpe/Landsdowne area in southern Baltimore County has been removed.

Howard County, previously split with MD-07, is now included in its entirety.

A small portion of Anne Arundel County does remain, but it now goes nowhere near Annapolis, instead staying close to the B-W Parkway.

The addition that sticks out most is the new territory in Montgomery County, about 130K residents, mostly outer suburbanites. There are a few precincts that carry Silver Spring, Rockville or Gaithersburg addresses, but this MD-03 contains none of either of the cities of Rockville or Gaithersburg, and nothing particularly close to the core of Silver Spring, as everything here is well outside the Beltway.

Things had to change for several reasons. One is that the population distribution in the state is shifting away from Greater Baltimore in general and Baltimore City in particular and some district based in or around Baltimore was inevitably going to end up with more Washington suburbanites. Another is that to fix the hideous shapes of some of the current districts required cutting off some of the more ungainly-looking appendages.  The current MD-03 is a group of pockets joined together by a series of thin strands and cleaning that up required shedding some of the pockets and filling out others; the threads running to the east were incompatible with the rest of the plan for the state, so the only direction to go was to the west.  

3rd District Pop Pct Wh Bl Hisp Asn Oth Oba McC

Baltimore City 92372 13% 61 29 3 5 1 81 17

Baltimore County 193424 27% 66 24 3 5 1 59 39

Howard/Arundel (Balt. Area) 167389 24% 63 18 5 12 2 59 39

Howard West (DC Area) 120254 17% 64 17 5 11 2 63 35

Montgomery 131144 19% 64 15 9 10 2 62 37

Total 704583 64 20 5 9 2 63 36

Old District 662062 77 16 3 3 1 59 39

Projected PVI: D+10

The Not-So-Good News:

It’s often awkward when redistricting changes a constituency this much, even if in the abstract the changes are favorable to an incumbent seeking re-election, as they are here. At some level, this would be like an open-seat race as far as about half the electorate is concerned. It might even be more awkward than usual in this case. The table lists the different components of the district; I divided Howard County into areas likely have some connection to Baltimore (roughly anything north of Route 32 and east of Route 29) and those areas unlikely to know much about Baltimore and its politics. Throw the latter in with MoCo and that’s about 36% of the district that has no Baltimore connection. Reaching them would require investing in an expensive new media market. (Though there are already probably some residents of the current MD-03 who are better reached via Washington media than Baltimore media because Washington casts a much bigger shadow.) Incumbent John Sarbanes lives in Towson in Baltimore County and his family is based in Baltimore; though his name is well-known in the western portions of the new MD-03, he himself is not.

The Good News:

From Democrats’ point of view, simply put, what could have become a potential swing district in a year with low Baltimore City turnout is made four points more Democratic. These new constituents aren’t likely to vote Republican, especially compared with what else could have been placed in this district. The Republican bench here is almost entirely confined to two areas, one in western Howard County, the other in northern Baltimore County, that have little in common with the rest of the district. The main bases of the district since the ’90s have been north Baltimore, Towson, Pikesville, and Columbia, and they’re all still here.

From Baltimore’s point of view, this is a district that even in an open-seat Democratic primary or general election is still more likely to choose a Baltimore-area representative than one from closer to DC; not only do most residents of the district live closer to Baltimore, but the DC-focused areas contain large numbers of new, less-established residents with no ties to existing political cliques. (Obviously, this isn’t good news for Montgomery County’s clout, but they’d they have no less than now.)

From Sarbanes’ own point of view, these new areas, in addition to not being of much help to future Republican opponents, aren’t especially likely to form the base for any successful region-based (notenough of them) or ideology-based (not different enough from the rest of the district to matter) primary challenges. And any Baltimore-area politician, looking at a future statewide run is going to need to be known in MoCo.

Bottom Line:

This district should be safe for John Sarbanes and is unlikely to be in danger of flipping to the Republicans should he decide to move on.

Fourth District
MD-04

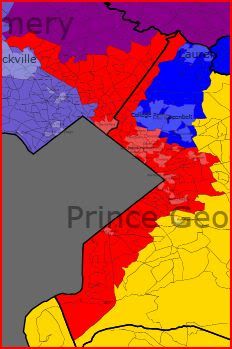
Description: Portions of Prince George’s County (Ft. Washington, Oxon Hill, District Heights, Capitol Heights, Glenarden, Cheverly, Hyattsville, Langley Park) close to Washington, DC, and eastern and central portions (Takoma Park, East Silver Spring, Wheaton, White Oak, Burtonsville) of Montgomery County. Colored red here.

Incumbent: Donna Edwards (D-Fort Washington)

Map Change: This MD-04 sheds some Upper Montgomery territory to the expansion of MD-03, and cedes some of central and southern Prince George’s to MD-05. It picks up more of close-in eastern Montgomery County from MD-08 for the sake of compactness.

4th District Pop Pct Wh Bl Hisp Asn Oth Oba McC

Prince George’s 435116 62% 8 70 18 3 1 93 6

Montgomery 268281 38% 38 25 21 14 2 77 21

Total 703397 20 53 19 7 2 87 12

Old District 662062 27 57 8 6 0 85 14

Projected PVI: D+32

The Good News: This version of MD-04 is even more strongly Democratic (despite reducing the African-American share of the residents from 57% to 53%) which ranks it among the most Democratic and most liberal districts in the nation.  I did not set out to strengthen the Democratic lean here, it’s a natural consequence of removing less Democratic far-flung areas like Clarksburg and making things more compact and leaving room for the MD-03 shift chronicled above. It’s interesting from a political-demography perspective; it’s not every day you can change a district’s borders to include fewer African-Americans and yet increase the Democratic share of the vote. From Edwards; perspective, the increase in the Democratic vote in Montgomery also has the effect of making a Prince George’s County-based primary challenge tougher.

The Not-So-Good News: There are no Republican-leaning areas anywhere near here to neutralize, unless one wants push these borders way south to break up Southern Maryland or way north to get some less Democratic parts of Montgomery or Howard Counties, and I had good reasons not to do either.

Fifth District
MD-05

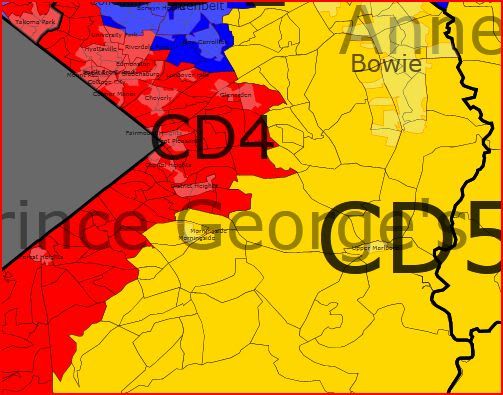
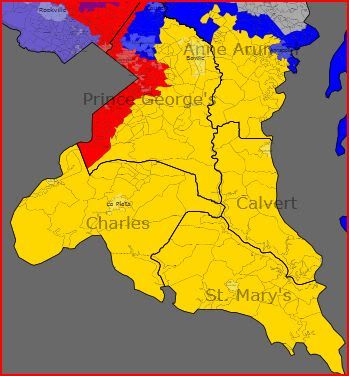
Description: Southern and central portions (Crofton, Millersville, Davidsonville, Edgewater, Deale) of Anne Arundel County; central, western and southern portions (Bowie, Seabrook, Largo, Mitchellville, Forestville, Upper Marlboro, Brandywine, Acokeek) of Prince George’s County; all of Charles County; all of Calvert County; all of St. Mary’s County. Colored yellow here.

Incumbent: Steny Hoyer (D-Mechanicsville)

Projected PVI: D+12

Map Change: Less than many districts. The new MD-05 is changed mostly to help MD-01, shedding areas in northern Prince George’s County (such as Laurel, Greenbelt, and College Park) and western and central Anne Arundel County.  It doesn’t weaken as a strong Democratic district due its new areas in central Prince George’s County left behind by MD-04, a change reflected in the demographics numbers as the proportion of African-Americans increases from 30% to 36%.

5th District

Anne Arundel 120226 17% 84 9 3 2 1 45 54

Prince George’s 252444 36% 25 65 5 3 2 87 12

Charles 140764 20% 52 39 4 2 2 64 35

St. Mary’s/Calvert 190276 27% 79 15 3 2 2 45 54

Total 703710 55 36 4 3 2 66 33

Old District 662060 60 30 4 4 0 65 33

The Good News:

A reasonably safe Democratic district (at least by 2008 metrics) moves one more point in that direction. Southern Maryland is kept together as a unit. From a pro-diversity point of view, an African-American would have a decent shot in an open seat Democratic primary here, more so than the currently existing MD-05. Though there is a reasonable Republican farm team in this district, it would be very hard to overcome the Democratic bloc vote in Prince George’s, especially as Charles County heads in a similar direction.

The Not-So-Good News:

Hoyer and the Democrats, though they still doesn’t have much reason to worry, are now slightly more dependent on the African-American vote in MD-05, meaning that a lower turnout model would move this district closer to the new MD-02 or MD-03 in partisan breakdown rather than a truly safe-in-all-circumstances seat.  This would be one of the best places in the nation for a black Republican to launch a political career.  

Our Majority Leader should be fine here, and whenever the day comes, his Democratic successor here should be as well.

Sixth District

MD-06

Description: All of Garrett, Allegany, and Washington Counties; western, northern, and eastern portions (Middletown, Thurmont, Walkersville) of Frederick County; all of Carroll County; far northern (Upperco, Parkton) and northeastern (Perry Hall, Baldwin) portions of Baltimore County; central and northern portions (Joppa, Bel Air, Jarrettsville, Pylesville) of Harford County. Colored teal blue here.

The Incumbent: Roscoe Bartlett (R-Frederick)

(Note: Republican MD-01 nominee Andrew Harris doesn’t live here, but most of his current State Senate district is in here, and so are the areas of MD-01 who supported him the most last time and will again this time.)

Map Changes:

It’s pretty obvious what happens here. The small portion of Montgomery County (mostly Damascus) is handed off to MD-03. The City of Frederick and its immediate environs, plus the area around Brunswick, are given to MD-08. The Reistertown area is now in MD-03. In exchange, the new MD-06 picks up a bunch of areas from the former MD-01, in northeastern Baltimore County and central Harford County. In partisan terms, most of the few areas left in MD-06 that were favorable, or even neutral, to Democrats are gone; all but one of the precincts in this district carried by Obama are in Hagerstown, the sole exception being a precinct in Cumberland that Obama carried by five votes.  

6th District Pop Pct Wh Bl Hisp Asn Oth Oba McC

Western Maryland 320515 89 6 2 1 1 38 60

Baltimore Exurban 383311 91 4 2 2 1 33 65

Total 703826 90 5 2 2 1 35 63

Old District 662060 92 5 1 1 0 40 58

Projected PVI: R+18

The Good News:

There are seven Democrats in an eight-member delegation. None of them have to run in this district or any portion of it. (It was not a goal of mine to make Bartlett move.)

On the upside, there could be some entertainment value the next time this seat opens up (Bartlett is no spring chicken) as the various GOP aspirants each try to out-wingnut each other. The only other real subject of potential interest is seeing if a Western Marylander can gain traction in a district where denizens of Baltimore exurbs are more numerous.

The Not-So-Good News:

There are still enough Republicans, and areas full of them, in Maryland to command one district. Here it is.  

More seriously, one consequence of generating a district like this is that Democrats, independents, and liberal-to-moderate voters in general have very little say in who gets elected to represent this district. While that’s good for the Democrats, both nationwide and in Maryland, in some sense – anyone who can survive a GOP primary in this electorate has slim chances of developing the sort of cross-party appeal a Republican would need to win statewide, and we’re talking about a state GOP that’s already skilled at cutting off its nose to spite its own face here – it’s bad from a good-government perspective. Competitive races are good for many governmental functions, and I know that exercises like this one that go on in state capitals coast-to-coast tend to make such contests less likely.

But there’s no way I’m going to unilaterally disarm.  

Bottom Line: Safe Republican; not much else to say.

Seventh District
MD-07

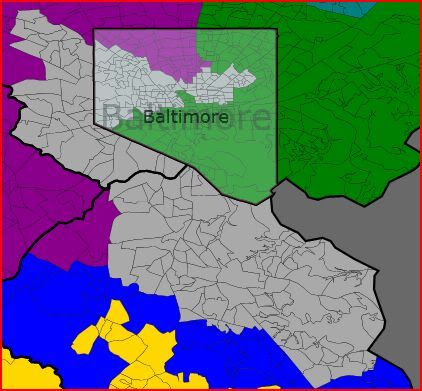
Description: Portions of east-central and western Baltimore City; western and southwestern portions (Lochearn, Woodlawn, Catonsville, Arbutus, Halethorpe) of Baltimore County; north-central and northeastern (Brooklyn Park, Linthicum, Severn, Glen Burnie, Pasadena, Arnold, Severna Park) portions of Anne Arundel County. Colored medium gray here.

Incumbent: Elijah Cummings (D-Baltimore)

Map Changes:

There’s a little less of Baltimore here now, MD-02 in particular grabbing a larger share; what remains is two clusters of heavily black neighborhoods (the East Baltimore is section centered just north of Johns Hopkins Hospital; the larger West Baltimore section expands westward from Druid Hill Park, and follows Reisterstown Road, Liberty Heights Avenue, Route 40, and Frederick Avenue outwards) joined by a narrow neck around where North Avenue meets Interstate 83. 95% of its votes went to Obama. Though there are some pockets of stable middle-class neighborhoods to be found here, the majority of these neighborhoods are beset by longstanding issues of poverty, crime, and urban blight.

The Baltimore County portion includes most of the majority-black suburbs to the west of Baltimore proper. The new version contracts slightly in the Interstate 70 area but expands towards Randallstown out Liberty Road. It now includes all of Catonsville and inherits the southwest corner of Baltimore County from MD-03. All in all, the Baltimore County portion of MD-07 is about evenly split between blacks and whites.

The Anne Arundel portion is inherited from MD-01, MD-02, and MD-03, and is designed to sop out Republican areas formerly assigned to those districts. Collectively, it gave 55% of its votes to John McCain.

7th District Pop Pct Wh Bl Hisp Asn Oth Oba McC

Baltimore City 267345 38% 6 91 1 1 1 95 5

Baltimore County 191107 27% 42 49 3 4 2 73 25

Anne Arundel 246238 35% 82 10 3 3 2 43 55

Total 704690 42 51 2 3 1 69 30

Old 662060 35 59 2 4 1 79 20

Projected PVI: D+15

The Good News:

Fewer wasted Democratic votes. Of the seven Democrats in the delegation, only Donna Edwards in MD-04 needed less help. It’s still VRA compliant.

As I explain below, Cummings isn’t going to be pleased. However, if he harbors statewide ambitions, introducing himself to Democrats in northern Anne Arundel County might help him emerge from what could be a crowded primary field.  

The Not-So-Good News:

Democrats are 10 points weaker here now, for three reasons – the new MD-07 has a smaller share of Baltimore City (mostly shedding racially mixed or mostly white areas with liberals more needed elsewhere), a lower percentage of African-Americans (from 59% to 51%), and a shift in suburban population from [relatively] Democrat-family portions of Howard County to more Republican-leaning portions of Anne Arundel County. There’s a bit of a polarized electorate here; you can draw a line through Baltimore County on Route 40 and then follow the southern border of Baltimore City and you’ll discover mostly black Democratic voters on the north side of the line and mostly white Republican voters on the south side. What keeps the district out of the swing category despite this is that the few exceptions to the rule – Brooklyn Park and Severn have sizable African-American populations, and Democrats do fairly well in Catonsville –  are all on the southern side of the divide.

Incumbent Eli Cummings will likely not be a happy camper, though he probably doesn’t have much to worry about. He’d have to introduce himself to a whole new set (about 40% of this district is brand new) of constituents, many of whom are strongly inclined to support his Republican opponents.  It’ll be easier to recruit Republican challengers from Anne Arundel than from any area he now represents. If an African-American could somehow emerge from a Republican congressional primary, he’d have a better chance here than in most places.

But this district still gave Obama 69% of its votes; even if that’s a vote ceiling, any GOP candidate would need to run double-digits ahead of the national ticket to even have a shot, and rare is the candidate that can accomplish such a feat, even in an open seat situation.  

Bottom Line:

This seat’s been weakened (by necessity) quite a bit but still isn’t going to show up on any GOP potential pickup lists anytime soon, with or without Cummings.

Eighth District
MD-08

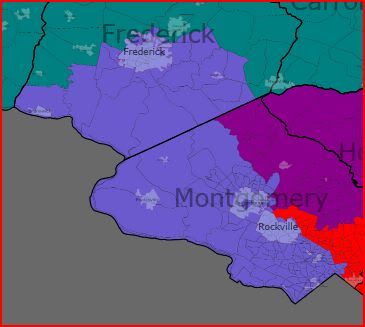
Description: Southern, central, and western portions (Silver Spring, Kensington, Chevy Chase, Bethesda, Potomac, Rockville, Gaithersburg, Germantown, Clarksburg, Poolesville) of Montgomery County; southern and central portions (Frederick City, Urbana, Brunswick) of Frederick County. Colored lavender here.

Incumbent: Chris Van Hollen (D-Kensington)

Map Changes:

MD-08 moves out of Prince George’s County and cedes a large chunk of eastern Montgomery County (Takoma Park, parts of Sliver Spring, Wheaton, White Oak) to MD-04. In exchange MD-08 moves up into Frederick County, taking the City of Frederick and its environs from MD-06. The result is a less Democratic but still safe district.

8th District

Montgomery 551255 78% 59 11 13 14 2 71 27

Frederick 152526 22% 74 12 8 5 2 53 45

Total 703781 63 12 12 12 2 68 30

Old District 662060 63 17 14 11 6 74 25

Projected PVI: D+15

The Good News:

Fewer wasted Democratic votes. As a district with Republican-leaning border areas not subject to any VRA compliance mandates, it’s a pretty obvious candidate for dilution to everyone. And even the more conservative Frederick County portion of the district was carried by Barack Obama in 2008.

The Not-So-Good News:

The Democratic bottom line shifts downward six points, which is about what one would expect when shifting 25% of a district from one of the most heavily Democratic-voting areas in the country to a 50-50 area. The Frederick area, though it’s becoming friendlier to Democrats with every cycle, has long been a source of Republican candidates for every conceivable office.

Not that I think it matters much now, but this new version of MD-08 looks a lot more like it did when Republican Connie Morella held it down in the 1990s. Had this been the playing field over the last decade worth of House elections, I imagine that there’s at least a chance she’d still be on Capitol Hill now as an increasingly lonely voice for the old Eastern-style Republican in the GOP caucus. Morella is almost certainly too old to make a comeback now, and her party has spent the intervening decade making itself extremely unappealing to voters in districts like this one anyway.  

The Bottom Line:

Van Hollen or whatever Democrat succeeds him shouldn’t have a problem getting re-elected in this district.

Extra Maps:

Baltimore
Baltimore

North of DC

DC North

East of DC

DC East

We’ve Got Crabs! (or, Redistricting Maryland)

(From the diaries – promoted by DavidNYC)

None of you asked for Maryland, but I wanted to redraw a state in which I couldn’t use townships and incorporated municipalities as a crutch. Four of Maryland’s five largest communities are unincorporated – Columbia, Silver Spring, Ellicott City and Germantown.

Plus, having lived in Maryland for quite awhile, I wanted to do a state that I actually had a local feel for. Lastly, Democrats control both the General Assembly and the Governorship, so no quips about this map being “unrealistic”!

I apologize for the title ahead of time – I’ve seen tourist gear with that slogan one too many times flying out of BWI….

My goals:

  • Strengthen Kratovil (1st)

  • Pack Republicans into Bartlett (6th)

  • Keep all other Democrats at their previous levels or 65%, whichever is lower.

(When you have this many Democrats to protect….)

Anyways, here’s the map (click for full-size version):

Update: I realized I mis-merged some shapes in my GIS and this lead to a misrepresentation of the 1st and 5th in Anne Arundel County. Fixed.

So normally, there’d be a nice map of the state broken up by municipalities and colored in based on McCain/Obama performance. In Maryland, this was harder: I consolidated precincts to match up with Census 2000’s voting tabulation districts (VTDs). Sometimes, in cases where precincts changed significantly, I consolidated some VTDs, too. I’ve creatively named these consolidated VTDs “CVTDs”.

Also, tabulating data by CVTD is a pain in the ass. Seriously. So I only created CVTDs for counties that had a chance of being split. So here’s the map, colored by CVTD for some counties (I wasn’t going to split Calvert, St. Mary’s, the Eastern Shore, or the Panhandle).

District-by-district, here goes (numbers are: Population, Voters, %African American, Obama%, McCain%):


1 662,203 357,190 26.89% 56.48% 42.11%
Anne Arundel 117,748 65,392 20.21% 56.33% 41.93%
Caroline 29,772 13,218 14.77% 37.61% 60.64%
Cecil 85,951 42,494 3.91% 41.57% 56.14%
Dorchester 30,674 15,274 28.39% 45.25% 53.48%
Kent 19,197 10,020 17.41% 49.43% 48.95%
Prince George’s 148,552 87,295 59.27% 88.42% 10.86%
Queen Anne’s 40,563 24,045 8.78% 35.66% 62.74%
Somerset 24,747 9,924 41.10% 48.16% 50.76%
Talbot 33,812 20,328 15.36% 44.45% 54.09%
Wicomico 84,644 41,854 23.29% 46.44% 52.20%
Worcester 46,543 27,346 16.66% 41.59% 57.07%

This is the district we were all wondering about, Frank Kratovil’s 1st. Before, the 1st took in all of the Eastern Shore, a chunk each of Anne Arundel, Harford, and Baltimore counties. Those parts were absolutely brutal, so I removed the the BaltCo (35% Obama)/Harford (33% Obama) parts completely. Additionally, instead of taking in the Republican pats along the North Shore, the district runs through the city of Annapolis proper and into PG County. Yes, the district reaches across the bay, but the old district did this too. Plus now, I can use the Bay Bridge as an excuse, as both ascents to the bridge are in this district now. Obama lost the AA part of the district 39-59, but he won the reconfigured part of Anne Arundel 56-42. We weren’t going to more artfully draw Baltimore, so for Democratic strength, the new 1st looks to Prince George’s County – Obama’s 88-11 performance there anchors this district. Overall, Obama scored 56% here – up a whopping 16%.


2 662,315 309,805 25.58% 60.34% 37.71%
Baltimore 419,630 204,167 21.76% 57.30% 40.74%
Baltimore City 143,321 56,010 42.46% 79.02% 19.26%
Harford 99,364 49,628 17.36% 51.75% 46.08%

Dutch Ruppersberger’s district doesn’t change much – still the southern half of Harford, an arm across Northern BaltCo, and a section of the city. However, there’s no awkward arm across the Patapsco into Anne Arundel this time. The Harford section is a tad less Democratic, the BaltCo section a bit more, and Baltimore City a bit less. However, the removal of Anne Arundel bumps this district to 60%, up about 0.5%.


3 662,016 356,350 18.53% 60.69% 37.37%
Anne Arundel 108,683 57,529 17.90% 50.80% 47.30%
Baltimore 239,472 126,645 22.89% 61.92% 35.97%
Baltimore City 74,391 32,258 17.57% 72.34% 25.89%
Howard 239,470 139,918 14.76% 60.95% 37.20%

Surprisingly, I think this incarnation of the 3rd is less gerrymandered than before – there’s no one-block wide sliver connecting to distinct sections. The major change from before is the placement of almost all of Howard County into this district, which had been located mostly in the 7th. Instead of making a westward facing loop through Baltimore as before to hit Towson, this district makes an eastward facing U. Obama got 61%, up 2% from before.


4 661,820 293,331 51.60% 82.43% 16.65%
Montgomery 309,396 153,066 22.75% 71.41% 27.28%
Prince George’s 352,424 140,265 76.92% 94.46% 5.06%

Donna Edwards’ district also isn’t changed much. A large section of upcounty MontCo and Prince George’s along the DC line. With the 8th shifted northward, the 4th is a bit more Montgomery-heavy, but stays majority African-American. This shift drops Obama’s performance by about 3%, but this is still the most Democratic district in Maryland at 82%.


5 661,222 352,347 30.44% 64.23% 34.51%
Anne Arundel 79,363 47,288 5.90% 43.67% 54.55%
Calvert 74,563 44,057 13.11% 46.07% 52.42%
Charles 120,546 70,127 26.06% 62.22% 36.69%
Prince George’s 300,539 146,466 47.72% 83.78% 15.20%
St. Mary’s 86,211 44,409 13.92% 42.84% 55.63%

Steny Hoyer’s district, again, experiences some minor shifts. It still contains all of the Southern Maryland trifecta of Charles, Calvert, and St. Mary’s. I had thought about cracking Charles to tap its population growth and Democratic trend, but ultimately decided against it. A large chunk of PG is taken by the 1st, so this district expands farther into Anne Arundel. At 64%, this is about a 1% drop.


6 663,091 354,947 3.61% 35.44% 62.22%
Allegany 74,930 29,742 5.35% 35.95% 61.88%
Baltimore 50,784 32,008 1.36% 32.03% 65.08%
Carroll 150,897 84,760 2.28% 33.11% 64.30%
Frederick 97,113 54,983 2.06% 40.21% 57.86%
Garrett 29,846 12,872 0.43% 29.02% 69.17%
Harford 119,226 73,667 2.53% 31.04% 66.35%
Howard 8,372 5,315 4.60% 34.51% 63.03%
Washington 131,923 61,600 7.77% 42.61% 55.47%

We took some Republicans out of the 1st, 2nd, and 3rd districts, and this is where they go. I cut out Democratic-trending and sububanizing southern Frederick County and just packed as many deep-red VTDs in here as possible from Harford and northern Baltimore County. The Panhandle and Carroll County remain in their entirety. This drops Dem performance to 35%, down 5%.


7 661,710 265,229 55.65% 72.99% 25.62%
Anne Arundel 183,862 89,411 10.02% 42.84% 55.09%
Baltimore 44,406 18,118 10.72% 46.90% 50.51%
Baltimore City 433,442 157,700 79.60% 93.08% 6.05%

Before, this district took in a large chunk of Howard County, before reaching into Western BaltCo and West Baltimore. We took the extremely Republican parts of Anne Arundel County out of the 1st, and this was the safest place to deposit them. The anchor of the district stays Baltimore City, which also maintains the 56% African-American composition of the district. At 73% Obama, this is a drop-off of 6%, but again, no cause for concern.


8 662,109 342,398 10.92% 69.23% 29.27%
Frederick 98,164 56,203 10.62% 56.77% 41.56%
Montgomery 563,945 286,195 10.97% 71.68% 26.85%

It was tempting to make this district solely Montgomery County, but that’d well, be too clean. (It’d also abandon some strong Democratic votes in Frederick City.) Thus, this takes a bite out of Southern Frederick along 270, and then takes in the western half of Montgomery County and ventures east into Silver Spring. Frederick is nowhere as Democratic as downcounty Montgomery County, resulting in a 5% drop in Obama’s performance to 69%. Even if Frederick’s shift was a one-time thing for Obama, the vast majority of the district is still in Montgomery County.

So I’m pretty sure my map of Maryland is not only better – resulting an improvement for the three most marginal Democratic districts and negligible drops in the other 4 Democratic districts – but less gerrymandered, I dare say. Questions, comments, witty descriptors for what the districts look like, and suggestions always welcome.