Breaking NY-1 Count over Bishop leads by 235

Bishop spox, Jon Schneider says counting over, Bishop leads by 235 in #ny01 “We are very confident that Tim Bishop has won this election,” says Schneider.

There is still the matter of nearly 2000 challenged ballots, but the last count had Altschuler challenging close to 350 more than Bishop, so Bishop figures to expand his lead as those are disposed.

It will be interesting to see if Altschuler demands a full hand recount. On election night when it appeared that Bishop was well ahead, Altschuler wanted one, but his position changed quickly after a recanvass put him ahead, so now, I guess it’s likely to change again.

And on the matter of a hand recount a just completed hand recount audit of 3% of election districts found no errors at all; making it more difficult for a full hand recount being granted.

On the Ground in Tx 27

In this diary I will attempt to explain the troubles that Democrats have had in the Northern Section of Tx-27.  

Background of the District

Congressional District 27 is quite an odd district in the state of Texas.  The district is divided into two population centers at the northern most and southern most tips of the district with the King Ranch and Kenedy Ranch in between.   Some of you may have noticed that this was the only district not widely affected by the Delaymander a few years ago.  It would have been simple to draw CD 27 into a Republican district by adding Aransas County in the North and subtracting some of Brownsville out.  Why was the not done?  Tom DeLay was raised in Corpus Christi and one of his family friends growing up was Solomon Ortiz.  Ortiz was there for DeLay on a host of issues in the house anyway so why target him?  Also DeLay’s brother (a lobbyist) nearly worked out of the Ortiz’s office for the Port of Brownsville and other interests in the district.  Politically, the district has trended strongly Republican in the Northern two counties and trended Democrat in the Southern three.  This doesn’t balance out because the Corpus Christi area is where the largest population is in the district by far.

Problems in the Local Democratic Party

Dems in the Northern Part of the district have faced a situation where there has been a lack of direction from the state and local party for 6 years.  Nueces had 2 Democrats (Abel Herrero and Solly Ortiz) in the State Legislature and 1 Republican (Gene Seaman).  4 years ago, Attorney Mikel Watts decided to change the pace in Nueces and recruited Juan Garcia to run against State Rep Gene Seaman.  He won that race by raising hundreds of thousands of dollars from local attorneys including Watts.  In the past, the Ortiz machine had to approve of the candidates that ran for any position (even as far down the ballot as Justice of the Peace)!  Garcia didn’t get recruited by Ortiz.  In fact, he fought against the machine.  This led to a considerable feud in the party where the local Anglos and Progressives sided with Garcia and the rest of the party sided with Ortiz.  What ended up happening was that the Ortiz Machine withdrew all support from Garcia in Nueces and San Patricio Counties.  In 2008, without support from Ortiz anymore, Garcia lost and moved to DC to work for his college friend Barack Obama.  Garcia’s departure from office coincided with a decline in the local party.  Faction warfare ensued.  No fundraising took place in that time so the local party left all campaigning up to the local candidates.  This situation would be remedied by quality candidates.  They were nowhere to be found.  Our congressman hardly ever came to the Coastal Bend (Northern Part of the district) much less campaigned or raised money for anyone but himself or his son Solly Ortiz.  We lost the Sheriff position and the County Judge position as a result.  Finally, we lost control of the Commissioners Court for the first time in 2008.  The Ortiz machine finally realized they were in trouble.  The recruited a Candidate to run for Commissioners Court and for JP but both were defeated in the primary by extremely conservative Democrats.  The local party chair from 2008-2010 didn’t do anything but provide support to her favorite few Democrats and some Republicans (she is now a member of the Texas Republican woman).

Perceived Rebound in the Local Party


In 2010, the Progressives in Nueces County recruited the party chair of another county to run for party chair.  She won that race by a very thin margin.  When she was sworn in in May of 2010, there was $0 in the party bank account.  Even worse was the fact that the Texas Democratic Party State Convention was going to be in Nueces County in July.  Immediately planning for that took place and no rebuilding was accomplished.  Eventually in August, the party was able to raise around $50000 to run a campaign for the first time in years.  With support from activists, the Texas Voter Targeting Software, the Bill White Campaign, and new volunteers every voter in the traditional base precincts was contacted by phone between 2 and 6 times and every door in those precincts was knocked on between 2 and 3 times in the span of one month.  Remember, this was the party doing this and not the candidates.  They also block walked and phone banked, but there is no way to know how much they did.  It looked like things were on the upswing.  


Success in the local Republican Party

In 2006, the Republican Party recruited former Anglo democrats to run for county judge and Sherriff.  They won both by large margins.  In 2008 they recruited former Democratic State Rep Todd Hunter to run against Juan Garica with the promise that if he won he would have the first shot at the newly drawn congressional district.  He was appointed to the Redistricting committee in the State House of Reps.  In 2010, their candidates across the board were almost all former Democrats.  In fact, one of their candidates for judge was a member of Texas Democratic Women and had the audacity to send in her membership dues after announcing her intent to run as a Republican with a note attached saying “Nothing Has Changed.”  As far as fundraising goes, their nominees were flush with cash to say the least.  Farenthold self-funded.  The nominee against State Abel Herrero (a family values conservative who has been married 5 times and was in a scandal for wrecking her Lamborghini on the highway) raised over $750,000 (with 95% of that coming from outside the district).  The nominee against Solly Ortiz raised $200,000 with most of that coming from and insurance PAC.  All told around $1.75 million (with over 90% of that total coming from outside the county) was spent by the Republicans in the district which is an absurd amount for the size of the media market.  With a Congressional nominee who is the Grandson of Progressive Hero Sissy Farenthold, a few Hispanics on the ticket, a lot of former Democrats running on their side, and unlimited financing it was inevitable that they would do well.

What Happened on Election Night

Democrats lost every single race except for District Attorney where we had an Anglo nominee against a Hispanic Republican (where racism and a lot of other factors played into our victory.  Our DA nominee racked 55% of the vote while every other Democrat won around 41%.  Both State Reps lost and every Republican was reelected.  Solomon Ortiz won every county in the district by large margins except Nueces and San Pat where he lost by a 11% margin which was enough to win.

Democrats didn’t turn out our base precincts of Nueces County and Republicans did.  In the strongest Republican Precinct, over 70% turned out and voted around 62% Republican while in the strongest Democratic Precinct only 20% turned out and voted around 96% Democrat.  That speaks in and of itself as to why the local party faces problems down the road.

Looking Forward

Blake will for sure run for Reelection. He will most likely be primaried by State Rep Todd Hunter who will have all of the establishment behind him.  The district will be different in two years and I believe will likely become more Republican.  Democrats don’t have many options here as far as candidates go… but here is a snapshot of some of them that may run.

Fmr State Rep Abel Herrero– Has confirmed he will run for either his old seat, the state senate, or congress next cycle. Abel was rated as the second most progressive member of the Texas House of Reps.

Fmr State Rep Solly Ortiz, Jr– Solly would be running on name recognition.  He is a conservative Democrat who won the NRA and Chamber of Commerce Endorsements Last Cycle and still lost in an extremely blue district.

Asst Secretary of Navy Juan Garcia– Garcia is an appealing candidate who has proven he can win in a very tough district.  He would have the President fully behind him and that means fundraising and perhaps appearances?  

Nueces DA Mark Skurka– The only Democrat who won on election night has massive crossover appeal to Republicans (he won 45% of them who didn’t vote straight ticket).  If Skurka runs and wins the primary (a difficult task because he is not hispanic), he would likely win.  Skurka is up for reelection as DA and most likely won’t run unfortunately.  

State Rep Rene Oliveira– Democrat from Brownsville.  Mainstreme Democrat in the State House with nothing really distinguishing him from amongst the masses.  Likely couldn’t win in a primary as he isn’t from Nueces County


State Rep Todd Hunter
– Hunter is power hungry and has switched parties one time to reclaim it, why not twice?  Hunter was rated as the most liberal Republican in the Texas House so he is a teabag target anyway.

Eddie Lucios– I group them together bc only one would conceivably run.  Both have their ages working against them.  Junior is too old, IIIrd is too young.  Also, they don’t live in the district as it is currently drawn.

By what margin will Bob Shamansky win?

View Results

Loading ... Loading ...

2010 Recap Part II: Michigan State House

(Cross-posted at WMR, ML, and BFM-pb)

Perhaps the biggest surprise on late hours of November 2 was the enormity of the Democratic defeat in the Michigan State House. While many had predicted that the Democrats’ margin of 67 to 43 would be reduced, few predicted that they would lose control of the lower chamber (myself included) and end up with 47 seats, a humiliating 20 seat loss. Indeed, Democratic numbers in the State House and Senate have not been this low since 1954, a time when Michigan’s legislature in the legislature was malapportioned prior to the 1964 Constitution. Just for reference, Table 1 below shows partisan control of the Michigan State House and Senate from 1955 to the present.


http://lh5.ggpht.com/_IM4e5b7O…

Table 1: Michigan Legislative Control, 1948-2012

What caused this twenty seat loss for the Democrats? Commentators have noted that Democratic turnout crashed on the rocks this cycle, with turnout in key Democratic precincts lower than even in 1998 or 1994 (or even 1966 for that matter). I think that the 2010 disaster can be explained largely by region, statistics, and redistricting.

Consider regionalism first. The map below shows partisan control of State House statewide.


http://lh3.ggpht.com/_IM4e5b7O…

Map 1: Michigan State House Partisan Control

One can see the 20 seats gained by the GOP on November 2 are largely concentrated in three regions of the state: Northern Michigan, downriver/eastern Michigan, and Macomb County. Of these 20 seats, 14 were open, while 6 were lost by Democratic incumbents. Maps 2-5 shows these areas in greater detail.


http://lh3.ggpht.com/_IM4e5b7O…

Map 2: Northern Michigan


http://lh6.ggpht.com/_IM4e5b7O…

Map 3: The Thumb/Macomb County


http://lh5.ggpht.com/_IM4e5b7O…

Map 4: Downriver and Eastern Michigan


http://lh3.ggpht.com/_IM4e5b7O…

Map 5: Western Michigan

Democrats lost six districts in Northern Michigan, two in West Michigan, eight seats in the downriver/rural eastern Michigan, two seats in the Thumb, and two in Macomb County. The loss of seats on a regional basis is significant to explaining the GOP’s success in 2010. The Upper Peninsula has long been a Democratic stronghold, although the Democratic Baseline (which is the average Democratic share of the vote cast for State Board of Education races) for the districts in northern Michigan (101, 103, 106, and 107) are much more Republican-leaning. The decline of the Democratic brand over the past two years is due in part to the retirement of Bart Stupak, who had long provided a strong conservative Democratic presence on the top of the ticket for Democratic voters in the north, and also the antipathy of voters to the first two years of the Obama Administration. This suspicion of the Obama Administration has cultural and economic roots, but is also due to the steady drumbeat of the GOP noise machine that has played on the fear and malaise of many voters.

The six seats lost in West Michigan, Macomb County, and the Thumb are swing (Districts 24, 32, and 91) or Republican leaning Districts (Districts 70, 83, 84). However, the eight seats lost in Monroe, Jackson, Lenawee, Washtenaw, and Wayne Counties are in many was due to Rick Snyder being on the top of the Republican ticket. Snyder almost carried his home county (Washtenaw), a county that Democratic candidates generally carry by a two to one margin. The fact that Snyder almost carried this county doomed the Democratic State House candidates in the two Washtenaw County districts (52nd and 55th). Similarly, Jackson, Lenawee, and Monroe Counties, which have generally had a slight Democratic lean over the past four election cycles, swung decisively towards the Republican column, costing Democrats four seats. In Wayne County, Democratic incumbent Deb Kennedy was caught napping in the 23rd District, while Republicans picked up the 19th State House seat, which has historically been a Republican seat.

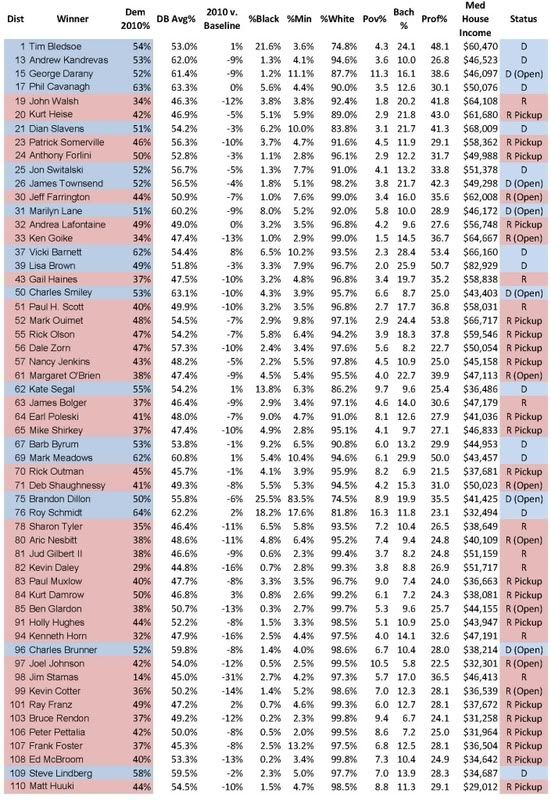
Thus regionalism partly explains the 2010 results. Table 2 below attempts to explain the results based on demographic and economic statistical data for each seat. I pulled data on any race that was 1) a Republican pickup, 2) where the winning candidate won with less than 55% of the vote, or 3) was identified as a Weak Republican, Weak Democratic or Swing seat in my previous analysis. The categories in Table 2 are pretty self-explanatory, although a few deserve further explanation. Dem 2010% is the percentage received the Democratic State House candidate in 2010, while DB Avg% is the Democratic Baseline average from the 2004, 2006, and 2008 elections. %Black, %Min, %White is based on ethnic data from the 2000 Census, as is Pov% (poverty rate), Bach% (percentage of residents who hold a Bachelor’s Degree), Prof% (percentage of residents who work in professional sector), and Med House Income (Median Household Income). While this data is ten years old, it serves as a reference point for analyzing the data. Once the 2010 Census data is released next month, I’ll try to update some of this information.

In the 55 races, Democrats won 18 seats in 2010 (or 37%). In comparison, after the 2008 election they held 38 seats (69%). Some Democratic incumbents who won in 2010 performed slightly better than the 2004-08 Democratic baseline average, and only two Democratic incumbents (Terry Brown in the 84th and Dan Scripps in the 101st) who ran better than the baseline lost. Every other Democratic candidate (incumbent or challenger) performed worse than the baseline.


http://i303.photobucket.com/al…

Table 2: District Analysis

Is there a silver bullet from the data that explains the Democratic disaster in these 55 districts? Besides the fact that Republican incumbents were invulnerable, and that every open GOP seat was held, a few trends appear when you do some preliminary regression analysis. With correlation coefficient.78, the 2004-2008 Democratic baseline average is the strongest predictor of Democratic State House performance in 2010. Which, in my opinion, is not all too surprising.


http://lh6.ggpht.com/_IM4e5b7O…

Table 3: Baseline Regression

The other variables have a much weaker predictive value and are not statistically significant. The only other significant variable is race, and there is a -.42 correlation coefficient with the white population percentage, which has a t score of 3.369. Essentially, Democrats won any district where the white percentage of the population was under 90%. Personally, I think that the financial data, which should be available relatively soon from the Michigan Campaign Finance Network, will also show that a large financial edge for the winner will be statistically significant.


http://lh3.ggpht.com/_IM4e5b7O…

Table 4: White% Regression

Finally, how does redistricting explain regionalism and statistics? In 2001 the Republican Party controlled all three parties in the redistricting equation (the State House, Senate, and Michigan Supreme Court). The map drawn for the State House sought to maximize the Republican gains in the 2000 election, and as a result the number of seats controlled by the GOP increased from 58 in 2000 to 61 in 2002. However, the map cut too close to the margins, and Democratic wave years in 2006 and 2008 resulted in the GOP caucus being reduced to 52 and 43 seats, respectively. Perhaps a wiser map would treat 2010 as an aberration, and a new map would seek to draw 56 to 58 safe Republican seats. Given that there are 63 members of the Republican House caucus, I suspect that every incumbent will want a seat that protects his or her interests. For the Democrats looking for a strategy in 2012, I’d look really hard at trying to knock off the GOP in metropolitan Detroit (Districts 23, 24, 52, 55, and 56) as well as reclaiming districts 108 and 110 in the Upper Peninsula and Districts 101 and 103 in Northern Michigan. This would bring the party back to a narrow majority. However, given that a new map will be created in late 2011, closer targeting will need to wait until then.

MT-Gov: Termed-Out Schweitzer Popular, But Dems Trail

Public Policy Polling (PDF) (11/10-13, Montana voters, no trendlines):

Steve Bullock (D): 31

Rick Hill (R): 41

Undecided: 28

Generic D: 39

Generic R: 49

Undecided: 12

(MoE: ±2.9%)

Ah, if only Brian Schweitzer could run again. The outgoing two-term governor gets a 55-33 approval rating (fourth-best among govs that PPP has tested), including 28% from Republicans. But thanks to term limits, Schweitzer’s going to have to find something else to do come 2013. In his stead, PPP tests state Dem AG Steve Bullock (who hasn’t actually announced anything) against former Rep. Rick Hill (who has – he’s in).

Though the initial numbers are far from great for us, and both men are at about 65% unknown in terms of favorables, Bullock is positive at 22-14, while Hill suffers underwater at 16-19. I suspect that being a former member of Congress probably is not such a great resume item these days. Anyhow, if Bullock (or another strong Dem) makes the race, this should be an exciting contest, especially if Schweitzer puts his back into ensuring this seat stays blue.

12-6 GOP gerrymander of PA (updated with maps)

With Pennsylvania set to lose a congressional district in 2010, and with the GOP now in charge of the process (again), here’s what a 12-6 map might look like.  It’s quite ugly but ugliness is perhaps the only way the GOP can take a light blue state and cement a 12-6 hold on its congressional delegation!  (Bear in mind, Bush II never carried PA).  Even as is, I think a 12-6 map, eliminating just one Democratic congressman, is perhaps a dummymander.  Southeastern PA, especially, is trending away from them.  But I see no way the GOP is going to sacrifice one of their own to make a more sensible 11-7 map.

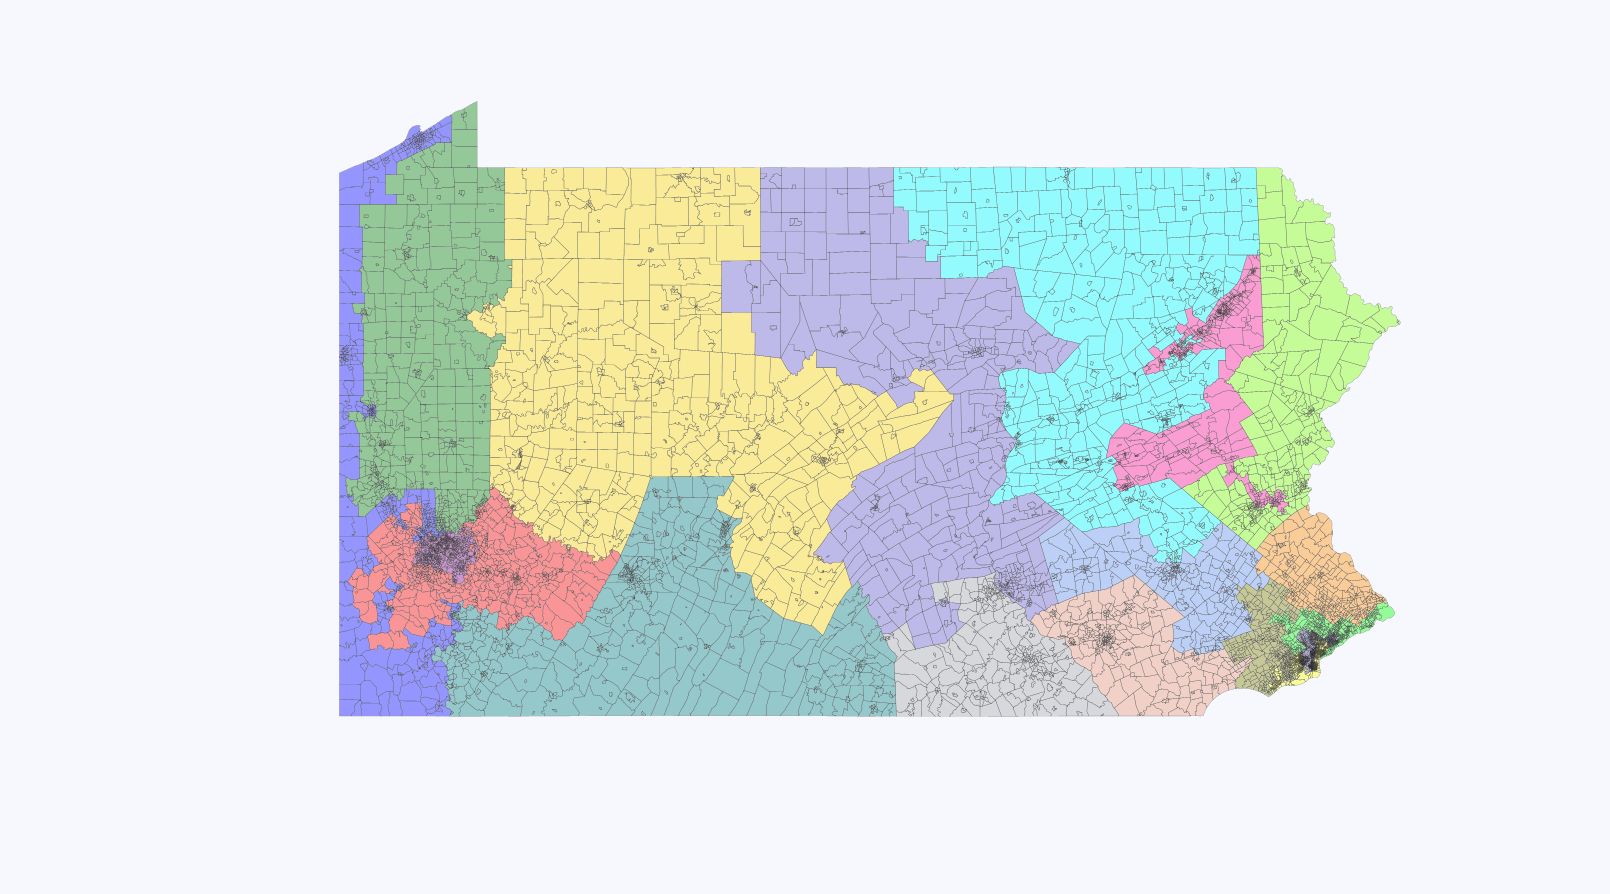
Ok, here goes… and I’ve renumbered the districts roughly west to east… can’t understand why PA, OH, FL, TX, and a few other states have district numbers that jump all over the place!

Photobucket

District 1 (blue): Altmire (D) OR Dahkemper (D): Erie, New Castle, Dem areas of SW PA

Obama 55, McCain 44

This is perhaps the ugliest district in the entire map, and its purpose is as a Democratic vote sink so that neighboring CD #2 becomes much safer for the GOP.  Still surprising that it isn’t all that Democratic-performing going by Obama’s vote percentage.


District 2 (green): Kelly (R)

Obama 42, McCain 57

Kelly gets a considerably safer district with the removal of Erie into CD #1.

Photobucket

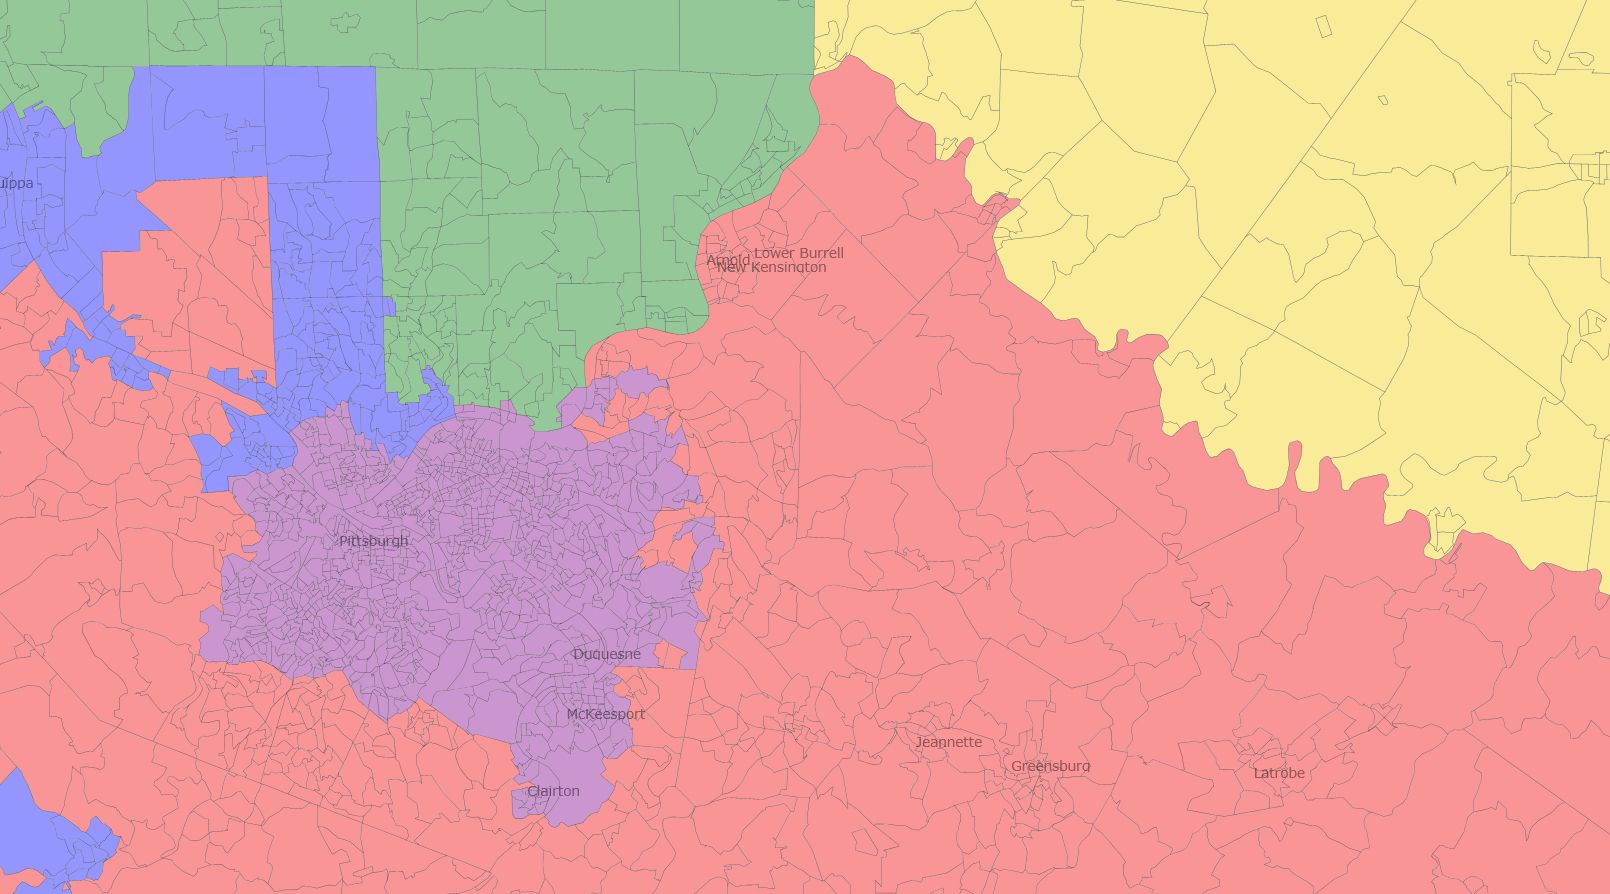
District 3 (purple): Doyle (D)

Obama 68, McCain 31

Still a ridiculous vote sink around the Pittsburgh area.  District extends south a bit to gain some of the southern-most suburbs and thereby helps Murphy’s district become a bit redder.

District 4 (red): Murphy (R)

Obama 42, McCain 57

Republican suburbs in southern Allegany County, most Republican areas of Washington County, and almost all of now GOP-leaning Westmoreland County.  Murphy should be happy with this district.

District 5 (yellow): Thompson (R)


Obama 44, McCain 54

A more condensed version of the PA wilds district that you drive through on I-80.

District 6 (teal green): Shuster (R) vs. Critz (D)


Obama 41, McCain 58

If you were to get rid of a Democrat out of the 7, Critz is the safest one to get rid of.  The ruby-red mountains of PA drown out whatever Democratic votes Critz may be able to get out of Johnstown or Fayette/Somerset counties.  This should be safe for Shuster, unless he forgot how to campaign like Gekas in 2002.

District 7 (grey): Platts (R)

Obama 42, McCain 57

Stays largely the same.

District 8 (purple): Marino (R)

Obama 44, McCain 54

The GOP is faced with a real dilemma in NE PA in that they have 2 GOP freshmen incumbents to protect in an area that should by rights only elect one of them.  Because of this, they realistically cannot target Holden as they did in 2002.  Because of the need to give safer districts to Barletta (and, realistically, Dent – certainly if I were a GOP mapmaker I’d hedge my bets there), this district shifts south to grab all of Dauphin County.  The Democrats of Harrisburg are drowned out by the Republicans of Lycoming and other GOP counties between the two…. Best of all, while it is possible for a Democrat to win this district, Christopher Carney no longer lives in this district.

Photobucket

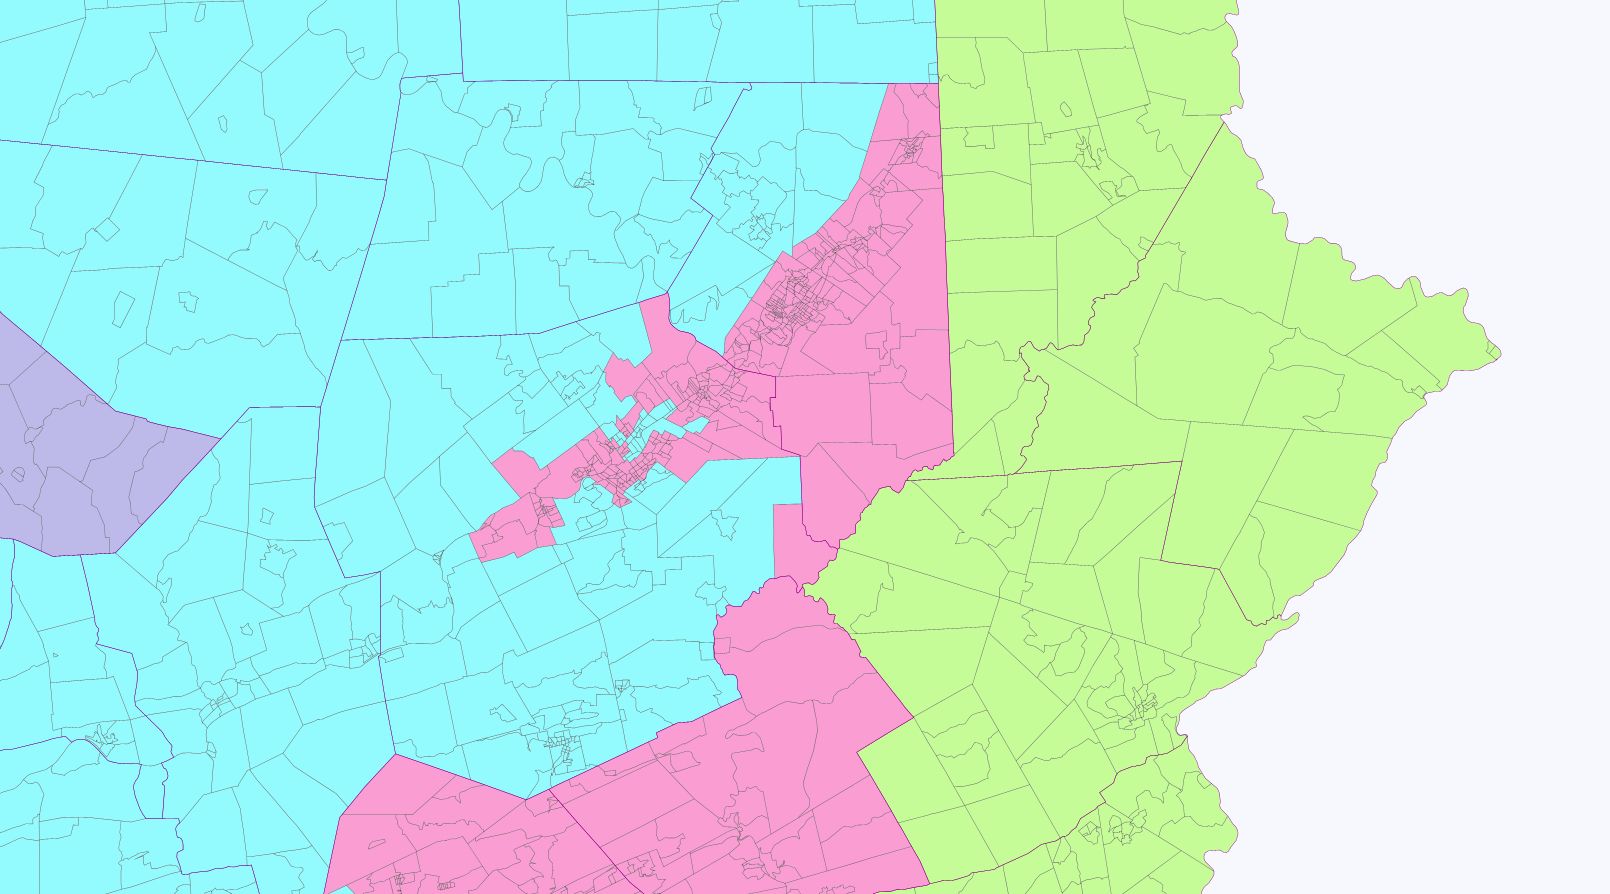
District 9 (sky blue): Barletta (R)

Obama 45, McCain 54

Through clever conceding of the most Democratic areas of his current district to Tim Holden’s neighboring 10th, this district becomes a carbon-clone of the 9.  Goes from the Republican T south to northern Berks County, but aside from swingy areas in Lackawanna and Luzerne County, this is a lean-GOP district, although it includes the home of Chris Carney, most of the district would be unfamiliar to him.

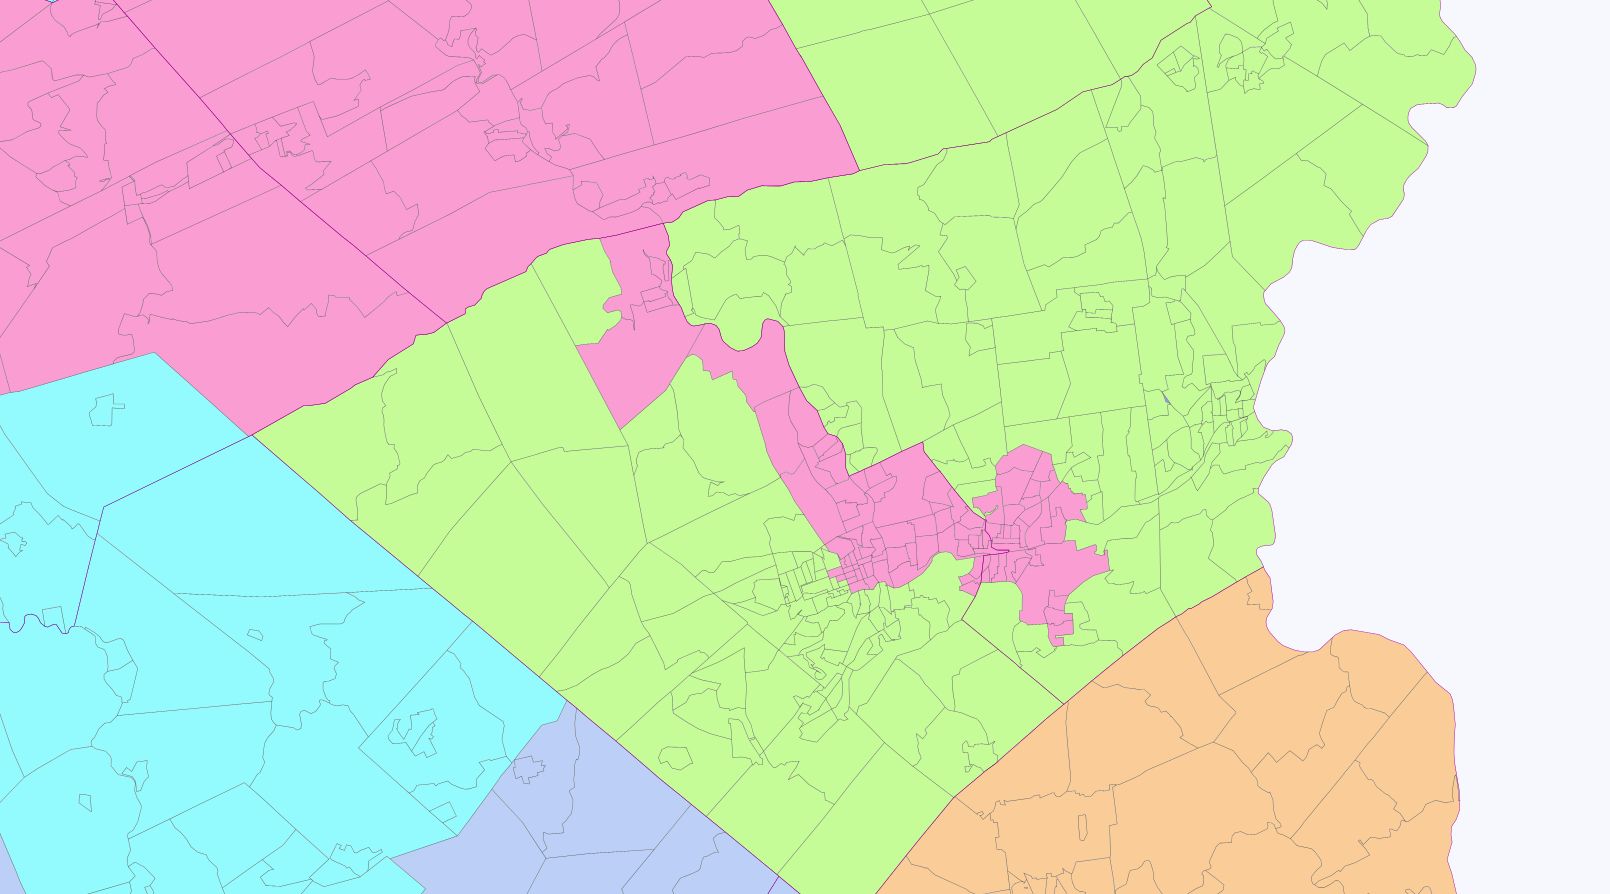
District 10 (pink): Holden (D)

Obama 61, McCain 37

This is Northeastern PA’s Democratic vote sink.  It accordingly helps out Baretta and Dent.  It helps out the latter by removing Bethlehem, the city of Dent’s 2010 challenger, and about 1/2 of Allentown, through a narrow ugly tendril southward from Carbon County.  Hoping that the part that Dent lives in is in neighboring CD 11; if not, it can easily be rectified by swapping precincts in Allentown.  From there it extends north to include all of the Democratic-rich areas of Scranton and its environs; ditto with Wilks-Barre and other Democratic areas of Luzerne.  It also includes the more Democratic eastern half or so of Schuylkill County, where Holden lives.

Photobucket

District 11 (neon green): Dent (R)

Obama 53, McCain 46

This district becomes a bit safer for Dent by extending north a bit along the Delaware River to Monroe, Pike, and Wayne counties.  It loses Bethlehem and part of Allentown through a narrow tendril in the 10th district.  Although Dent easily gets reelected in his district, his 2010 opponent, the mayor of Bethlehem, presented Dent with a tough race.  He now can run in a Democratic primary against Holden if he wishes.

Photobucket

District 12 (slate blue, I guess): Gerlach (R)

Obama 52, McCain 47

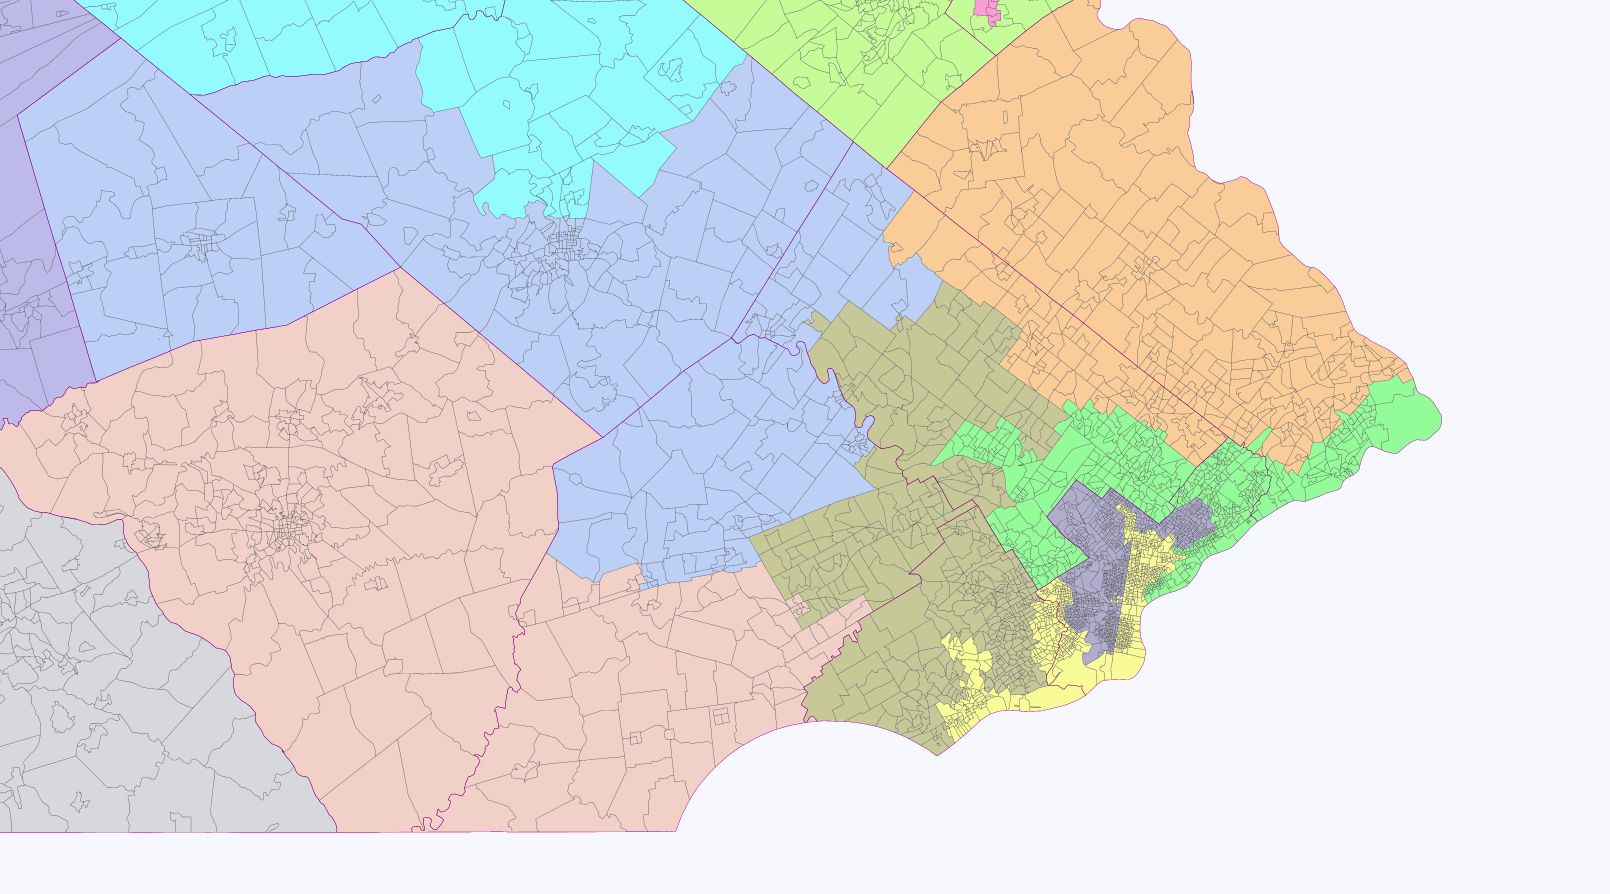
For slaving it out cycle after cycle, Gerlach gets a much safer more exurban district.  Lebanon, the rest of Berks not in CD 10, including all of Reading, which Gerlach can handle, a bit of northern Montgomery, and the northern half or so of Chester, where Gerlach is from.

District 13 (peach): Pitts (R)

Obama 47, McCain 52

Lancaster and the southern bit of Chester, where Pitts is from.  One is tempted to make this even more Democratic still to help out fellow SEPA Republicans elsewhere, but Pitts would be endangered if this district got any bluer than it is.  Indeed, if Lancaster follows Chester in becoming the next red-to-blue suburb of SE PA, I wouldn’t be surprised if Pitts retired and was replaced either with a more moderate Republican or a Democrat.

District 14 (ugly green): Meehan (R)

Obama 53, McCain 46

mostly the same as before in Delaware County, with a few more heavily-Democratic areas such as Media, the areas around Swarthmore College, and heavily black areas in Upper Darby and Lansdowne removed into Brady’s 18th.  The district extends a bit further into carefully chosen precincts in Montgomery County, with Schwartz taking the most Democratic ones.  Meehan should be fine.

District 15 (orange): Fitzpatrick (R)

Obama 52, McCain 47

Bucks County finally gets partitioned, with Bristol, the home of Murphy, and the most Democratic areas nearest Philadelphia removed into Schwartz’s 16th and replaced with more GOP areas in Montgomery County.  The district gets 2-3% more Republican than currently is the case as a result.  About the best that can be done for Fitzpatrick.

District 16 (light green): Schwartz (D)

Obama 64, McCain 35

There we have it, an effective Democratic vote sink in SEPA that helps out all of the endangered GOP congressmen surrounding it.  It carefully takes in the most Democratic areas of Montgomery and Bucks and connects the two through also taking in a large part of NE Phily.  

District 17 (dark purple): Fattah (D)

Obama 88, McCain 12

55% black, 34% white, 5% Hispanic

Largely the same as before, gaining more areas in NE Phily to equalize its population.  Black % drops but still VRA-compliant by a long way.


District 18 (yellow): Brady (D)

Obama 87, McCain 13

44% black, 30% white, 18% Hispanic

Again, largely the same as before.  Extends a bit further into Delaware County to vacuum up heavily-Democratic precincts in favor of Meehan; likewise it takes a bit more of NE Phily than it did before.  Still, it retains its position as a minority-majority VRA-complaint coalition district.

TX-27: Ortiz Concedes to Farenthold

It’s over:

Rep. Solomon Ortiz conceded to his Republican challenger Monday night in in Texas’ 27th district. The Texas Democrat called challenger Blake Farenthold, a former radio talk-show host, as the last county in his district worked toward wrapping up its recount. …

Ortiz asked for the recount, which cost him $23,500, after the original unofficial count showed him down by 799 votes. Five of the district’s six counties had finished by Friday, but Cameron County – which was also dealing with a recount in a county judge’s race – was still finishing recounting absentee and early ballots Monday evening. Officials there expected to certify the vote count Monday night.

Though swingy at the federal level, this district is over 70% Hispanic.

Cautious GOP map for PA – 13-5 in a good year

Republicans had a great night in Pennsylvania this November, which makes drawing a decent map for them really hard.

To make matters worse for them, they won in all the wrong places. They knocked off Carney and Kanjorski, whereas if they’d taken only one of them they could have packed the survivor’s district and used the redder bits of his district to make Charlie Dent a little later. They held PA-6 and took back PA-7 and PA-8, meaning that it’s that much harder to protect their representatives in the suburban Philadelphia area, whereas if the Dems had held one seat then it would have been possible to shift the other districts further from the city.

And they didn’t knock off Critz or Altmire, meaning that they’ll have to work a little harder to give them unwinnable districts.

All in all, they’d have a lot more options for the coming redistricting if they’d won a few less districts and if more of them had been in western PA.

But what’s done is done. Republicans can enjoy their gains for now and they’ll just have to work to try to keep them – because there’s no way they’ll willingly concede seats in the next redistricting.

This map is an attempt to strengthen the Republican freshmen and to eliminate the last two Democratic representative in western Pennsylvania outside Pittsburgh. By giving Tim Holden a strongly Democratic district, it gives the Republicans a chance of a 13-5 advantage out of the state.

But this is not without risk. McCain got beaten by ten points in Pennsylvania and five Republicans in this new map will represent districts he lost. If they all flipped, Democrats would have a 10-8 advantage out of the state.

On the other hand, it’s almost impossible to defend all twelve Republican congressmen in the state effectively. This map improves the prospects of each Republican in a district Obama won by at least four points net. I won’t pretend this map doesn’t have weaknesses, but it’s probably the best the Republicans can do.

As an added challenge, I endeavoured to keep townships together, as I don’t think the advantage gained by splitting them outweighs the negative press received for doing so. This doesn’t apply in Philadelphia, as the Republicans have no reason to care about a backlash there.

PA-1

Incumbent: Bob Brady


Population White Black Hispanic Asian
684861 35 50 8 5


Obama % McCain %
Old lines 88 12
New lines 87 12
% change -1% +0%

Like I said, redistricting isn’t going to be as much fun for the Republicans as it might have been. If they want to enjoy themselves, they’ll have to make their own entertainment.

In this map I represented that by drawing the new PA-1 as minority-majority (which the Republicans would be mad not to try for, as with no retrogression they can create two Democratic vote sinks that will be almost impossible to eliminate).

I also noted that according to his candidate petitions Bob Brady lives in Ward 34 Precinct 34, which is on the very western edge of West Philadelphia. I therefore slipped it into Allyson Schwartz’s district.

Now, Bob Brady is quite capable of moving a few blocks back into the district, assuming election law actually requires him to. And he’s represented a minority-majority district for long enough that making it 50% black won’t have him quaking in his boots. But still, Republicans have to get their giggles somehow. And spite is the gift that keeps on giving.

The district itself is somewhat less interesting. It keeps its strip through southern Delaware County to Chester, as well as the areas of Darby, Yeadon and Sharon Hill, and combines these these with south, west and central Philadelphia, together with portions of north Philly and much of Kensington.

PA-2

Incumbent: Chaka Fattah


Population White Black Hispanic Asian
685048 34 50 10 3


Obama % McCain %
Old lines 90 10
New lines 88 12
% change -2% +2%

Chaka Fattah is harder to draw out, so Republicans will have to settle for just giving him the biggest district in the state population-wise.

There’s very little to say about this district. It narrowly remains above 50% black and takes in the rest of Philadelphia, bar small portions of the Northeast and Northwest. Much of it is new to Fattah, but I can’t imagine him facing too many problems with it.

PA-3 (was PA-13)

Incumbent: Allyson Schwartz, Bob Brady, Patrick Murphy


Population White Black Hispanic Asian
681192 83 8 3 4


Obama % McCain %
Old lines 59 41
New lines 64 35
% change +5% -6%

It’d be much easier to pack the Democratic vote if the Philadelphia suburbs hadn’t elected so many Republicans this year. As a result, the task is largely left to Schwartz, who gets a district that’s absolutely safe in the hope she doesn’t get ideas like running for governor any time soon.

I’ve renumbered the districts, because if you’re going to gerrymander you should at least care enough to cover your tracks by numbering the districts in a vaguely logical order (even if my order does involve flying betwen north and south Pennsylvania like a fairground ride.)

The district keeps its core in southern Montgomery County and Northeast Philadelphia, although much of northern Montgomery is moved elsewhere. To this it adds Northwest Philadelphia west of Wissahickon Creek and north of Cresheim Creek, plus Bensalem southern parts of Levitttown in Bucks County. In doing so, it also mops up the home of Patrick Murphy, in an attempt to keep him out of Fitzpatrick’s hair.

PA-4 (was PA-8)

Incumbent: Mike Fitzpatrick


Population White Black Hispanic Asian
682279 92 2 2 2


Obama % McCain %
Old lines 54 45
New lines 52 47
% change -2% +2%

Fitzpatrick’s district is improved by four points net and Murphy is removed from his district. That said, it’s not all smiles for him.

Swapping southern Bucks for reddish or marginal parts of eastern and northern Montgomery helps him a little. On the other hand, he could be helped a lot more if the last 35,000 of his population requirement didn’t have to be filled by taking Easton off Charlie Dent’s hands.

This district is slightly more Republican than the nation as a whole, and if Fitzpatrick endears himself to his constituents he could well survive. On the other hand, he has to be hoping Sarah Palin gets nowhere near the Republican nomination. The last thing he needs in 2012 is a combination of presidential year turnout and a candidate guaranteed to drive suburban voters into voting for Democrats.

PA-5 (was PA-6)

Incumbent: Jim Gerlach, Manan Trivedi


Population White Black Hispanic Asian
680512 90 3 3 3


Obama % McCain %
Old lines 58 41
New lines 53 46
% change -5% +5%

Jim Gerlach is never going to be entirely safe, but this district might give him a bit of extra comfort for a couple of cycles.

Like Fitzpatrick, he has to help Dent out in the Lehigh Valley, in Gerlach’s case grabbing Bethlehem plus southern portions of Lehigh and Northampton counties. Nevertheless, these areas aren’t overwhelmingly blue and in all other cases boundary changes are in his favour.

He gives up much of Chester County to let the new PA-6 through and abandons Reading and its most Democratic suburbs to Tim Holden.

In return, he picks up absolutely blood-red, 70-30 McCain areas in northwest Berks and northeast Lancaster, which are less likely to turn blue suddenly than his current suburban turf.

PA-6 (was PA-7)

Incumbent: Pat Meehan


Population White Black Hispanic Asian
679961 90 5 2 3


Obama % McCain %
Old lines 56 43
New lines 51 48
% change -5% +5%

Pat Meehan is probably the big winner on this map, which is largely accidental, as I figured that if there had to be a Republican casualty in the southeast, he’d be first in line as a freshman who hadn’t previously served in Congress.

His district moves a net ten points towards Republicans. Well, I say his district. Rather than being centred on Delaware County, it now draws less than 250,000 from that source. In the process, it has offloaded the homes of Sestak and Bryan Lentz to Joe Pitts’ district.

It makes up for this by heading west through the central parts of Chester county, turning northwestwards and heading through Lancaster county into southern Lebanon county and eastern Dauphine county, finishing up in the outer suburbs of Harrisburg.

With no part of the district outside Delaware County large enough to provide a base for primary challengers and with a lot of new turf that won’t turn blue in a hurry, Pat Meehan can afford to feel very pleased with himself.

Until he realises that Obama still won this district, so he can’t feel entirely comfortable.

PA-7 (was PA-16)

Incumbent: Joe Pitts, Joe Sestak, Bryan Lentz


Population White Black Hispanic Asian
681623 91 4 3 1


Obama % McCain %
Old lines 48 51
New lines 49 51
% change +1% +0%

Although he represents the first district we’ve yet seen that McCain won, Joe Pitts is probably the biggest Republican loser on this map.

It’s not drastic in terms of pure partisanship. Obama improves by only 1% compared to the old lines. But whilst he’s dropped Reading and Lancaster and picked up reliably red turf in southern York County, he’s also absorbed a little over 200,000 new largely Democratic voters in Delaware County.

If he’s ready to adapt himself to a more suburban audience, he’ll do fine. McCain won the new district and it’s likely Bush did so with huge margins. But if he can’t do that and if Joe Sestak fancies running for Congress again, there could be problems for Pennsylvania Republicans.

Pennsylvania gets wyoming’d

First of all, this is my first diary and my first redistricting so be gentle! Also, there is one small error in the bigger pictures, however it is fixed in the zoom ones.

I basically did a very dem friendly redistricting of Pennslyvania under the Wyoming plan. This gives PA 25 seats of about 491,242 that MassGOP has made diaries on.

Without further ado, the map: http://img.imgcake.com/pajpgbu…

Without counties/cities: http://img.imgcake.com/paunmar…

Zoom on Philadelphia: http://img.imgcake.com/phillyu…

East PA: http://img.imgcake.com/eastpai…

SEPA: http://img.imgcake.com/southea…

District 1 (Blue): Obama 73%

Plurality Minority  

Goes from Philly to chester county, covering most of delco along the way. I was surprised how democratic the district was. 49 W 44 B

District 2 (Green): Obama 58%

Just gave the district a chunk of philly then tried to make it more conservative, so it went into Bucks, Montgomery and most of South Delaware. Should be reasonably safe.

District 3 (Purple): Obama 56%

Northeast Philly and wraps around the 2nd and 4th. Most bucks, but also Northampton and Lehigh. Would lean strongly D, and it would only get moreso. Would be vulnerable in another 2010 like year.

District 4 (Red): Obama 55%

Takes Allentown and half of Bethleham. Goes into Montgomery, Bucks, a lot of lehigh, and northhampton. Should be ok in most years.

District 5 (Yellow): Obama 55%

Rest of Bethleham, Easton, and most of Hazleton. All of carbon and monroe counties. Only 2 people off the population goal. Should lean Dem.

District 6 (Teal): Obama 53%

Wilks-Barre, the scranton suburbs, a tiny piece of scranton, all of Montour, columbia counties and the majority of wyoming, luzurne and lackawanna. (Thank you the office for spelling of that). Would tilt D but probably require a blue dog.

District 7 (Silver): Obama 54%

The funniest district in the state, containing the rest of scranton, most or all of 3 northeastern counties, and going all the way to Penn State. Leans D

District 8 (Violet): Obama 64%

This one is ugly. Starts in Philly and just goes out. Snakes through Montgomery to get some of the central pa counties like Snyder and Mifflin. Easy D.

District 9 (Sky Blue) Obama 58%

The most Liberal parts of delco and montco along with eastern chester county. Leans D pretty heavily.

District 10 (Pink) Obama 53%

Harrisburg, Half of Lancaster and coatsville. Pretty tough to hold but def doable. Leans slightly

District 11 (Lime Green): Obama 73%

Starts in Philly and snakes.

District 12 (Robin’s Egg Blue): Obama 57%

Starts in Philly and snakes up to central. Easy Dem.

District 13 (Tan): Obama 89%

VRA district. 29 W 46 B 19 H

District 14 (Gold): Obama 39%

Huge by Land Area, takes a ton of the conservative areas into one votesink.

District 15 (Orange): Obama 53%

The one I’m perhaps most proud of. Goes from York to Pittsburgh. Takes Altoona, Johnstown, and some of the bigger Pitt suburbs. Blue dog should take this one easily.

District 16 (Slightly darker lime green): Obama 50%

Reading and the other half of Lancaster. True toss-up, very winnable.

District 17 (Navy Blue) Obama 40%

The surprisingly heavily populated York, Adams and Franklin counties in south central pa. Not a shot in hell for us to win it.

District 18 (Bright yellow): Obama 41%

Scraps. Takes parts of a lot of other counties. Easy R win.

District 19 (Pea Green): Obama 40%

A lot of the Southwestern counties. Easy R win.

Pitt close up: http://img.imgcake.com/pittclo…

District 20 (Light Pink): Obama 52%

Parts of Pitt and Washington county and Fayette county. Lean D or Toss-Up

District 21 (Blood Red): Obama 54%

East Pittsburgh, some suburbs and then it just snakes out east. Lean D

District 22 (Poo Brown): Obama 38%

One of the most conservative districts in the country. Easy easy R.

District 23 (Baby Blue): Obama 54%

Erie, Saint Mary’s and a lot of the more liberal areas in the Northwest PA. Lean D

District 24 (Dark Purple): Obama 55%

Lots of pittsburgh and Allegheny county. Likely D

District 25 (Pink-Red Mesh): Obama 49%

What was left. Surprised it was still winnable for us.

Lean Dem or better: 18

Toss-up: 2

Easy R: 5

Thoughts?

New Mexicyoming: Four Wyoming-Size Districts in the Land of Enchantment

Redistricting according to the highly hypothetical Wyoming Rule is the latest SSP trend. In brief, the rule throws out the inequality currently on display in the House, where the at-large district of Wyoming is dramatically overrepresented in terms of population compared to the average district in, say, Los Angeles.

I took on the task of drawing a Wyoming Rule map for New Mexico. Under the rule, the Land of Enchantment would add one congressional district. Using 2008 population estimates, I managed to draw a 3-1 map with no less than three VRA minority-majority coalition districts.

NM-01 (safe Democratic)

43% white, 4% Native, 47% Latino

64% Obama, 35% McCain

This district covers most of the Albuquerque area, excluding the whiter, more Republican suburbs and exurbs in eastern Bernadillo County and creeping up just barely into Sandoval County. It’s quite close to being an outright Latino-majority district; growth rates suggest it will be by the end of the decade, if I remember right. No reason studly Rep. Martin Heinrich couldn’t win here, as it’s a heavily Democratic district.

NM-02 (likely Democratic)

33% white, 17% Native, 48% Latino

58% Obama, 40% McCain

In Maryland, this would be a safe Democratic seat, but inconsistent voter turnout among Native Americans means that for New Mexico, this is just a district in which Democrats start off with a pretty decent advantage. Indeed, virtually all of this district will be represented by Republican Rep.-elect Steve Pearce in the 112th Congress, although western New Mexico tends to be more liberal than eastern New Mexico, which balances out the current NM-02 for a Republican-tilting swing district. Rep. Harry Teague could certainly win here, but as this district is likely to be outright majority-Latino by redistricting, the base might prefer a Latino representative.

NM-03 (safe Democratic)

43% white, 13% Native, 41% Latino

63% Obama, 36% McCain

This district in northern New Mexico is basically just a smaller version of Rep. Ben Ray Luján’s current district, ceding McKinley County and much of Sandoval County to NM-02 and ceding Quay, Curry, and Roosevelt counties to NM-04. It is strongly Democratic and actually plurality-white, although minority groups still make up the majority of the population. Luján would cruise here, much as he does in the current version of his district.

NM-04 (safe Republican)

60% white, 2% Native, 33% Latino

40% Obama, 58% McCain

The whitest, most conservative district in the Wyoming Rule drawing of New Mexico covers the state’s southeastern quadrant, with tendrils reaching into the Republican-tending eastern part of the greater Albuquerque area, including eastern Bernadillo County. Rep.-elect Pearce would be fine here.

Thoughts, either on the Wyoming Rule or on the New Mexico electoral map?

SSP Daily Digest: 11/22

AK-Sen: A new profile of Sitka mayor Scott McAdams has him sounding unsure about using his newfound celebrity to run statewide again, as he cites the very apparent difficulty of winning statewide as a Democrat in Alaska. In the article is an interesting number that also shows just how well Lisa Murkowski did at getting moderates (and even Dems doing the game-theory thing) to fall in line behind her: Ethan Berkowitz, the Dem candidate in the standard 2-way race for Governor, picked up 96,000 votes, way more than McAdams’ 67,000.

MA-Sen: Here’s a name that we haven’t heard associated with the Senate race, sounding more interested than assumed (well, he’s not sounding interested, but “mum” is not not interested). Barney Frank, who skipped the special election and was assumed not interested at the time because of his age and his chairmanship, is saying “ask me later” about challenging Scott Brown. Maybe being in the minority has changed his mind, since he has no gavel to give up anymore.

ME-Sen: If there was any doubt that Olympia Snowe’s main problem in 2012 will be in the GOP primary, against a teabagger-to-be-named-later, check this out: she just signed on to an amicus brief challenging the constitutionality of the mandate portion of health care reform. That’s, of course, the same bill that she helped vote out of committee (though she voted against it on the floor).

MI-Sen: The GOP field to go against Debbie Stabenow hasn’t really started to take shape yet, but here’s one potential name that’s getting some encouragement within conservative circles to run: soon-to-be-ex-Rep. Peter Hoekstra, who lost the GOP gubernatorial primary. He isn’t ruling it out, but is “predisposed to say no.”

NE-Sen: While the entry of AG Jon Bruning (who has an exploratory committee) is considered pretty much an inevitability, there’s already one Republican formally in the race now: investment adviser Pat Flynn, who sounds like he’ll be flying the tea party flag. Flynn got 22% of the vote in the 2008 Senate GOP primary, losing to Mike Johanns.

NM-Sen: If you’re waiting on pins and needles to find out whether Jeff Bingaman will run for another Senate term, you’ll need to wait a little longer. Bingaman is expected to announce his 2012 plans in March (the usual timetable he’s followed for previous re-elections). The article points out he recently raised $400K at a fundraiser, certainly the actions of a man planning another run.

NV-Sen: It would have taken the confluence of a great Harry Reid campaign and a terrible opponent’s campaign for Harry Reid to win in a year like this, and it looks like that’s what we got. You’ve all seen the post-mortems about how effective Reid’s campaign was, and now here’s a nice Politico piece on the amateur-hour efforts from Team Angle, focusing on her campaign manager Terry Campbell, who often seemed unaware of the timing of ad buys or even how much money they had at a given moment. Maybe most telling: the Election Day phone bank shut down at 5 pm (despite polls being open until 7) in order to go set up the victory party. Never fear, though, it sounds like yet more Angle is on tap for 2012. However, it’s sounding more and more like the plan, instead of running against John Ensign in the Senate primary, will be to run for the open seat in NV-02 assuming Dean Heller runs for Senate. (Another option is running for the state Senate, as her long-time nemesis Bill Raggio will be vacating his Reno-area open seat.)

TX-Sen: Here’s a boilerplate article on the speculation as to whether Kay Bailey Hutchison runs for re-election, but there’s an interesting tidbit buried within: Chet Edwards, who’ll be looking for work soon and has a better profile for running statewide than for his blindingly-red district, is getting a strong push to run on the Dem side. (The Texas Tribune has more on Edwards here. Another, maybe likelier, possibility, is an Obama administration job.)

VA-Sen: The Virginia state GOP has decided to hold a primary to nominate its Senate nominee in 2012, not a convention (as they did in 2008). This is seen as a boost to establishment fave George Allen, who, flamingly right-wing as he is, would still be vulnerable to someone even to the right at a convention, which is dominated by the hardcore faithful. (As seen by Jim Gilmore’s near loss at the ’08 convention to the obscure state Del. Bob Marshall, reported to be interested in another try.)

IL-17: There’s a fair number of defeated Dem House members that seem like it’d a good idea for them run again in 2012, but here’s one that, well, isn’t a good idea, who’s still quick to state his interest. Phil Hare (who lost by a significant margin to a pizza parlor owner in his first actively-contested election) says he’d like to try again. The real question may be what district he’d even be running in, considering that the weird-looking 17th (intended as a downstate Dem vote sink, albeit not a very effective one if the Dem can’t even hold it) is likely to be vaporized in redistricting.

DCCC: It’s official: Rep. Steve Israel will be running the DCCC for the 2012 cycle, as the Dems seek to get back on the offensive. Israel will still need to be approved by the larger House caucus, but having gotten the Pelosi imprimatur, it’s considered a done deal.

Polltopia: Pew is out with even more data on the cellphone polling issue, and it confirms what you probably already know, that the cellphone gap is not only real but growing. They found that in the polls they conducted in fall 2010, the landline-only surveys skewed in the Republican direction by 5.1% more than dual-frame surveys. That’s up from the 2.4% cellphone gap they found in 2008 polling. They also found that dual users (both cellphone and landline) reached by cell are still significantly more Democratic than dual users reached by landline, which would explain much of the skew.

Redistricting: Good news for Dave’s App users. Having just unveiled Dave’s App 2.0 a few weeks ago, now he’s up to Dave’s App 2.0.1, incorporating a few tweaks (such as showing all districts all the time).