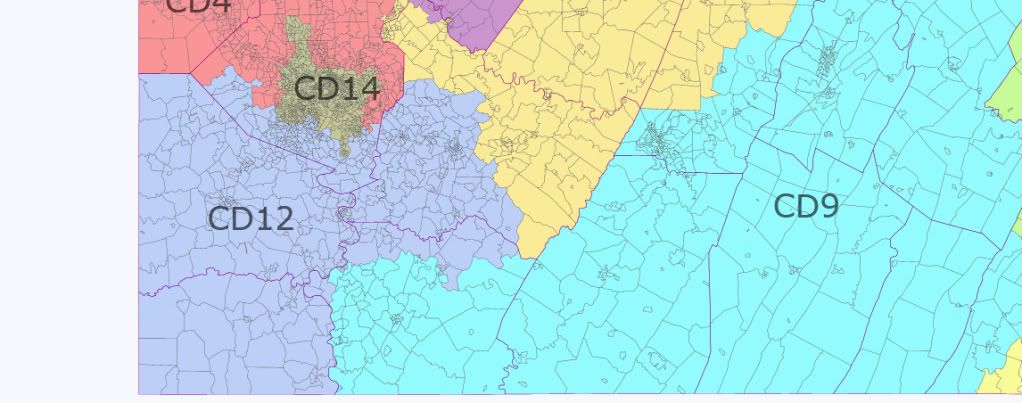
PA GOPmander

The GOP again has control of the redistricting trifecta in Pennsylvania.  Last time, it didn’t go as well as planned, as its intended 13 R & 6 D delegation (12 R + ousting Tim Holden) ended up a dummymander by 2008 (12 D & 7 R representatives).

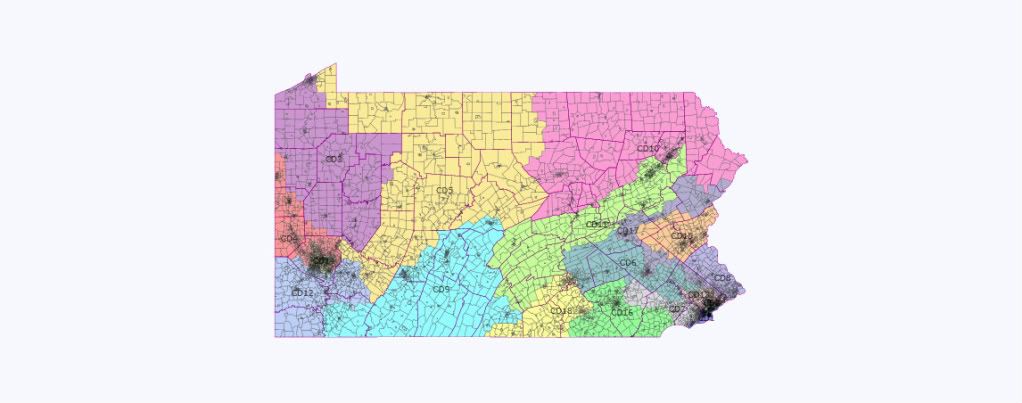
This time around, the Republicans have the challenge of shoring up regained seats around the state, in addition to the probable elimination of one of the Democratic delegation.  My goal here was to accomplish that, in addition to a couple of other curve balls:

Northwest PA:

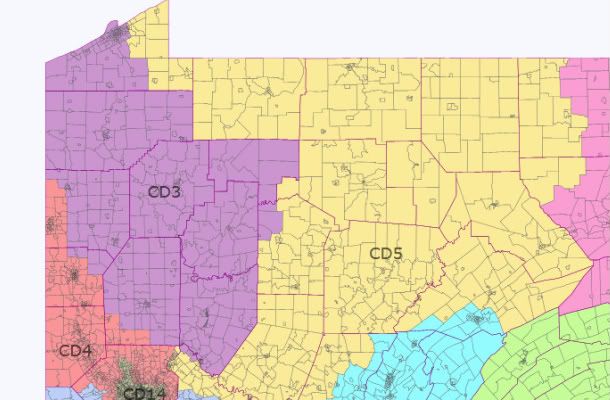
PA-3: Rep. Mike Kelly (R-Butler)

         93% White, 4% Black, 3% Other

         52% McCain, 47% Obama, (49% McCain, 49% Obama)

PA-3 shifts a few points to the right, as PA-5 takes eastern Erie county in exchange for more rural precincts.  With the old PVI R+5.2 in addition to the rightward shift in the district, Kelly should be safe in most years.

PA-4 : OPEN; potentially Rep. Jason Altmire (D-McCandless)

         93% White, 4% Black, 3% Other

         53% McCain, 46% Obama, (no shift)

Surprisingly, it is fairly easy to remove Rep. Jason Altmire out of PA-4 by combining McCandless (his residency) with Mike Doyle in PA-14 in exchange for more Republican parts of Allegheny County.  If he doesn’t decide to move within the district, this would probably be an GOP gain as the area is trending Republican with most of the state reps & senators being GOP members.  On the other hand, if Altmire sees the primary with Doyle as unfeasible (likely) and doesn’t decide to retire, PA-4 could be the successor to the current PA-17 (Dem incumbent too personally popular to be unseated).

PA-5: Rep. Glenn Thompson (R-Howard)

         96% White, 4% Other

         54% McCain, 44% Obama (55% McCain, 44% Obama)

Thompson’s district moves westward and southward, taking parts of Allegheny and Erie county in order to shore up other less safe districts.  Nothing too exciting here.

Southwest PA:

PA-9: Rep. Bill Shuster (R-Hollidaysburg) vs. Rep Mark Critz (D-Johnstown)

         93% White, 3% Black, 3% Other

         55% McCain, 43% Obama, (63% McCain, 36% Obama)

Sorry, Mark Critz, but you’re most likely going to be out of office come 2012.  The new PA-9 takes part of the former Murthamander of PA-12, including Critz’ home base of Johnstown.  At a 55% McCain district with a non-Tim Burns opponent, he’ll need the stars to align in order to beat Shuster.  Other than that, PA-9 shifts westward.

PA-12: Rep. Tim Murphy (R-Upper St. Clair), formerly PA-18

         95% White, 3% Black, 2% Other

         55% McCain, 44% Obama

Murphy snatches most of the rest of PA-12 along with his own PA-18, as southwest PA is where population growth is the lowest.

PA-14: Rep. Mike Doyle (R-Forest Hills)

         72% White, 21% Black, 3% Asian, 4% Other

         67% Obama, 32% McCain ,(70% Obama, 29% McCain)

Mike Doyle’s district, still centered around Pittsburgh) becomes slightly less Democratic with the addition of Altmire’s base of McCandless.  Doyle probably doesn’t have to worry about a primary from his right, so he should be in the clear.

NE

It’s time for Iowa!

I’m having problems inserting images into this box so here is the link:

http://i1215.photobucket.com/a…

Old 1st= http://upload.wikimedia.org/wi…

New Iowa 1 (purple) Bruce Braley’s district stays the same for the most part.

Old 2nd=

http://upload.wikimedia.org/wi…

New Iowa 2 (red)

Dave Loebsack vs. Steve King.  This district could be better I’ll admit.  I checked the counties and its 56-44 Democratic which is okay for Loebsack and not good at all for King.

Old 3rd=

http://upload.wikimedia.org/wi…

New 3rd (blue)

This would be Leonard Boswell’s district.  There’s a bunch of blue counties in the current 4th and they’re being wasted to Tom Latham.  Story County (home of Ames and Iowa State) is here.  Since Latham lives in Ames, he would be running in this unfriendly district.

Old 4th=

http://upload.wikimedia.org/wi…

New 4th (green)

The new 4th is now a district that a new Democrat can get elected in or a new Republican, but no incumbent Republican can run in the 4th because none lives there.  This will make a Democratic-leaning swing seat.

Old 5th=

http://upload.wikimedia.org/wi…

New 5th= haha, there is no one.  Iowa’s losing it in 2012.

IN-Gov: Bayh Won’t Run

Via the Fix:

Indiana Democratic Sen. Evan Bayh has decided against a run for governor in 2012, robbing Democrats of their top recruit in the Hoosier State.

“After careful consideration, I have concluded that the appropriate decision is not to be a candidate for governor of Indiana in 2012,” Bayh said in a statement released to the Fix. “”The principle reason for my decision is the welfare of my twin sons.”

Bayh’s decision leaves the Democratic field wide open. Reps. Brad Ellsworth and Baron Hill, both of whom lost races this fall, are likely to consider the Bayh-less contest. Others mentioned include Rep. Joe Donnelly, Evansville Mayor Jonathan Weinzapfel and former state House Speaker John Gregg.

Maryland Redistricting: 7-1 Democratic

Cross posted on Daily kos  http://www.dailykos.com/story/…

and my blog http://frogandturtle.blogspot…. which you should visit for more redistrcting maps and election analysis.

Like in 2001, Democrats hold the trifecta in Maryland again. This means that not only do they control the Governorship, they also control both houses of the state legislature. In 2001, the congressional delegation was 4-4 but Democrats redrew the maps to make a favorable Democratic map that accomplished its goal of removing 2 of the 4 Republican representatives. After 2002, there were no party changes until 2008 when Frank Kratovli (D) ran in the 1st district which contains conservative Baltimore suburbs and the Eastern Shore. He barely won against an extremist candidate. Unfortunately for the Democrats, he lost in 2010 by 13 points. Therefore, the delegation has returned to its original 6-2 Democrats. Maryland has turned more blue though since 2002 due to more African Americans moving into Prince Georges and Charles Counties. Also, Hispanics, Asians and white liberals are moving into Montgomery County and even Frederick County. The Baltimore suburbs are actually trending Republican but that’s a different post for a different day.  

Still, with Maryland trending Democratic overall, it is now possible to construct a 7-1 Democratic map. I have even seen some 8-0 Democratic maps but some districts are too shaky and can result in a dummymander when Republicans are able to pick up 1,2 or even 3 of those seats. I chose to draw a 7-1 map because I think it is close to what the state legislature will draw. While drawing the map, I made sure the 4th and 7th districts remained majority African American because of the VRA requiring 2 African American majority districts. While drawing the map, I made sure no district except for the Republican 6th fell below 54% Obama. Also, I made sure 6 of the districts were at least 58% for Obama. This map should protect all the Democratic incumbents, one Republican incumbent and create a new district that leans Democratic. Now here is Maryland’s current map:

Maryland’s current map: http://www.nationalatlas.gov/p…

Maryland

             Statewide map of Maryland

Maryland’s 1st Congressional District: Andy Harris (R) (blue)

Partisan Data: Obama 137,680 54%, McCain 113,225 44%

Demographics: 23% African American, 5% Hispanic, 68% White

Old District’s Partisan Data: McCain 58%, Obama 40%

Major Cities: Annapolis, Salisbury

Status: Likely Democratic

This district makes some major changes when I moved conservative suburbs in Harford and Anne Arundel out into other districts such as the 6th and 7th while adding in Democratic Annapolis and some neighborhoods in heavily Democratic Prince Georges County and places in Anne Arundel County such as Odenton which will become more Democratic due to in migration by African Americans. Harris’s base is in conservative Harford County which I removed. Frank Kratovli (D), the representative before 2010 of the 1st now has a great shot at retaking this district because of the new Democratic areas in the district. The district’s Democratic lean may be overstated due to high Obama turnout in Prince Georges County but as the areas in Anne Arundel keep getting more Democratic, they should offset any drop in turnout. Also, Kratovli tends to over perform in the Eastern Shore so with big margins in Prince Georges and Anne Arundel Counties, he should win here.

Baltimore Area

                                       Baltimore Area

Maryland’s 2nd Congressional District: Dutch Ruppersberger (D) (Green)

Partisan Data: Obama 155,376 58%, McCain 107,691 40%

Demographics: 24% African American, 68% White

Old District’s Partisan Data: Obama 60%, McCain 38%

Major Cities: Baltimore, Towson, Dundalk

Status: Safe Democratic

Ruppersberger’s district gets less convoluted by losing all of its Anne Arundel County portions and picking up swingy Towson which was originally in the 3rd district. Although the 2nd district retains some Republican suburbs around Edgemere, it still remains Democratic by picking up more Baltimore City neighborhoods. They also help balance out the loss of some heavily Democratic precincts in Randallstown. Ruppersberger should be fine here.

Maryland’s 3rd Congressional District: John Sarbanes (D) (Purple)

Partisan Data: Obama 164,297 62%, McCain 96,626 36%

Demographics: 26% African American, 8% Asian, 60% White

Old district’s partisan data: Obama 59%, McCain 39%

Major Cities: Randallstown, Columbia, Catonsville

Status: Safe Democratic

I am aware of the fact John Sarbanes does not live in this district but it still contains Democratic Columbia. The district undergoes some major changes though. It retains parts of Baltimore County but loses nearly all of Baltimore City and all of Anne Arundel County. It even picks up some Republican areas in southern Carroll County. Sarbanes is still safe though because his district picks up some heavily African American areas in west Baltimore County, bringing the African American population in the district from 16% to 26%. I am not sure the state legislature will support this district though because in their mind, it may need more of Sarbanes’s old district and they may not want to extend this into Montgomery County. Still, this is a safe district for Sarbanes.

Washington Suburbs

                                       Washington Suburbs

Maryland’s 4th Congressional District: Donna Edwards (D) (Red)

Partisan Data: Obama 212,819 88%, McCain 27,795 11%

Demographics: 54% African American, 17% Hispanic, 6% Asian, 21% White

Old District’s Partisan Data: Obama 85%, McCain 14%

Major Cities: Fort Washington, Chillum, Silver Spring

Status: Safe Democratic

The district remains VRA protected and gets even more Democratic although Edwards was more than safe here already. The district becomes smaller and loses more moderate areas in northern Montgomery County while picking up part of Wheaton in Montgomery County. I would have extended this district out into more swingy areas in Montgomery County but the 3rd district took them for population reasons. I am not sure if the legislature will send Edwards’s district to pick up some Republican areas to help protect other incumbents or make a district similar to mine.

Maryland 5th Congressional District: Steny Hoyer (D) (yellow)

Partisan Data: Obama 176,048 66%, McCain 89,006 33%

Demographics: 36% African American, 5% Hispanic, 53% White

Old District’s Partisan Data: Obama 66% McCain 33%

Major Cities: St. Charles, Bowie

Status: Safe Democratic

Hoyer’s district remains strongly Democratic although retaining Republican St. Mary’s, Calvert and Anne Arundel Counties. The Democratic votes in Charles (which is getting even more Democratic due to migration from Prince Georges County,) and Prince Georges County more than counterbalance the Republican areas. The only changes in this district are the addition of Fairland in Montgomery County which leans Democratic and the switching around of some Prince Georges County precincts. Hoyer should be happy with his new district.

West Maryland

                                        West Maryland

Maryland’s 6th Congressional District: Roscoe Bartlett (D) Teal

Partisan Data: Obama 105,718 36%, McCain 183,765 62%

Demographics: 5% African American, 90% White

Old District’s Partisan Data: Obama 40% McCain 58%

Major Cities: Hagerstown, Bel Air, Cumberland

Status: Safe Republican

This district contains the fast growing red Baltimore suburbs, the D.C suburbs that lean Republican and the older communities in the Appalachian Mountains. At a first glance, it appears that the lines do not change much. Actually, they do change a bit and these changes make the district more Republican by removing most of Frederick which leans Democratic. The district loses a bit of Carroll County to the 3rd district but picks up some conservative Harford County suburbs from the old 1st district. The location affects Bartlett who lives in Frederick (which is mostly in the 8th on this map) but since the new 6th district is so similar to the old one, he will probably run there and win easily (unless Republicans try to teabag him which is possible.)

Maryland’s 7th Congressional District: Elijah Cummings (D) Gray

Partisan Data: Obama 193,995 70%, McCain 77,987 28%

Demographics: African American 50%, White 43%

Old District’s Partisan Data: Obama 79% McCain 20%

Major Cities: Baltimore, Glen Burnie, South Gate

Status: Safe Democratic

Although the 7th district still is anchored in Baltimore, it swings off in a different direction now. Instead of heading through west Balitmore County to west Howard County, the 7th district heads south into the conservative Anne Arundel County suburbs. It picks up Republican areas such as Glen Burnie which were formerly in the 1st district when it was very Republican. Although there are some precincts there that voted as high as 70% for McCain, precincts in Baltimore City that voted as high as 99% for Obama make this district heavily Democratic. The 50% African American population is a bit low for a VRA district but it should work because almost all of the Democratic primary voters are Democratic. Also, a 70% Obama district is way too high for any Republican to win, even in a good year.

Maryland’s 8th Congressional District: Chris Van Hollen (D) light purple

Partisan Data: Obama 173,125 69%, McCain 74,721 30%

Demographics: 12% African American, 14% Hispanic, 13% Asian, 59% White

Old District’s Partisan Data: Obama 74% McCain 25%

Major Cities: Bethesda, Frederick, Gaithersburg, Rockville

Status: Safe Democratic

This district gets a bit more Republican. I removed Wheaton from the district as well as the heavily Democratic small part of Prince Georges County which helped Van Hollen beat Connie Morella (R) in 2002. Also, Van Hollen’s district heads out into Republican leaning Frederick County but takes up the parts that lean Democratic such as the City of Frederick. These changes bring down the Obama percentage from 74% to 69%. Van Hollen will probably want a safer district but Montgomery County has grown much more Democratic since the 90’s when it elected Morella. Frederick County is getting more Democratic too so Van Hollen should have no problems.  

By what margin will Bob Shamansky win?

View Results

Loading ... Loading ...

Disincumbenting Illinois: A Democratic Redistricting Plan

This diary presents an 18-seat map for Illinois. Illinois is a particularly difficult state for me to get my head around politically, so in this diary I am  going to highlight a particular strategic approach to redistricting. I’m calling it “disincumbenting” — I don’t think I’ve encountered an existing term of  art anywhere that covers quite the same ground.

The basic idea of disincumbenting is to make the new districts as unlike the current districts as possible. Doing so reduces the value of incumbency (hence  the name) by reducing the number of constituents who are familiar with the incumbent representative.

Illinois strikes me as a particularly fertile environment for the technique, because the party out of power on the state level has a large number of  contiguous seats. The Democrats have unified control over the line-drawing. In the most recent election, they lost four outstate districts, resulting in the Republicans controlling every non-Cook-County-based district except for Jerry Costello’s 12th district in the far southwest. (The Republicans also control  the Cook-County-based 9th.) With so much adjacent territory under the control of the opposition party, it is fairly easy to draw new lines that wreak havoc  on the political bases of each incumbent.

As I said above, I find it difficult to get my head around Illinois’ politics. This is because recent elections have been so very unrepresentative. 2010 was a Republican wave year. 2008 was a Democratic one, compounded by Obama’s favored son status. Blagojevich’s election numbers are impacted by the presence of a  significant Green candidacy. And so on. I tried to design the new districts so as to maximize the number of “Democratic opportunity” districts outside of  Cook County as best I could, but these districts aren’t as numbers-based as I would like. I welcome any feedback from those who know Illinois better.

Aside from the goals of disincumbenting Republican incumbents and maximizing Democratic chances outstate, I had two other, inter-related goals: create a second Hispanic majority seat in cook County, thereby eliminating Lipinski’s district. In a previous diary, I had created a second Hispanic seat by (inadvertantly) messing with Quigley. Geoneb suggested that Lipinski should be the target instead, so here’s a plan that does that. These two goals have an unintended spillover effect of somewhat disincumbenting the Chicago Democratic representatives. If resistance from the Democratic incumbents proves too great, these two goals could be abandoned.

To demonstrate the disincumbenting strategy, in my district descriptions I’m making use of silverspring’s Territory Transfer Percentage (TTP), introduced here. TTP is the percentage of the new district’s population that was part of the old district. My impression is that Silverspring introduced it with the general intent of keeping TTPs relatively high. Because of the set of goals I applied to the creation of this map, I’m actually trying to keep TTPs low (at least in the Republican districts.)

Pictures and descriptions of the plan start after the jump.

Overview Map
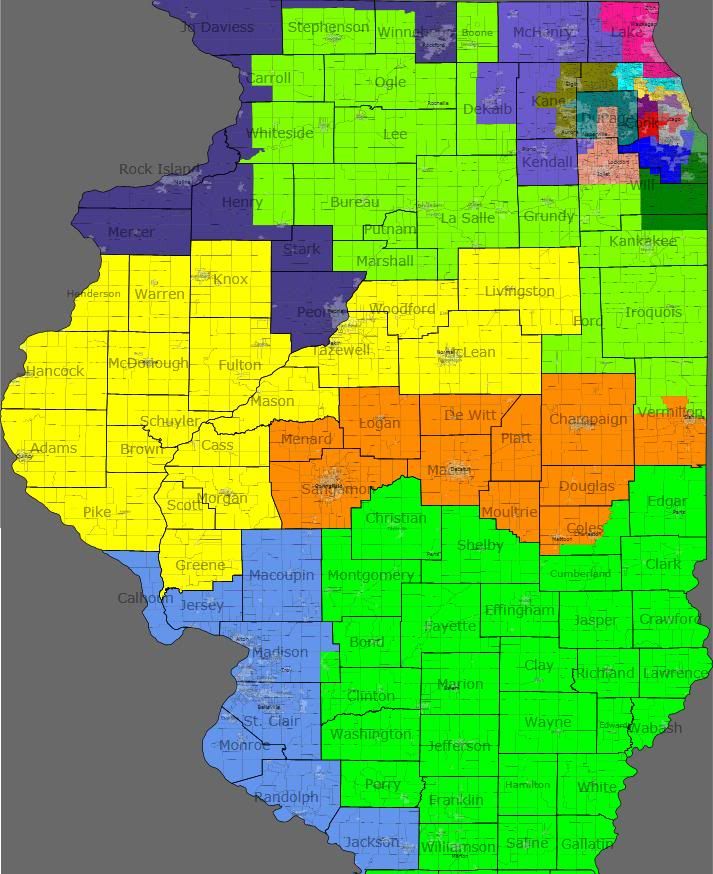
Note that the 16th is (roughly speaking) the seat lost through reapportionment. I relocated it south to cover for the missing number 19.

Chicagoland Map
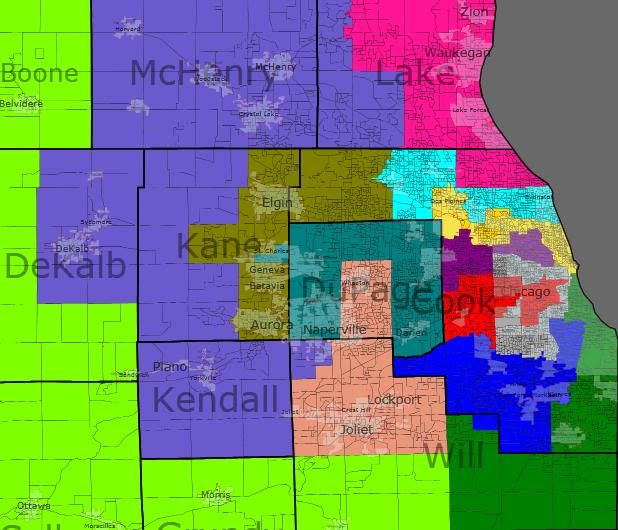
District-By-District

Given the strategy I’m following here, I’m presenting the old/new maps for each district. The pink outline is the old district. The green squiggles represent the new district.

Democratic Held Seats

My intention was that all of these seats would remain solidly Democratic. In the absence of sound numbers though, I’m slightly worried about the 9th. (And, I guess, the 12th — but I think I actually improved the 12th’s Democratic performance.)

District 1 — Bobby Rush (D)

VRA: B 53% W 35%

TTP: 49%
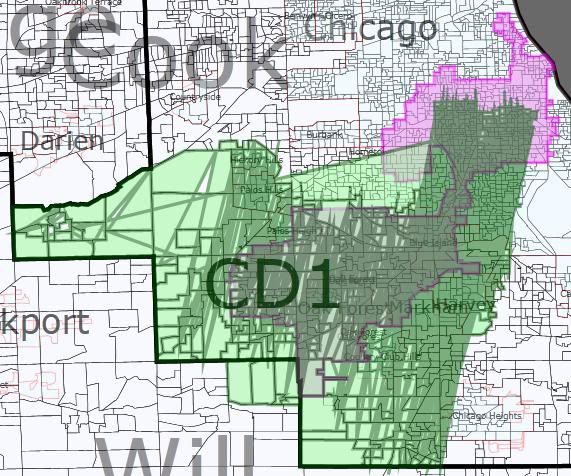
Rush’s district slides south somewhat, expanding into parts of what is currently the 2nd and 13th. I’m not sure if Rush still lives in this version of the district. Wikipedia says he used to represent the 2nd Ward. If he still lives there, it’s a relatively easy fix to swap some territory with the 2nd while keeping both majority African American.

District 2 — Jesse Jackson, Jr (D)

VRA: B 54% W 32% H 11%

TTP: 56%
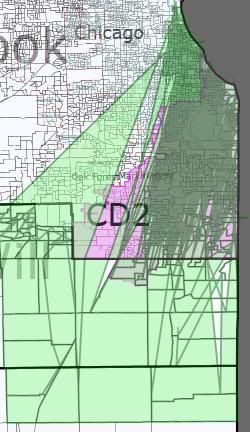
Jackson’s district narrows slightly to expand significantly to the north and south. Again, I’m not sure if Jackson lives here, but his wife represents the 7th Ward, so I think he probably does.

District 3 — Open Seat (D)

VRA: H 52%, W 34%

TTP: 2%
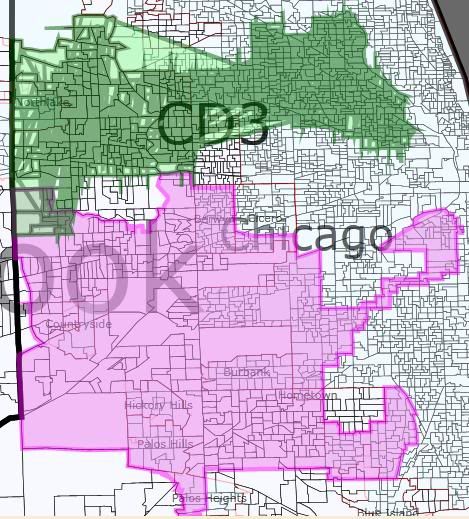
[Update: Per sapelcovits in the comments, my description of the ethnic background for the 3rd and 4th are flipped. This is Guiterrez’s district. It’s the 4th that’s open.]

This was Lipinski’s district, now almost entirely relocated to become a second Hispanic majority district. (The old district is split roughly evenly between the new 4th and 7th, both of which are still majority-minority.) My understanding is that the Hispanic population here is largely Mexican, so voting participation rates might not be enough to elect a Hispanic representative.

District 4 — Luis Guiterrez (D)

VRA: H 58%, W 35%

TTP: 51%
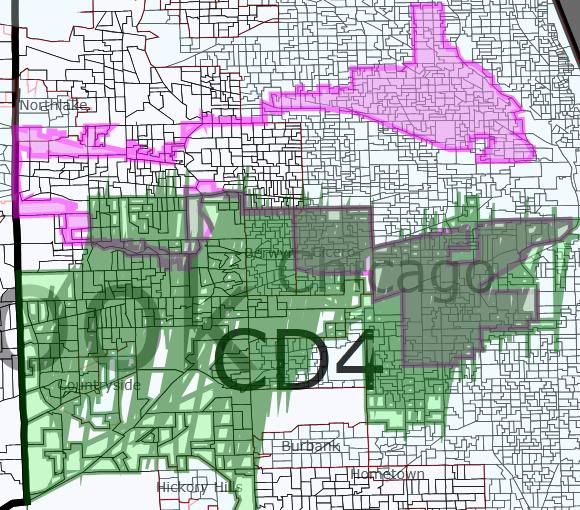
Guiterrez’s seat now takes in only the southern half of his old district (along with a good part of the old 3rd). My understanding is that the Hispanic population here is largely Puerto Rican (and therefore US citizens), so this district should pass VRA muster.

District 5 — Mike Quigley (D)

VRA: W 68%, H 15%

TTP: 53%
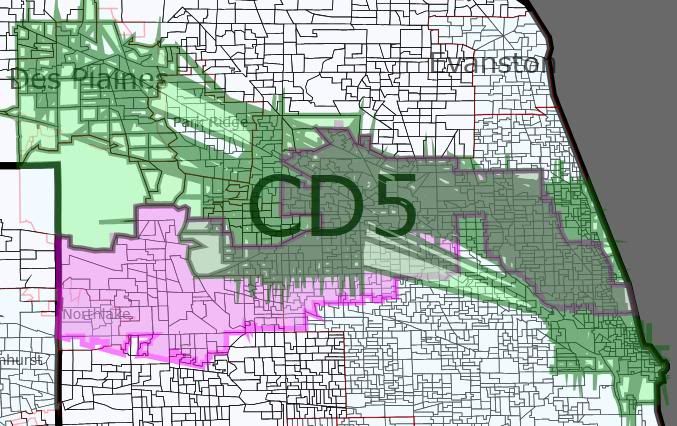
Quigley’s seat shifts northwest on its western end, now taking in Des Plaines instead of Northlake. I believe he should still live in the district; if not, the territory swap needed to make it happen shouldn’t be too difficult.

District 7 — Danny Davis (D)

VRA: B 50% W 34% H 11%

TTP: 50%
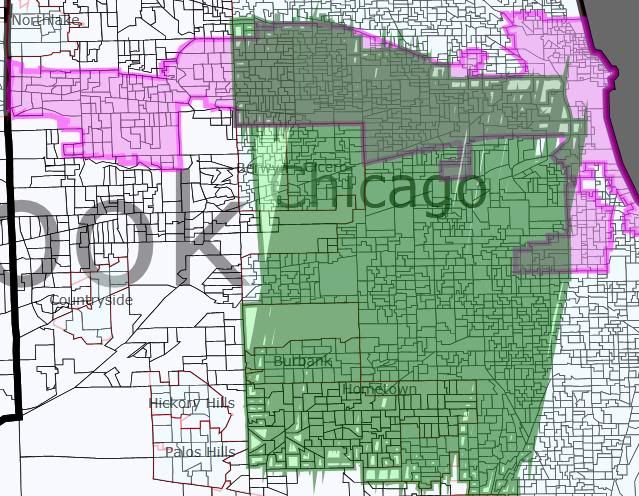
Sadly one of the less informative old/new maps. You might need to refer back to Chicagoland overview. Davis’s seat lurches south radically as part of the dismemberment of the old 3rd. The 29th Ward that he used to represent is still in the district, so I assume he is too. If 50% is too low an African-American percentage, some territory swaps with the 1st and/or 2nd could probably be arranged.

District 9 — Jan Schakowsky (D)

VRA: W 62% H 15% A 14%

TTP: 60%
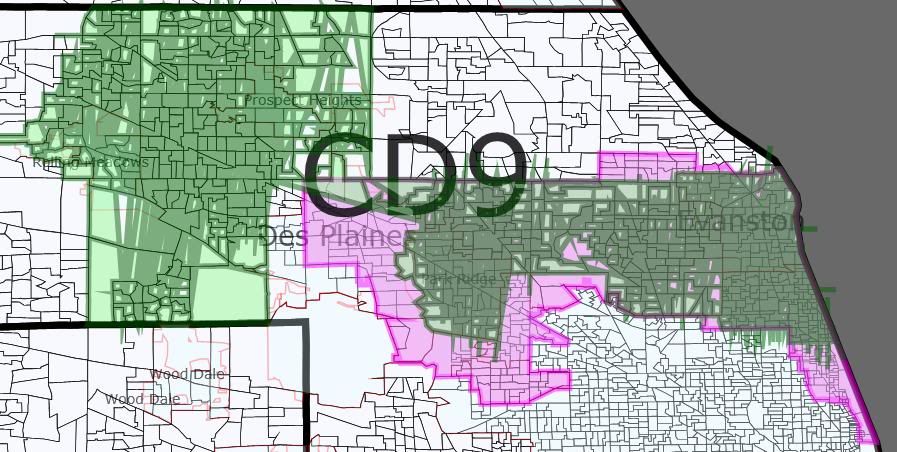
Schakowsky’s district stretchs significantly further west now. This is the only Democratic-held district I’m concerned about whether I weakened it significantly. Perhaps she and Quigley could swap Elk Grove for Des Plaines? (Is that even an improvement for her?)

District 12 — Jerry Costello (D)

VRA: W 80%, B 15%

TTP: 71%
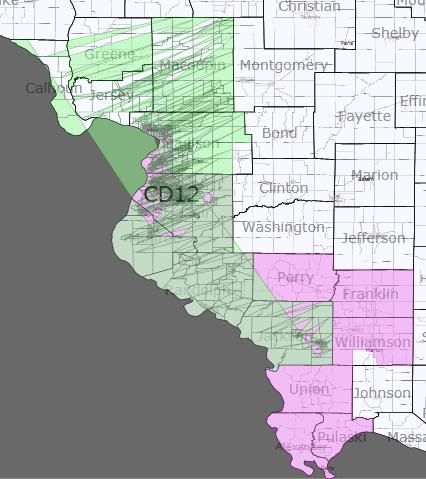
Costello’s district shifts north, and in doing so becomes more Democratic (I think.) One danger: I’ve technically drawn Shimkus into this district, but I’m assuming he’d run in what is now the neighboring 16th. I don’t think Shimkus is a problem (71% TTP for Costello!), but if he is, he could be drawn into the 16th properly. But I’m guessing that would require decreasing the 12th’s Democratic performance.

Republican Held Seats

Now the fun begins! Republicans, please met your new districts.

I have no firm idea what the Democrat’s chances in any of these districts are. I’m hoping that disincumbenting the Chicago suburban Republicans will make them vulnerable. Outstate from Chicagoland, I think I created two new districts that are at least competitive for the Democrats.

District 6 — Judy Biggert (R) vs Randy Hultgren (R)

VRA: W 71% H 14% A 10%

TTP: 55%
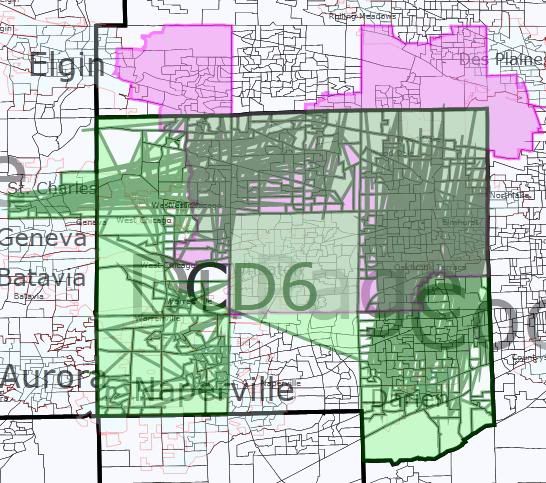
While remaining DuPage-based, the 6th now pairs the residences of two incumbent Republicans — neither of whom are the incumbent in the 6th! Its upside-down U-shape is to keep incumbent Peter Roskam’s hometown of Wheaton out of the district. The listed TTP is if Roskam ran here anyway. If Biggert ran here, her TTP would be 34%; for Hultgren, 11%.

District 8 — Joe Walsh (R)

VRA: W 82%, H 11%

TTP: 35%
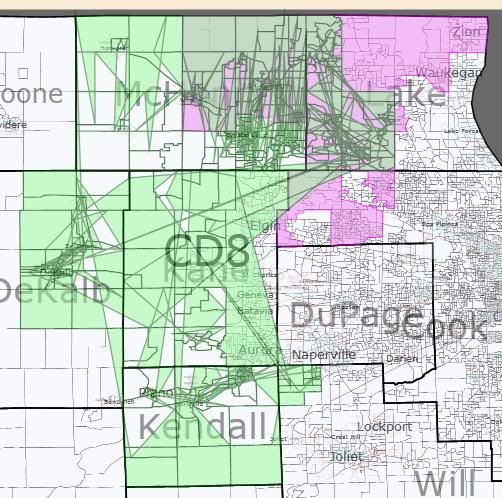
No longer stretching to Lake Michigan, Walsh’s seat now heads south into eastern Dekalb, western Kane, and Kendall Counties. Sadly, I suspect that this territory as at least as favorable to Walsh as his current one. Walsh would have nearly the same TTP if he ran in the new 10th at 30%. Representatives Manzullo and Hultgren would be at 28% and 29%, respectively, if they ran here — despite, you know, not living here.

As a side note, I believe Bean lives in my new 14th.

District 10 — Bob Dold (R)

VRA: W 67%, H 19%

TTP: 68%
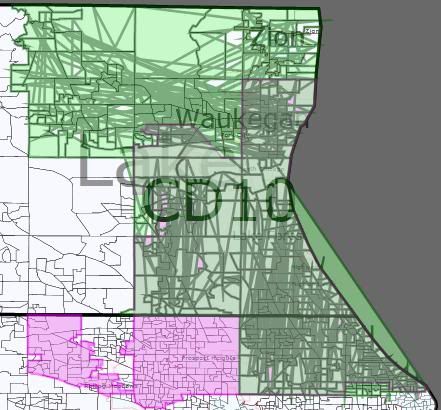
The GOP district I most failed to disrupt. Any suggestions on what I can do with this?

District 11 — Don Manzullo (R) vs Adam Kinzinger (R)

VRA: W 86%

TTP: 46%
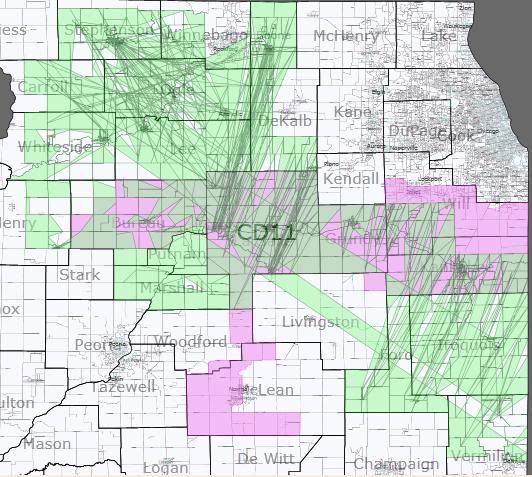
Contains parts of no fewer than 6 current districts. The TTP listed is for Kinzinger, the incumbent by district number and by largest TTP. Manzullo’s TTP is 28%. I’m pretty sure that this is a Republican vote sink. I do feel like I’m wasting LaSalle County, though, which I understand to be a reliable source of Democrats votes. Maybe there’s a better way to draw this vis-a-vis the 8th?

District 13 — Peter Roskam (R)

VRA: W 68%, H 15%, B 10%

TTP: 50%
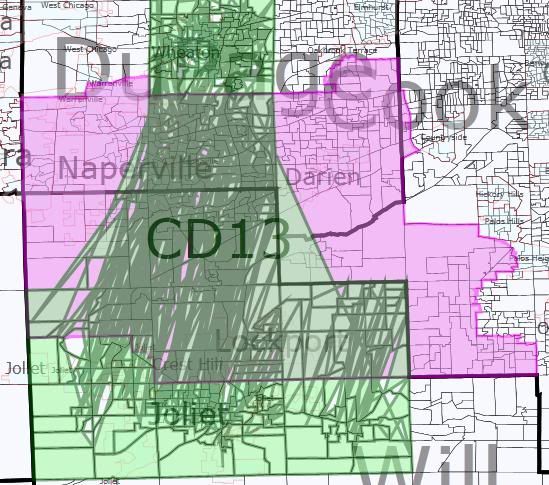
Biggert’s old district now stretches from Wheaton to Joliet. She no longer lives here (Roskam does), but the TTP listed is hers. If Roskam run here, his TTP would only be 17%; Kinzinger would have a TTP of 34%.

District 14 — Open Seat (R?)

VRA: W 62%, H 25%

TTP: 61%
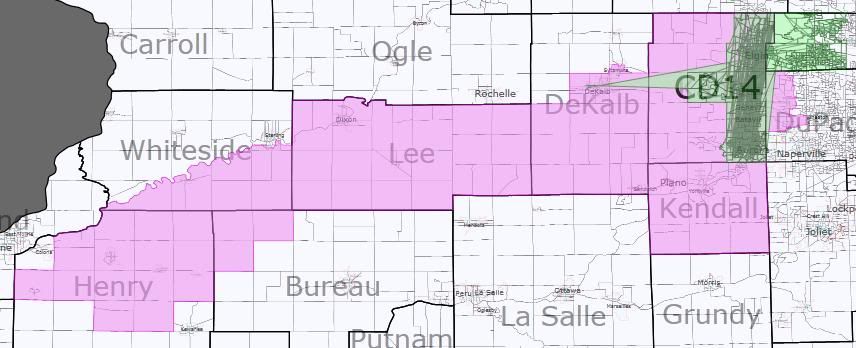
Compacts immensely — no longer stretching out towards the Quad Cities, it is now limited to eastern Kane and far northwestern Cook. This is technically an open seat, since Hultgren lives in the neighboring 6th, although the TTP is his. I believe that both Foster and Bean live in this district. Walsh would have a TTP of 23%. It’s not as disincumbented as I was hoping for — any suggestions?

District 15 — Tim Johnson (R)

VRA: W 83%, B 10%

TTP: 54%
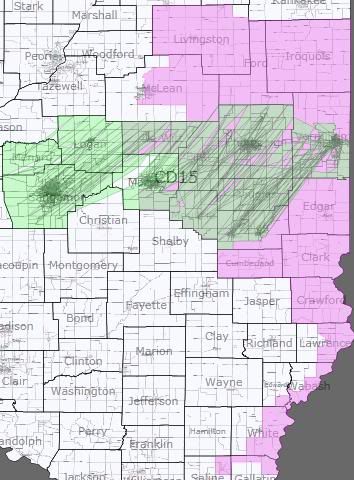
Switches orientations from north-south to east-west, dropping rural areas to pick up Decatur and Springfield. The Springfield area seems to be unusually Republican-friendly for a state capital, so I don’t think this hurts him as much as might be hoped. Nonetheless, this is one of the three districts outstate that I consider a potential D pick-up. Schock’s TTP is 22%, Schilling’s is 17%.

District 16 — Open Seat (R)

VRA: W 93%

TTP:  60%

Entirely relocated from the northwest to the southeast, where it takes over for the reapportioned-away 19th. (This also results in no old/new picture, since the number changes — you’ll have to scroll up to the overview.) Although technically an open seat, I assume that Shimkus would run here; the TTP is his. Johnson’s TTP is 21%; Costello’s is 14%. The second of the downstate Republican vote sinks.

District 17 — Aaron Schock (R) vs Bobby Schilling (R)

VRA: W 78%, B 11%

TTP: 45%
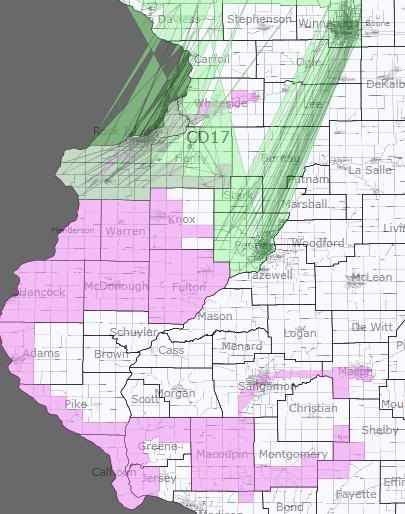
Of the Republican-held seats, this is the one I most strongly suspect would flip Democratic under my plan. A succesor in spirit, if not in form, to the current 17th. It strings together Rockford, the Quad Cities, and Peoria. The TTP listed is actually Manzullo’s, who doesn’t live in the district. Schock’s TTP is 26%; Schilling’s is 25%.

District 18 — Open Seat (R)

VRA: W 91%

TTP: 38%
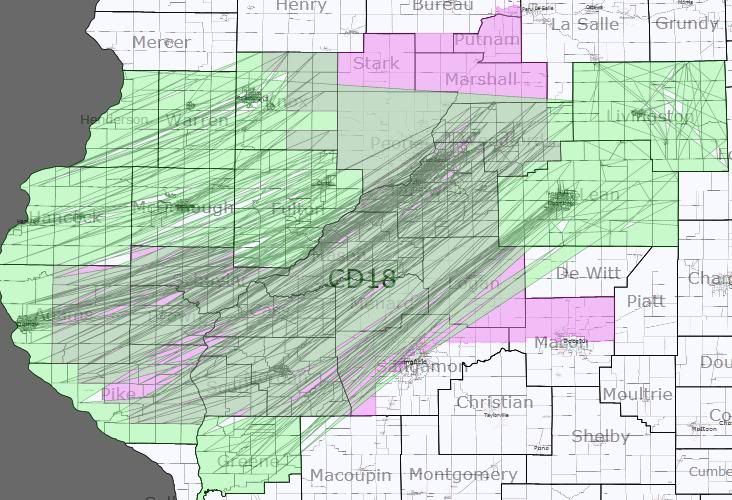
Drops Peoria County and the northern suburbs of Springfield to pick up Bloomington-Normal. This is my third and last Republican vote sink. The listed TTP is Schock, the closest this district (which covers parts of five current ones) comes to an incumbent. Schilling’s TTP is 32%; Johnson’s is 15%; Kinzinger’s is 14%.

Summary

With the caveat again that Illinois is a hard state for me to judge, I think that this map averages around a 12-6 Democratic advantage. Best case scenario: 15-3. Worse case scenario: 8-10 (ie, the status quo, minus one Republican from reapportionment.)

Again, the goals for this map were to demonstrate two things: a possible way to disincumbent the Republicans by making their districts as different as possible from the current set-up and a possible way to swap out Lipinski for a new Hispanic representative. I remain curious about what people who actually understand Illinois think about my plan.
MI-Sen: Stabenow Leads, But Looks Shaky

Public Policy Polling (12/3-6, Michigan voters, no trendlines)

Debbie Stabenow (D-inc): 49

John Engler (R): 42

Undecided: 9

Debbie Stabenow (D-inc): 45

Pete Hoekstra (R): 44

Undecided: 11

Debbie Stabenow (D-inc): 45

Terri Lynn Land (R): 41

Undecided: 14

Debbie Stabenow (D-inc): 47

Tim Leuliette (R): 30

Undecided: 24

Debbie Stabenow (D-inc): 43

Candice Miller (R): 41

Undecided: 15

MoE: ±2.8%

PPP’s first look at 2012’s Michigan Senate race may surprise some people, as this race isn’t one that gets mentioned in the same context as the main trio of troublesome races for the Dems this cycle (Montana, Missouri, and Virginia), yet the numbers here look more similar to those races than the ones that are shaping up to be pretty safe, like Minnesota. I’m not entirely surprised, though, as PPP’s previous approval scorings have placed Debbie Stabenow near the bottom of the Senators up for re-election in 2012, and that seems to show up here again, with middling 41/40 approvals and not breaking 50% against any of her opponents.

Interestingly, the person I’d thought would be the strongest opposition for her, three-term ex-Gov. John Engler (about whom there had been vague rumblings last year about a run), fares worse than most other GOPers. It’s not as if people have forgotten him; he’s still only 9% unknown, it’s just that people remember him and don’t like him (33/45)! It may be a Tommy Thompson-style problem, where a fresh face is more compelling than the old hand that everyone initially feared. The closest race is with Rep. Peter Hoekstra, who’s probably top of mind right now because he ran statewide, narrowly losing the GOP gubernatorial primary… but the polarizing Hoekstra is much less liked (28/31) than some of the other options that may have more upside for the GOP (Rep. Candice Miller and SoS Terri Lynn Land, both at 36/21, although I haven’t heard any mention of Miller or Land’s names being floated for this race).

(I don’t think there will be a digest today, partly because of time concerns, partly because of sheer lack of compelling news, so feel free to use the comments here for off-topic discussion today.)

Rank of Obama challengers

This diary will be not as long as others, but can be interesting too.

I see the polls about the republican primary (without include results for all the voters or independents) and I make this rank.

I think this way for separe the candidates give so logical results.

Leading some poll:

01 M Romney 20

02 M Huckabee 11

03 S Palin 9

04 N Gingrich 1

05 C Christie 1

2nd in some poll:

3rd in some poll:

06 D Cheney 1

07 J McCain 1

08 B Jindal 1

4th in some poll:

09 S Brown 1

10 J Bush 1

11 T Pawlenty 1

12 R Paul 1

13 R Giuliani 1

5th in some poll:

14 L Alexander 1

15 C Crist 1

16 H Barbour 1

6th in some poll:

17 M Daniels 5

18 J Thune 2

19 R Santorum 1

20 R Perry 1

21 M Sanford 1

22 M Pence 1

Worse results:

23 G Bush

24 J Bolton

25 M Rubio

26 F Thompson

27 J Ensign

28 J Cornyn

29 J DeMint

30 B Corker

31 G Pataki

32 G Johnson

33 J Huntsman

34 B McDonnell

35 J Brewer

36 P Ryan

37 E Cantor

38 L Fortuño

39 D Petraeus

40 M Bloomberg

41 J Arpaio

41 B Gates

42 W Buffett

43 D Trump

44 A Mulally

45 C Norris

46 C Eastwood

47 T Selleck

48 B Marceaux

49 J Greenspon

50 F Krager

51 H Cain

52 G Sinise

The first number would be the post in the rank the second number mean the number of polls when the potential candidate get his best place. As example M Ronmey is the leader in 20 polls, M Daniels is 6th (his best place) in 5 polls.

I a emphasize the people unelectable in a republican primary cause of different reasons.

Between all these potential candidates (and some other options included in polls face to face against Obama, only M Romney, M Huckabee and N Gingrich appear leading Obama in some poll, very few, except for a rare poll of Newsmax/SurveyUSA the last election day what gives to Bill Gates, Warren Buffett and David Petraeus strong leads over Obama as republicans.

SSP Daily Digest: 12/9

AK-Sen: Tomorrow is now the expected date for the ruling from a state superior court judge on Joe Miller’s suit contesting 8,000 ballots (over spelling) and also alleging various instances of voter fraud. There’s an injunction in place that keeps the race from being certified until this case (which started in federal court and got moved) has been decided, although the judge is conceding that whatever he decides, it’s likely to get immediately appealed to the Alaska Supreme Court.

News also comes today that Joe Miller wound up finishing the Alaska Senate race with over $900K still in hand, an outrageous sum given how cheap the Alaska media market is. Much of that was intended to go toward post-game legal expenses, and some of that may have been the same problem that plagued other teabagger fundraising dynamos (like Christine O’Donnell and Sharron Angle), of not being able to find any ad slots to spend the money. Also worth a read: a wrapup over at Daily Kos from the Scott McAdams campaign’s media guy, especially his recounting of the adventure he went through to find the Incredible Hulk tie that appeared in McAdams’ TV spot. Finally, we’ll let Kagro X get the last word in on the state of the Alaska race:

Joe Miller keeps fighting on, like a 90 year old Japanese commando on a forgotten island…

FL-Sen: The Florida GOP primary is looking like it’s going to be a very crowded affair after all: Adam Hasner, the former state House majority leader, has suddenly bubbled up over the last few days as a possible if not likely candidate. If the name sounds familiar, he considered and decided against a run in FL-22 this year; he’s one of the few Republicans from the Gold Coast and, in addition to being a key Marco Rubio ally, could tap quickly into Jewish Republican fundraising circles.

PA-Sen: It’s looking more and more like Bob Casey Jr.’s challenger is going to come not from the U.S. House but the ranks of the state Senate; the question, though, is which one? The newest name to surface is Kim Ward, who says she’s starting to test the waters. She’s from Westmoreland County, maybe the most conservative of the once-blue, now-swingy collar counties around Pittsburgh, giving the GOP hopes they might eat into Casey’s strong backing in SW PA.

RI-Sen: Don’t rule out soon-to-be-ex-Gov. Don Carcieri (who’d probably be the only Republican who could make this an interesting race here) from Senate race consideration. The 68-year-old two-termer says he isn’t ruling it out, but wants to take some time off before thinking about it.

VA-Sen: George Allen is definitely acting candidate-ish now; having laid down markers against possible primary challenger Corey Stewart, now he’s moving on to direct attacks on Jim Webb (who, of course, may or may not be running for re-election), over voting against the earmark ban and the horrible sin of supporting collective bargaining rights for public safety officers.

LA-Gov: Still no word on whether a strong Dem will get into the Louisiana governor’s race, but The Daily Kingfish takes a very interesting look at the field of possible challengers to Bobby Jindal, whose numbers indicate he’s popular but not bulletproof. They handicap the odds on a collection of possible challengers; interestingly, the guy they give the greatest odds to is ex-Dem John Kennedy (who presumably would take on Jindal while still wearing the “R” badge, although I guess anything’s possible in Louisiana, where party labels seem to get taken on and off like so much laundry). They also float the possibility of a Mary Landrieu run, in that she may be eager to bail out of Washington before her next re-election in 2014.

WV-Gov: With a pileup of half a dozen Dems interested in the 2012 (or 2011?) gubernatorial race, who’s running for the GOP? The Beltway rumor mill seems, this week, to have Shelly Moore Capito more interested in going for the Gov race than the Senate or staying in the House. While she’d be the undisputed heavyweight, a few other second-tier GOPers are making their interest known (although it’s unclear whether they’d bother if Capito got in). Most prominent is ex-SoS Betty Ireland, one of the few GOPers around who’s held statewide office, and who had briefly considered running for Senate this year. State Sen. Clark Barnes is the only Republican who has committed to the race so far.

CO-03, VA-11: Republican Keith Fimian, who came within a thousand votes of Gerry Connolly, is publicly saying he’s interested in another run. He wants to wait and see what the district looks like after redistricting before committing one way or the other, though. One other rematch that may or may not be on the table is Dem John Salazar in Colorado’s 3rd, who narrowly lost the reddish district to Scott Tipton and “is open” to a rematch.

House: Politico takes a quick look at the Republicans that Democrats in the House are most likely to target in 2012. I don’t think any of the names (mostly surprise victors in Dem-leaning swing districts) will surprise any devoted SSP readers: in order, they discuss Chip Cravaack, Ann Marie Buerkle, the Illinois Five (especially Bobby Schilling), Blake Farenthold, Renee Ellmers, and Allen West.

Votes: The DREAM Act passed the House today (although it looks like, so many other pieces of legislation, its next stop is a slow Senate death by neglect). It’s an interesting vote breakdown, with 38 Dems voting no (mostly Blue Dogs, and mostly ones on their way out the door) and 8 Republicans voting yes (almost all the non-white GOPers, along with the newly-liberated Bob Inglis). Most puzzling “no” vote may be Dan Lipinski, whose safe blue IL-03 is significantly Latino, and getting more so every day.

Census: This is a strange video to go viral, but I’ve been seeing lots of links to this new video from the Census Bureau today, a catchy little explanation of what reapportionment is and how it works. Also a helpful Census Bureau release today: a release schedule of all the various parts and pieces that will be necessary for the redistricting process. The big enchilada, of course, is the reapportionment breakdown, which will be released at some point before the end of the year, although they’re still not specifying which date. According to today’s release, state numbers on race (down to the block level) will be out in February, so I’m sure there’ll be flurry of activity with Dave’s Redistricting App at that point.

Let’s Redistrict Utah!

 All I know about Utah is that its Mormon and overwhelmingly Republican.  The largest city, Salt Lake, is Democratic but everything else is so Republican that the city does not have enough Democratic votes to overcome the rest of the state.  I think that there is a growing Latino population in Utah and also a growing non-Mormon population.  I also heard a while back that SLC had a surprisingly large gay population.

Utah should have actually got a 4th seat back in 2002 so a 4th seat is guaranteed for 2012.  Right now there are three districts, two are ultra-conservative Republicans and one is a conservative Democrat (Jim Matheson).  The Republicans will control everything in 2012.

There is no partisan information for redistricting on the app so all I could do was create as friendly of a district for Democrats as I could.  I knew that Summit County, to the right of Salt Lake County, for whatever reason votes Democratic.  The President won a third county, Grand County, which is in southeastern Utah.  I guess that both Summit and Grand are skiing counties?  Or perhaps they have Native American reservations.  San Juan County, in the very southeastern corner, was 51-47 McCain.  So what's up here?

Every other county was extremely Republican, often by more than 70%.

What I did was basically just make four districts – three that I knew would be very Republican and one that I made to be Democratic-friendly.  (In my map, this is the blue district.)  I have no idea if it would actually be good for the Democrats but it does put Summit County into this Salt Lake City-based district so I'm thinking this can only help.  Of course, the Republicans know about Summit County and they'll most likely put it into a Republican district.

It looks like that Republicans will succeed in making four districts that went for McCain in 2008 and this will likely help them when the President is up for reelection in 2012.  My prediction is a 3-1 Republican delegation in 2012, with a new Republican 4th district, but Jim Matheson may very well lose in 2012 if he is given a very different district.

It's a rather depressing map for Democrats, but it is one of the states that will gain a seat so I thought it was important to do.

My Map

2008 CNN Statewide County Results for Utah

(Links will open in new window.)