SSP Daily Digest: 12/8

CT-Sen: Following his loss in the CT-Gov primary after leading the polls almost all the way, I hadn’t heard much discussion about Ned Lamont making a repeat run against Joe Lieberman for the 2012 Senate race. Lamont confirms that, saying he’s “strongly disinclined” to try again.

FL-Sen: Here’s a dilemma for temp Sen. George LeMieux, as he gave his farewell speech from the Senate floor. Acknowledge the man without whom he’d be utterly unknown and thus not in a position to run again for Senate in 2012… or invoke said man, whose name is utterly mud in Florida GOP circles, thus reminding everyone of those connections that can only hurt in a 2012 primary? In the end, basic human decency prevailed, and LeMieux thanked Charlie Crist for appointing him.

ME-Sen: This is pretty big news, as everyone has been treating newly-elected Gov. Paul LePage’s imprimatur as a make or break for Olympia Snowe’s hopes in a GOP primary in 2012. LePage, of course, was the tea party choice in the primary, and his say-so would go a long way toward either encouraging or discouraging a teabagger challenge to Snowe. LePage just came out with a statement of support for Snowe in the primary, saying he’d back her in the face of a possible primary challenge.

MO-Sen: Sarah Steelman continues to rack up support from the GOP’s far-right, as she girds for a possible GOP primary showdown against ex-Sen. Jim Talent. Steelman met with Jim DeMint, the Senate’s de facto kingmaker of the tea party set, and those involved expect DeMint’s Senate Conservative Fund to back Steelman shortly (which would be his first endorsement of the 2012 cycle).

PA-Sen: Moran gets brain? Perhaps sensing the steep uphill climb of a challenge against the Casey name brand in Pennsylvania in a presidential year, random rich guy John Moran has done an about-face on a threatened possible Senate run that first emerged last week. Another central Pennsylvanian, though, state Sen. Jake Corman, seems to be interested in taking on Bob Casey Jr.

UT-Sen: In case there was any doubt about Orrin Hatch running again — in his 70s and facing a likely difficult primary/convention — well, he is. He released a statement this morning saying “I intend to run, and I intend to win.” That comes in the face of the formation of a new leadership PAC by Rep. Jason Chaffetz, which would likely point to stepped-up fundraising efforts in the face of a intra-party challenge. (Hatch is sitting on $2.32 million CoH, while Chaffetz has $179K. If the targeted audience isn’t all Utahns but a few thousand nuts at the state convention, though, money is less of an issue.)

IN-Gov: Soon-to-be-ex-Sen. Evan Bayh is issuing something of a timeline regarding whether or not he runs for his old job as Governor again in 2012. Bayh says he’ll make a decision by the end of the year, and is saying it’s a “possibility but [not] a probability.” (Rep. Baron Hill and Evansville mayor Jonathan Weinzapfel are other fallback options.)There’s no timeline, though, from Rep. Mike Pence, who probably would be the strongest candidate the GOP could put forth, but seems more interested in going straight for the Presidency. One GOPer who isn’t waiting for Pence’s decision is Lt. Gov. Becky Skillman, who has moved forward on fundraising although she hasn’t officially declared anything. Soon-to-be-Rep. Todd Rokita warns not to underestimate Skillman.

MN-Gov: This is kind of a moot point in view of his concession this morning, but in case you’re wondering what suddenly motivated Tom Emmer to drop his challenge to Mark Dayton and move on, this was probably the last straw: yesterday the Minnesota Supreme Court denied his petition asking for all counties to perform a reconciliation of number of voters with number of ballots cast. With the recount already done, the reconciliation would have been the only practical way of even stringing this thing out for a while longer, let alone finding an extra 9,000 votes.

MO-Gov: In marked contrast to the recent PPP poll giving Jay Nixon a clear edge, Republican Lt. Gov. Peter Kinder (now looking more like a candidate than ever) is pointing to an internal poll by American Viewpoint taken way back in late September that gives him a 47-38 lead over Nixon. The poll finds Nixon still popular, though, with 51% approval.

ND-Gov: Today was the first day on the job for North Dakota’s new Governor, ex-Lt. Gov. Jack Dalrymple, who took over as John Hoeven resigned in order to join the Senate soon. Hoeven is the first-ever North Dakota Governor to resign voluntarily. Taking over as Lt. Gov. is ex-US Attorney Drew Wrigley. Dalrymple will be watched carefully as to what happens in 2012: he could either run for election to a full term, or move over to a Senate run against Kent Conrad.

MN-08: Newly-elected Rep. Chip Cravaack will have one of the tougher re-elects of any of the new House Republicans (he’s in a D+3 district that includes the Dem stronghold of Duluth), but one of the bigger-name Dems in the district is saying he won’t be the challenger. State Sen. Tom Bakk (one of the 5,589,358,587,568,120 people who ran for the DFL gubernatorial nomination this year) is staying where he is, especially since he’s about to become minority leader.

GA-St. House: One more D-to-R party switcher to report, and it’s a fairly big name within the confines of the Georgia legislature: Doug McKillip, who was previously #2 among Democrats. Interestingly, he’s not from a dark-red rural district but represents the college town of Athens, and he says he’ll be better able to agitate for the University’s needs from within the majority… although, that, of course, would depend on getting re-elected again from that (presumably blue) district.
MA-Sen: Who Will Take On Scotty?

Public Policy Polling (11/29-12/1, registered Democrats)

Vicki Kennedy (D): 22

Barney Frank (D): 17

Mike Capuano (D): 15

Deval Patrick (D): 13

Stephen Lynch (D): 7

Ed Markey (D): 7

Tom Menino (D): 3

Tim Murray (D): 1

Undecided: 15

MoE: ±6.2%

Perhaps the better question to ask here is who didn’t PPP poll in asking Dems who they want to take on Republican incumbent Scott Brown. Ted Kennedy’s widow Vicki leads at 22, followed by the one and only Congressman Barney Frank at 17 and Boston/Cambridge Congressman (and special election primary second-place finisher) Mike Capuano at 15. Recently re-elected Governor Deval Patrick is fourth at 13, followed by two more Congressmen, Stephen Lynch and Ed Markey at 7 apiece. Boston mayor Tom Menino gets 3, while recently re-elected Lieutenant Governor Tim Murray gets 1.

The general election half of this poll has Scotty leading all the Dems, but many of our challengers remain relatively unknown quantities, with even 44% of Dems having no opinion of Capuano, 45% having no opinion of Lynch, and 36% having no opinion of Markey.

This field is still wide open…let’s just be happy Martha Coakley isn’t seeking redemption.

NY-01: Altschuler Concedes

Finally, our Long Island nightmare (and our national nightmare, given that this was the last contested House race of the cycle) is over:

New York Republican Randy Altschuler has conceded to Democratic Rep. Tim Bishop, bringing the final undecided House race of the 2010 election cycle to a close.

Altschuler, a wealthy, self-funding businessman, trailed Bishop by 263 votes late Tuesday, after a Suffolk County judge sorted through 1,000 challenged ballots.

The two campaigns were scheduled to meet in court Wednesday morning to continue sorting through ballots, but with fewer than 1,000 challenged votes left to be counted, Altschuler’s campaign determined that it could not close the gap.

“After consulting with my family and campaign staff, I am ending my campaign and offering congratulations to Congressman Tim Bishop on his victory,” Altschuler said in a statement, adding that he had decided to forego a district-wide hand recount.

MN-Gov: Emmer Will Concede

It’s Dayton time:

It’s over.

Republican Tom Emmer will concede the 2010 Minnesota governor’s race this morning to Democrat Mark Dayton, a Republican source with direct knowledge confirmed to the Pioneer Press.

Emmer’s 10:30 a.m. concession means he will not contest the election in court – thus averting a scenario that could have kept Republican Gov. Tim Pawlenty in office past the scheduled Jan. 3 swearing-in of the next governor, the source said.

I guess he figured that his chances at the World Court in the Hague weren’t that great.

MN-Sen: Klobuchar In Good Shape

Public Policy Polling (12/4-5, “Minnesota voters”)

Amy Klobuchar (DFL-inc): 56

Michele Bachmann (R): 39

Undecided: 4

Amy Klobuchar (DFL-inc): 54

Norm Coleman (R): 40

Undecided: 6

Amy Klobuchar (DFL-inc): 56

Tom Emmer (R): 38

Undecided: 6

Amy Klobuchar (DFL-inc): 53

Tim Pawlenty (R): 43

Undecided: 4

Amy Klobuchar (DFL-inc):: 52

Erik Paulsen (R): 34

Undecided: 14

MoE: ±3.2%

PPP’s latest has DFL incumbent Amy Klobuchar doing extraordinarily well a little less than two years out, besting all five GOP challengers by spreads of 10 to 18 points.

Klobuchar remains extremely popular, with approval ratings in almost unseen territory of +30, at 59/29! Her Class II counterpart, Al Franken, is barely above water at 45/42.

Also of note, Tom Emmer’s gubernatorial campaign (and potential post-election monkey business) have not reflected on him well, he records favorables at 37/49…almost as bad as tea party queen Bachmann’s 37/51.

36-0 Texas

The hardest thing for me to remember when making GOP friendly gerrymanders is that a 50% John MctCain district isn’t a toss-up but a likely R district, similar in theory to a 60% Obama District. 5 points more friendly to the gop then the nation as an average implies that, but it is somewhat tricky for me, at least, to wrap my mind around it. However, that was my goal when I started North Carolina: create as many districts that went GOP in 08 as possible. After getting an 11-2 in a state that went for Obama, i figured a 36-0 in Texas was possible. and it was. One district voted for Obama by less than 1000 votes, so I’m going to count it. A 59% Obama district would be okay for most of us here… Without further ado, MAPS!

As always, ask me and i will provide a zoomed in map of whatever area you wish if it isn’t clear from the big one.

http://img.photobucket.com/alb…

http://img.photobucket.com/alb…

El Paso: http://img.photobucket.com/alb…

District 1 (Blue):  Mccain 56%, 56% Hispanic

El Paso and Odessa

District 2 (Green): M 53%, 63% H

Rest of El Paso and some nearby counties

San Antonio and Austin: http://img.photobucket.com/alb…

District 3 (Purple): M 50%, 60% H

South San Antonio

District 4 (Red): M 51%, 50% H

North and West Antonio

District 5 (Yellow):  M 51%, 40% H, 10% Black, 3% Asian

East and North San Antonio

District 6 (Teal): M 50%, 72% H

Laredo and some Border counties, then up to West Texas

District 7 (Gray): M 50%, 66% H

McAllen and Border areas all the way up to Bastrop and Fayette Counties

District 8(Violet) M 51%, 62% H

Brownsville, Mcallen and then up.

District 9(Sky Blue): M 51%, 59%  H

Brownsville, Harlingen, up to Williamson and Milam counties.

District 10 (Pink):  M 50%, 35% H, 16% B, 3% A

Corpus Christi and up

Houston:  http://img.photobucket.com/alb…

District 11 (Lemon-Lime Green): M 55%,  55% White

South of  Houston

District 12 (Blue-Line Green) :  M 56%, 22% H, 20% H, 11% A

Some of the south-west of Houston and then surroundin areas.

District 13(Light Brown): M 53%, W 52%

Houston and some areas north

District 14(Gold):  M 57%,  W 61%

Houston and some areas north

District 15 (Orange): M 52%, 32% H, 19% B, 4% A

South of Houston, with a bit of the city

District 16(Lime Green):  M 52%, 39% H, 12% B, 4% A

Houston and Areas East

District 17(Navy blue): M 52%, 41% H,  16% B

Houston and Areas North East

District 18 (Golden Yellow):  M 56%, 56% W

North of Houston

District 19 (Puke Green): M 56%, 65% W

Wraps around 11-17

District 20 (Light Pink): M 52%, 59% W

Wraps around Austin and takes part of the city then to Abilene

District 21 (Blood Red): M 54%, 66% W

Parts  of Austin then  going to sparsely populated Northern Texas

District 22 (Poo Brown):  M 51%, 79% W

Austin and North Texas

Dallas-FW: http://img.photobucket.com/alb…

District 23 (Robin’s Egg Blue): M 54%, 57% W

Dallas and some northern suburbs

District 24 (Dark Purple):  M 56%, 59% W

Dallas and Some Eastern areas

District 25 (Rose): M 54%,  59% W

Dallas then to some less populated eastern areas

District 26 (Silver) M 58%,   54% W

Dallas, FW, then to North Texas

District 27 (Sea Green) M 49%, 54% W

Dallas, FW, then to North Texas

District 28 (Pinkish Purple) M 60%, 57% W

Irving, then up to North Texas

District 29 (Gray Green): M 53%, 60% W

Waco and Forth Worth

District 30 (slightly lighter shade of rose then

the one touching it): M 55%, 60% W

Parts of Arlington, Dallas and Fort Worth

District 31 (Tan): M 61%, 71% W

North Fort Worth and Dallas then North

District 32 (Red Orange): M 64%, 79% W

North FW and then northern areas surrounding it

District 33 (I can’t name that many different shades of blue): M 63%, 80% W

North of Dallas

District 34 (Somewhat dark-green): M 69%, 75% W

Wraps around a lot of other districts, filling in a lot of gaps

District 35 (Royal Purple): M 62%, 64% W

Everything Else Part 1

District 36 (Not Flyers Orange, but I’m using it anyways): M 68%, 69% W

Everything Else, Part 2

This is not a perfect 36-0 Map. The last 5-6 districts could bleed some republican voters to some of the more borderline districts. However, in an ok to good year, the republicans win all 36 seats barring an exceptional democratic candidate.

Dave’s seems to have deleted my other maps. I’ll redo them later and either edit this diary or do a new one, depending on what you guys thing.

SSP Daily Digest: 12/7

DE-Sen: Here’s an amusing look back at the Delaware race, where it turns out that Christine O’Donnell raised $7.3 million over the course of the campaign (a somewhat large improvement on her $63K from her previous Senate bid) and then proceeded to lose by 16 points. O’Donnell apparently had the same problem that I suspected that Sharron Angle did (though we don’t have any confirmation on Angle yet)… there weren’t any media outlets with available slots to pour all that late-breaking money into.

MO-Sen: Jim Talent has offered his timeline on publicly deciding whether or not to run for Senate (which has seemed to get less likely over the last few days, if you believe the scuttlebutt). He won’t decide until the New Year, and possibly won’t announce anything until the state GOP’s Lincoln Day festivities in mid-February.

MT-Sen: PPP offered some GOP Senate primary numbers, although I’m not sure how useful they are given that Marc Racicot, the former Governor and RNC chair, eats up a lion’s share despite not having really ever been associated with the race. (Although, who knows… maybe this will suddenly prompt him to get interested.) At any rate, the two guys with name rec, Racicot and Rep. Denny Rehberg, are at 40 and 37, respectively. The two little-known guys who are actually the ones running (so far), Steve Daines and Neil Livingstone, are at 5 and 4.

RI-Sen: Although John Robitaille seems to be getting all the attention in terms of the GOP’s pick to challenge Sheldon Whitehouse, Warwick mayor Scott Avedisian is still stoking the fires of vague interest. Avedisian is a moderate and an ally of newly-elected Gov. Lincoln Chafee.

WA-Sen: The race against Maria Cantwell seems to already be a casualty write-off for the GOP, seeing as how the state’s entire viable GOP bench (aka Rob McKenna) will most likely be running for Governor. The state GOP’s usual M.O. in such situations is to turn to some random rich guy as a place-holder (see Mike McGavick, Cantwell’s 2006 opponent, or oft-threatened but never-happened candidate John Stanton), but it may turn out that Clint Didier, the tea partier whose GOP primary bid against Dino Rossi didn’t go anywhere and who’s now interested in trying again, gets left holding the bag this time. Didier, who refused to endorse Rossi and castigated him at every turn, isn’t likely to be able to count on much NRSC or even state GOP goodwill this time, though.

MN-Gov: Nothing like a little post-electoral cat fud, even if it means exiling pretty much your entire pantheon of elder statesmen. The state GOP just excommunicated more than a dozen key moderate Republicans who had jumped ship to support Independence Party candidate Tom Horner in view of Tom Emmer’s extremism. These aren’t just run-of-the-mill PCO-types, either: the list includes an ex-Senator (David Durenberger) and two ex-Govs (Arne Carlson and Al Quie). And if you’re wondering how Emmer is faring in the court of public opinion amidst the recount non-drama, PPP’s out with a snap poll: by a 68-22 margin, voters think it’s time for Emmer to give up (which matches the 68-21 margin of people who think that Mark Dayton was the election’s rightful winner).

OH-17: Wondering who the third-party candidate who fared the best was, in this year’s House races? It was none other than ex-con ex-Rep. Jim Traficant, who picked up 16.1% of the vote against Tim Ryan, the best showing of any indie with both Dem and GOP opponents (and he did it without spending a penny). He fared better than Randy Wilkinson in FL-12, who ran a more credible campaign and was widely viewed as a potential spoiler. In fact, Wilkinson finished 3rd at 10.7%; some random conservative, Dan Hill, got 12% in NE-03 by running to Adrian Smith’s right, although that was a race that Dems barely contested. What about MI-01’s Glenn Wilson, who made waves for approximately one day with his pledge to spend $2 million of his own money (although it’s dubious if he spent more than a fraction of that)? He barely registered, at 7%.

WV-01: Here’s an unexpected comeback, and probably one that’s not a good idea. Alan Mollohan, who couldn’t survive a Dem primary and most likely wouldn’t have won the general even if he’d gotten over the first hurdle, is publicly expressing his interest in running in 2012 for his old seat. He’s opened an FEC account for ’12 and has been reaching out behind the scenes.

NY-St. Sen.: This is basically a Hail Mary at this point, but when it’s the chance to tie the state Senate, it’s a chance you take. Craig Johnson officially filed an appeal yesterday of the judge’s ruling certifying Jack Martins as winner in SD-7 (giving the GOP a 32-30 edge there). He’s asking for a hand count, to see if any votes were missed in the state’s switch this year to electronic voting machines. Given the recent abject fail in finding all the votes cast in Queens, it’s not out of the realm of possibility.

Redistricting: The Fix has another installment in its ongoing redistricting previews, this time focusing on Georgia. The GOP-controlled state legislature should have little trouble adding a GOP-friendly 14th seat in Atlanta’s northern tier of exurbs, where most of the state’s growth has occurred. The real question will be whether they can do anything to turf out either of the two remaining Dems in slightly lean-Dem districts in south Georgia, Sanford Bishop or John Barrow? Although neither of their seats are truly minority-majority, the VRA might be implicated if their seats get messed with too much. Bishop’s GA-02 is likely to be shored up in order to make freshman Austin Scott safer in the 8th. Barrow seems like an easier target, but to do so would not only risk VRA litigation but also make Jack Kingston’s 1st less safe, meaning incumbent protection might be the result.

Demographics: There was a massive dump of U.S. Census data yesterday, although none of it is the actual hard count from 2010 (which is due by the end of the month, including state populations for reapportionment purposes). Instead, this is the Demographic Analysis (used to estimate undercounts in the actual count, although there won’t be any adjustments made to the counts for redistricting purposes in this cycle). The big number was the total population estimate, ranging from 306 million to 313 million, with a midrange estimate of 308.5 million (which would put the average House district, for redistricting, at 709K). Also worth noting: Hispanics accounted for essentially the nation’s growth in youth population in the last decade, and Hispanics have grown from 17% of the nation’s under-20 population in 2000 to 22% now; without Hispanics, the number of young people would have actually gone down since 2000.

California Redistricting Patterns by Region

The coming redistricting in California will see two significant forces working to give the new lines.  The first is population, how it has grown and shifted since the last maps were drawn.  The second is the commission process that will follow set rules around keeping cities and counties together, compactness, communities of interest, and drawing lines without considering where candidates live.

To survey the political landscape I put together this chart showing population growth in each congressional district.  While the commission does not need to start from the existing lines, this does show the disparity in population growth among current districts.

Swing State readers should quickly realize that districts with the greatest overages are Republican.  This is seen statewide where Republican congressional seats are on average 42,000 over target population, and Democrat-held seats are 28,000 under.

Tightly packed Democratic seats like those in Los Angeles will have to geographically expand, stealing population from other neighboring Democrats to gain the requisite number of residents.  Conversely, Republican districts will be contracting as they give up voters, and could provide more opportunity to other Republicans.

Current Congressional Districts and Variation from 2010 Projected Targets

Member Residence Variation

1 Mike Thompson D St Helena Under By 19,552

2 Wally Herger R Chico Over By 23,927

3 Dan Lungren R Gold River Over By 52,873

4 Tom McClintock R Elk Grove Over By 78,971

5 Doris Matsui D Sacramento Over By 21,151

6 Lynn Woolsey D Petaluma Under By 82,302

7 George Miller D Martinez Under By 47,071

8 Nancy Pelosi D San Francisco Under By 28,457

9 Barbara Lee D Oakland Under By 47,004

10 John Garamendi D Walnut Grove Under By 4,079

11 Jerry McNerney D Pleasanton Over By 68,602

12 Jackie Speier D Hillsborough Under By 73,416

13 Pete Stark D Fremont Under By 59,603

14 Anna Eshoo D Atherton Under By 47,104

15 Mike Honda D San Jose Under By 17,541

16 Zoe Lofgren D San Jose Under By 7,756

17 Sam Farr D Carmel Under By 63,360

18 Dennis Cardoza D Merced Over By 27,745

19 George Radanovich R Mariposa Over By 49,586

20 Jim Costa D Fresno Over By 18,060

21 Devin Nunes R Tulare Over By 75,114

22 Kevin McCarthy R Bakersfield Over By 71,524

23 Lois Capps D Santa Barbara Under By 54,321

24 Elton Gallegly R Simi Valley Under By 29,472

25 Howard McKeon R Santa Clarita Over By 4,084

26 David Dreier R San Dimas Over By 10,372

27 Brad Sherman D Sherman Oaks Under By 41,458

28 Howard Berman D Los Angeles Under By 37,913

29 Adam Schiff D Burbank Under By 39,041

30 Henry Waxman D Los Angeles Under By 31,871

31 Xavier Becerra D Los Angeles Under By 55,157

32 Judy Chu D Monterey Park Under By 54,149

33 Diane Watson D Los Angeles Under By 36,444

34 Lucille Roybal-Allard D Los Angeles Under By 47,705

35 Maxine Waters D Los Angeles Under By 39,585

36 Jane Harman D Los Angeles Under By 34,005

37 Laura Richardson D Long Beach Under By 36,943

38 Grace Napolitano D Norwalk Under By 51,103

39 Linda Sanchez D Lakewood Under By 44,407

40 Ed Royce R Fullerton Under By 37,637

41 Jerry Lewis R Redlands Over By 100,829

42 Gary Miller R Diamond Bar Under By 10,593

43 Joe Baca D Rialto Over By 57,355

44 Ken Calvert R Corona Over By 191,982

45 Mary Bono Mack R Palm Springs Over By 200,712

46 Dana Rohrabacher R Huntington Beach Under By 40,074

47 Loretta Sanchez D Anaheim Under By 43,323

48 John Campbell R Irvine Over By 437

49 Darrell Issa R Vista Over By 65,129

50 Brian Bilbray R Carlsbad Over By 13,076

51 Bob Filner D San Diego Over By 7,693

52 Duncan Hunter R Lakeside Under By 25,845

53 Susan Davis D San Diego Under By 25,626

The following shows variations for congressional districts by region, however they do not match county growth perfectly as several Congressional districts overlap counties and skew the numbers.

Variation from Ideal 2010 Population, by Congressional Districts in Regions

.: Northern California +4.5% 4 districts over by 175,000, 1 under

.: San Francisco Bay -5.8% 11 districts are under by 415.000

.: Central Valley +6.9% 5 districts over by 240,000

.: Los Angeles -5.5% 13 districts under by 550,000

.: Orange County +1.4% 1 district is over, 4 are under

.: San Diego +1% 2 districts are under, 3 over

.: Inland Empire +11.4% 8 districts are over by 640,000

Regional Differences…

San Francisco Bay Area

Bay Area congressional districts have largely not kept up with statewide growth, putting them under the required population by about 4.5%.  The only exception is the Jerry McNerney district, but the growth in this district is primarily within the San Joaquin portion.  Excluding McNerney, the remaining ten districts need to expand to capture another 415,000 residents.  

Excluding the McNerney district the remaining Bay Area seats have to grow 6% on average.  This does not seem significant when looked at for an individual district where it is like adding the city of Pacifica.  However, as each district takes from the next, the impact is added up.  In the end the last district is going to shift by the equivalent of gaining or losing a city the size of Oakland.

Central Valley and Norcal

Tightly packed urban Democratic seats like those in the Bay Area will have to geographically expand, stealing population from other neighboring Democrats to gain the requisite number of residents.  Conversely, Republican districts like these in the Central Valley and Northern California will be contracting as they give up voters, and could provide more opportunity to other Republicans as these regions add a district.

Aside from population, the requirements for geographic compactness and keeping cities and counties together will wreak havoc on the current districts.

Los Angeles

As can be seen above, the cumulative impact of shrinking population is that LA districts have to go searching for an additional 540,000 residents.   In a redraw that follows the new commission rules this should cause the loss of one congressional seat for the region.

The greatest volatility could come in the San Gabriel Valley where population growth has been slowest. The districts of Grace Napolitano (CD 38), Judy Chu (CD 32) and Xavier Becerra (CD 31) have only had growth of 2-2.5% – putting them under the state average by approximately 8%.  Furthermore, South and West facing beaches limit the ability for districts in the City of LA to move in either of those directions, meaning that expanding districts must shift North and East – likely toward the Inland Empire that has seen the highest growth rate in the state.

The only district in Los Angles with an overage is also the only district held by a Republican.

Orange County

Orange County congressional districts have largely not kept up with statewide growth putting them under the required population by about 5%.  The only exception is the Ken Calvert district, but the growth in this seat is primarily within the Riverside portion of the district.  Excluding Calvert, the remaining five districts need to expand to capture another 130,000 residents.

While Orange County currently has six congressional members, it only has four who live within the county.  The districts held by Miller and Calvert extend from Orange County into Riverside and San Bernardino where those members live.  Given Orange County population estimates, the county should have 4.25 members of congress.  

San Diego

Overall growth in San Diego is just 1% above the state average.  Yet that shifts to about 1% under the state average after accounting for the Issa District that overlaps with Riverside and the Filner district that takes in the Inland Empire.  As can be expected, it is the southern, more densely populated portion of San Diego that has had the least growth.

Inland Empire

Past redistricting efforts have not done a good job of keeping the Inland Empire intact or creating lines that benefit this growing portion of the State.  The area has eight congressional seats with only three districts entirely within its boundaries and five that overlap from Los Angeles, San Diego and Orange Counties.   Half of the Inland Empire’s congressional representatives live outside of the three-county area.

In a redraw that respects city and county lines and pays no regard to where current members live, it can be expected that the three Congressional districts entirely within the Inland Empire would increase to five, and the districts that only dip into the Inland Empire would be stopped at the county lines.  This would be an increase in the region’s true representation, but a decrease in the number of representatives that have any part of the Inland Empire.

Solving a Mystery in Philadelphia Voting Patterns

A long time ago, I posted a series of posts analyzing the swing state Pennsylvania. One section of this series focused specifically on the city of Philadelphia. This section analyzed Philadelphia’s vote by precinct results and mapped out the results of several previous elections.

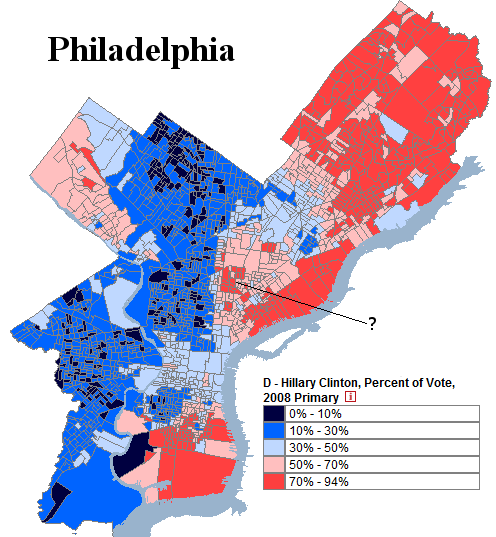
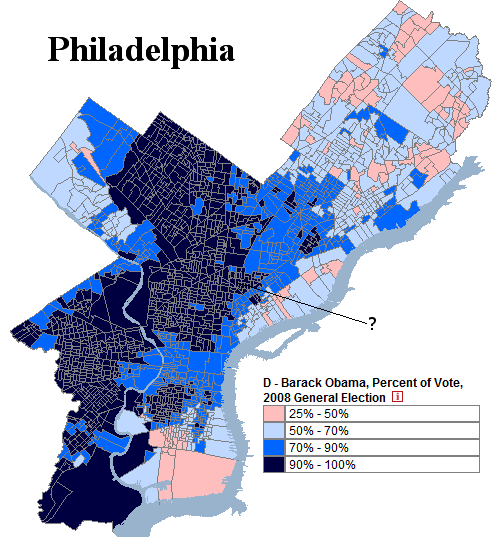
Of particular interest was the difference between the results of the 2008 presidential election and the 2008 Democratic primary, which illustrated a political divide not seen in presidential elections: between Democratic-leaning white Catholics in the northeast and Democratic-voting blacks in the west.

Here is Philadelphia in the 2008 Democratic primary. Take a note at the region the question mark points to, which this post will discuss:

Photobucket

More below.

(Note: Both images are taken from a website which maps historical Philadelphia election results.)

Here is Philadelphia in the 2008 presidential election:

Photobucket

Most of the different voting patterns between these two elections is fairly easy to explain: blacks in west Philadelphia voted for  Barack Obama both times, while white Catholics in the northeast voted strongly for Hillary Clinton in the primary and then lukewarmly Barack Obama in the general election. There is generally a scaling relationship between the two groups: as an area gets more white and less black, its support for Mr. Obama decreases in both elections.

There was, however, a group of precincts in Philadelphia which did not follow this model. These precincts are marked by the question mark in both maps. This group behaved quite strangely. It gave incredibly strong support to Ms. Clinton in the primary and then even stronger support to Mr. Obama in the general election. In the map of the 2008 primary, a number of these precincts cast more than 70% of their ballot to Ms. Clinton. All of them then vote more than 90% Democratic in the general election.

This behavior was quite puzzling, and something that the model did not explain. Initially this author hypothesized that these voters were white liberals in gentrifying areas of Philadelphia and then eventually forgot about the mystery.

The answer, as it turns out, was not white liberals. Here it is:

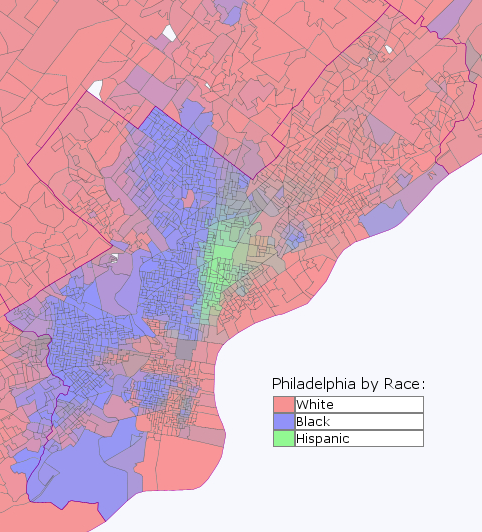
Photobucket

The mysterious precincts were Hispanic!

The above image was created using Daves Redistricting Application. Due to the tremendous efforts of David  Bradlee, one can map the ethnic composition of every state in incredibly detail.

This provides some interesting insight into the behavior of Hispanics in inner-cities. If what holds for Philadelphia also holds for other cities (which is not a 100% certainty), inner-city Hispanics strongly supported both Hillary Clinton and then Barack Obama.

It is an insight provided by Daves Application which can be extended to many other areas and groups.

–Inoljt

MO-Sen, MO-Gov: Talent Leads GOP Senate Primary

Public Policy Polling (PDF) (11/29-12/1, Missouri voters, no trendlines):

Jim Talent (R): 53

Peter Kinder (R): 26

Sarah Steelman (R): 17

Undecided: 4

(MoE: ±4.9%)

PPP’s first look at the GOP Senate primary in Missouri shows, for now, the power of name rec over the reputed power of the tea party. Ex-Sen. Jim Talent is out to a big lead over ex-Treasurer Sarah Steelman, the only announced candidate so far. That’s despite a lot of hoopla that surrounded Steelman’s announcement last week that focused on her grass-roots popularity and some touting from those on the far-right, like the Club for Growth. Talent, despite the CfG’s attacks on him as pork-hungry, doesn’t seem to have much trouble with the very-conservative-leaning Missouri GOP electorate, with 55/13 favorables. Steelman, by comparison, is at 25/13 (with 62% unknown).

The big question here, though is what happens to the Peter Kinder vote (as the Lt. Governor is widely expected to run for Governor, not Senator)? Is his 26% part of an anti-Talent bloc, which is likely to gravitate toward Steelman, or is it Kinder-specific, and likely to break evenly between the two if it’s a Talent/Steelman matchup?

A Talent/Steelman matchup still isn’t a done deal, by the way; Jeremy Jacobs talked to a variety of GOP insiders in Missouri, and some think he’s hesitant to run, saying he hasn’t been aggressively reaching out to donors. The same article has some interesting wrinkles for Steelman, though; despite the wet kiss that she got from the inside-the-Beltway teabaggers (i.e. the CfG), the locals seem a lot more skeptical. The St. Louis Tea Party Coalition, in fact, has sent around e-mails to supporters questioning her credentials, and saying there is no Tea Party candidate in the race yet. The main problem seems to be her husband, who’s a leader among the state’s trial lawyers, giving rise to accusations that she was pro-trial lawyer while in the state Senate.

Public Policy Polling (PDF) (11/29-12/1, Missouri voters, no trendlines):

Jay Nixon (D-inc): 47

Peter Kinder (R): 39

Undecided: 14

Jay Nixon (D-inc): 46

Sarah Steelman (R):  35

Undecided: 19

(MoE: ±4.3%)

There’s also the matter of Missouri’s gubernatorial race in 2012, which is where we’re much more likely to see Kinder running. Despite Missouri’s seeming turn to the right in the last few years, Nixon seems on track to gut this one out, thanks to a mix of centrism and personal appeal (good for getting the vote of 14% of Republicans). He has 44/30 approvals (compared with 23/22 favorables for Kinder, good for a 54% unknown), making him the 6th-most popular governor according to PPP’s tally — despite a sample that breaks down 39% GOP and 36% Dem. This could get closer as the GOP opposition gets better known, but for now it’s one of the Dems’ lesser worries for 2012.