Analyzing Swing States: Colorado, Part 4

This is the fourth part of a series of posts analyzing the swing state  Colorado. It will focus on the complex territory that constitutes the Democratic base in Colorado. The last part can be found here.

Democratic Colorado

In American politics, the Democratic base is almost always more complex than the Republican base, a fact which is largely due to complex historical factors. Democrats wield a large and heterogeneous coalition – one which often splinters based on one difference or another. The Republican base is more cohesive.

The same is true for Colorado. Republican Colorado generally consists of rural white Colorado and parts of suburban white Colorado. Democratic Colorado is more difficult to characterize.

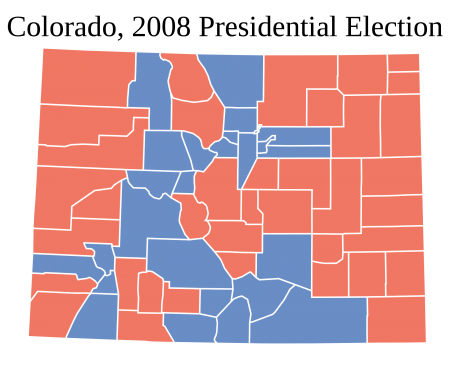
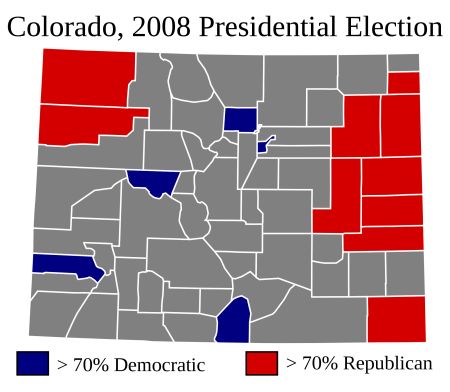
A look into President Barack Obama’s strongest counties provides some insight:

Photobucket

More below.

The Republican counties pictured here are fairly similar: they are thinly populated, homogeneously white rural counties. The Democratic counties, on the other hand, are quite different. There are four facets to Colorado’s Democratic base, and each facet is represented in the picture above.

Denver and Boulder

As the post focusing on the Republican base explained, the red-colored counties above constituted 1.2% of the total vote in 2008. A Republican who wins Colorado will win these places, but they are not necessary to win the state.

The same is not true for a Democrat who wins Colorado. The blue-colored counties – or, more specifically, Denver and Boulder – are absolutely essential for a Democratic candidate to win Colorado.

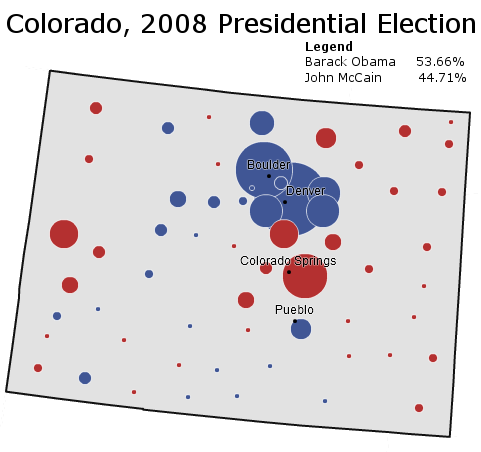
The map below illustrates this fact:

Analyzing Swing States: Colorado,Part 4

As is evident by the map, Denver County and Boulder County are the two foundations of the Democratic base in Colorado. Mr. Obama gained a margin of 221,570 votes from the two counties. Without the cities of Boulder and Denver, Mr. Obama would have lost Colorado – by around 6,500 votes.

Cities are the mainstay of the Democratic Party in modern-day America, and so it is unsurprising that the Democratic base in Colorado rests upon two cities. Yet not all Democratic cities are alike. Boulder and Denver represent two dramatically different types of cities, both of which vote Democratic.

Boulder is a stronghold of Democratic liberalism; in 2000 it gave Green Party candidate Ralph Nader 11.8% of its vote. Like most liberal places in America (San Francisco, Portland, Seattle, the state of Massachusetts) the median resident of Boulder is richer than the median resident of the United States. Boulder is also more homogeneous than the United States; whites compose something like four out of five people in Boulder County. In this, Boulder is also not much different from most liberal places either.

Denver, in contrast, has more in common with machine-cities like Chicago, Los Angeles, and Detroit. Like these cities, Denver is poorer than the United States. Another commonality is the high number of minorities: Hispanics are more than one-third the total population, non-Hispanic whites less than half. Places like San Francisco and Seattle are more Democratic than liberal; places like Denver are the opposite. On the other hand, in 2000 Mr. Nader also got 5.86% of Denver’s vote – indicating the presence of a substantial liberal bloc.

Electorally, however, these differences do not matter. Both Denver and Boulder vote consistently and powerfully Democratic, and will continue doing so in the foreseeable future.

Rural Democratic Colorado

Colorado and Denver, however, constituted only two of the five blue-colored counties in the first map. The other three are rural, thinly populated, and highly Democratic areas. This may sound strange at first, given the extent of Democratic weakness in rural America. Yet the Democratic parts of rural Colorado have either one of two characteristics.

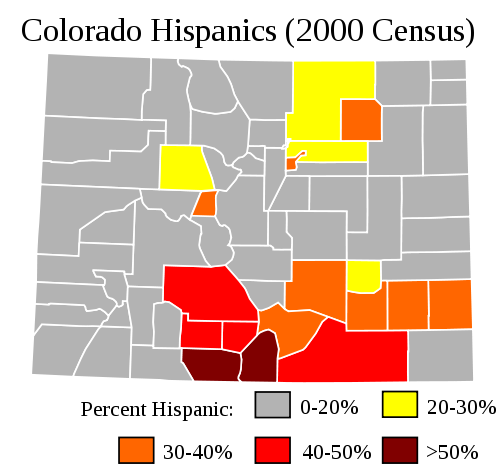
The first characteristic is indicated by the picture below:

Analyzing Swing States: Colorado,Part 4

This map uses 2000 Census data to provide a picture of Colorado’s Hispanic population. In 2000 Latinos constituted 17.1% of Colorado; today their numbers have risen to 19.9% of the state population.

Latinos tend to be concentrated in two places: Denver and the areas to its northeast, and a broad band stretching from south-central to south-east Colorado. The latter areas tend to be rural, thinly populated, and the poorest places in Colorado. Due to the high numbers of Latinos, most of these counties usually vote Democratic.

But not all of them. Latinos are not as reliably Democratic as blacks, and they also turn-out in lower numbers. Thus counties with high Latino population correlate with but do not ensure Democratic victory. In 2008, Senator John McCain won seven of the eighteen counties with greater than 20% Latino population. In 2000 Governor George W. Bush actually won Conejos County, where about 58.9% of the population is Latino. Out of the rural counties above, Democrats are only guaranteed victory in the south-central band.

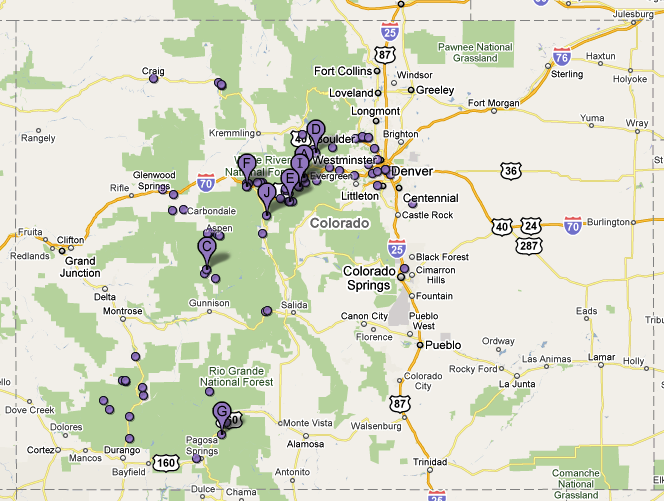
Ski resorts function as another characteristic of rural Democratic Colorado:

Analyzing Swing States: Colorado,Part 4

For whatever reason, rural counties dominated by ski resorts vote strongly Democratic. These counties are largely located along Colorado’s Front Range. In two of them Mr. Obama won over 70% of the vote: Pitkin County and San Miguel County. Both are home to famous ski resorts: Aspen Mountain in the former and Telluride Ski Resort in the latter.

Ski resort counties are strange places for Democrats to do well in. They are the opposite of the poor Latino counties which also vote Democratic. The people who live in them are generally quite rich, quite famous, and quite white. Rich, 90% non-Hispanic white San Miguel County does not sound at first glance like a Democratic stronghold. Yet when described this way, San Miguel County looks a lot like another Democratic place: Massachusetts.

Conclusion

The counties that form the Democratic base form the shape of a “C.” A strong Democratic candidate will expand and fatten the “C.” A strong Republican candidate will cut into the “C” and often split it in two.

President Barack Obama’s 9.0% victory in Colorado provides one illustration of this Democratic “C”:

Photobucket

In this “C,” all four elements of the Democratic base in Colorado are present. Denver and Boulder form the top part of the “C, which is augmented by suburban Denver counties which Mr. Obama also won. The rural ski resort counties on the Front Range form the left side of the “C,” and the rural Latino counties compose the bottom part.

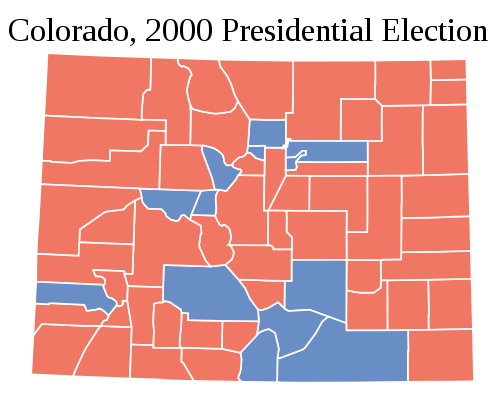
President George W. Bush’s 8.4% victory in 2000, on the other hand, provides an instance of a Republican breaking the Democratic “C”:

Analyzing Swing States: Colorado,Part 4

Mr. Bush makes inroads everywhere: both rural ski resort counties, rural Latino counties, and the Denver-Boulder metropolis are much more Republican. The Democratic “C” is just present, but barely so.

Unlike other states, therefore, it is relatively easy to tell whether the state is voting for a Democrat or Republican just by looking at a county map. A Democratic victory will look like Mr. Obama’s map. A Republican victory will look like Mr. Bush’s map. This is unlike a state such as New York or Illinois, where Democrats or Republicans can win a 5% victory under the same county map.

(Note: Some maps are edited NYT images.)

–Inoljt, http://mypolitikal.com/
Analyzing Swing States: Colorado, Part 3

This is the third part of a series of posts analyzing the swing state  Colorado. It will focus on the swing areas in Colorado – the parts that will vote for both Democrats and Republicans. The fourth part can be found here.

Swing Colorado

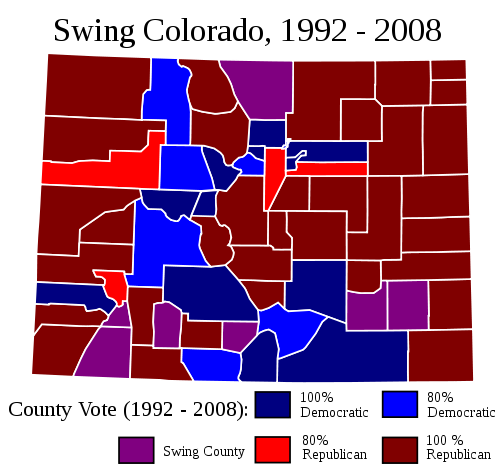
The swing areas of Colorado lie on the edges of the Democratic base in Colorado, which forms a rough “C” shape (more on this in the next post). They can be mapped as below:

Analyzing Swing States: Colorado,Part 3

More below.

This map incorporates five presidential elections, from 1992 to 2008. Republicans won the state three times; Democrats twice. Of the swing counties pictured here, President Bill Clinton did better in the rural swing areas, mostly in southern Colorado. President Barack Obama, on the other hand, had his strength in several highly populated, suburban swing counties.

Swing Colorado is, like the Republican base, divided into two quite different domains. The first domain is composed by the rural, “Clinton” counties. This region has much in common with the Republican parts of rural Colorado; it is generally poorer and extremely thinly populated.

The difference lies with two things: Hispanics and ski resorts. Areas of rural Colorado with high numbers of Hispanics and ski resorts vote solidly Democratic; areas with low numbers vote solidly Republican. Swing counties generally have enough Hispanics or ski resorts to be competitive for Democrats, but not enough to automatically vote Democratic.

Interestingly, the rural swing counties with ski resorts have become more Democratic over the years, while the rural swing counties with Hispanics have become less so. Mr. Obama generally did worse in rural Hispanic Colorado than Mr. Clinton. Whether because the Hispanic population is locally in decline in this thinly populated area, or because Hispanics are voting more Republican, is uncertain.

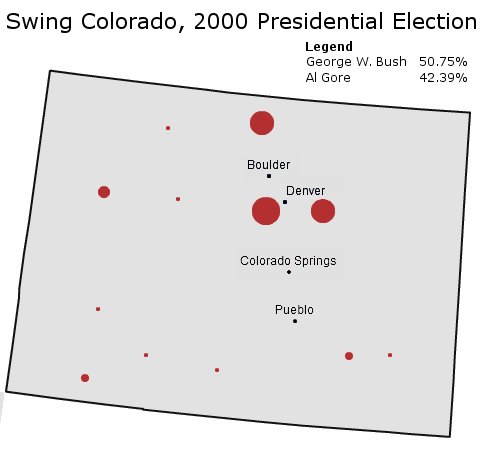
The second part of swing Colorado consists of a set of three suburban counties  surrounding the Denver metropolis. These counties used to vote solidly Republican, which was why Colorado was Republican for so long. Here is how they voted in the 2000 presidential election:

Analyzing Swing States: Colorado,Part 3

The counties – Arapahoe County, Jefferson County, and Larimar County – are pictured by the three large red circles around Denver and Boulder. As is apparent, their importance is of a magnitude above that of the rural swing counties. Indeed, in 2008 the three counties composed 30.8% of the votes cast in Colorado. Jefferson County had more votes cast than any other county in the entire state.

Winning these suburbs, therefore, is naturally important. Until recently they generally leaned Republican. As swing areas, Republicans usually didn’t win them by landslides; they generally had a ceiling of around 65% of the vote. But they won them, and therefore they won Colorado.

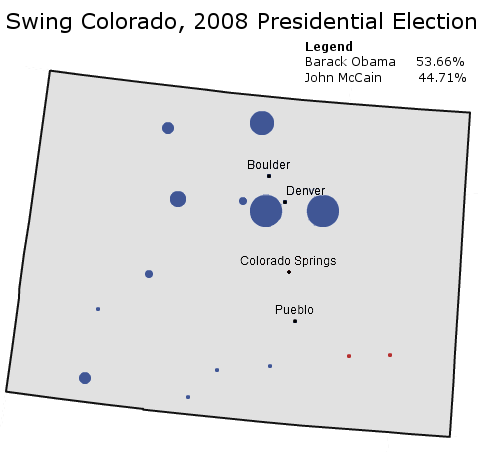
It is the shift in places like these that is responsible for recent Democratic gains in Colorado. Here is how swing Colorado voted in 2008:

Analyzing Swing States: Colorado,Part 3

Mr. Obama won Arapahoe County, Jefferson County, and Larimer County by 12.91%, 8.91%, and 9.73% respectively. Combined, he came out with a 77,067 vote margin out of swing Colorado. This was enough to erase the Senator John McCain’s margins in his two strongest counties – El Paso (Colorado Springs) and Douglas Counties. Mr. Obama also did this out of historically Republican territory.

Demographically, the three counties above share certain similarities. For suburbs, they are actually not that rich; median household income is only slightly above the national average (Jefferson County is richest). The counties are also fairly homogeneous; approximately four out of five residents in Jefferson and Larimer County are white and non-Hispanic. Arapahoe County, on the other hand, is more diverse; non-Hispanic whites compose about 65% of the population (a mirror of the country, in fact). Unsurprisingly, Mr. Obama did best in Arapahoe County.

To be fair, Mr. Obama’s performance in Colorado’s formerly Republican-leaning suburbs probably constitutes something of a ceiling for Democrats. Mr. Obama did extremely well in exurbs like these throughout the nation, in both the primaries and the general election. The housing crisis did not hurt things, either. A different Democrat might rely less on these suburbs.

Nevertheless, the very fact that a Democrat can now win places like Larimer County is something of an achievement for the party. Indeed, almost all of swing Colorado constitutes formerly Republican-leaning territory that Democrats have made competitive over the past two decades. Democrats have also carved out a new and many-sided base in Colorado during this time period. The next post will examine the complex elements that make up Colorado’s Democratic base. will examine the complex elements that make up Colorado’s Democratic base.

–Inoljt, http://mypolitikal.com/
Analyzing Swing States: Colorado, Part 1

This is the first part of a series of posts analyzing the swing state Colorado. The second part can be found here.

Analyzing Swing States: Colorado,Part 1

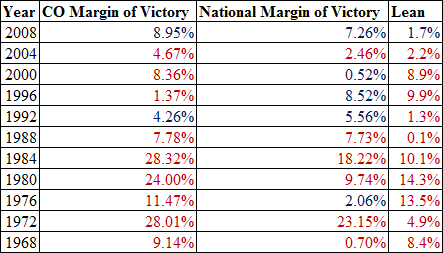
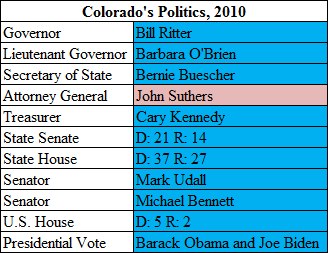
Starting six years ago, a massive Democratic wave swept through the state of Colorado. Starting with the election of former Senator Ken Salazar, the Democratic Party took control of almost every state office there was to take. The results of this transformation are pictured in the table above.

More below.

At the time, Democrats crowed that Colorado was undergoing a fundamental political transformation. A flood of liberal migrants from California, along with steady growth in Colorado’s Latino population, was supposedly moving the state left from its decades-old conservative roots.

These conservative roots can be seen by taking a look at Colorado’s electoral history:

Analyzing Swing States: Colorado,Part 1

Six years later, however, Democrats are not so confident. Polls show that Colorado has swung as quickly Republican as it went Democratic after 2004. Democrats are facing tough elections in Colorado’s senatorial and house races; until the Republican candidate became engulfed in scandal, they were also polling weakly in the gubernatorial race.

Whatever the future of Colorado, for the past decade the state has done a perfect job of reflecting the national mood. This is perhaps the ultimate attribute of a swing state.

–Inoljt, http://mypolitikal.com/
Analyzing Swing States: Virginia, Conclusions

This is the last part of a series of posts analyzing the swing state Virginia, which aims to offer some concluding thoughts. The previous parts can be found starting here.

Conclusions

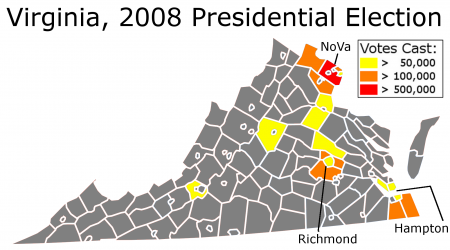
As a state, Virginia’s population has always been located in three metropolitan areas: the Northern Virginia suburbs south of Washington D.C., Richmond and its suburbs, and the communities surrounding Hampton Roads. Together these three places compose more than half of Virginia’s electorate:

Analyzing Swing States: Virginia,Conclusions

In all three metropolitan areas, Democrats have been improving their margins.

More below.

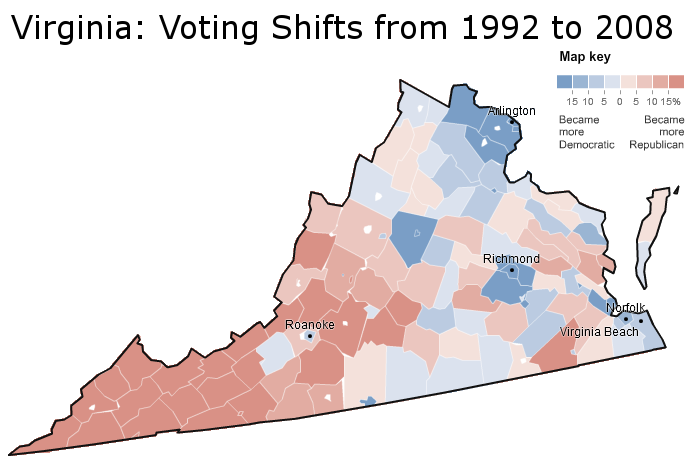
Virginia’s suburbs, expansive and traditionally Republican, have shifted leftwards with startling quickness. This movement has been most apparent in the largest of its suburbs, rich and diverse Northern Virginia. The addition of NoVa to Virginia’s heavily Democratic, heavily black cities has given the Democratic Party a coalition that has won a number of recent elections.

Not everything has gone badly for the Republican Party. They have captured a formerly loyal Democratic constituency – the Appalachian west, which voted Democratic based on economic appeals. Moreover, they still dominate the rural whites who in bygone days voted Democratic:

Analyzing Swing States: Virginia,Conclusions

Thus, Virginia today is a state in change, like most states. Parts of it are shifting left and parts of it are shifting right; in aggregate, the effect has been to change it from a solidly Republican to swing state. Undoubtedly, other states will and are moving in the opposite direction.

Colorado, the next state in this series, is probably not one of those Republican-shifting states.

–Inoljt, http://mypolitikal.com/
Analyzing Swing States: Pennsylvania, Part 2

This is the second part of a series of posts analyzing the swing state Pennsylvania. The next part can be found here.

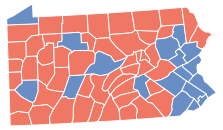
Photobucket

Like Florida, and unlike Ohio, Pennsylvania’s political geography can be divided into three. The industrial southwest is reddening, the populous southeast is bluing, and Pennsyltucky remains, as James Carville memorably described it, “Alabama without the blacks.” (Actually, Pennsyltucky is a fair bit less conservative.)

The following section will concentrate on Philadelphia, the region upon which Democrats draw the most votes.


Philadelphia the City

Although cities always vote Democratic, different cities contain different political characteristics. Not all big cities are liberal (see Houston, Phoenix), nor are all liberal cities are big (see San Francisco, Boulder).

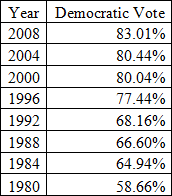
Fortunately for Democrats, Philadelphia is both America’s sixth largest city and one in which four out of five inhabitants regularly choose the Democrat. It is, moreover, a city which has become bluer for eight straight elections.

(A note: All my statistics are taken from http://www.uselectionatlas.org/)

Photobucket

More below.

Philadelphia’s decades-long movement towards Democrats has corresponded with six decades of population decline; white flight has gradually weeded out Republican voters. Machine politics – characterized by such practices as street money – continues to play a major role in elections.

Demographics underlie Democratic strength in the city (as they do throughout American cities). A full 44.8% of the city’s population is black, a heavily Democratic voting bloc. Latinos (another Democratic voting bloc), while fewer than elsewhere, comprise a solid 11.8% of Philadelphia.

A large majority of Philadelphia’s white voters must vote Democratic, too. In 2008 Obama took 83% of the vote, in a city whose non-Hispanic white population was 39.0% according to the census. Assuming minority turn-out proportional to their actual population, and assuming every single non-white person voted Democratic, then at a minimum, 56.4% of Philadelphia whites supported Obama. Under a more realistic assumption (e.g. 90% non-whites voting Democratic), 72.08% of Philadelphia whites would be supporting Obama. (The equation to get this is simple: 83.01 = 0.90*61.00 + x*39.00).

Philadelphia’s white vote revolves around two factors: liberal whites moving in through gentrification, and long-standing white ethnic communities. The former voting group – often young, single, and gay or gay-friendly – is liberal by orientation; the latter group, a consequence of long-gone anti-Catholic sentiment, still votes Democratic on economic issues but is slowly treading Republican.

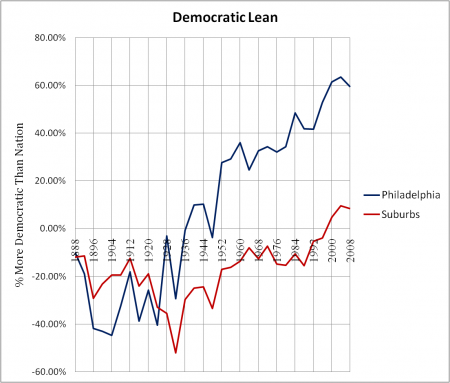
All in all, Philadelphia’s existence constitutes an enormous advantage for Democrats. For the past three presidential elections, it has been around 60% more Democratic than the nation as a whole. If George W. Bush had won 80% of the vote in 2008 (and John Kerry had won 20% of the vote), he still would have lost Philadelphia by 3.60%. That is a shocking (and sad) statistic. As long as Republicans keep on losing the city by 4-1 margins, they’ll have a very difficult time winning Pennsylvania as a whole.

Photobucket

Finally, notice how – for the first time in history – Philadelphia’s suburbs now lean Democratic. That shift, which I will cover next, should disturb even the most confident Republican.

–Inoljt, http://mypolitikal.com/
Nevada: Up Close & Personal

(Proudly cross-posted at C4O)

Lv4

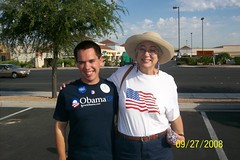
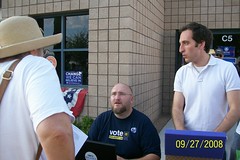
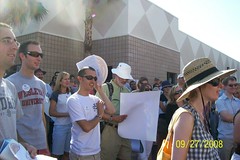
Last weekend, I was lucky enough to see the state of the race for myself. I traveled to the heart of Battleground Country. Because Nevada’s 5 electoral votes are up for grabs and two Nevada Republicans may lose their House seats this fall, I wanted to do something to help. That’s why I packed my bags, took some spare change for my favorite slot machines (NOT!), and made sure my family in Henderson had an extra bed for me to crash on.

I went to Vegas, baby, and I’m giving you the full report on what’s happening there!

Lv29

Lv2

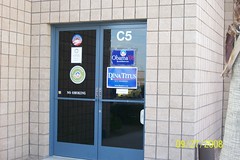
Luckily for me, my cousin’s house is in the eye of the electoral storm. She lives in the 3rd Congressional District, the part of Nevada where Obama needs to win to carry the state… And the district where a Dina Titus win will give Democrats the majority in Nevada’s Congressional Delegation. So when I left my house on Friday, I was thrilled to go to a place where I can double the impact with the same amount of time!

When I arrived in town on Friday night, the Presidential Debate was just ending. I had listened on the radio while my friend Harriet and I were driving up the 15, and I was personally impressed by Obama’s performance. Still, I was anxious to find out what my moderate-conservative Republican cousin in Henderson thought about it. And to my surprise, she was also impressed!

Believe it or not, my Republican cousin will be voting for Democrat Barack Obama this fall. Why? Believe it or not, she may be upper middle-class… But she and her husband are still only a couple paychecks away from losing their home. Their house has now lost about $80,000 of its value while they still have to pay an “interest only mortgage” that’s now after the “interest only” period. They consider themselves blessed that they have a beautiful house in a great neighborhood just down the hill from the most exclusive estates in the Las Vegas Valley, but they still fear what would happen to them and their two kids if one of them were to have a health scare or lose a job. That’s why both my Republican cousin and her Democratic husband are voting for Obama.

And you know what? This isn’t an isolated case. In fact, I would find more of this the following two days when I strapped on my tennies and hit the pavement.

Lv5

Lv3

Lv8

On Saturday morning, I regrouped with Harriet and joined with all the other California Obama volunteers who drove to Nevada for the weekend. Before we were sent off to knock doors, we were given the lay of the land. In just four years, Nevada has turned from a Republican plurality state into a state with 80,000 more registered Democrats than Republicans! In the 3rd District alone, Democrats now have a 29,000 voter registration edge! And now in previously GOP friendly Vegas suburbs like Henderson, voters are afraid of losing their jobs, losing their health care, losing their houses, and losing the middle-class American Dream they thought they had achieved. That’s why it was critical to get volunteers like us on the ground here to explain to voters what Democrats like  

Barack Obama and Dina Titus will do to help working people.

Lv18

Lv17

Lv26

Lv28

So that’s what we did over the next two days. We knocked doors. We talked to voters who still had doubts about Obama. We urged Obama voters to vote early. We reminded everyone not to forget Dina Titus and the state legislature candidates.

Oh yes, and we also listened. We listened as retirees told us about their health care worries. We listened as young people were telling us about their plans to finish college and get a real career. We listened to parents telling us about how they want to leave to their kids a better nation and a healthier planet. We listened to Democrats thrilled about a chance for us to make history (in a good way!). We also listened to Indpendents and Republicans, who have never voted for a Democrat before in their lifetimes, tell us that Barack Obama is the only candidate who they can trust with our nation’s future.

And believe it or not, I could count the number of McCain supporters we encountered on our walks with one hand. Even though we were mainly walking middle-class and upper middle-class neighborhoods in leafy (for the desert) suburban Henderson, hardly anyone on our lists turned out to be McCain supporters. This just goes to show how Southern Nevada’s changing and how much the people who live here are yearning for real change.

Now I know my experience in Las Vegas last weekend was only a snapshot of what’s really happening in Nevada right now. However, I must admit came back on Sunday feeling more confident of the Democratic operation in Nevada. We have a real chance of winning and winning BIG here… But only if we support our Democrats!

There’s plenty we can all do to help Democrats win this year. We can drive. We can walk. We can call. And yes, we can give. So please join us in helping in any way you can. The stakes are too high, and we can’t afford to lose this time. Let’s win, and let’s take our country back!

Lv16

Lv32

Lv36

Swing State Nation

Yesterday, we looked at the dramatic voter registration shift in Nevada, where Democrats have added far more voters to the rolls than Republicans in all three of the state’s congressional districts over the past two years. It occurred to me that we might want to expand this analysis to as many “swing states” as we could.

SEK over at The Edge of the American West has done yeoman’s work on this score, keeping tabs on the Democratic gains since the beginning of the year in all states with available data on party registration. Let’s take that approach a step further and compare the voter registration changes between today and 2006.

Nearly five years ago, DavidNYC defined a swing state as any state where the vote margin between both sides was ±10%. Let’s take David’s 2004 list of swing states (and add North Carolina and Arizona, for good measure) and see just how much movement there has been in voter registration in these states since November 2006. Unfortunately, not all of these states have voter registration, or publicly available data covering the last two years, so our list is much shorter than I’d like. But you blog with the stats you have, not the stats you want.

Just as we did yesterday, let’s present the data in terms of the margin of each party’s voter registration advantage in their respective states, with blue indicating a Democratic registration advantage and red indicating a GOP advantage.


State 2006 2008 Change
Arizona 166,133 110,806 55,327
California 1,291,594 1,809,466 517,872
Colorado 165,423 78,227 87,196
Delaware 67,494 86,573 19,079
Florida 283,856 465,617 181,761
Iowa 18,195 99,014 80,819
Nevada 15,309 76,053 60,744
New Jersey 260,066 652,210 392,144
North Carolina 611,790 743,463 131,673
Oregon 62,351 212,224 149,873
Pennsylvania 599,791 1,111,900 512,109

No doubt a super-charged presidential primary was a big factor in the hard blue turn in many of these states, but that contest only fanned the flames of an already present (and continuing) trend. These are definitely some numbers worth chewing on — and definitely ones causing heartburn for GOP strategists.

I’ve included links to my sources below the fold.

Update: I’ve revised the chart above to include inactive voters in the tallies for Arizona and Nevada, as well as update the Iowa numbers with the new September stats (Dems posted another net gain of 2,500 voters here).

AZ: 2006 | 2008

CA: 2006 | 2008

CO: 2006 | 2008

DE: 2006 | 2008

FL: 2006 | 2008

IA: 2006 | 2008

NV: 2006 | 2008

NJ: 2006 | 2008

NC: 2006 | 2008

OR: 2006 | 2008

PA: 2006 | 2008

What Do All These States Have in Common?

Check out this list of states:

Arkansas: 9.76%
Arizona: 10.47%
California: 9.95%
New Mexico: 0.79%
Nevada: 2.59%
Michigan: 3.42%
Washington: 7.18%

The number following each state is the presidential voting margin in 2004. All of them are around 10% or less, in some cases a lot less. So the first-cut answer to the question posted in the title is that all of these states are swing states, or something like it.

But take a look at this list as well:

Arkansas: Bud Cummins
Arizona: Paul Charlton
California: Carol Lam
New Mexico: David Iglesias
Nevada: Daniel Bogden
Michigan: Margaret Chiara
Washington: John McKay

I’m sure many of these names ring a bell. They’re all former US Attorneys who were fired for their refusal to subvert justice in the name of loyalty to the Bush administration. And funny enough, they all ran US Attorneys offices in swing states.

Now, correlation does not prove causation. But when it comes to the Bushies, you can put nothing past them. And we do know that one of the reasons John McKay was fired was because he wouldn’t pursue bogus allegations of voter fraud after the very close gubernatorial race in Washington state in 2004. So I could very easily believe that Bushco wanted loyalists in these states in particular so that the GOP could maintain their necessary fiction that Democrats are purveyors of rampant voter fraud.

Fortunately, with aggressive oversight, we can at least hope that the new lackeys Dick Cheney has installed will be scrutinized like hawks, especially when when get close to election day. I know I’ll be watching.

UPDATE: Others have made a similar observation on this correlation. (Hat tip to mcjoan.)

The Swing State Project, Take Two

Take a look up at the banner on top of this screen, that big green bar. See the name in the title there? Remember that? Well, believe it or not, this site once focused entirely on the presidential swing states. (It was only after the 2004 election that we branched out to other races.)

So, with the next presidential election a mere 677 days away – ie, sooner than your local Best Buy will have Nintendo’s Wii back in stock – I thought we might take a look at the swing states in play for 2008. Now, as you know, I’m a big believer in the fifty-state strategy, but as you also know, these things take time. As much as I’d like to believe we’ll see an expanded playing field in the next presidential race, I think we all realize that Howard Dean’s plan is the work of many years.

Therefore, I’d like to start with a similar approach to the one I took three years ago, one which served us well, I think. Back then, I considered as a swing state any state where the vote margin between both sides was ±10%. (Specifically, where the margin between (Gore + Nader) – (Bush + Buchanan) was ±10%.) This time, it’s a little simpler because there were no meaningful third-party candidates in 2004, so I’m just going to look at the Kerry – Bush vote.

In any event, this is the list I wound up with, using the numbers found on Dave Leip’s site:


State EVs Bush Kerry Margin
California 55 44.36% 54.31% 9.95%
Maine 4 44.58% 53.57% 8.99%
Hawaii 4 45.26% 54.01% 8.75%
Delaware 3 45.75% 53.35% 7.60%
Washington 11 45.64% 52.82% 7.18%
New Jersey 15 46.24% 52.92% 6.68%
Oregon 7 47.19% 51.35% 4.16%
Minnesota 10 47.61% 51.09% 3.48%
Michigan 17 47.81% 51.23% 3.42%
Pennsylvania 21 48.42% 50.92% 2.50%
New Hampshire 4 48.87% 50.24% 1.37%
Wisconsin 10 49.32% 49.70% 0.38%
Iowa 7 49.90% 49.23% -0.67%
New Mexico 5 49.84% 49.05% -0.79%
Ohio 20 50.81% 48.71% -2.10%
Nevada 5 50.47% 47.88% -2.59%
Colorado 9 51.69% 47.02% -4.67%
Florida 27 52.10% 47.09% -5.01%
Missouri 11 53.30% 46.10% -7.20%
Virginia 13 53.68% 45.48% -8.20%
Arkansas 6 54.31% 44.55% -9.76%

Twenty-one states in total: twelve blue and nine red. Four states are new to this list (CA, DE, HI, NJ) and five states were dropped from the previous list (AZ, LA, NC, TN & WV – though NC was only included later, when Edwards was added to the ticket).

Obviously, quite a few of these seem pretty implausible candidates for switching – certainly anything from NJ to CA would be a huge shock. Perhaps less so with the bottom three red states on the list, given our recent electoral successes in each – but of course, presidential politics is a whole ‘nother ballgame, and we often do well in state and local races in red states while getting crushed on the national level.

So the playing field is, in all likelihood, quite a bit narrower than this list would imply. It’s also conceivable that some of the states which are no longer on the list could come into play (in particular, AZ). (By the way, the next closest blue states outside this list IL, CT and MD – if they flip, I’m crunching down on my netroots-issued cyanide capsule.)

Anyhow, which states do you think are most likely to flip – and why? And if your analysis hinges on a particular candidate (or type of candidate) getting nominated for pres or VP, please detail that as well.