This is the sixth in a series of diaries depicting the Democratic victory in this year’s midterm elections.
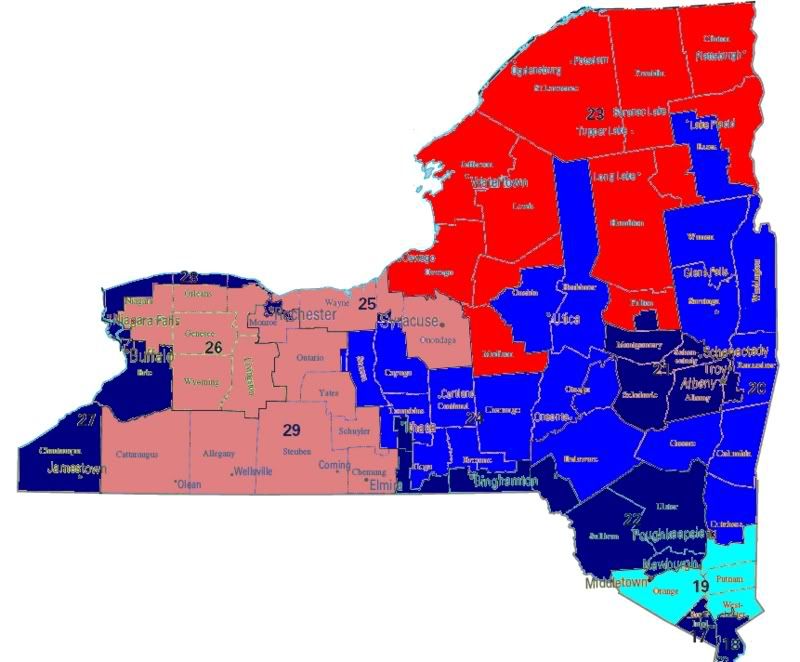
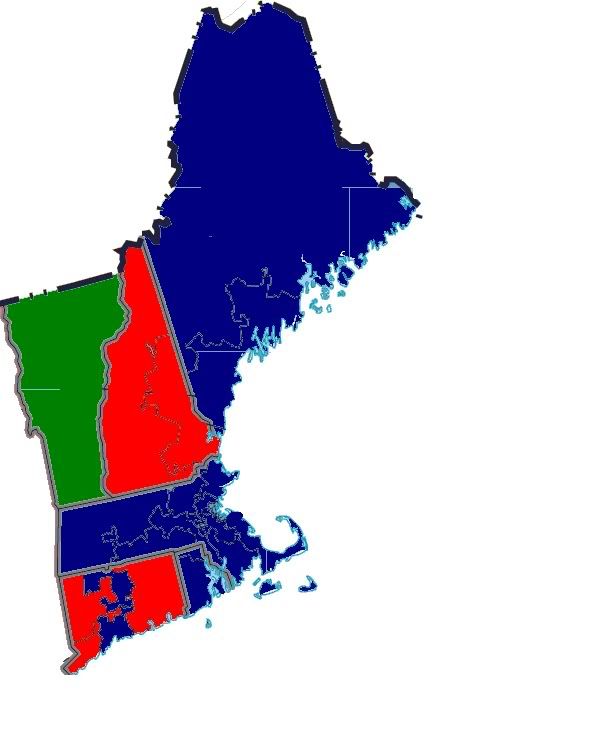
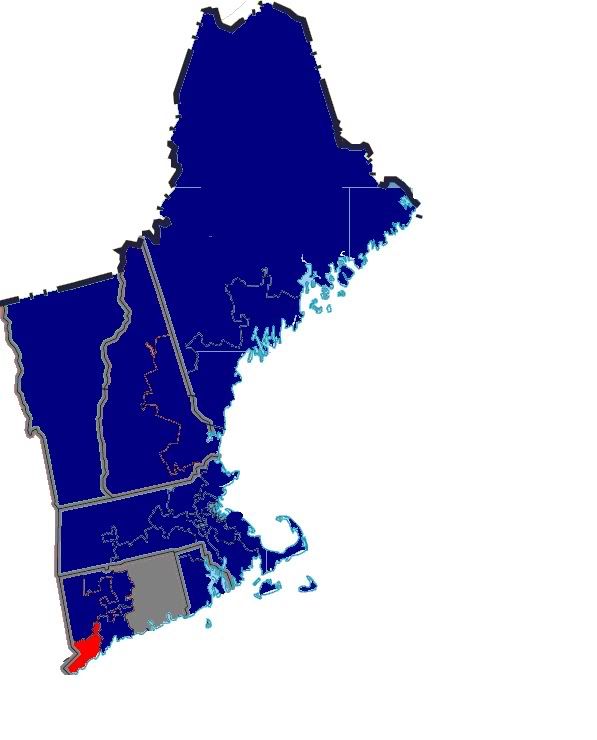
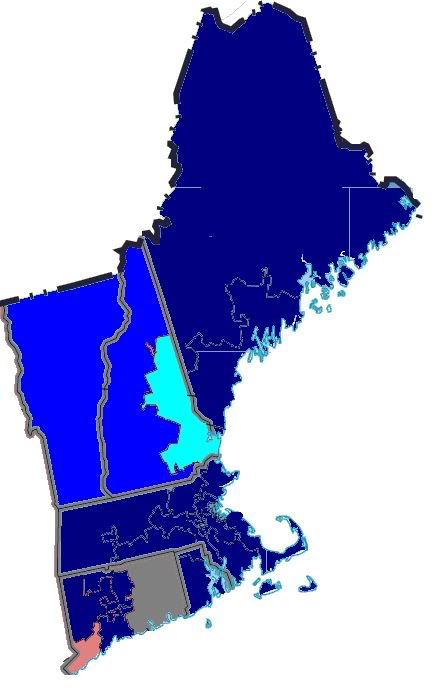
Already covered have been New England, NY, NJ, MD, and DE, PA, and Ohio.
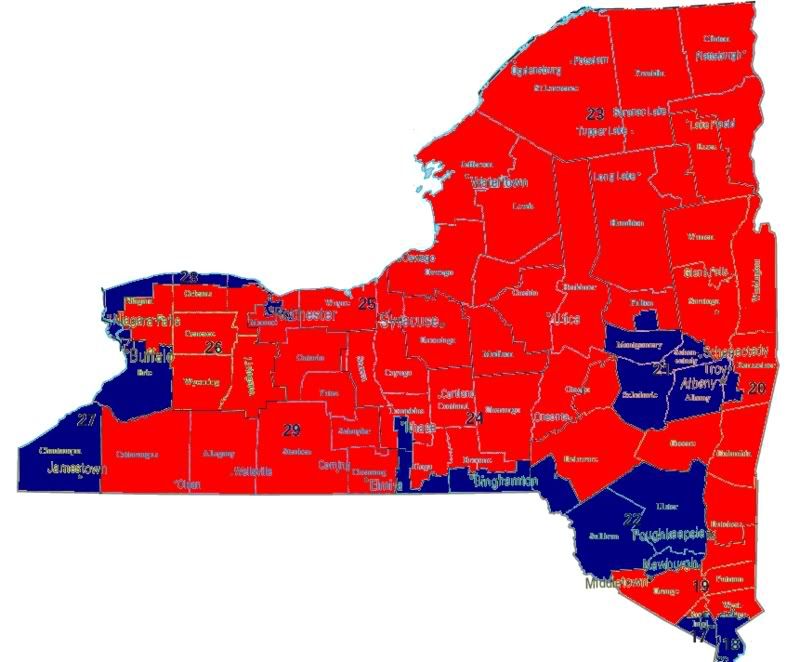
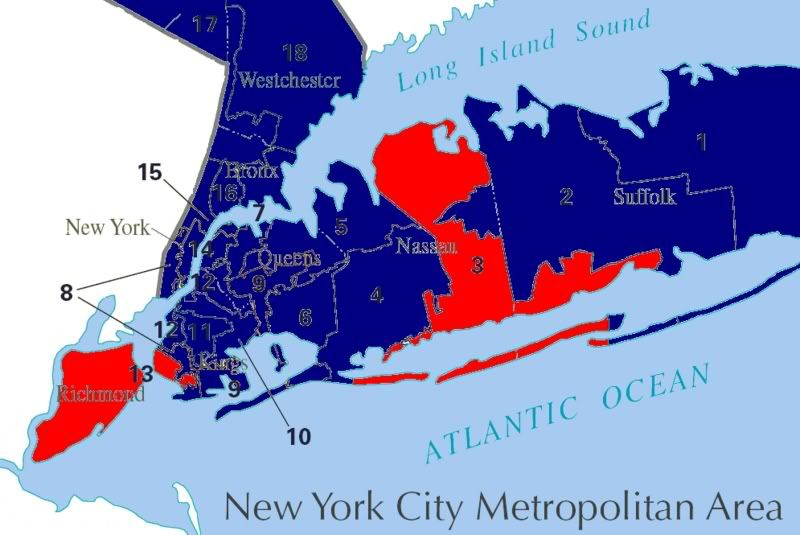
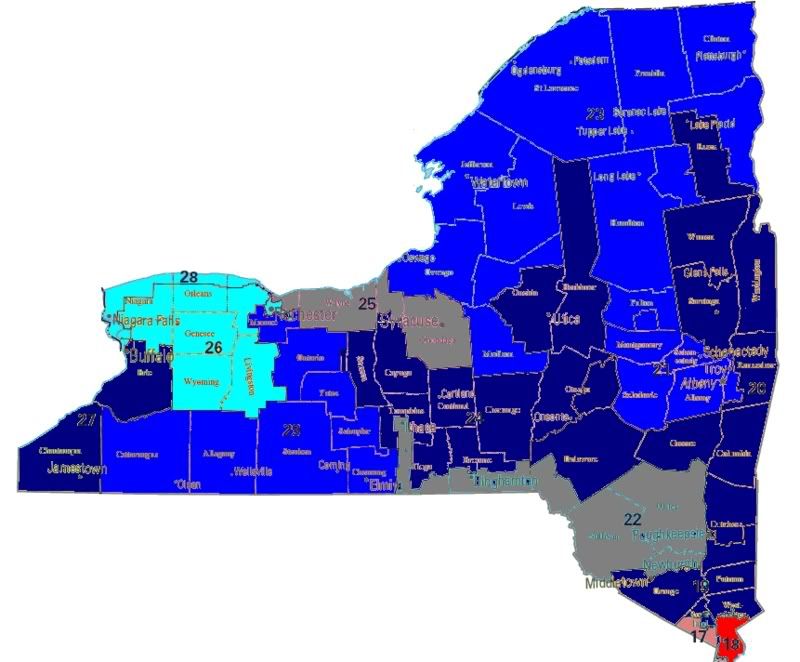
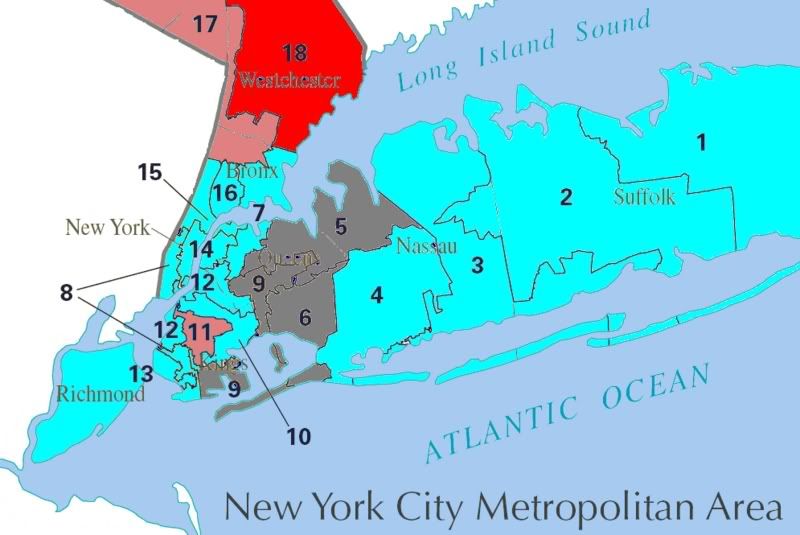
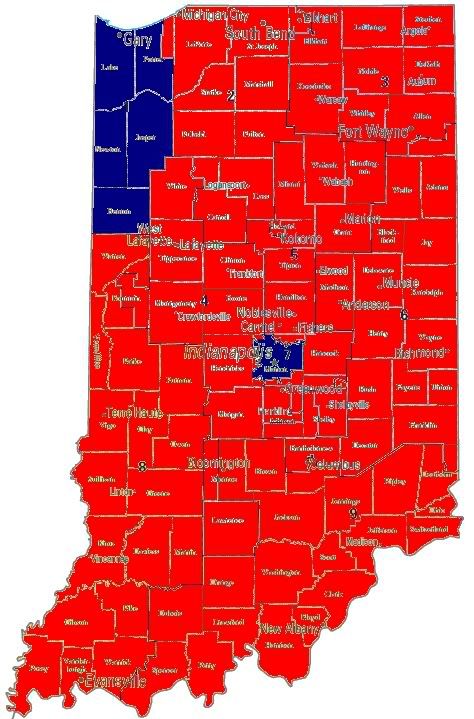
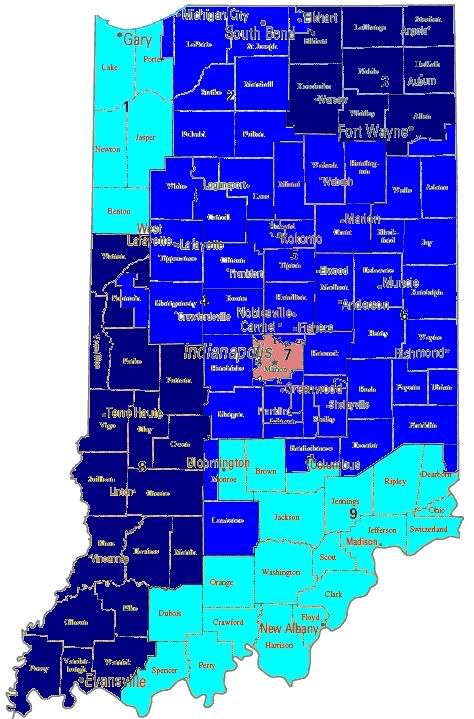
Today’s diary will focus on my Indiana, my home state, and will be a bit larger than usual for that reason. As always first up are the seat control maps.
2004
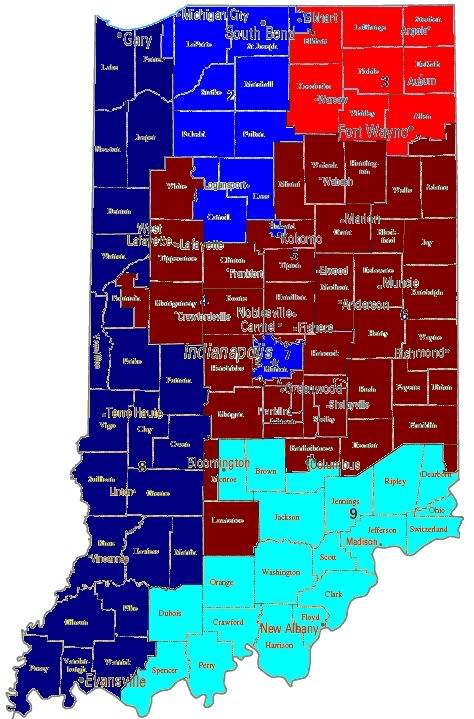
2006
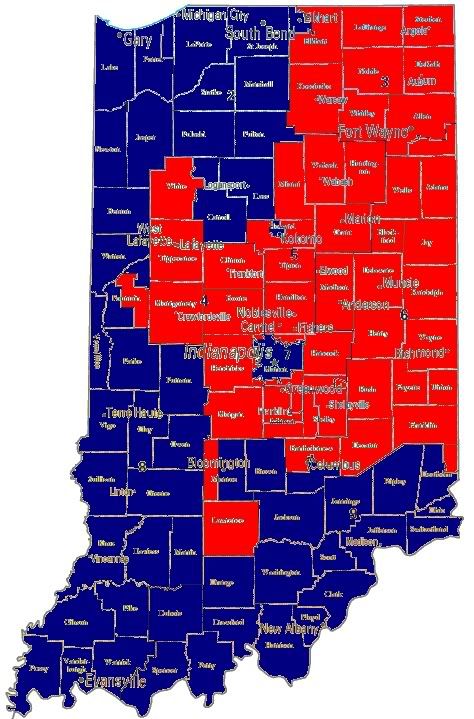
Of the 1,641,726 votes cast in the 2006 US House races in Indiana, 798,322 votes (48.5%) were cast for Democratic candidates, while 821,661 votes (50%) were cast for Republicans. Statwide this represents a 7.3% shift to Democrats from the 2004 US House vote. Democrats went from holding 2 seats (22.2%) with 41.3% of the vote in 2004, to holding 5 seats (55.5%) with 48.5% of the vote in 2006. Compared this to Ohio where Democrats took 52.4% of the vote yet won only 38.9% of the state’s congressional seats. The key difference is who controlled state government in 2001.
In Indiana Democrats drew the maps, while in Ohio Republicans where the ones who drew the lines. The sad truth is if Democrats hadn’t been packed into the IN-08 in anticipation of creating a super safe seat for a prominent Democrat who never ran, we probably could have taken another seat by drawing districts that packed Republicans into super Republican seats in the Indianapolis suburbs.
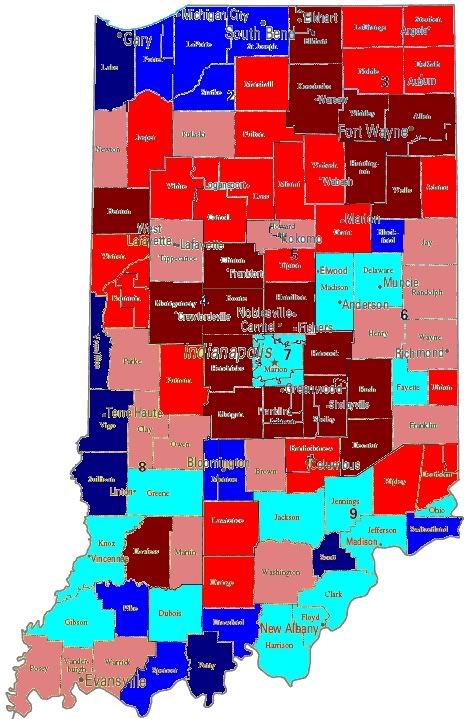
Voter Turnout by County, Indiana 2006 General
This map shows deviation from the statewide turnout at 37%
The darkest shade of red indicates a turnout of 10% or more below the state average, medium red 10%-5%, pink less than 5% below, light blue less than 5% above, medium blue less than 10% above, dark blue more than 10% over the state average.
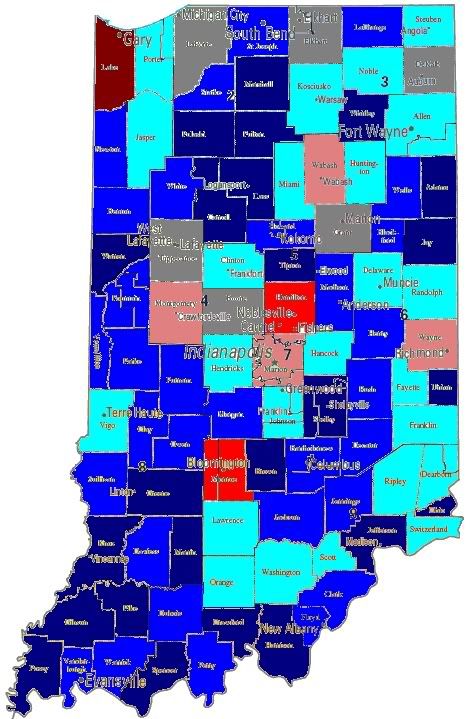
As the map shows turnout was strongest in the IN-08 and IN-02 where Democrats defeated Repubican incumbents, and weakest in Lake County, a Democractic stronghold, and Marion county where Julia Carson was faced blowback from revealing her opponent’s police record for domestic abuse and voting machine problems that led to some precincts not opening for several hours. Given the nature of the economy in Indianapolis, voters were most likely disnefranchised because they were unable to vote before their 8-9 AM start time at work. This may have contributed to the extremely narrow defeat (7 votes, pending recount) of incumbent Democratic State Representative Ed Mahern to an up start Republican challenger in HD-97 on Indianapolis’s south side. Especially ironic is that Mahern is the man who was in charge of drawing the Congressional and state House maps in 2001. He did a good job, and even more so the nameless staffer who made our victory in 2006 possible with good maps.
Looking at our 3 victories in Indiana we see that for Congressional races, the Hoosier state is a swing state.
In the IN-02, Democrat Joe Donelly defeated Republican incument Chris Chocola by 15,213 votes (7.9%), a 9.4 % improvement over the share of the vote Donelly took in 2004.
In the IN-08, Democrat Brad Ellsworth, former Vanderbugh county (Evansville) sherriff, blew away Republican incument John Hostetler winning by 45,593 votes (21.4%), a 16.1% improvement over the share the 2004 Democratic candidate took. The next time Hostettler gets the bright idea to take a gun onto a plane, I suppose he’ll get a gloved hand up his ass like the rest of us would if we were that fucking arrogant.
In the IN-09, Baron Hill is the once again Democratic representative, taking back his seat from Republican incumbent Mike Sodrel with a 9,734 vote margin (4.4%), a 1% improvement over his performance in 2004. You can thank the Libertarian party for this one. If not for the 9954 votes taken by the Libertarian candidate, Hill would almost certainly have lost. This is why we need to focus less on pretending that Democrats are Libertarians, and recognize them for what they are. Useful idiots. I’m all for supporting Libertarian candidates running against Republican incumbents, because when the hard truth is revealed and Republican voters realize their candidates are arrogant and incompetent the Libertarians will be there to give them a way to vote without giving the Republican a vote. Useful idiots, enough said.
The following map shows Democratic 2006 gains over their 2004 Democratic performance in the district (in % terms), improvements of less than 5% will be displayed in light blue, under 10% in the darker blue, and over 10% in the darkest blue. Republican gains will be shown in the same manner, with the light red signifying a gain of less than 5% and so on.
Looking more closely at the margin of victory in 2006 races, Democratic defends and pickup opportunities emerge, the following map displays the margin of victory in 2006 races. The deepest blue represents and Democratic margin of victory over 10%, the medium color represent more than 5%, while the lightest blue indicates that the Democratic candidate won by less than 5%. Corresponding measures of Republican victory margins display progressively darker shades of red at the same intervals.
What emerges is a map to guide our 2008 strategy. In this series I have created a race tier system that is I will explain in the next few sentences. Tier 0 races are those where the Democratic candidate won by a margin of less than 5%, the presumption being that incumbency grants an advantage of 5-10% that with the fundraising advantage that comes with holding office should be sufficient for these candidates to defend their seats without funding from the party. The assumption that incumbency gives a 5-10% advantage drives the classification of the pickup categories. Tier 1 races are those where the incumbent won by less than 5% in 2006, while tier 2 races are those where Republicans won by less than 10%. It’s really quite simple.
Tier 0
Race D% R% Margin 2006 D Cand.
IN-09 50.0 45.5 4.4 Baron Hill
Tier 1
Race D% R% Margin 2006 D Cand.
No races meet the criteria for this tier.
Tier 2
Race D% R% Margin 2006 D Cand.
IN-03 45.7 54.3 8.6 Dr. Tom Hayhurst
Before I close for the day, I’d like to give you a peek into some deeper measures that take alot of time and effort to calculate. First, I’d like to dispel a Kossack myth.
Presidential Vote≠Party Vote
This has to be the single worst myth I see circulating here, and it’s incredibly destructive because it fuels a mentality that we can’t compete in districts that voted for President Bush. Ignoring that many indepedent voters who go for local Democrats are turned off when the Democratic party gives them the scion of an elite East Coast family that doesn’t know to carry his own fucking bird out of the forest but does windsurf.
Beyond that there’s a deeper phenomena at work here. The Presidential race is the single most salient race in the the US, most voters have at least some clue to the positions of the candidate and th principal determinant of vote choice is the person and not the party. Because voters are given lots of free inforation about the candidates that they can’t help but come into contact with they know who they are voting for (or against). Downticket most voters have no friggin clue what the the state auditor does, let alone what the relevant positions are. The have no idea who they are voting for, they use the party id to decide. This is why this is the most relevant measure of base partisanship, and why the Cook Report PVI is deeply flawed. This tells us how voters will vote if they know nothing about the candidates other than their names, which many voters do well into October.
I’ve constructed a measure of base partisanship using 2006 Indiana election data at the county level. The measure, 3DMEAN, is the mean of the Democratic % in the Auditor, Secretary of State, and Treasurer races. The state as a whole has a base Democratic parisanship of 47%. To keep things simple I’ve used the same color coding I used on the margin maps. The darkest shade of red indicates a Democratic base partisanship of less than 40%, medium red 40-45%, pink 45-50%, light blue 50-55%, medium blue 55-60%, dark blue more than 60%.
Top 5 Democratic Counties
CTY County Seat 3DMEAN
Lake Crown Point 67%
Vermillion Newport 67%
Perry Tell City 66%
Sullivan Sullivan 63%
Scott Scottsburg 61%Bottom 5 Democratic Counties
CTY County Seat 3DMEAN
Boone Lebanon 28%
Hamilton Noblesvilee 28%
Kosciusko Warsaw 30%
Hancock Greenfield 32%
Montgomery Crawfordsville 34%
From this two major phenomena emerge. Much to the suprise of non-Hoosier, the Democratic credentials of rural Southern Indiana emerge, while the ring of death that surrounds Indianapolis and consumed Fort Wayne attacs the idea that Democrats can compete in the suburbs but not in rural America. Another big suprise for many people is just how much Democratic strength there is in the IN-06 where two light blue counties (Madison/Anderson and Delaware/Muncie represent around half the registered voters in the district. And unlike the deep red in other areas, the other counties of the IN-06 lean GOP by less than 5%. However, Democratic candidates have consisently underperformed here as a result of low name recognition and low funding.
Below is a map detailing the deviation between Congressional vote percentages and the 3DMEAN, showing the degree to which the Democratic Congressional candidate under or overperformed the county base Democratic partisanship. Dark red is -10% or more, medium red -5% to-10%, light red 0 to -5%, light blue to +5%, medium blue +5 to +10%, and dark blue +10% or more.
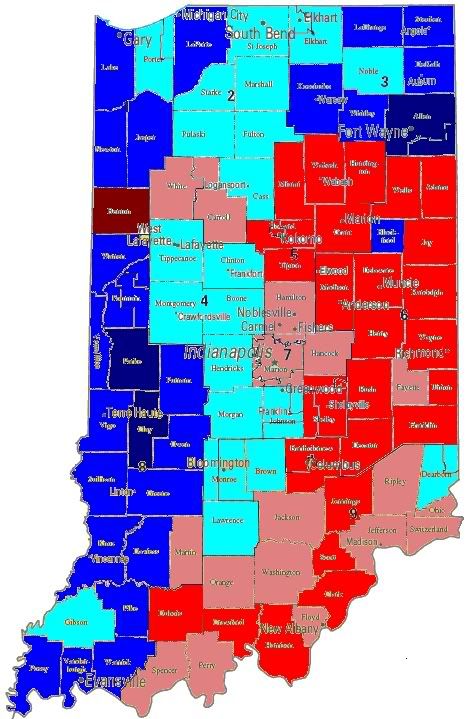
Democrats overperformed in most of the districts we won as well as the IN-03, and IN-04, while they underperformed in the IN-05, IN-06, and IN-09. Underperformance in the IN-05, and IN-06 can be discounted by noting that Democratic challenegers were extremely poorly funded in these areas. In the IN-06 Barry Welsh was outspent more than 20 to 1 by Mike Pence. What is truly disspointing is the piss poor performance of Baron Hill in the IN-09 where he underperformed in almost all of the counties. 2006 was an anti-incumbent wave in Indiana, and it nearly cost Julia Carson and Baron Hill their elections. Hill represented his district for 6 years before being defeated in 2004. Hill’s problem is that even after spending more than a million dollars he can’t get Democrats to vote for him. For this reason it’s entirely plausible than Hill will need to be kept alive by the party in 2008.
On a happier note, I want to point out that in contrast to being a surge that we can’t match in 2008, the divergence between Democratic partisanship and performance measures in the IN-06, and the close election this year in the IN-03 show that we have room to grow. During the early 1990s both areas were represented by Democrats Phil Sharp, and Jill Long, respectively. What we’ve done is 2006 in Indiana is take us back to the place we were in 2000, if we keep pressing we can go back to where we were in 1992.
And finally the running totals for the series.
Tier 0
CT-02, NY-19, NH-1, IN-09
Tier 1
CT-04, NJ-07, NY-25, NY-26, NY-29, OH-2, OH-15, PA-06,
Tier 2
OH-01, PA-15, IN-03
States Covered
CT, IN, MA, MD,ME, NH, NJ, NY, OH,PA, RI, VT