SSP Daily Digest: 4/28 (Part Deux)

Other Races:

Philly Mayor: Even though several labor organizations endorsed his crazy ex-con nobody of an opponent, Philadelphia’s largest union, the Federation of Teachers, came out for incumbent Michael Nutter earlier this week. But Nutter’s been having problems with the municipal unions, with the city’s white collar union (known as District Council 47… I’ve always wondered where they get these numbers) declining to endorse. (Several others have either backed Milton Street or no one at all.)

Wisconsin Recall: As expected, Democrats filed signatures against Rob Cowles, making him the sixth Republican to face a possible recall election. Republicans have filed against three Dems and missed the deadline against three others. Meanwhile, the state’s Government Accountability Board asked a judge to give them more time to review the petitions, which would allow the agency to consolidate the elections on July 12. However, the MSNBC article linked first in this bullet suggests the elections may not take place until the fall.

WI Sup. Ct.: Under state law, the Supreme Court recount must be completed very quickly, by May 9. It’s apparently only the third statewide recount in Wisconsin history. The most recent one took place in 1989… and the one before that in 1858! Unsurprisingly, things are off to a bumpy start in Waukesha, though fortunately the now-notorious Kathy Nickolaus has recused herself from the process.

Grab Bag:

EMILY: EMILY’s List announced its first four endorsements of the cycle: Ann Kirkpatrick (AZ-01), Lois Frankel (FL-22), Christie Vilsack (IA-04), and Ann McLane Kuster (NH-02).

Pennsylvania: PPP did something on their new PA poll that I like, and that I hope we’ll see more of: They included a statewide generic House ballot, which in this case showed respondents favoring Dems by a 42-36 margin, despite weak numbers for Obama.

Town Halls: With Congress on recess and members back home doing town halls, we’re seeing some turnabout from the summer of 2009, with motivated liberals showing up to castigate Republicans for their votes to kill Medicare. Ordinarily, this would be the sort of topic we’d love to cover in the Daily Digest, but the good news/bad news is that there are just too many of them for us to keep track of. What’s more, other outlets are doing a great job of covering them, like ThinkProgress and the DCCC.

Redistricting Roundup:

Michigan: We’ve been saying this for some time ourselves, but now the MI state lege is hearing it, too: In order to preserve Detroit’s VRA seats, a redistricting expert for the legislative black caucus agrees that new district lines will have to be drawn that cross the traditional “8 Mile” boundary separating the city of Detroit from its suburbs. Michigan’s maps must be complete by Nov. 1.

Missouri: Republicans finally reached an agreement on a map at the 11th hour, sending it to Gov. Jay Nixon. (You can see the new map here.) Democrats in the state House are urging Nixon to veto the plan, where the map fell 13 votes short of a veto-proof majority. The governor has not yet said what he’ll do, but there’s also a dispute brewing as to whether the legislature will be even able to schedule an over-ride vote this session, or if they’ll have to wait until September.

Nevada: Republicans have released their proposed maps, which you can find here. Democrats will put theirs out later today. Anjeanette Damon describes the congressional map as a 2-2 plan, but you be the judge.

Texas: Score one for Rep. Lloyd Doggett: He snarfed up a copy of what he believes is the congressional map that Republican congressmen have proposed to leaders of the legislature. A copy is here (PDF). An unnamed source tells the Austin Statesman that they think the map is out-dated, but that Republican plans for splitting Travis County (home of Austin) four ways, as shown by the map, are in fact correct.

Virginia: Well, it sure sounds like the Democrats have caved on the Virginia Senate map. A deal is reportedly done, and the key changes are summarized by the Richmond Times-Dispatch as follows:

Under the deal, the proposed new Democratic-leaning district in the Richmond area would be eliminated, according to Sen. John Watkins, R-Powhatan. Republicans would lose one of two senators in Virginia Beach and new districts would be created in Loudoun County and east of Lynchburg.

Also, the idiot Democrats in the House voted yet again for the newest Republican gerrymander (which makes mostly cosmetic changes). How stupid are these people? You don’t fucking vote for the other side’s gerrymander. I mean, it was one thing to act like this the first time around, when it appeared a multi-way deal was in place. But now these schmucks are like chickens voting to elect Col. Sanders. Hope you enjoy getting dipped in 11 herbs and spices and getting deep-fried to your doom, morans.

d’Hondting Pennsylvania

This diary attempts to somewhat futilely mash together recent Pennsylvanian federal election data with the d’Hondt method of proportional representation, just for kicks.

Lately Pennsylvanians have been a swingin’ crowd. The House delegation went from a Democratic disadvantage of 7-12 in the 109th to a majority of 11-8 in the 110th, which then hit 12-7 in the 111th before snapping back to 7-12 in the 112th. In the Senate, the same four congresses brought two Republican Senators, a Republican and a Democrat, two Democrats (sort of), and now a Democrat and a Republican again. It’s emotionally exhausting. And now I’m stuck with Tom Marino and Pat Toomey.

After reading about the recent Finnish parliamentary elections, I wondered how their Nordic variety of open party list, highest averages seat allocation would work if applied to a bothersome dummymandered state like Pennsylvania. Thus inspired, I applied the d’Hondt method, which they use in Finland, to the 2008 and 2010 election results. The d’Hondt method metes out seats according to party vote totals across a large jurisdiction — a state, in the US.  There would be no general election districts and no first past the post (FPTP) competitions.

Without districts, Pennsylvania’s parties would nominate a list of 19 candidates. In an open party list system like Finland, the party’s full list is shown on every ballot, and the electorate votes for a specific candidate on the list. That vote counts toward the party as a whole but also the candidate’s ranking on the party list. For this exercise, both parties have conveniently decided to select their list of 19 candidates through regional primaries in jurisdictions that just happen to match up with with the 19 current House districts. Thanks, imaginary parties. An alternative might be statewide primaries with the first-19-past-the post making the list. Of course, the primary campaigns would have been different under such circumstances, but let’s not worry about that just yet.

The 2008 election

In 2008 Democrats won a new seat, with Kathy Dahlkemper taking PA-03. Does the Obama wave wash another seat up on the shore with proportional representation? For now let’s imagine that voters were given a ballot with all of the Democratic and GOP candidates and chose the exact same candidate that they did on actual election day 2008.

Here’s the Democratic party list:


List rank Primary district Total votes Candidate
1 PA-02 276,870 FATTAH, Chaka
2 PA-01 242,799 BRADY, Bob
3 PA-14 242,326 DOYLE, Mike
4 PA-07 209,955 SESTAK, Joe
5 PA-08 197,869 MURPHY, Patrick
6 PA-13 196,868 SCHWARTZ, Allyson
7 PA-17 192,699 HOLDEN, Tim
8 PA-04 186,536 ALTMIRE, Jason
9 PA-06 164,952 ROGGIO, Bob
10 PA-10 160,837 CARNEY, Chris
11 PA-12 155,268 MURTHA, Jack
12 PA-03 146,846 DAHLKEMPER, Kathy
13 PA-11 146,379 KANJORSKI, Paul
14 PA-15 128,333 BENNETT, Sam
15 PA-16 120,193 SLATER, Bruce
16 PA-18 119,661 O’DONNELL, Steve
17 PA-05 112,509 MCCRAKEN, Mark
18 PA-19 109,533 AVILLO, Philip
19 PA-09 98,735 BARR, Tony

Notably, FPTP losing candidate Bob Roggio (who challenged Jim Gerlach) received more votes than FPTP winning candidates Chris Carney, Jack Murtha, Kathy Dahlkemper and Paul Kanjorski. There were quite a few wasted Democrat votes in eastern Pennsylvania. In western Pennsylvania, Murtha won convincingly with 57.9% in his FPTP race but received an underwhelming number of actual votes in his underpopulated district.

Now the Republican party list:


List rank Primary district Vote total Candidate
1 PA-19 218,862 PLATTS, Todd
2 PA-18 213,349 MURPHY, Tim
3 PA-15 181,433 DENT, Charlie
4 PA-06 179,423 GERLACH, Jim
5 PA-09 174,951 SHUSTER, Bill
6 PA-16 170,329 PITTS, Joe
7 PA-05 155,513 THOMPSON, Glenn
8 PA-04 147,411 HART, Melissa
9 PA-08 145,103 MANION, Tom
10 PA-07 142,362 WILLIAMS, Craig
11 PA-03 139,757 ENGLISH, Phil
12 PA-11 137,151 BARLETTA, Lou
13 PA-10 124,681 HACKETT, Chris
14 PA-12 113,120 RUSSELL, William
15 PA-17 109,909 GILHOOLEY, Toni
16 PA-13 108,271 KATS, Marina
17 PA-02 34,466 LANG, Adam
18 PA-01 24,714 MUHAMMAD, Mike
19 PA-14 0 None

In 2008 Republicans didn’t oppose Mike Doyle, which is a bit inconvenient for this exercise, so there are only 18 candidates on their list. The seven Republicans who won their FPTP races in 2008 hold the top seven party list spots. But Melissa Hart, who lost her FPTP contest with 44.1%, is not too far behind Glenn Thompson, who won his with 56.7%. Coincidentally, FPTP opponents Jason Altmire and Melissa Hart both hold the eighth slot on their party lists.

In total, Democratic candidates won 3,209,168 votes, and Republicans received 2,520,805 votes. Third party candidates did not receive enough votes to matter. The seats would be distributed thus:


House seat Allocation value Party Party seat Candidate elected
1 3,209,168 Dem 1 FATTAH, Chaka
2 2,520,805 GOP 1 PLATTS, Todd
3 1,604,584 Dem 2 BRADY, Bob
4 1,260,403 GOP 2 MURPHY, Tim
5 1,069,723 Dem 3 DOYLE, Mike
6 840,268 GOP 3 DENT, Charlie
7 802,292 Dem 4 SESTAK, Joe
8 641,834 Dem 5 MURPHY, Patrick
9 630,201 GOP 4 GERLACH, Jim
10 534,861 Dem 6 SCHWARTZ, Allyson
11 504,161 GOP 5 SHUSTER, Bill
12 458,452 Dem 7 HOLDEN, Tim
13 420,134 GOP 6 PITTS, Joe
14 401,146 Dem 8 ALTMIRE, Jason
15 360,115 GOP 7 THOMPSON, Glenn
16 356,574 Dem 9 ROGGIO, Bob
17 320,917 Dem 10 CARNEY, Chris
18 315,101 GOP 8 HART, Melissa
19 291,742 Dem 11 MURTHA, Jack
20 280,089 GOP 9 None (MANION, Tom)
21 267,431 Dem 12 None (DAHLKEMPER, Kathy)
22 252,081 GOP 10 None (WILLIAMS, Craig)

Democrats win 11-8 rather than 12-7 under FPTP. The Obama wave fails to bring in new seats, and d’Hondt limits Republican losses. Democrats Kathy Dahlkemper and Paul Kanjorski miss out on the seats they won in FPTP, and Democrat Bob Roggio and Republican Melissa Hart take their spots.

As a result, there are no representatives from PA-03 and PA-11, the northwest and the northeast, while there are two each from PA-04 and PA-06, in the Pittsburgh and  Philadelphia suburbs. The FPTP data favor districts with high turnout and close races over modest winning candidates in low turnout and low population districts.

But

Of course, there are several huge and massive and very large flaws with this exercise.

For one, Republicans certainly would have fielded a full party list of 19 candidates, since every vote helps the party. But the Republican list would have needed an additional 104,882 votes for Tom Manion to pass Jack Murtha. The missing Republican in Doyle’s Pittsburgh district was succeeded by a candidate in 2010 who failed to clear 50,000. Even with the increased 2008 presidential turnout, it seems unlikely that a Republican would have won 100,000 votes in central Pittsburgh. (PA-14 representatives went unchallenged in 2000 and 2004, so there’s no good reference.)

It is also unlikely that parties would use geographic primary districts in the first place, at least not in the same configuration as current congressional districts.

But the more glaring issue is that candidates would campaign differently under a proportional system, and many voters would have selected different candidates on their party list or a more palatable candidate from the other list.

Campaigns would probably be centered on media markets. The candidates in PA-01, PA-02, PA-06, PA-07, PA-08 and PA-13 would campaign in “greater Philadelphia” and compete for many of the same votes, while candidates in PA-10 and PA-11 would campaign in “northeast Pennsylvania.” A cursory scan suggests that the only big media market base splits are for the PA-03 and PA-12 candidates. The discrete media market of the Lehigh Valley would be virtually guaranteed a representative.

Without head to head competitions, voters would be free to find their best ideological fit in what might otherwise be a “lesser of two evils” situation. I’m not sure how this would pan out for the Blue Dogs or “moderate” Republicans. Independent voters in PA-11 who supported Lou Barletta over unpopular incumbent Paul Kanjorski would have had other Democratic options like Chris Carney.  

Also, candidates with demographic advantages or clear ideological differentiation could perform better within party lists by grabbing same-party votes from other parts of the state. Schwartz, Dahlkemper and Hart might benefit from the dearth of women on the ballot. Doyle would likely earn progressive votes from Altmire’s district, while Altmire could win more conservative Democrats from Doyle’s district. Similarly, Republicans turned off by Pitts could have switched their votes to a more palatable option like Platts or Gerlach.

There would also be the question of ordering the party list. In the Democratic party, the urban politicians would probably be ranked first, regardless of whether the metric is seniority, primary vote totals or power broker decision-making. On the Republican side I’m less clear who would benefit. But high ballot position would be an advantage.

So, yes, there are huge problems with applying data collected from one type of election to a completely different system. If this method were actually implemented in the 2008 election, I imagine the primaries would have produced a Democratic party list with an eastern urban/suburban bias and a Republican list with at least a couple strong urban candidates — the wealthy businessmen and lawyers who live in cities but aren’t stupid enough to run in Democratic strongholds under FPTP.

An 11-8 party split sounds reasonable in 2008, but the big city/suburban to small city/rural split could approach something like 14-5.

The 2010 election

In 2010 four Democratic incumbents lost and Republicans flipped a Democratic-held open seat. Proportional representation buffered the 2008 Obama wave — what about the 2010 tea tsunami?

Here is the Democratic party list:


List rank Primary district Vote total Candidate
1 PA-02 182,800 FATTAH, Chaka
2 PA-01 149,944 BRADY, Bob
3 PA-14 122,073 DOYLE, Mike
4 PA-07 118,710 SCHWARTZ, Allyson
5 PA-17 118,486 HOLDEN, Tim
6 PA-08 113,547 MURPHY, Patrick
7 PA-04 110,631 ALTMIRE, Jason
8 PA-07 106,536 LENTZ, Bryan
9 PA-06 100,493 TRIVEDI, Manan
10 PA-12 94,056 CRITZ, Mark
11 PA-10 89,846 CARNEY, Chris
12 PA-11 84,618 KANJORSKI, Paul
13 PA-15 79,766 CALLAHAN, John
14 PA-18 78,558 CONNOLLY, John
15 PA-03 77,562 DAHLKEMPER, Kathy
16 PA-16 70,994 HERR, Lois
17 PA-19 53,549 SANDERS, Ryan
18 PA-05 52,375 PIPE, Michael
19 PA-09 52,322 CONNERS, Tom

The Democratic list doesn’t change too much from 2008 to 2010. But FPTP winner Mark Critz brought in fewer votes than the three Philly area candidates who lost their FPTP races, and Kathy Dahlkemper drops down close to “some dude” territory. It’s clear that the Democratic list is powered by the east, where blue votes are squandered in relatively close FPTP losses and massive FPTP wins.

Now for the Republican list:


Seat rank Primary district Votes Candidate
1 PA-19 165,219 PLATTS, Todd
2 PA-18 161,888 MURPHY, Tim
3 PA-09 141,904 SHUSTER, Bill
4 PA-07 137,825 MEEHAN, Patrick
5 PA-16 134,113 PITTS, Joe
6 PA-06 133,770 GERLACH, Jim
7 PA-08 130,759 FITZPATRICK, Mike
8 PA-05 127,427 THOMPSON, Glenn
9 PA-10 110,599 MARINO, Tom
10 PA-15 109,534 DENT, Charlie
11 PA-11 102,179 BARLETTA, Lou
12 PA-04 99,867 ROTHFUS, Ketih
13 PA-17 95,000 ARGALL, Dave
14 PA-13 91,987 ADCOCK, Dee
15 PA-12 91,170 BURNS, Tim
16 PA-03 85,384 KELLY, Mike
17 PA-14 49,997 HALUSZCZAK, Melissa
18 PA-02 21,907 HELLBERG, Rick
19 PA-01 0 None

In 2010 Republicans again fielded only 18 candidates, with Bob Brady getting a free ride. Charlie Dent drops from 3rd on the party list in 2008 to 10th in 2010. I guess he benefited from Obama surge ticket splitters in the Lehigh Valley? Or just less tea fuel in 2010. Patrick Meehan does very well, besting Philly suburb veterans Jim Gerlach and Mike Fitzpatrick.  Mike Kelly, who won a seat in FPTP, occupies the 16th spot on the list, below four FPTP losers. Somehow he got fewer votes than Allyson Schwartz’s opponent. PA-03 really got wiped out in this election.

In total, Democrats won 1,860,644 votes and Republicans won 1,990,529. The third party vote was again not big enough to matter. The seats are allocated thus:


House seat Allocation value Party Party seat Candidate elected
1 1,990,529 GOP 1 PLATTS, Todd
2 1,860,644 Dem 1 FATTAH, Chaka
3 995,265 GOP 2 MURPHY, Tim
4 930,322 Dem 2 BRADY, Bob
5 663,509 GOP 3 SHUSTER, Bill
6 620,214 Dem 3 DOYLE, Mike
7 497,632 GOP 4 MEEHAN, Patrick
8 465,161 Dem 4 SCHWARTZ, Allyson
9 398,105 GOP 5 PITTS, Joe
10 372,128 Dem 5 HOLDEN, Tim
11 331,754 GOP 6 GERLACH, Jim
12 310,107 Dem 6 MURPHY, Patrick
13 284,361 GOP 7 FITZPATRICK, Mike
14 265,806 Dem 7 ALTMIRE, Jason
15 248,361 GOP 8 THOMPSON, Glenn
16 232,581 Dem 8 LENTZ, Bryan
17 221,169 GOP 9 MARINO, Tom
18 206,738 Dem 9 TRIVEDI, Manan
19 199,052 GOP 10 DENT, Charlie
20 186,064 Dem 10 None (CRITZ, Mark)
21 180,957 GOP 11 None (BARLETTA, Lou)
22 169,149 Dem 11 None (CARNEY, Chris)

Republicans win the first seat and alternate with Democrats afterwards, for a close split of 9-10 in favor of the GOP. Proportional representation helps keep down Democratic losses; although four FPTP incumbent Democrats still lose, the party overall does two seats better than under FPTP.  Carney, Kanjorski and Dahlkemper still don’t make the cut, but the fourth candidate out is Critz rather than Patrick Murphy. In fact, Patrick Murphy wins the 12th seat just ahead of the Republican who beat him under FPTP. Lentz and Trivedi, also FPTP losers, win seats as well.

The unlucky Republicans are Lou Barletta and Mike Kelly, while Charlie Dent, who got the 6th seat in 2008, just squeaks by with the 19th seat.

Manan Trivedi wins the 18th seat despite having fewer votes than Charlie Dent or Lou Barletta, the two Republicans immediately below him; the padding provided by competitive lower candidates like Critz, Carney, Kanjorski, Callahan et al was enough to compensate for his  modest vote count. Although Brady lacked an opponent in this election, the Republicans were very far from winning their 11th seat at the expense of the Democrat’s 9th seat.

Following the election of this group of candidates, there are no representatives from PA-03, PA-11, and PA-12 while there are two representatives each from PA-06, PA-07 and PA-08. The west and the northeast seats migrate to the Philly suburbs, basically. It’s worth noting that the threshold for Seat 19 is only 199,053. Several strong Libertarian (or other third party) candidates could plausibly round up enough votes (~10,000 per primary district) to seat one of their own in congress.

Given the flawed data, this system appears to effectively moderate swings and realign geographic representation in Pennsylvania, which is probably what would happen in similar states like Illinois, Ohio and Michigan. Bye bye, Joe Walsh? But then Massachusetts, for example, would have Republican representation, and Democrats could probably win additional seats in South Carolina and Louisiana. Third parties would also have a decent shot at a seat in big states like California and Texas. One unattractive feature for mappers: decennial reapportionment would be as simple as cutting one slot off the list in Pennsylvania. But otherwise it seems like it could be fun.

CT, OH, and PA: Population by CD

Today is the flipside of yesterday’s California release: states with stagnant populations and a bunch of old white people. We’ll start with Connecticut, which is certainly characterized by stability: it easily retained five seats, not being particularly near either the cusp of gaining or losing, and even its five districts are pretty close to in balance with each other. Its target is 714,819, up from 681K in 2000.


District Population Deviation
CT-01 710,951 (3,868)
CT-02 729,771 14,952
CT-03 712,339 (2,480)
CT-04 706,740 (8,079)
CT-05 714,296 (523)
Total: 3,574,097

Ohio is one of only a couple states to lose two seats, taking it from 18 down to 16. Its new target is 721,032, up from about 631K in 2000. The state as a whole didn’t lose population (gaining 183,364), but seven of its districts did (the 1st, 5th, 6th, 9th, 10th, 11th, and 17th). The Columbus area was the only part of the state that seemed to experience robust growth; in fact, despite the state losing two seats, the 12th (a swing district held by GOPer Pat Tiberi) will actually need to shed population… much of the state’s growth is accounted for in the growth in the 12th.

The numbers today don’t really change the overall redistricting equation: one of the northeastern Ohio Democrats is clearly going to have to go, and while the Akron-area 13th (held by Betty Sutton) actually gained some population unlike its neighbors, it may be the one that gets dissected simply by virtue of being in the very middle (with the 9th pressuring it from the west, the 10th and 11th from the north, and the 17th from the east). As for which GOPer gets cut, I’d expected it to be one of Bill Johnson (in the 6th) or Bob Gibbs (in the 18th), but the 18th, despite its mostly rural, Appalachian flavor, seemed to hang in there better than expected, population-wise. Now I’m wondering if Bob Latta’s 5th in the rural northwest, which is going to be pressured by the 9th to its north and the 4th to its east, may be a more natural target. Or here’s another possibility (made likelier by the possibility that the local GOP might like rid themselves of a liability in the form of Jean Schmidt): the 2nd might be targeted, despite its decent numbers, as both the 1st to its west and the 6th to its east need to gain a ton of people (and extending the 1st east into red, suburban Clermont County would make GOPer Steve Chabot’s life easier).


District Population Deviation
OH-01 598,699 (122,333)
OH-02 673,873 (47,159)
OH-03 640,899 (80,133)
OH-04 632,771 (88,261)
OH-05 627,799 (93,233)
OH-06 623,742 (97,290)
OH-07 683,371 (37,661)
OH-08 663,644 (57,388)
OH-09 619,010 (102,022)
OH-10 599,205 (121,827)
OH-11 540,432 (180,600)
OH-12 756,303 35,271
OH-13 649,102 (71,930)
OH-14 648,128 (72,904)
OH-15 681,557 (39,475)
OH-16 644,691 (76,341)
OH-17 600,111 (120,921)
OH-18 653,167 (67,865)
Total: 11,536,504

Pennsylvania’s target is 705,688 based on the drop from 19 to 18 seats, up from about 646K in 2000. The 2nd, 3rd, 12th, and 14th all lost population. I’d really recommend looking at the Census Bureau’s interactive map of Pennsylvania, as it shows exactly what’s going on: the eastern half of the state gained a bit, while nearly every county in the state’s western half outright lost population. In fact, there were enough gains in the east that four districts wind up needing to shed population: the 6th and 15th in the Philadelphia suburbs/exurbs, and the more rural, Pennsylvania Dutch-flavored 16th and 19th. These are all Republican-held districts, but these are all districts that moved sharply in the Dem direction from 2004 to 2008, while on the other hand, the shrinking western districts are Democratic areas but ones where the overall trend has been away from the Dems. (Interestingly, two cities that over recent decades came to symbolize dead northeastern industrial centers, Allentown and Reading, are actually rebounding, gaining around 10,000 people each and helping to grow the 15th and 16th respectively. Much of the growth in those two cities, though, as well as the small growth experienced in Philadelphia, is Hispanic.)

With the GOP in control of the redistricting process in Pennsylvania and the population losses heavily concentrated in the Pittsburgh area, it looks like the axe is going to fall heavily on fairly-new Dem Mark Critz in the odd-shaped 12th, which was designed to be a friendly district for John Murtha cobbling together Cambria County with the Dem-friendly parts of Pittsburgh’s collar counties but is barely holding onto its Dem roots these days. Mike Doyle’s 14th (in Pittsburgh proper), despite being the biggest population loser, is probably going to stay intact, as Republicans will need to concede at least one blue vote sink in the southwest (and probably get bluer, as it’ll need to expand into the dead steel towns of the Mon Valley to its south, currently the bluest part of the 12th).

If Critz wants to stick around, he’s likely to find himself either fighting Jason Altmire in a primary in the 4th or Tim Murphy in a general in the 18th (although Critz has enough of a Johnstown-area base that he might be able to pull out an upset in whatever district Johnstown winds up in, unless the GOP decides that the 9th, in the central part of the state, is red enough to safely absorb Johnstown).


District Population Deviation
PA-01 655,146 (50,542)
PA-02 630,277 (75,411)
PA-03 640,356 (65,332)
PA-04 647,418 (58,270)
PA-05 651,762 (53,926)
PA-06 726,465 20,777
PA-07 673,623 (32,065)
PA-08 672,685 (33,003)
PA-09 666,810 (38,878)
PA-10 669,257 (36,431)
PA-11 687,860 (17,828)
PA-12 612,384 (93,304)
PA-13 674,188 (31,500)
PA-14 584,493 (121,195)
PA-15 721,828 16,140
PA-16 723,977 18,289
PA-17 681,835 (23,853)
PA-18 653,385 (52,303)
PA-19 728,630 22,942
Total: 12,702,379

12-6 Democratic Pennsylvania Gerrymander

Last week, I looked at why a 12-6 Republican map was most likely.  This week, I’ll take a look at the converse – a 12-6 Democratic map.  

Although a pretty heavily Democratic state, it is hard to create enough safe seats for Democrats in Pennsylvania.  The reason is most Democratic votes are concentrated in Philadelphia.  Under the strictest interpretation of the VRA, it may be required to keep PA-1 majority-minority, and PA-2 majority black.

For Pennsylvania, I’d argue that a safe Democratic seat needs a PVI of D+5.  This is because the Republicans have been successful at holding down one D+4 seat all decade.  It was hard to draw all the eastern suburban districts to meet D+5 and maintain the two Philadelphia districts as listed above, but after some work, I came up with a good map. Two democratic districts have a lower PVI than this because they are outside of the region, but are as Democratic as the situation allowed.

I didn’t pay particular attention to the location of Democratic incumbents, quite honestly.  This map opens a lot of opportunities for Democrats, which I think outweighs any potential issues.  

Details below

PA-1

Majority-Minority (46% white – forgot to write down non-white breakdown)

76% Obama, 24% McCain (D+22)

This district swings dramatically to the North, taking in somewhat swingy parts of northeast, and with an arm going into Bucks county to take in some Republican-leaning suburbs.  Bob Brady doesn’t live here.  

PA-2

Majority black (51%)

87% Obama, 13% McCain (D+33)

The district becomes based in south Philadelphia, and takes in some more Republican-leaning areas of the city.  It’s still pretty Democratic however.  Unfortunately, there are no lily-white highly Republican areas nearby I could have swapped in.  

PA-3

58% Obama, 42% McCain (D+4)

One ugly district which draws in all the Democratic areas in the northwest and central portions of the state (State College, Johnstown, Erie, New Castle, Hermitage, etc).  This was the best PVI that could be managed for the district without poaching on PA-14 to some degree (which I wanted to avoid).  It should still elect a Democrat comfortably, given the PVI is calculated by Obama votes only, and he actually underperformed Kerry in certain parts of the district.  That said, given the rightward drift of much of the region, I wouldn’t be surprised if the PVI becomes closer by the end of the decade.  Still, Erie and State College are not turning to the right, so it’s hard to see the PVI slipping to less than even.  Call it a Lean D seat.  

PA-4

59% McCain, 41% Obama (R+13)

This is the first of the Republican voter sinks, drawing in most of the Republican areas in metro Pittsburgh.  Technically, Jason Altmire is the incumbent here, but he might want to move to PA-14 (which is now vacant) which should be a safe seat for him.  No Republican congressmen lives in the district, but it has a good deal of Tim Murphy’s old district, so he may decide to relocate.  

PA-5

60% McCain, 40% Obama (R+14)

This district absorbs Republican votes across a huge swath of Western Pennsylvania.  Mike Kelly lives here (barely), and he’d be wise to run for this seat.  

PA-6

59% Obama, 41% McCain (D+5)

The district is made more Democratic by a hair than Jim Gerlach’s old district.  While it might not defeat him immediately, given the trends of the region, along with the close elections he faced in 2004 and 2006, he should lose the seat within two or three election cycles.  

PA-7

59% Obama, 41% McCain (D+5)

The district draws in Democratic and heavily-black areas like Chester and Yeadon.  Joe Pitts lives here, but it is much less Republican than his old district, so he will likely be forced into retirement.  Pat Meehan lives just outside of the district now, in PA-6.  Given he’s a freshmen and dealing with a bigger swing than Gerlach, I’d say he’ll lose the seat immediately if he ran.    

PA-8

59% Obama, 41% McCain (D+5)

The district is made more Democratic by including some heavily-Democratic parts of Cheltenham and north Philadelphia.  Mike Fitzpatrick’s days are numbered.  

PA-9

63% McCain, 37% Obama (R+17)

Republican vote dump for the central Pennsylvania.  Bill Schuster is welcome to this seat.  

PA-10

58% McCain, 42% Obama (R+12)

This is the least Republican of their six planned seats, mainly because the eastern half of the district is pretty uniformly only narrowly Republican.  Still, it’s a boost for Tom Marino, or Lou Barletta – whoever wins the primary.  

PA-11

59% Obama, 41% McCain (D+5)

This district sheds much of the Wilkes-Barre area and instead takes on most of Northampton County, spitting Charlie Dent’s base in half.  It should be a safe district for the right sort of Democrat.  

PA-12

59% Obama, 41% McCain (D+5)

The district is somewhat reconfigured.  It continues to contain the more heavily-Democratic areas of rural southwestern PA down the mon valley, but also picks up Pittsburgh’s eastern suburbs, along with a few neighborhoods of Pittsburgh itself.  Mike Doyle lives here, so I’m guessing he runs for this district rather than PA-14, which is only marginally more Democratic.  

PA-13

59% Obama, 41% McCain (D+5)

Allyson Schwartz’s district becomes a little less Democratic, and becomes more exclusively focused on Montgomery county.  She should hold down the slightly more swingy district with little trouble.  

PA-14

61% Obama, 39% McCain (D+7)

The new PA-14 still contains most of Pittsburgh, but draws in swingy and Republican suburbs in the South Hills, and Democratic areas in Beaver County.  I resisted attempting to even the PVI of this and PA-12 to D+6, because there was no way to do so without putting even more of Pittsburgh into the 12th, to minimal effect.  No incumbent, but Jason Altmire would be smart to relocate here, and immediately position himself to the left.  

PA-15

59% Obama, 41% McCain (D+5)

Charlie Dent loses over half his base, gets a slightly more Democratic district, and gets Tim Holden (and a fair portion of his old base) drawn into it.  He’s toast.  

PA-16

55% Obama, 45% McCain (D+1)

All of the most democratic parts of York, Lancaster, and Dauphin counties are drawn into one district.  The PVI is close enough there is no guarantee that the district will elect a Democrat.  Indeed, PA-19’s Todd Russel Platts (who lives in York), is somewhat moderate and a good fit for the district ideologically).  The district will only be getting bluer however, as minority immigration to York and Lancaster has been quite high.  Thus it should be safely Democratic by the end of the decade – or sooner if an open seat.  

PA-17

61% McCain, 39% Obama (R+15)

An open Republican seat consisting of mainly the northern reaches of Pennsylvania Dutch Country and some mountains.  The bulk of the district was actually represented by Tim Holden previously, and not only does no Republican incumbent live there, but none even represented a large portion.  I’m unsure who would choose to run here.  

PA-18

63% McCain, 37% Obama (R+17)

The remainder of Pennsylvania Dutch country.  Again, there is no Republican incumbent, although theoretically both Joe Pitts and Todd Russel Platts may show some interest in the district.

Later, I’ll show my compact redistricting plan for the state.  Thoughts?    

PA – Why 12R, 6D will be the Republican’s choice

Over the past few weeks, I’ve seen numerous maps which have tried to draw Pennsylvania (where Republicans have total control) 13R-5D, or even 14R-4D.  After trying several maps out for myself, I’ve decided that aggressive action by the Republicans, while not impossible, will be foolhardy.

The 2000 Republican redistricting is remembered by some as a success, but in many ways, it was a failure.  PA-13 and PA-17 were both supposed to be Republican seats when drawn.  And as we all know, PA-3, PA-4, PA-8 and PA-7 ultimately were too Democratic to be held consistently through the decade.  

Republicans will surely wish to ensure that one Democratic incumbent loses their seat (most likely Mark Critz).  Knocking off Jason Altmire isn’t too difficult either – there are plenty of deep-red Republican areas to draw into his district, and western Pennsylvania outside of Pittsburgh is swinging to the right pretty rapidly.  However, eastern Pennsylvania has been trending towards the Democrats for just as long.  The Republicans now hold four Democratic-leaning districts in the east.  Not enough Democrats can be siphoned into PA-1, PA-2, and PA-13 to make the seats safe.  

Compounding the issue is Tim Holden.  He has been a formidable campaigner, repeatedly winning re-election in a Republican-leaning district.  Any attempt to trade his seat for a new safe D district scooping up Democrats the northeastern part of the state makes it uncomfortably possible the Republicans will hand the Democrats a free gimme and Holden will survive.

Therefore, I’ve decided a 12-6 breakdown is the best the Republicans can reasonably manage which protects almost all of their incumbents (barring a major scandal), for the remainder of the decade.  Really, a two-to-one margin for Republicans, given they have consistently lost the state on the presidential level since 1988, is pretty damn gerrymandered already – especially if they trade four somewhat unsafe seats for much safer ones.

In the end, I think the map will have these broad outlines:

1.  Eliminate Mark Critz’s seat.

2.  Move PA-12 to the Philly burbs.  It becomes a vote sink for Democratic areas which do not fit into the other three Philly-area districts.

3.  Make Tim Holden’s district as Democratic as possible, which will help shore up both PA-11 and PA-15 for incumbents.

4.  In order to ensure that no Republican incumbent loses a seat, Altmire has to go.  His seat gets dismembered, with his hometown in PA-14, but his base split between PA-18, PA-9, and PA-3.  Thus he’ll have to move, and face an uphill battle regardless.  PA-4 moves to Dutch Country and replaces PA-19.  

Here’s the statewide view.  All Republican incumbents keep their hometowns in their seats, from what information I could gather.  Some districts do change composition rather dramatically however, particularly in the east.  

Details by district:

PA-1

Minority-Majority (39% White, 34% Black, 19% Hispanic, 6% Asian)

82% Obama, 17% McCain (D+28)

I do not know Bob Brady’s exact address, so I am not sure if his home is in the district.  The district sheds its extension into Delaware county, and expands a bit into Northeast Philly.  Still highly safe of course.

PA-2

Majority Black (63% Black, 29% White, 4% Asian, 3% Hispanic)

90% Obama, 10% McCain (D+36)

Again, I am not sure of Chaka Fattah’s exact address, but the core of black west Philadelphia remains intact.  The district takes in predominantly black areas of Delaware county, and also a few heavily-Democratic white areas like Media and Glenolden which don’t fit well into PA-12.  

PA-3

53% McCain, 46% Obama (R+7)

The district sheds half of Erie, in order to become less Democratic, and picks up more Republican areas to the south which were formerly part of PA-4.  It does contain a fairly substantial part of Altmire’s old district, and is only marginally more Republican than his old district, but he would have to move to establish himself here.  

PA-4

56% McCain, 43% Obama (R+10)

This is really a replacement for the old PA-19.  It’s centered around Harrisburg, although Harrisburg itself is drawn into PA-10 in order to stop this district from being swingy.  Should remain a solid Republican seat.  

PA-5

53% McCain, 45% Obama (R+8)

This district migrates to the west, picking up half of Erie, along with some of the outer reaches of southwestern Pennsylvania.  It’s slightly more swingy than it was before with the inclusion of Erie, but should remain a solid Republican seat.  

PA-6

51% McCain, 48% Obama (R+5)

Marginal parts of Chester and Montgomery are shed, along with the city of Redding.  In exchange, it takes in more of rural Redding county, and the northern parts of Lancaster county.  Although the right Democrat could take this, it is a far safer district than it was.  

PA-7

52% McCain, 47% Obama (R+6)

Again, the district shifts west.  It takes on parts of Chester, Lancaster, and York counties, while shedding the most Democratic parts of Delaware, along with the salient into Montgomery.  This should be a fairly secure Republican seat.

PA-8

51% Obama, 48% McCain (R+3)

There were logical limits to how well this seat could be gerrymandered.  It has shed southern Bucks, and picked up in exchange the most Republican parts of Montgomery, along with a Republican-leaning strip of hills in the Lehigh.  However, this area is still very swingy and essentially surrounded by Democrats on all sides, making further improvement difficult.  Compounding issues, Mike Fitzpatrick is from Levittown, in the far south.  Levittown is not a real municipality, it is split across three different townships.  Given I didn’t know where precisely he lived, I decided to leave Middletown in PA-8, which is marginally less Democratic, while putting Bristol and Falls into PA-13.  Democrats will probably take this seat sometime during this decade if current trends continue, but it should be the Republicans’ only loss.  

PA-9

58% McCain, 42% Obama (R+11)

This district changes complexion dramatically, from being based in the Central PA mountains to being mainly based in the Pittsburgh exurbs, with a salient heading towards Johnstown and Altoona.  It is still heavily Republican.  Mark Critz finds himself in this district, and out of a job.  A small amount of Altmire’s old district is in PA-9 now, but I think it will be the least likely option for him to take.  

PA-10

53% McCain, 46% Obama (R+7)

The district moves to the west and south.  It is not an overwhelmingly Republican seat, due to the inclusion of State College and Harrisburg, but is still Republican enough to remain safe.  

PA-11

52% McCain, 46% Obama (R+7)

Much of the Wyoming valley has been shed, as it was too full of Democrats for Lou Barletta’s comfort.  In its place, much of the “Northeast woods” of the state have been added.  The district should be a pretty good fit for Lou Barletta’s moderate stances.  

PA-12

63% Obama, 36% McCain (D+10)

This entirely new district more or less follows the Schuykill River, picking up Democratic votes from Philly all the way to Redding.  It’s an interesting question who in the state house or senate will step forward to run for this seat.  

PA-13

63% Obama, 36% McCain (D+10)

The district retains a focus on Montgomery county, but sheds much of the northern parts of the county.  It also loses much of Northeast Philly, and gains lower Bucks.

PA-14

68% Obama, 31% McCain (D+14)

This district is not quite as Democratic as it could be, as it draws in a few Republican areas to ensure Jason Altmire will live in the district.  If the Republicans are lucky, he may try to primary Mike Doyle (although I think he would lose).  It is otherwise broadly similar to the old Pittsburgh-based district.  

PA-15

50% Obama, 49% McCain (R+4)

This is the other Republican district which could potentially be endangered.  The problem is incumbent Charlie Dent lives in heavily Democratic Allentown.  If I knew precisely where in Allentown he lived, I could shunt most of the city into PA-17, and probably improve the district to R+6 or R+7.

PA-16

57% McCain, 42% Obama (R+12)

This district, as odd as it seems looking at it, was not constructed mainly as a gerrymander.  The incumbent is unfortunately in Chester county, but the old base of Chester and Lancaster was needed in order to make PA-6 and PA-7 into solid Republican seats.  Thus the seat goes far, far to the west, traveling almost the entire length of the southern border of the state.  In southwestern Pennsylvania, it does helpfully sop up Democratic voters in the Mon valley who would otherwise cause issues for Tim Murphy.  

PA-17

61% Obama, 38% McCain (D+8)

Since it’s impossible to ensure Tim Holden is defeated, instead the new PA-17 packs in as many Democrats into his seat as possible.  The only old part of the seat is a small salient into Schuykill county to grab his hometown.  Indeed, it’s plausible he’d be vulnerable in a primary, but he’d have an easier time running as an unknown incumbent in an open seat primary than he would moving and picking more Republican PA-15 which has most of his old base.  My bet is he stays put.  

PA-18

53% McCain, 46% Obama (R+8)

The new PA-18 keeps most of Tim Murphy’s base in the South Hills of Pittsburgh intact.  It does shed Westmoreland county to PA-9, and takes in a good deal of the old PA-4.  The retention of Murphy’s base means Altmire would have trouble gaining traction here.  If the seat ended up open, he’d otherwise potentially be competitive.

Thoughts?

A 14-4 GOP (Dummy?)mander of PA

Following dramatic gains in the House of Representatives, I think most state legislatures controlled by the Republicans will try to be aggressively maximize their seats.  After 2008, we were proposing 28-0 maps of New York and assuming anything that went even slightly for Obama would be ours in perpetuity, so the Republicans are likely having similar thoughts now.  With that preface, I present my map of Pennsylvania.

The whole State

PA-05, Gold, 52%M 46%O

G.T. Thompson (R)

The 5th takes half of Erie, becoming more Democratic, but it had some room to spare.

PA-09, Cyan, 54%M 44%O

Bill Shuster (R) vs Mark Critz (D)

Johnstown is severed from the 12th district a lumped in with the more conservative 9th.  Critz may choose to run in the new 12th instead.

Southeast

PA-01, Blue, 85%O 14%M

Bob Brady (D)

This district shifts to the North some, losing the tentacle to Chester while grabbing white liberal areas in Delaware and Montgomery counties, but retails its Black plurality (43%).

PA-02, Green, 91%O 9%M

Chaka Fattah (D)

Still a Black majority district but less so (52%).  Gains some of the Hispanic parts of Philly, while losing some of West Philly to the 1st district.

PA-13, Salmon, 64%O 35%M

Allyson Schwartz (D)

Little known fact: The current 13th was drawn to be winnable by a Republican.  Not any longer.  The new form is quite sinuous, picking up as many dem areas in the Philly burbs as possible.  

PA-06, Teal, 51%O 48%M

Jim Gerlach (R)

While this district bears rather little in common with its former self, it is significantly more Republican than the old 6th which went 58% for Obama.

PA-07, Gray, 50%O 50%M

Pat Meehan (R)

We trade urban parts of Delaware county for some rural parts of Chester and Lancaster, making the district safer. It now went for Obama by only 127 votes.

PA-08, Periwinkle, 52%O 47%M

Mike Fitzpatrick (R)

Still a Bucks County centered district, it does some precinct swapping with the 13th to become marginally more Republican.

PA-16, Lime, 52%M 46%O

Joe Pitts (R)

The 16th now stretches from South Philly to Chambersburg.  Pitts will have to introduce himself to a lot of new voters, since most of his former territory has been moved to other districts.

PA-18, Yellow, 53%M 46%O

Todd Platts (R)

This district is actually a good fit for the moderate Platts, giving him the rapidly Bluing cities of York, Lancaster and Lebanon as well as some Conservative rural areas connecting them.

Northeast

PA-17, Indigo, 53%M 46%O

Open or Tim Holden (D)

In attempt to get rid of Holden, his home county (Schuylkill) is removed from the district and more conservative territory to the West is substituted.  He may choose to run here anyway or he may run in the 11th.

PA-15, Orange, 56%O 43%M

Charlie Dent (R)

The 15th is not strengthened or significantly changed since Dent rather effortlessly survived both ’06 and ’08.  If it ain’t broken, don’t fix it.

PA-11, Chartreuse, 51%O 48%M

Lou Barletta (R) vs Tim Holden (D)

This district is made significantly more Republican, but it may not help if Barletta gets tossed in front of the legendary Holden steamroller.  Of course Holden hasn’t had serious challenge in years so he may be rusty and Barletta may be able to ride anti-immigrant sentiment to victory.  Holden may also choose to run in the 17th.  Even then Barletta may not be completely safe, but I did warn you that this map was a reach.

PA-10, Pink, 51%O 48%M

Tom Marino (R)

Marino better hope 2012 is good year for the GOP because adding Scranton makes this an Obama district and he doesn’t have much time to get established.

Southwest

PA-03, Purple, 53%M 45%O

Mike Kelly (R)

Losing part of Eire makes this district safer.

PA-04, Red, 55%M 44%O

Jason Altmire (D) vs Timothy Murphy (R)

Here we try to eliminate narrow 2010 survivor Altmire by setting up a dogfight between him and long time rep Murphy.  While the district is not any more Republican than the current 4th, The territory just over half from the old 18th and he would be up against a fellow incumbent.

PA-14, Olive, 68%O 31%M

Mike Doyle (D)

Not much change here.

PA-12, Cornflower Blue, 55%M 43%O

Open or Mark Critz(D)

If Critz tries to run here rather than the 9th, he’ll find it more Republican than his old district, where he only narrowly survived 2010.

PA Redistricting: GOPmander

The GOP again has control of the redistricting trifecta in Pennsylvania.  Last time, it didn’t go as well as planned, as its intended 13 R & 6 D delegation (12 R + ousting Tim Holden) ended up a dummymander by 2008 (12 D & 7 R representatives).

This time around, the Republicans have the challenge of shoring up regained seats around the state, in addition to the probable elimination of one of the Democratic delegation.  My goal here was to accomplish that, in addition to a couple of other curve balls:

All of the districts are within +/- 650 people, based on 2008 population estimates.  And without further wait, let’s start!

Northwest PA:

PA-3: Rep. Mike Kelly (R-Butler)

         93% White, 4% Black, 3% Other

         52% McCain, 47% Obama, (49% McCain, 49% Obama)

PA-3 shifts a few points to the right, as PA-5 takes eastern Erie county in exchange for more rural precincts.  With the old PVI R+5.2 in addition to the rightward shift in the district, Kelly should be safe in most years.

PA-4 : OPEN; potentially Rep. Jason Altmire (D-McCandless)

         93% White, 4% Black, 3% Other

         53% McCain, 46% Obama, (no shift)

Surprisingly, it is fairly easy to remove Rep. Jason Altmire out of PA-4 by combining McCandless (his residency) with Mike Doyle in PA-14 in exchange for more Republican parts of Allegheny County.  If he doesn’t decide to move within the district, this would probably be an GOP gain as the area is trending Republican with most of the state reps & senators being GOP members.  On the other hand, if Altmire sees the primary with Doyle as unfeasible (likely) and doesn’t decide to retire, PA-4 could be the successor to the current PA-17 (Dem incumbent too personally popular to be unseated).

PA-5: Rep. Glenn Thompson (R-Howard)

         96% White, 4% Other

         54% McCain, 44% Obama, (55% McCain, 44% Obama)

Thompson’s district moves westward and southward, taking parts of Allegheny and Erie county in order to shore up other less safe districts.  Nothing too exciting here.

Southwest PA:

PA-9: Rep. Bill Shuster (R-Hollidaysburg) vs. Rep Mark Critz (D-Johnstown)

         93% White, 3% Black, 3% Other

         55% McCain, 43% Obama, (63% McCain, 36% Obama)

Sorry, Mark Critz, but you’re most likely going to be out of office come 2012.  The new PA-9 takes part of the former Murthamander of PA-12, including Critz’ home base of Johnstown.  At a 55% McCain district with a non-Tim Burns opponent, he’ll need the stars to align in order to beat Shuster.  Other than that, PA-9 shifts westward.

PA-12: Rep. Tim Murphy (R-Upper St. Clair), formerly PA-18

         95% White, 3% Black, 2% Other

         55% McCain, 44% Obama

Murphy snatches most of the rest of PA-12 along with the former PA-18, as southwest PA is where population growth is the lowest.  The McCain-Obama margin stays about the same as it was in the old PA-18.

PA-14: Rep. Mike Doyle (D-Forest Hills)

         72% White, 21% Black, 3% Asian, 4% Other

         67% Obama, 32% McCain ,(70% Obama, 29% McCain)

Mike Doyle’s district, still centered around Pittsburgh) becomes slightly less Democratic with the addition of Altmire’s base of McCandless.  Doyle probably doesn’t have to worry about a primary from his right, so he should be in the clear.

Northeast PA:

PA-10: Rep. Tom Marino (R-Lycoming)

         93% White, 3% Black, 4% Other

         51% McCain, 48% Obama, (54% McCain, 45% Obama)

It is really difficult to make all the Republicans in Eastern PA safe, as Tim Holden’s district can only hold so much population.  Neither Lou Barletta nor Tom Marino are strong candidates, so I had to choose one of them to shore up more.  As you can see, Marino took the hit (aka Scranton).  Carney would probably be good for a comeback here in a good Dem year, as Marino probably won’t be the most ethical congressman.  However, Lackawanna County isn’t trending Democratic at the federal level (Obama vs McCain margins were about the same as Gore vs Bush, a substantially more Republican year), so even if Marino were to lose, a better candidate could probably have at least an even chance of regaining the seat.

PA-11: Rep. Lou Barletta (R-Hazletown)

         94% White, 3% Hispanic, 3% Other

         53% McCain, 46% Obama, (57% Obama, 42% McCain)

Lou Barletta is the beneficiary of the Scranton switch, going from a 57% to 46% Obama district.  His district drastically shifts southwest, taking in the majority of the old PA-17, minus Schuylkill county, and eastern parts of PA-9.  He should be in pretty good condition here.

PA-15: Rep. Charlie Dent (R-Allentown)

         81% White, 12% Hispanic, 4% Black, 3% Other

         55% Obama, 43% McCain, (56% Obama, 43% McCain)

It is possible to make Charlie Dent theoretically safer by taking parts of Allentown or Bethlehem into PA-17 while grabbing more McCain-friendly precincts.  However, it would probably backfire on the Republicans, as it would remain an Obama district (52 or 53%).  Additionally, it would break up the Lehigh Valley, which historically has voted for a Republican for all but 6 years since the 1970s and has been in only one district for even longer.  Cracking Allentown would probably harm Dent more than help, as the “communities of interest” would potentially be an issue.  As a result, it only becomes slightly more Republican, taking in more conservative parts of the Valley.

PA-17: Rep. Tim Holden (D-St. Clair)

         78% White, 12% Hispanic, 6% Black, 3% Asian, 1% Other

         56% Obama, 43% McCain, (51% McCain, 49% Obama)

This district took quite a bit of effort and I’m not sure if it would hold up or not.  Basically, it makes Tim Holden safe, along with shoring up other suburban GOP reps.  With the most conservative part being his base, Holden takes in Reading, most of Monroe County, and chunks of Carbon & Montgomery Counties (PA-13 alone can’t shore up all of the southeastern Republican seats).  Basically, it becomes a Democratic vote sink.  There could possibly be a chance that Holden moves westward in Schuylkill and takes on Gerlach or Barletta if he fears a primary challenge in a more Dem-friendly district.  However, their districts are more conservative than the previous PA-17 so he’d probably have a better shot in this district.

Southeast PA (Philly Suburbs):

PA-6: Rep. Jim Gerlach (R-West Pikeland)

         90% White, 4% Black, 3% Hispanic, 3% Other

         52% McCain, 47% Obama, (58% Obama, 41% McCain)

From D+5 to R+6, how things change for Jim Gerlach.  PA-6 becomes a lot more rural, stretching westward out from the suburbs in addition to giving Reading over to Tim Holden in exchange for much of the old PA-17.  Gerlach has repeatedly shown a knack for survival, hanging on in great Dem years like 2006 & 2008, so he should be safe in this district.  Even if he tries again for higher office, a moderate-conservative Republican should be able to hold on to the new PA-6 fairly easily.

PA-7: Rep. Pat Meehan (R-Drexel Hill)

         89% White, 4% Black, 4% Asian, 3% Other

         51% Obama, 48% McCain, (56% Obama, 43% McCain)

With Allyson Schwartz’s district becoming a more Democratic vote-sink, PA-7 reddens a good deal.  Meehan’s new district picks up parts of Pitts’ and Gerlach’s old districts while dropping more Dem-heavy precincts to the Philly districts.  Overall, this should help Meehan to entrench himself in the district more than before.

PA-8: Rep. Mike Fitzpatrick (R-Levittown)

         88% White, 4% Black, 4% Asian, 3% Hispanic, 1% Other

         53% Obama, 46% McCain, (54% Obama, 45% McCain)

There isn’t a whole lot that can be done for Mike Fitzpatrick either, other than shifting the margin to what Obama won by nationally.  In 2006, a good Democratic year, Patrick Murphy only beat him by 1500-some votes, a margin that the switch of precincts with Allyson Schwartz would probably have eliminated.  PA-8, basically, remains a swing district, but leaves Fitzpatrick in a slightly stronger position.

PA-16:  Rep. Joe Pitts (R-Kennett Square)

         85% White, 8% Hispanic, 5% Black, 2% Other

         53% McCain, 46% Obama, (51% McCain, 48% Obama)

Joe Pitts’ Lancaster-based district moves somewhat westward out of the suburbs, thus becoming slightly safer for him.  Still, if current trends hold, all of the Philadelphia suburban districts are going to end up places where the GOP will have to sweat, regardless of this round of redistricting.  Pitts will probably need to tone down his anti-choice rhetoric or even moderate somewhat in order to keep the district in the mid-long term.

PA-18:  Rep. Todd Platts (R-York)

         82% White, 9% Black, 6% Hispanic, 3% Other

         52% McCain, 47% Obama, (56% McCain, 43% Obama)

I had to put Harrisburg somewhere, and unfortunately for Todd Platts, it gets thrown into his district.  Putting Harrisburg in any other district presents a higher risk to the GOP, as Joe Pitts and Jim Gerlach both have to worry about further Democratization of the Philly suburbs.  The district is still fairly Republican, so Platts should be pretty safe.

Philadelphia:

PA-1: Rep. Robert Brady (D-Philadelphia)

         46% Black, 41% White, 7% Asian, 4% Hispanic, 2% Other  

         83% Obama, 16% McCain, (88% Obama, 12% McCain)

Majority-minority district for Brady.  It just stretches out more along the Delaware River than before, nothing too drastic.

PA-2: Rep. Chaka Fattah (D-Philadelphia)

         53% Black, 23% White, 18% Hispanic, 4% Asian, 1% Other

         91% Obama, 8% McCain, (90% Obama, 10% McCain)

It is possible: Chaka Fattah’s district can become even more Democratic, albeit slightly.  It also becomes a lot more compact while remaining VRA at 53% black & only 23% white.  It also sheds some precincts to PA-13.

PA-13: Rep. Allyson Schwartz (D-Jenkintown)

         79% White, 9% Black, 6% Asian, 5% Hispanic, 1% Other

         64% Obama, 36% McCain, (59% Obama, 41% McCain)

PA-13 gains a lot more Dem voters and in the process makes the rest of the Republican suburbs safer.  It basically switches parts of Montgomery county with other districts in order to grab all of the 60%+ Obama precincts.  Allyson Schwartz, winning by a 13% margin in 2010, is there for as long as she wants to be in Congress.

—–

Overall, I think the Republicans will go for a map somewhat like this.  They might go with a Dem-vote sink in NW PA with Altmire by combining PA-4 with Erie, but I don’t think they’re going to cede to Altmire that easily.  Another option would be for Holden to take Scranton and drop some of SE Pennsylvania, but a similar district failed to pass last round I believe.  GOP wins in PA-10 & 11 this year complicated things for them, as the legislature is foremost going to try for R-incumbent protection.

So any thoughts?  I’m not from PA (no Florida precinct information on Dave’s app yet 🙁 ), so I’d be curious to see if anyone from there would think this would hold up.

Weak GOP gerrymander for PA – 13-5 in a good year

Republicans had a great night in Pennsylvania this November, which makes drawing a decent map for them really hard.

The problem for them is, fundamentally, that they won in all the wrong places. They knocked off Carney and Kanjorski, whereas if they’d taken only one of them they could have packed the survivor’s district and used the redder bits of his district to make Charlie Dent a little later. They held PA-6 and took back PA-7 and PA-8, meaning that it’s that much harder to protect their representatives in the suburban Philadelphia area, whereas if the Dems had held one seat then it would have been possible to shift the other districts further from the city.

And they didn’t knock off Critz or Altmire, meaning that they’ll have to work a little harder to give them unwinnable districts.

All in all, they’d have a lot more options for the coming redistricting if they’d won a few less districts and if more of them had been in western PA.

But what’s done is done. Republicans can enjoy their gains for now and they’ll just have to work to try to keep them – because there’s no way they’ll willingly concede seats in the next redistricting.

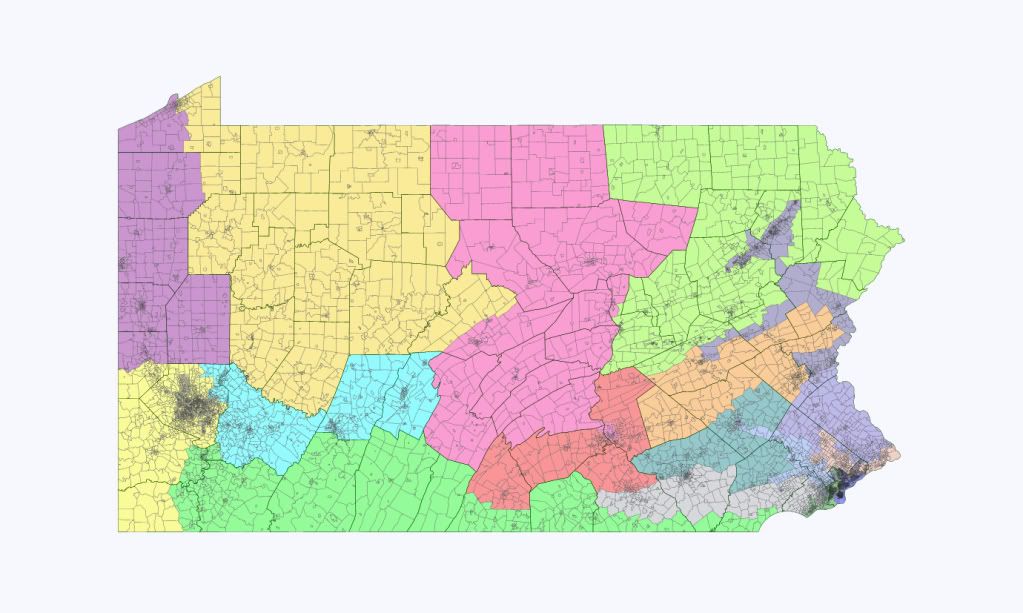
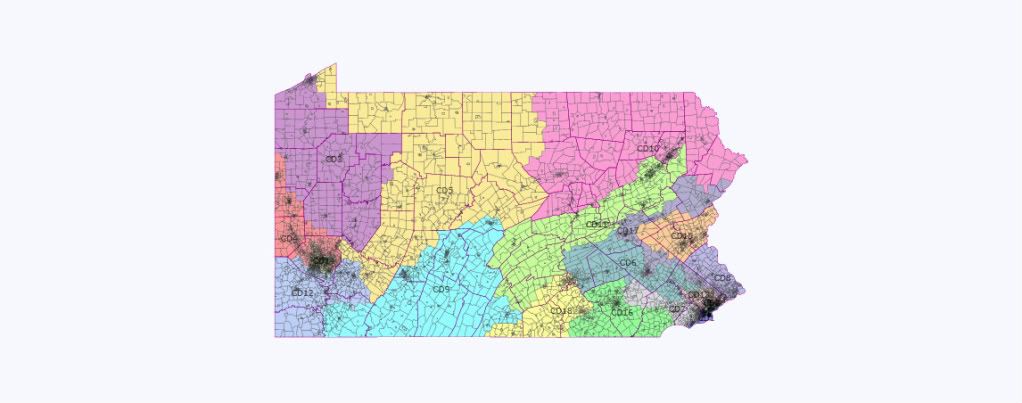
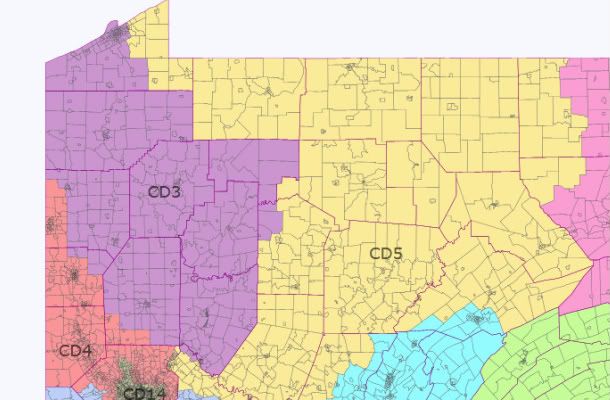
This map is an attempt to strengthen the Republican freshmen and to eliminate the last two Democratic representative in western Pennsylvania outside Pittsburgh. By giving Tim Holden a reasonably strong Democratic district, it frees up enough red territory to give the Republicans a fighting chance of a 13-5 advantage out of the state.

But this is not without risk. McCain got beaten by ten points in Pennsylvania and five Republicans in this new map will represent districts he lost. If they all flipped, Democrats would have a 10-8 advantage out of the state. If Joe Pitts can’t adapt to his new district, it could be as bad as 11-7.

On the other hand, it’s almost impossible to defend all twelve Republican congressmen in the state effectively. This map improves the prospects of each Republican in a district Obama won by at least four points net. I won’t pretend this map doesn’t have weaknesses, but it’s probably the best the Republicans can do.

As an added challenge, I endeavoured to keep townships together, as I don’t think the advantage gained by splitting them outweighs the negative press received for doing so. This doesn’t apply in Philadelphia, as the Republicans have no reason to care about a backlash there.

I would have like to be able to give Sestak-Toomey results, as it’d establish how safe these seats would be in a good year (i.e. if Joe Pitts’ district would still have been a bit marginal this year then he might be in trouble either way), but sadly not all counties have put up results by precinct yet. Most have, but several important ones like Montgomery and Erie haven’t, so sadly we lack that method of double-checking.

Overall map

Philly close-up

PA-1

Incumbent: Bob Brady


Population White Black Hispanic Asian
684861 35 50 8 5


Obama % McCain %
Old lines 88 12
New lines 87 12
% change -1% +0%

Like I said, redistricting isn’t going to be as much fun for the Republicans as it might have been. If they want to enjoy themselves, they’ll have to make their own entertainment.

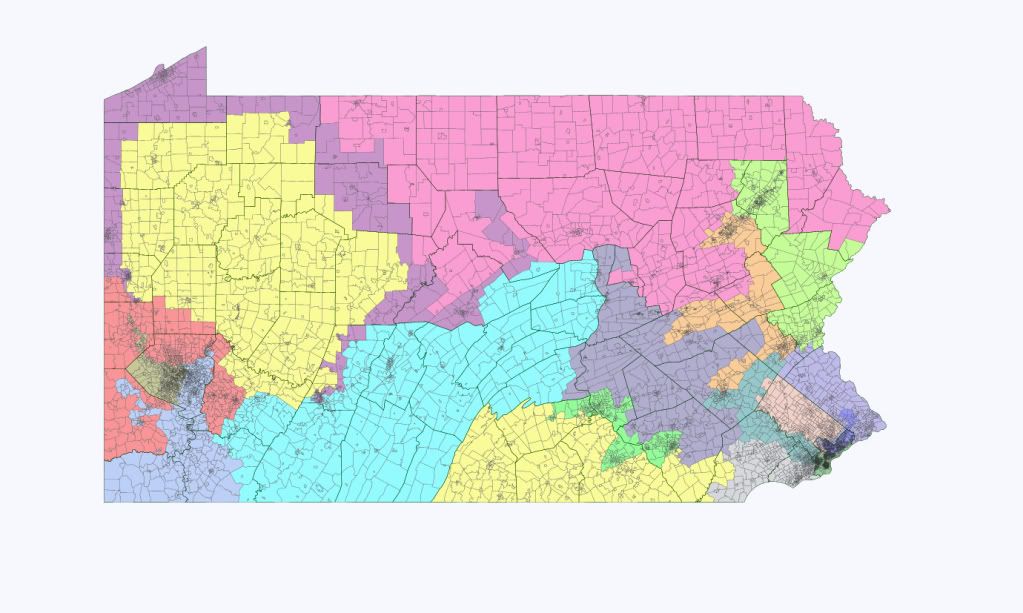
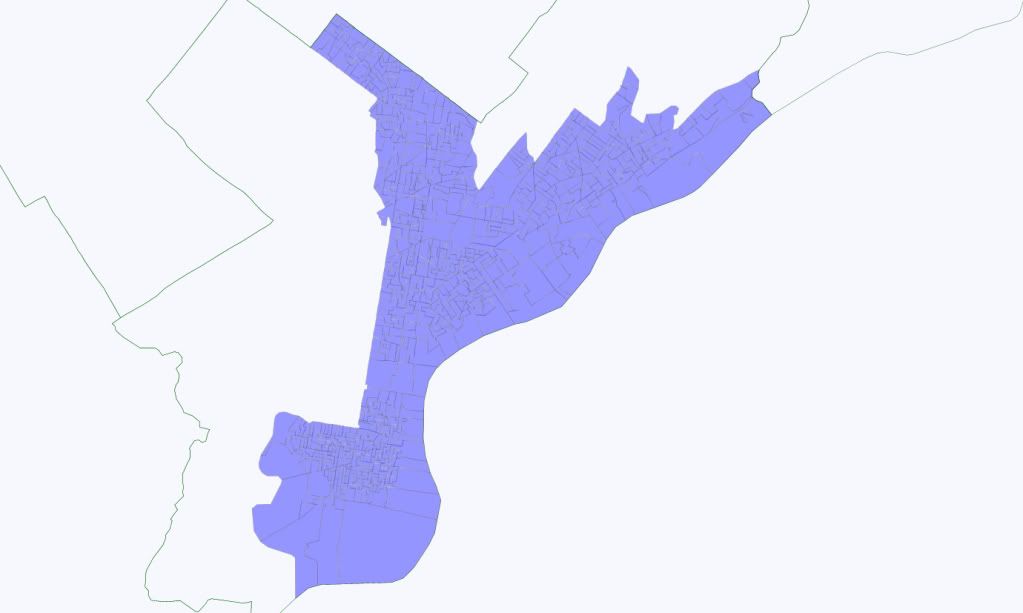
In this map I represented that by drawing the new PA-1 as minority-majority (which the Republicans would be mad not to try for, as with no retrogression they can create two Democratic vote sinks that will be almost impossible to eliminate).

I also noted that according to his candidate petitions Bob Brady lives in Ward 34 Precinct 34, which is on the very western edge of West Philadelphia. I therefore slipped it into Allyson Schwartz’s district.

Now, Bob Brady is quite capable of moving a few blocks back into the district, assuming election law actually requires him to. And he’s represented a minority-majority district for long enough that making it 50% black won’t have him quaking in his boots. But still, Republicans have to get their giggles somehow. And spite is the gift that keeps on giving.

The district itself is somewhat less interesting. It keeps its strip through southern Delaware County to Chester, as well as the areas of Darby, Yeadon and Sharon Hill, and combines these these with south, west and central Philadelphia, together with portions of north Philly and much of Kensington.

PA-2

Incumbent: Chaka Fattah


Population White Black Hispanic Asian
685048 34 50 10 3


Obama % McCain %
Old lines 90 10
New lines 88 12
% change -2% +2%

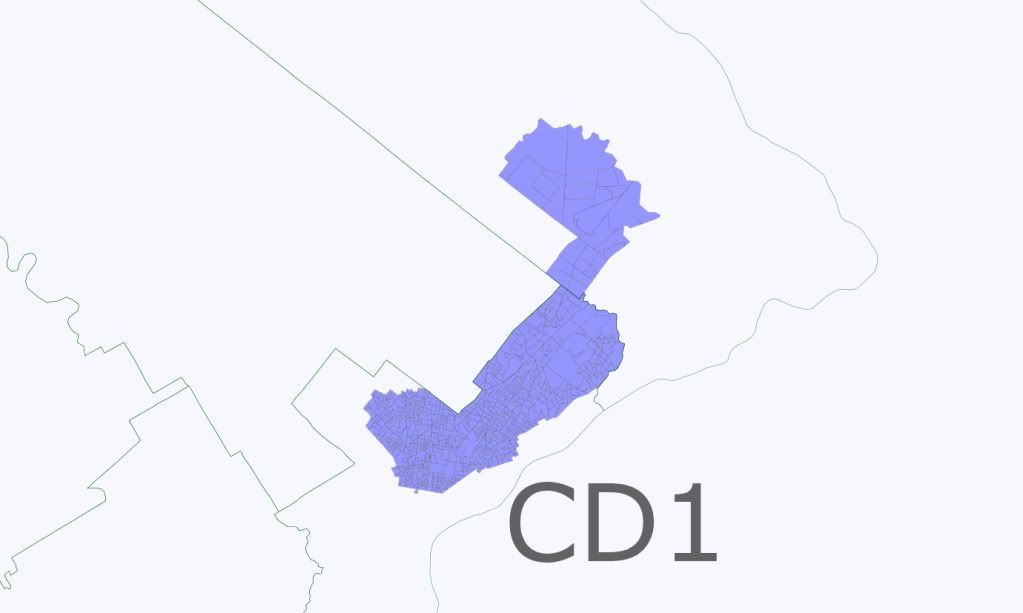
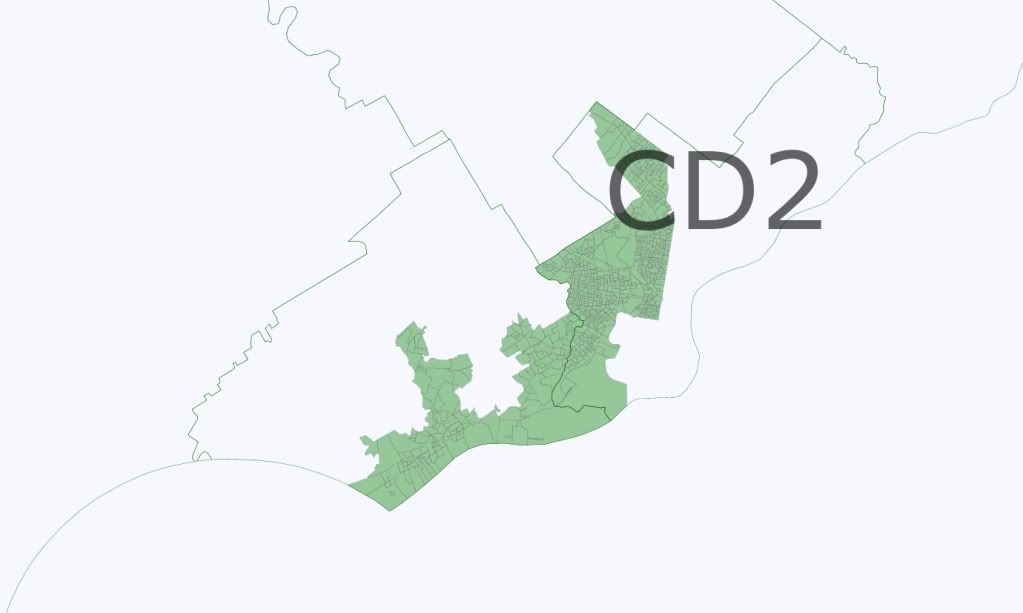
Chaka Fattah is harder to draw out, so Republicans will have to settle for just giving him the biggest district in the state population-wise.

There’s very little to say about this district. It narrowly remains above 50% black and takes in the rest of Philadelphia, bar small portions of the Northeast and Northwest. Much of it is new to Fattah, but I can’t imagine him facing too many problems with it.

PA-3 (was PA-13)

Incumbent: Allyson Schwartz, Bob Brady, Patrick Murphy


Population White Black Hispanic Asian
681192 83 8 3 4


Obama % McCain %
Old lines 59 41
New lines 64 35
% change +5% -6%

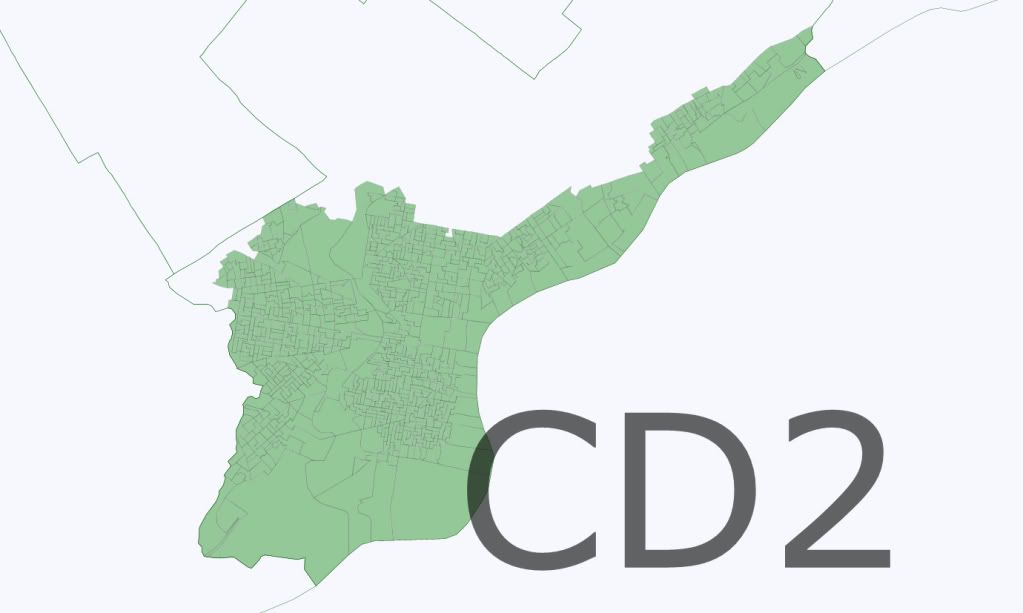
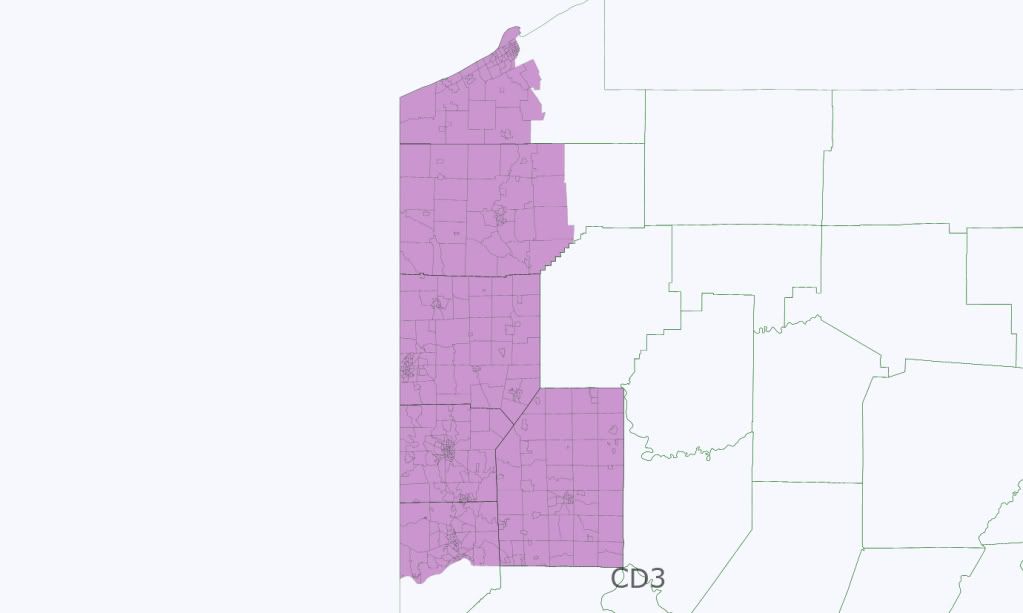
It’d be much easier to pack the Democratic vote if the Philadelphia suburbs hadn’t elected so many Republicans this year. As a result, the task is largely left to Schwartz, who gets a district that’s absolutely safe in the hope she doesn’t get ideas like running for governor any time soon.

I’ve renumbered the districts, because if you’re going to gerrymander you should at least care enough to cover your tracks by numbering the districts in a vaguely logical order (even if my order does involve flying betwen north and south Pennsylvania like a fairground ride.)

The district keeps its core in southern Montgomery County and Northeast Philadelphia, although much of northern Montgomery is moved elsewhere. To this it adds Northwest Philadelphia west of Wissahickon Creek and north of Cresheim Creek, plus Bensalem southern parts of Levitttown in Bucks County. In doing so, it also mops up the home of Patrick Murphy, in an attempt to keep him out of Fitzpatrick’s hair.
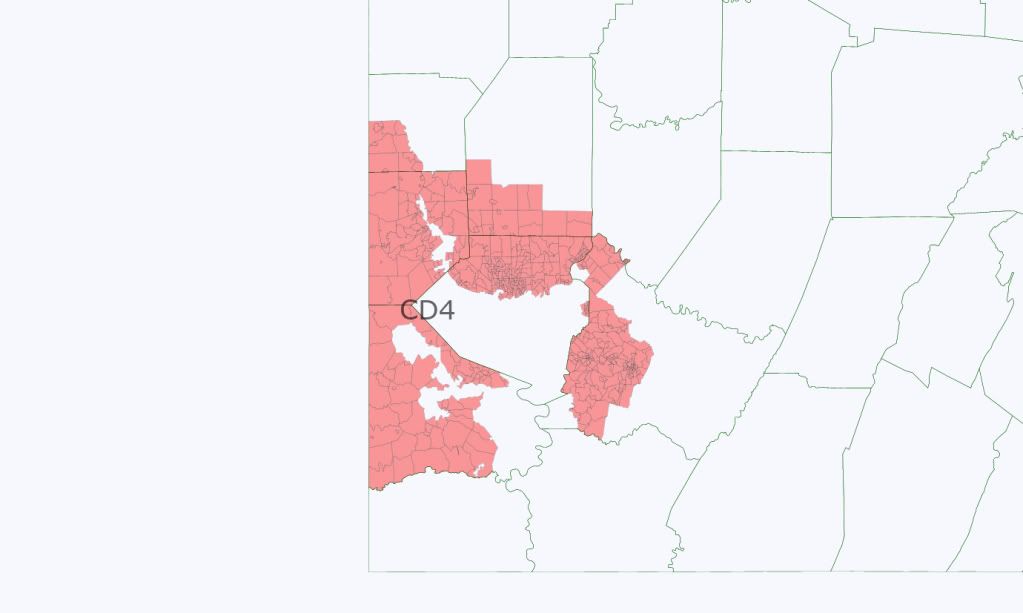
SE PA close-up

PA-4 (was PA-8)

Incumbent: Mike Fitzpatrick


Population White Black Hispanic Asian
682279 92 2 2 2


Obama % McCain %
Old lines 54 45
New lines 52 47
% change -2% +2%

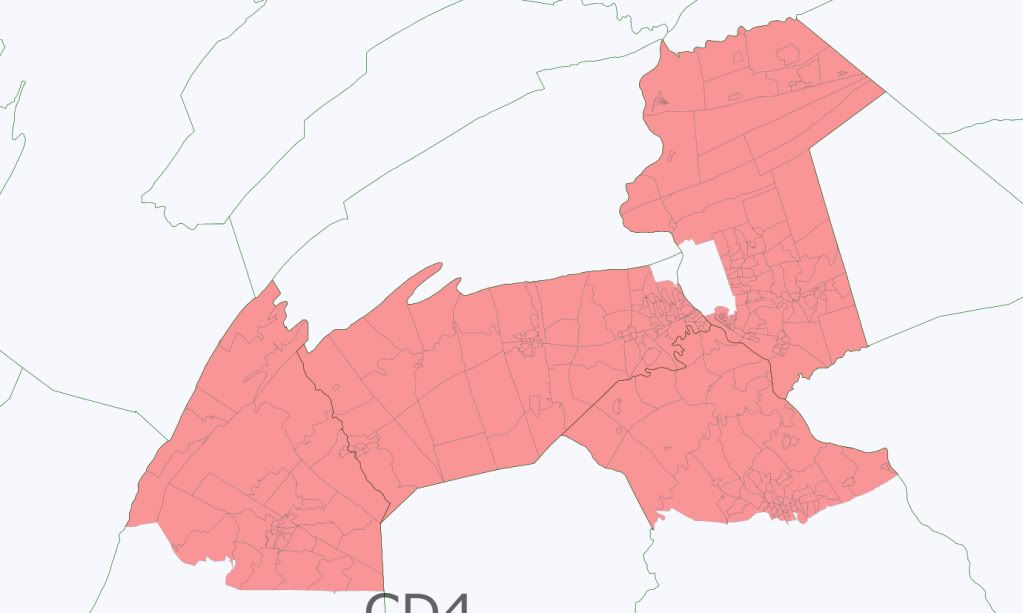
Fitzpatrick’s district is improved by four points net and Murphy is removed from his district. That said, it’s not all smiles for him.

Swapping southern Bucks for reddish or marginal parts of eastern and northern Montgomery helps him a little. On the other hand, he could be helped a lot more if the last 35,000 of his population requirement didn’t have to be filled by taking Easton off Charlie Dent’s hands.

This district is slightly more Republican than the nation as a whole, and if Fitzpatrick endears himself to his constituents he could well survive. On the other hand, he has to be hoping Sarah Palin gets nowhere near the Republican nomination. The last thing he needs in 2012 is a combination of presidential year turnout and a candidate guaranteed to drive suburban voters into voting for Democrats.
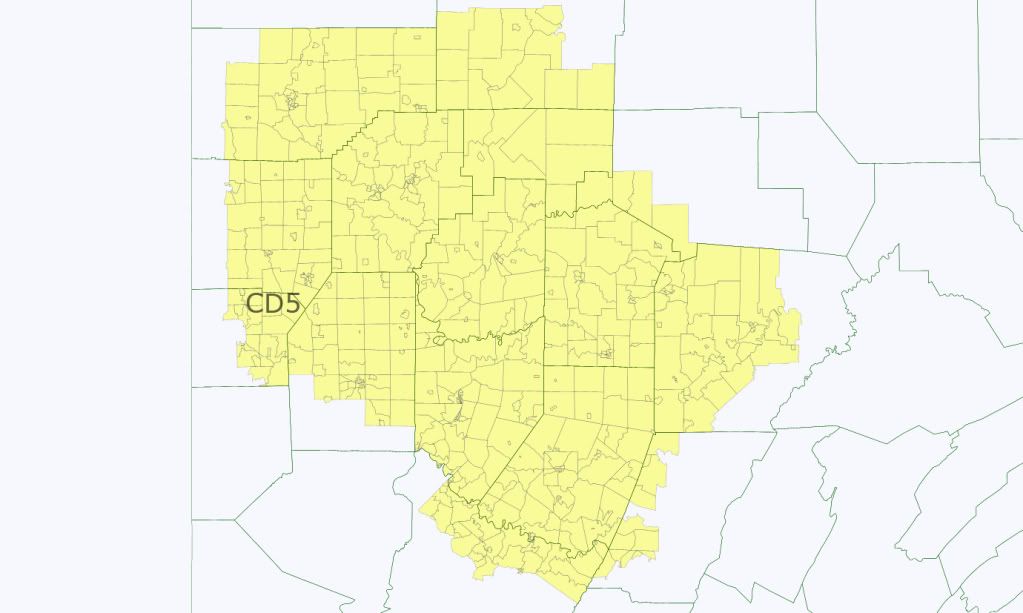
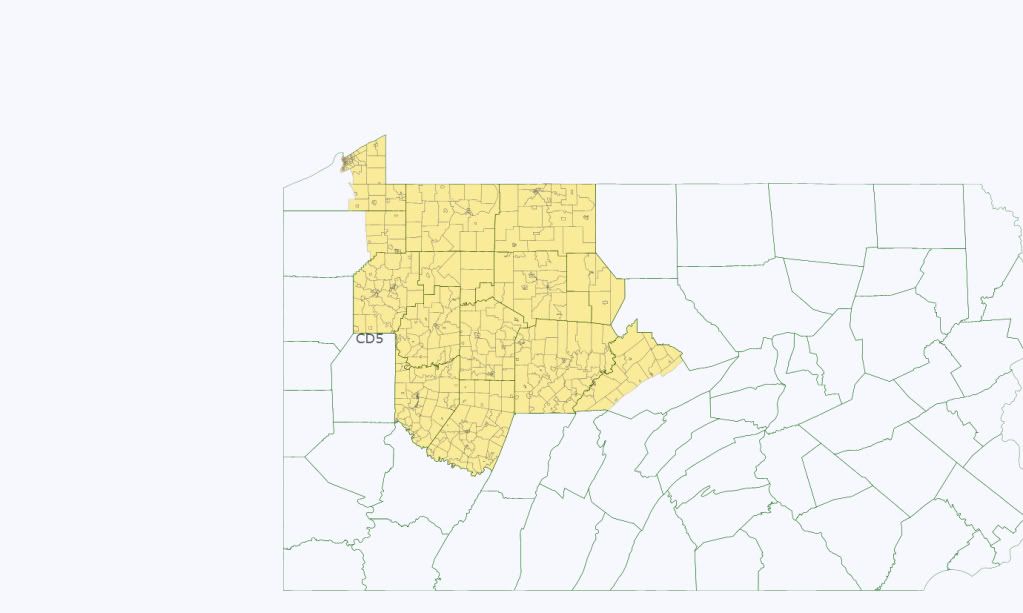
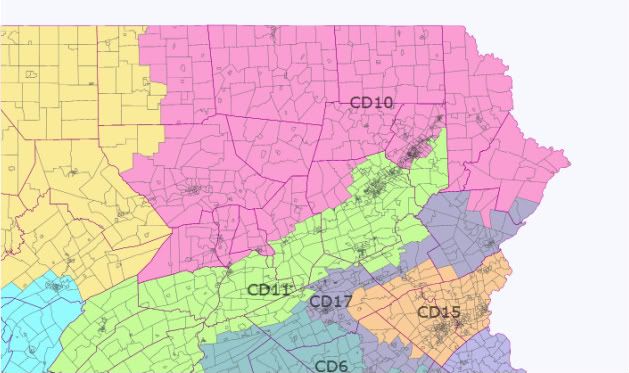
PA-5 (was PA-6)

Incumbent: Jim Gerlach, Manan Trivedi


Population White Black Hispanic Asian
680512 90 3 3 3


Obama % McCain %
Old lines 58 41
New lines 53 46
% change -5% +5%

Jim Gerlach is never going to be entirely safe, but this district might give him a bit of extra comfort for a couple of cycles.

Like Fitzpatrick, he has to help Dent out in the Lehigh Valley, in Gerlach’s case grabbing Bethlehem plus southern portions of Lehigh and Northampton counties. Nevertheless, these areas aren’t overwhelmingly blue and in all other cases boundary changes are in his favour.

He gives up much of Chester County to let the new PA-6 through and abandons Reading and its most Democratic suburbs to Tim Holden.

In return, he picks up absolutely blood-red, 70-30 McCain areas in northwest Berks and northeast Lancaster, which are less likely to turn blue suddenly than his current suburban turf.
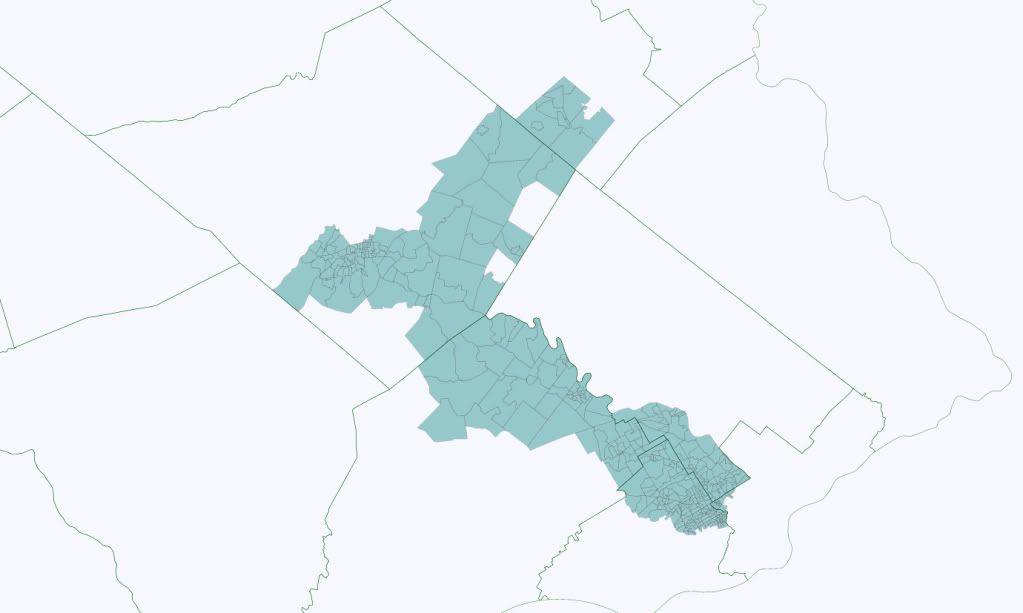
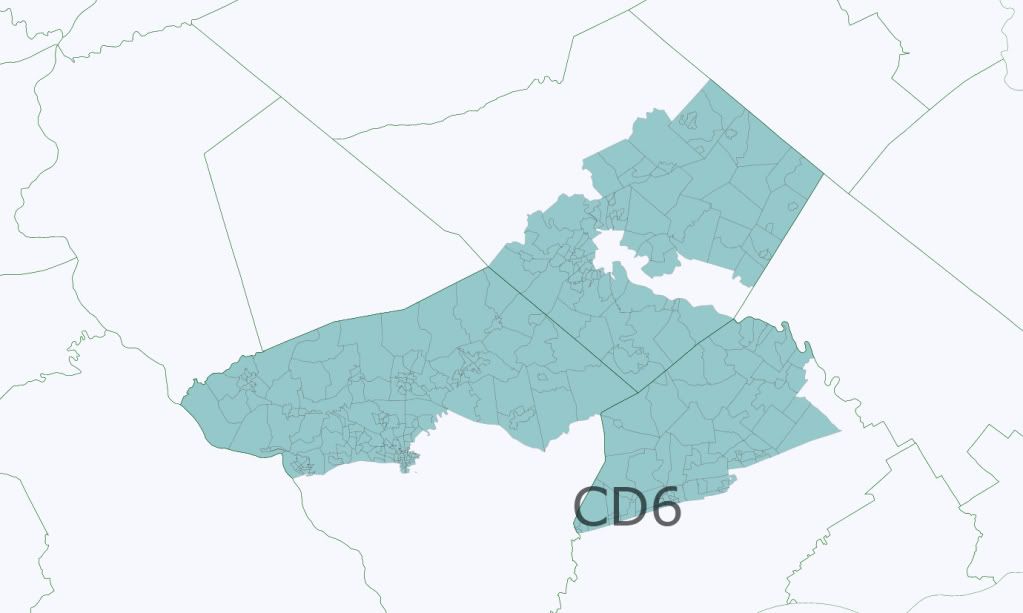
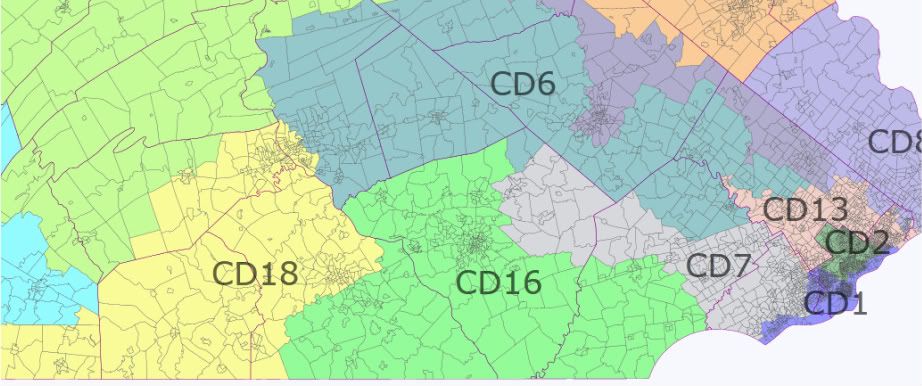
PA-6 (was PA-7)

Incumbent: Pat Meehan


Population White Black Hispanic Asian
679961 90 5 2 3


Obama % McCain %
Old lines 56 43
New lines 51 48
% change -5% +5%

Pat Meehan is probably the big winner on this map, which is largely accidental, as I figured that if there had to be a Republican casualty in the southeast, he’d be first in line as a freshman who hadn’t previously served in Congress.

His district moves a net ten points towards Republicans. Well, I say his district. Rather than being centred on Delaware County, it now draws less than 250,000 from that source. In the process, it has offloaded the homes of Sestak and Bryan Lentz to Joe Pitts’ district.

It makes up for this by heading west through the central parts of Chester county, turning northwestwards and heading through Lancaster county into southern Lebanon county and eastern Dauphine county, finishing up in the outer suburbs of Harrisburg.

With no part of the district outside Delaware County large enough to provide a base for primary challengers and with a lot of new turf that won’t turn blue in a hurry, Pat Meehan can afford to feel very pleased with himself.

Until he realises that Obama still won this district, so he can’t feel entirely comfortable.
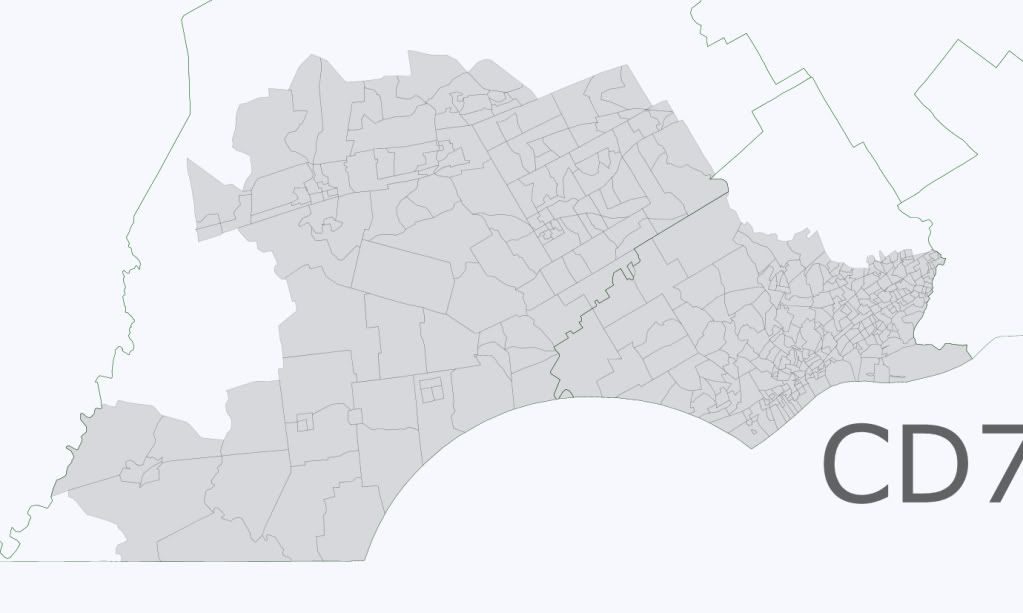
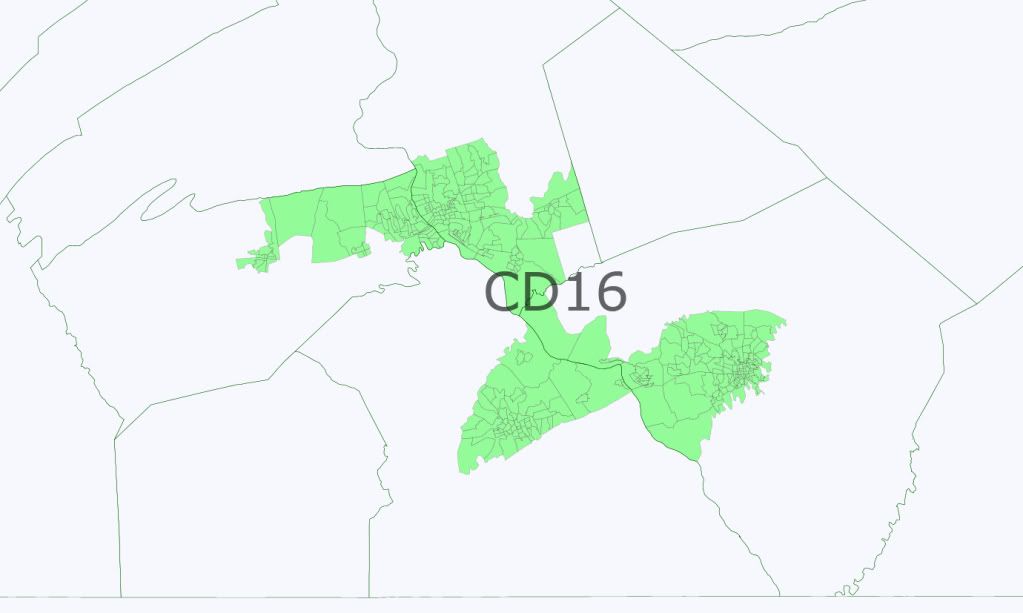
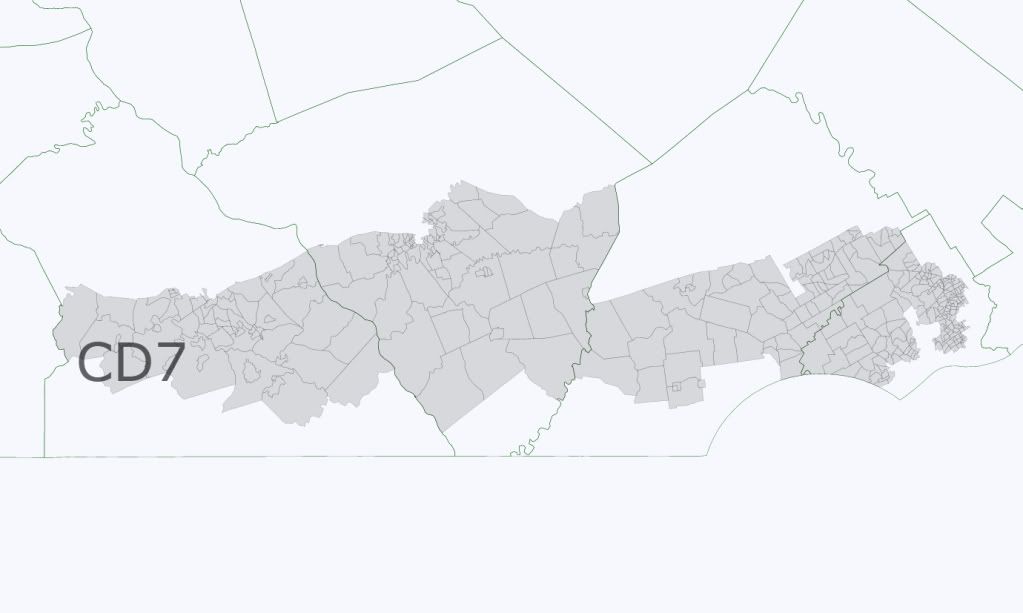
PA-7 (was PA-16)

Incumbent: Joe Pitts, Joe Sestak, Bryan Lentz


Population White Black Hispanic Asian
681623 91 4 3 1


Obama % McCain %
Old lines 48 51
New lines 49 51
% change +1% +0%

Although he represents the first district we’ve yet seen that McCain won, Joe Pitts is probably the biggest Republican loser on this map.

It’s not drastic in terms of pure partisanship. Obama improves by only 1% compared to the old lines. But whilst he’s dropped Reading and Lancaster and picked up reliably red turf in southern York County, he’s also absorbed a little over 200,000 new largely Democratic voters in Delaware County.

If he’s ready to adapt himself to a more suburban audience, he’ll do fine. McCain won the new district and it’s likely Bush did so with huge margins. But if he can’t do that and if Joe Sestak fancies running for Congress again, there could be problems for Pennsylvania Republicans.
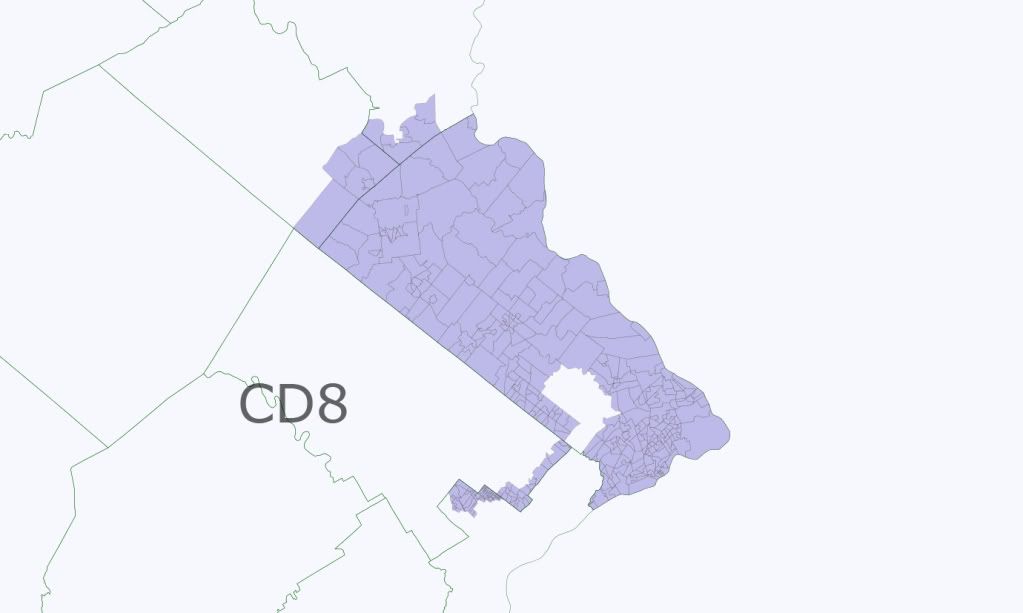
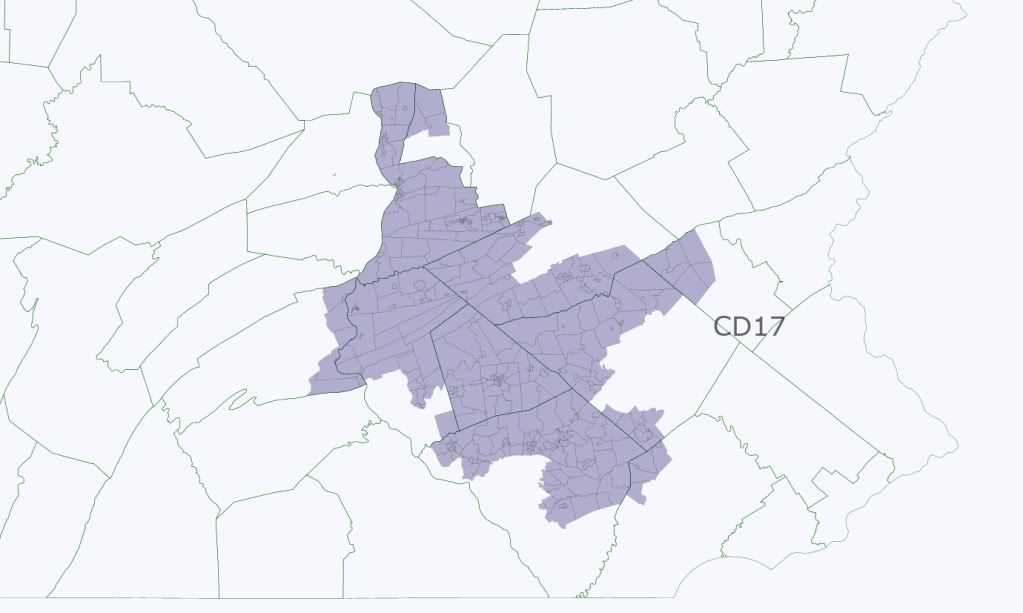
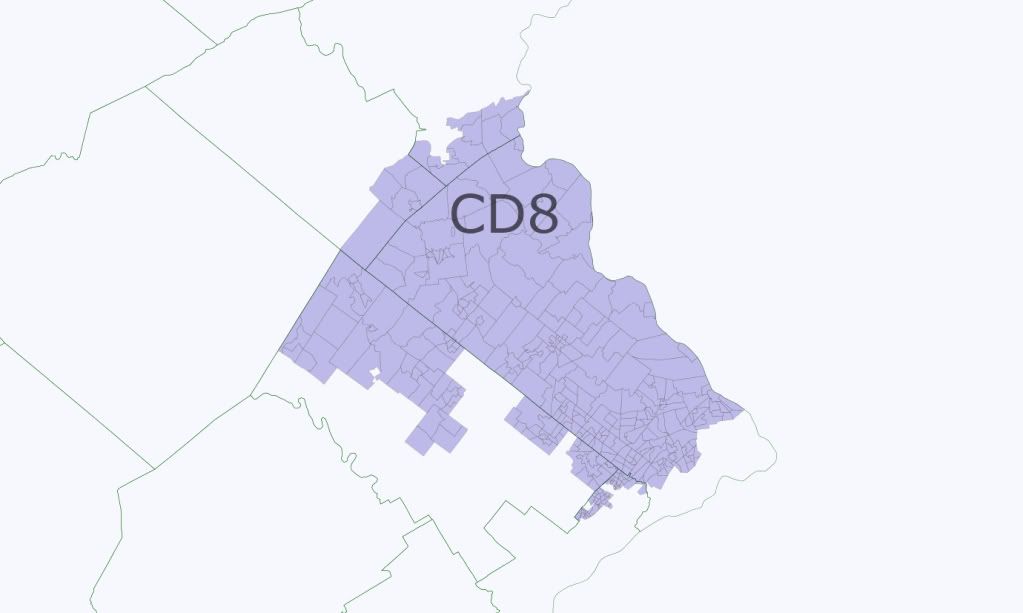
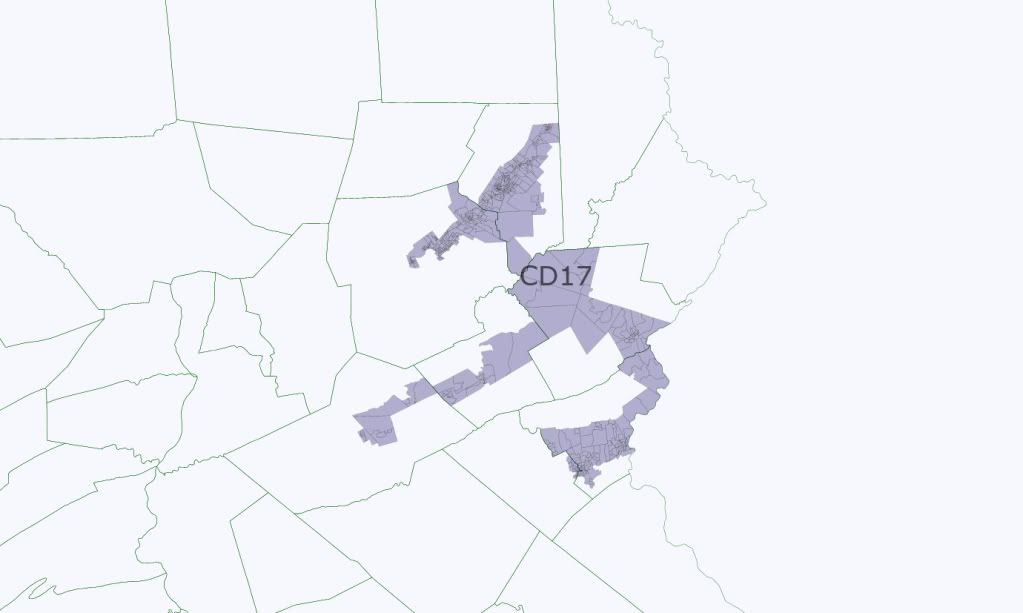
PA-8 (was PA-17)

Incumbent: Tim Holden


Population White Black Hispanic Asian
683263 77 9 10 2


Obama % McCain %
Old lines 48 51
New lines 56 43
% change +8% -8%

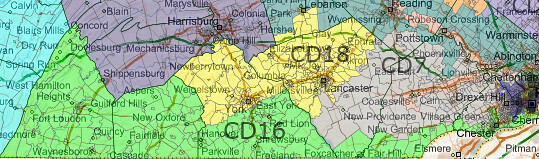
This isn’t, I will admit, a pretty district, but it’s a functional one. The cities of Lancaster, Harrisburg, Lebanon, Pottsville and Reading are joined by stretches of extremely red countryside, forming the semblance of an M, then parts of central Schuykill are shoved in to make sure Holden runs here.

A community of interest district of south-eastern Pennsylvanian cities that don’t simply look to Philadelphia is created, Tim Holden gets a much safer district, but a progressive enough one for him to be troubled in the primary and Republicans get to take vast red areas from his current district, as well not having to face up to him in the general election. Everybody wins, except the 30% Obama areas that get their voting preferences drowned out by the cities.
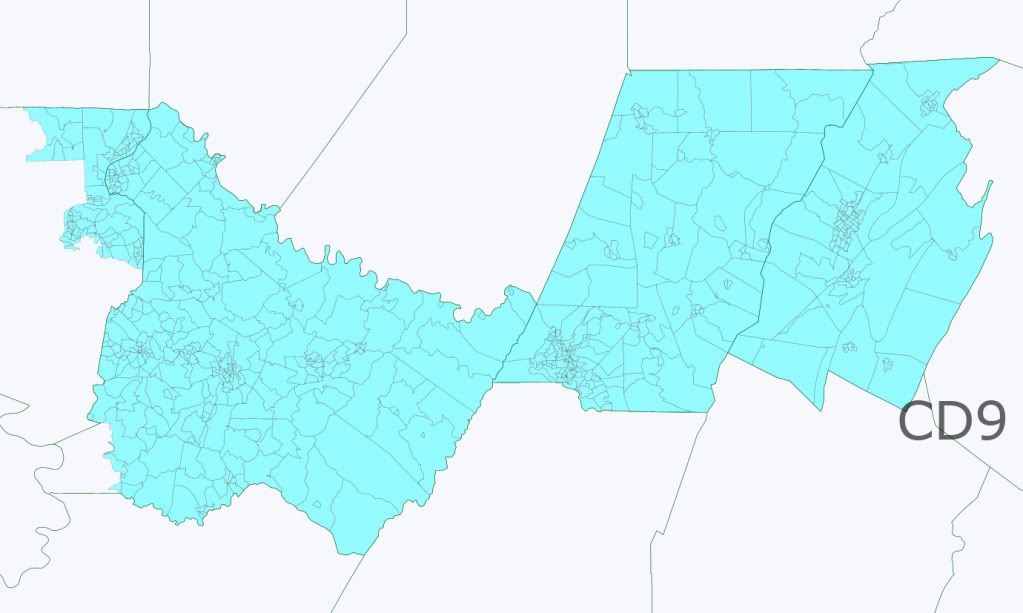
PA-9 (was PA-15)

Incumbent: Charlie Dent


Population White Black Hispanic Asian
681623 88 3 7 1


Obama % McCain %
Old lines 56 43
New lines 54 45
% change -2% +2%

This district isn’t as much as an improvement as some, but Charlie Dent won’t be too disappointed. His new territory in the Poconos went for Obama, but Pat Toomey won it by over 5,000 votes and the Coal County portions of the district went narrowly for McCain.

In the old core of the district, meanwhile, his margins are hardly hurt by exchanging Easton and Bethlehem (and his last challenger) for red bits of north Berkshire County is hardly going to hurt.

Of course, Dent has always won fairly easily by keeping his head down and he might suffer some backlash from this fairly deliberate attempt to carve up the Lehigh Valley. But I doubt that’ll do him enough damage to cancel out the four-point net Republican improvement in this district.
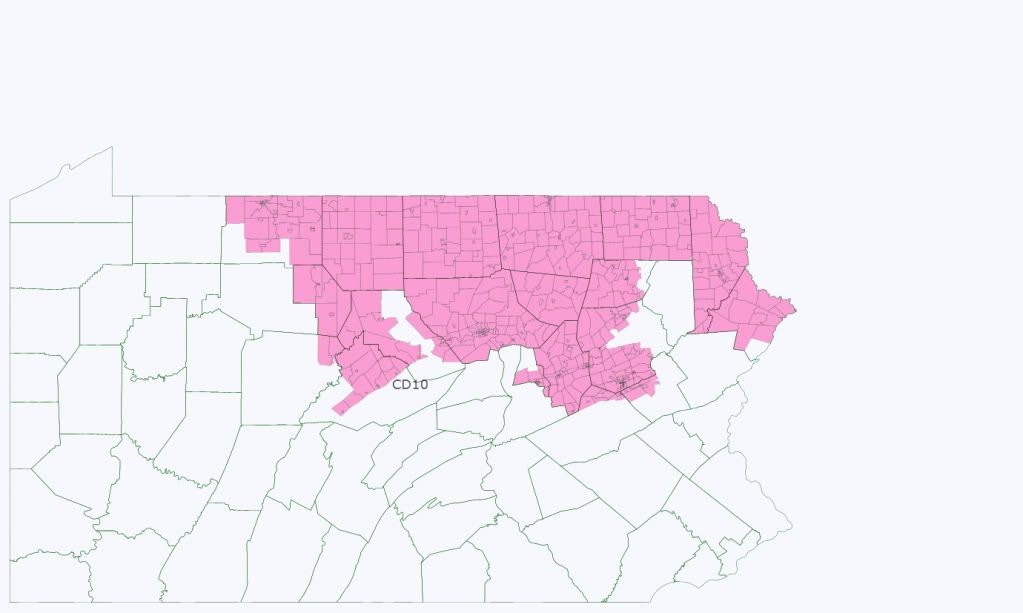
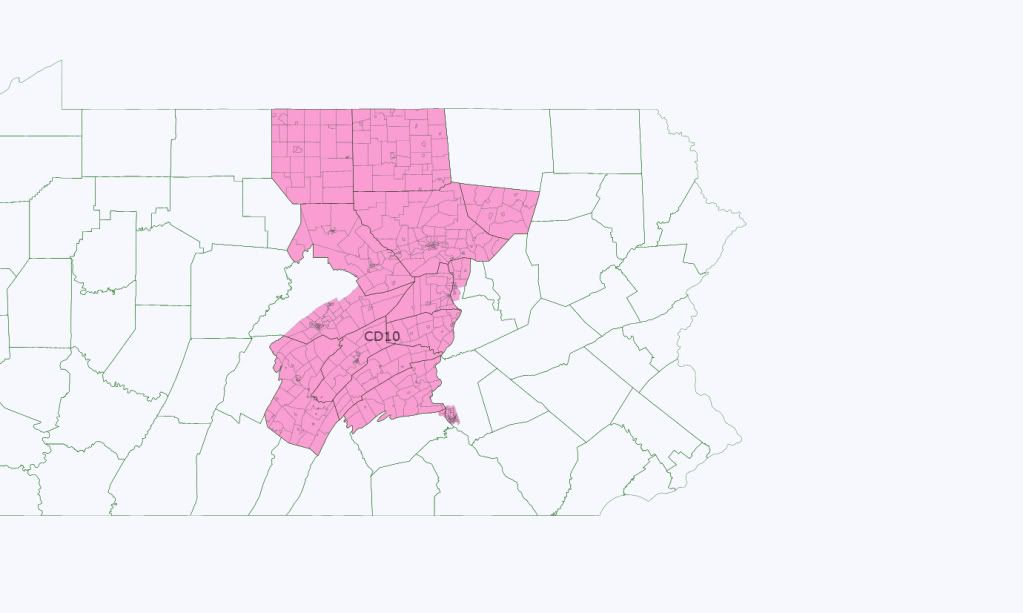
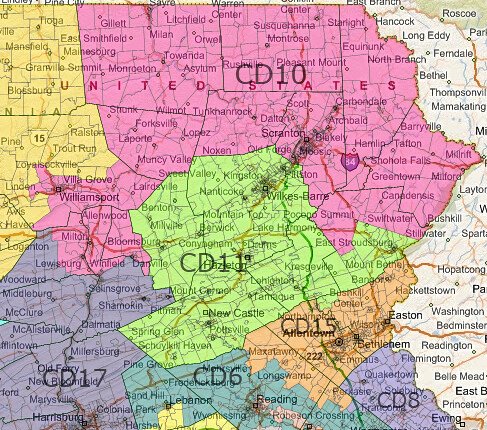
PA-10 (was PA-11)

Incumbent: Lou Barletta


Population White Black Hispanic Asian
680221 97 1 1 1


Obama % McCain %
Old lines 57 42
New lines 52 47
% change -5% +5%

Let’s be honest here – Paul Kanjorski was a terrible candidate. He nearly lost a district that Obama won by fifteen points in 2008, and followed that up by a ten-point defeat against the same opponent in 2010, whilst Joe Sestak carried the district by four points.

Given a better year for Democrats and a better candidate like Corey O’Brien, Barletta could be in real trouble. The district is therefore heavily reconfigured. Swingy Carbon and Monroe Counties are given to Dent, whilst in Lackawanna County it abandons Scranton (and O’Brien’s residence in Moosic) to the 11th, whilst absorbing most of the 11th (old 10th)’s portions of Lackawanna County, as well as the entirety of Wyoming County.

In the south-west of the district, it expands to take in much of the Coal Region, including the entirety of Northumberland and Montour counties, northern Dauphin and northwest Schuykill.

It’s still a district Obama won, although the margin is slightly less than he managed nationally. But without the Democratic juggernaught of Scranton and with downscale and monolithically white coal counties which ought to be sympathetic to his immigrant-baiting populism, Barletta might just have a chance of holding on past 2012.
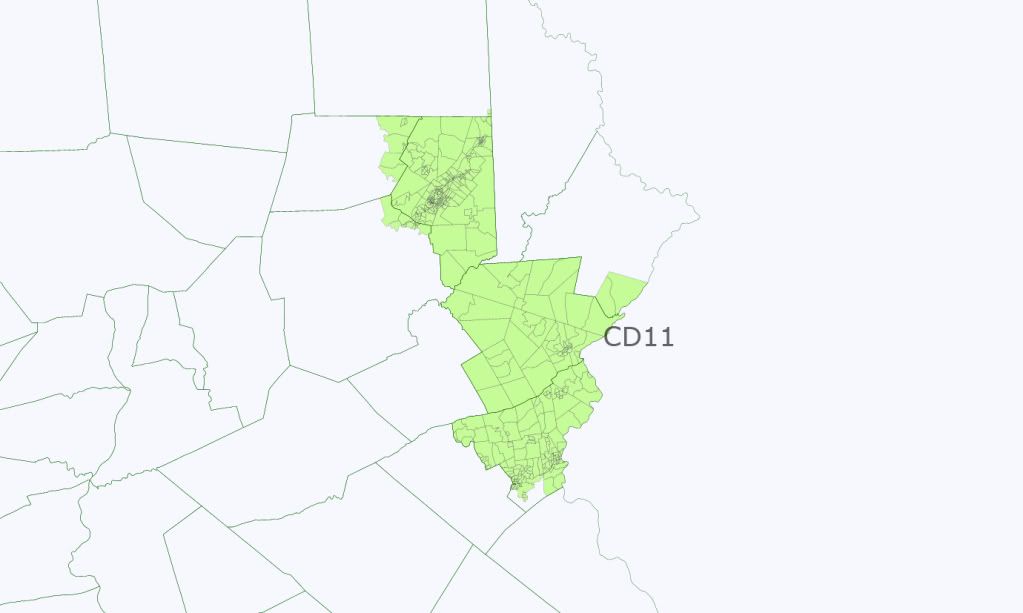
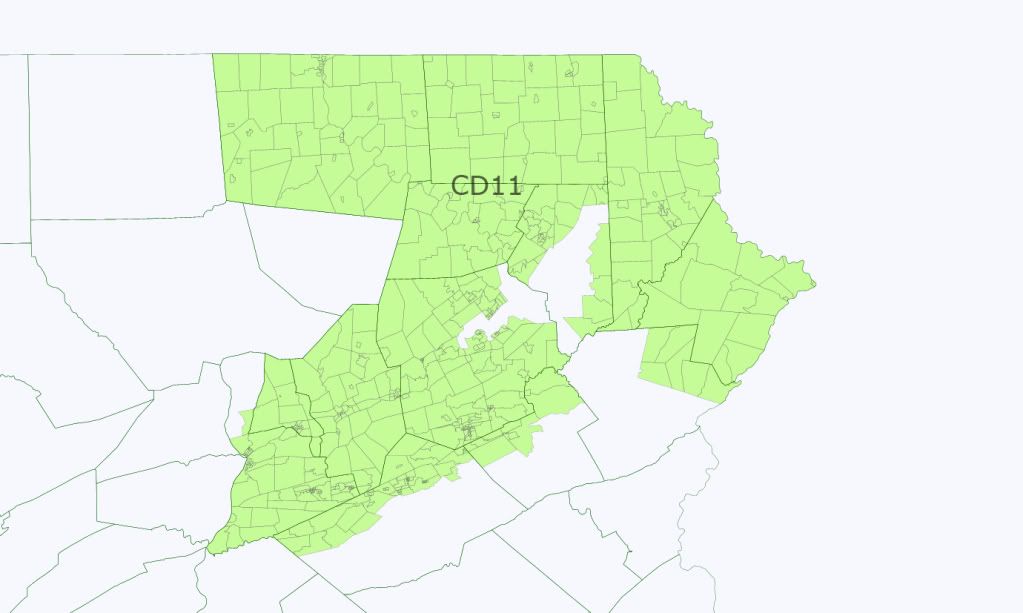
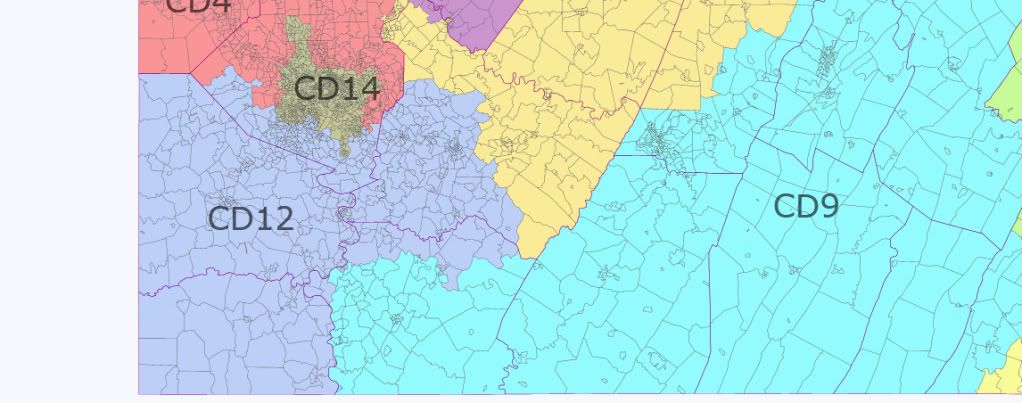
PA-11 (was PA-10)

Incumbent: Tom Marino, Chris Carney, Corey O’Brien


Population White Black Hispanic Asian
680774 94 2 1 1


Obama % McCain %
Old lines 45 54
New lines 46 53
% change +1% -1%

Chris Carney performed very strongly in his portion of Lackawanna County, but he got beaten by at least ten points everywhere else. There’s no great shame in that, as they’re all red counties and he outperformed Joe Sestak by at least 5% in every single one of them, but he did lose pretty big.

Carney initially won by the simple expedient of running in a very strong Democratic year and facing an incumbent who choked his mistress. He retained his position in 2008 by maintaining a very conservative voting record. But this isn’t a very Democratic district and Marino ought to be able to hold on here with ease.

I therefore didn’t feel any great need to concentrate on making Marino too safe. I gave him the rest of Lycoming County to build his base and he also picked up Perry, Juniata and Mifflin counties, which whilst small are also the most Republican in Pennsylvania. These advantages, however, are more than outweighed by the loss of Wyoming County, the addition of a section of Centre County (including State College) that went for Obama by 15 points and Scranton.

Obama won the Lackawanna parts of the district by 32 points. McCain won the rest by 13 points. So it’s not like my attempts at diluting Scranton’s votes are subtle. But it ought to work, especially since Carney’s path to a rematch is likely to be blocked by a primary with a Lackawanna Democrat and since many of the primary voters will be further to the left than the Blue Dog Carney.
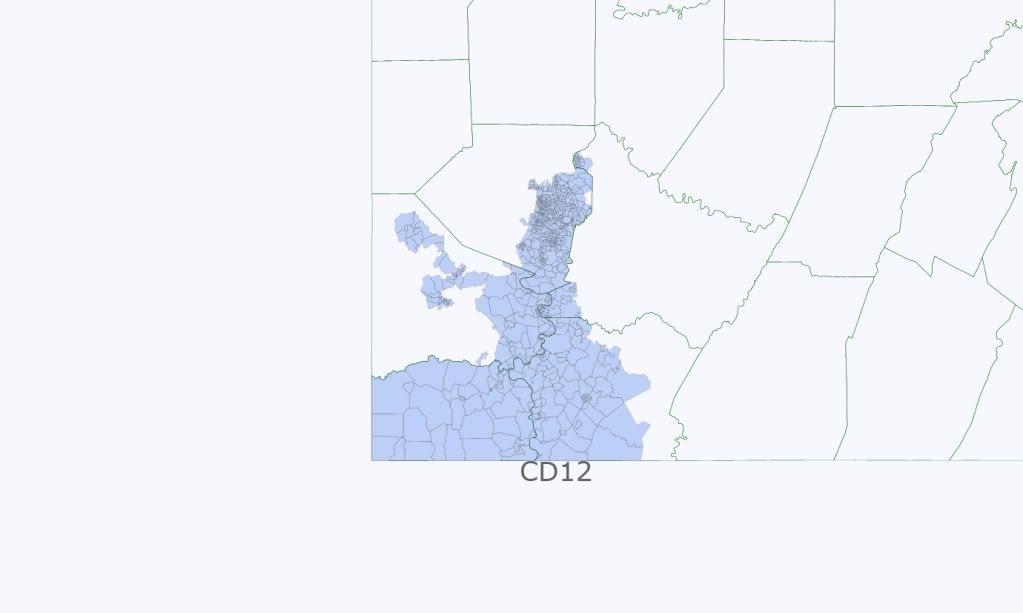
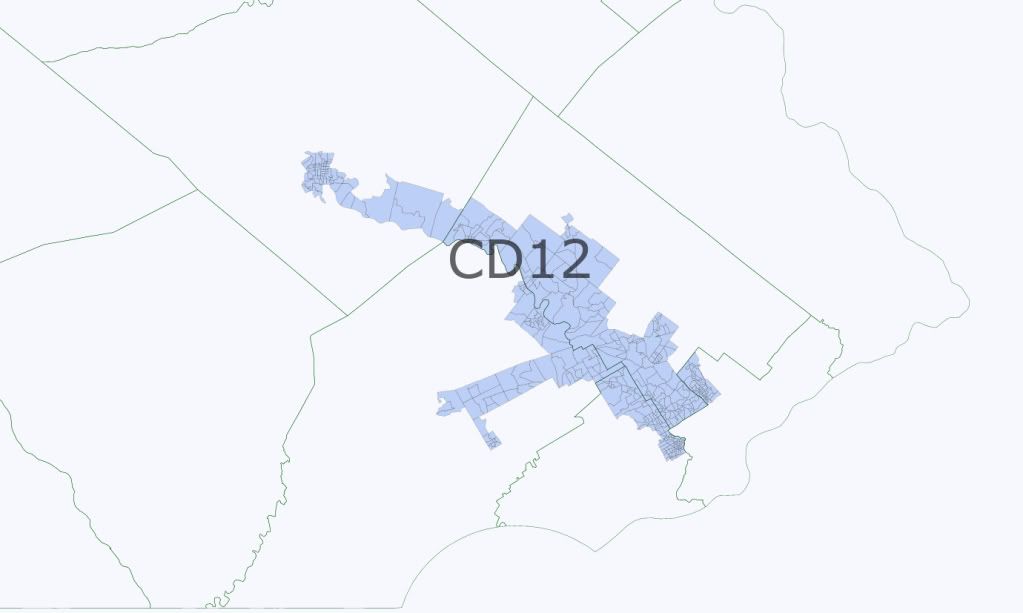
PA-12 (was PA-19)

Incumbent: Todd Russell Platts


Population White Black Hispanic Asian
682014 92 3 3 1


Obama % McCain %
Old lines 43 56
New lines 41 58
% change -2% +2%

I didn’t set out to strengthen Platts, but given the strength of the red turf around him it was hard not to. His district loses much of York County to give Joe Pitts a chance and compensates by grabbing the rest of Cumberland County plus Franklin County.

Except for York and a very few Harrisburg suburbs, there’s pretty much no Democratic strength in the district.

That said, it’s neither an overly cohesive nor a pretty-looking district. Franklin County doesn’t really belong in s South Central Pennsylvania district and the lines in York are as bad as they are because I had to preserve Platts’ home in the district.

If Republicans pick a more cautious option, expect them to concede a seat in the Delaware County area and combine Pitts with Platts. Platts’ occasional outbursts of sanity would surely doom him in the primary and it’d be possible to draw much neater lines.

For that matter, I wouldn’t be shocked if Republicans drew Platts out of here anyway and replaced him with somebody more reliably obstructive.
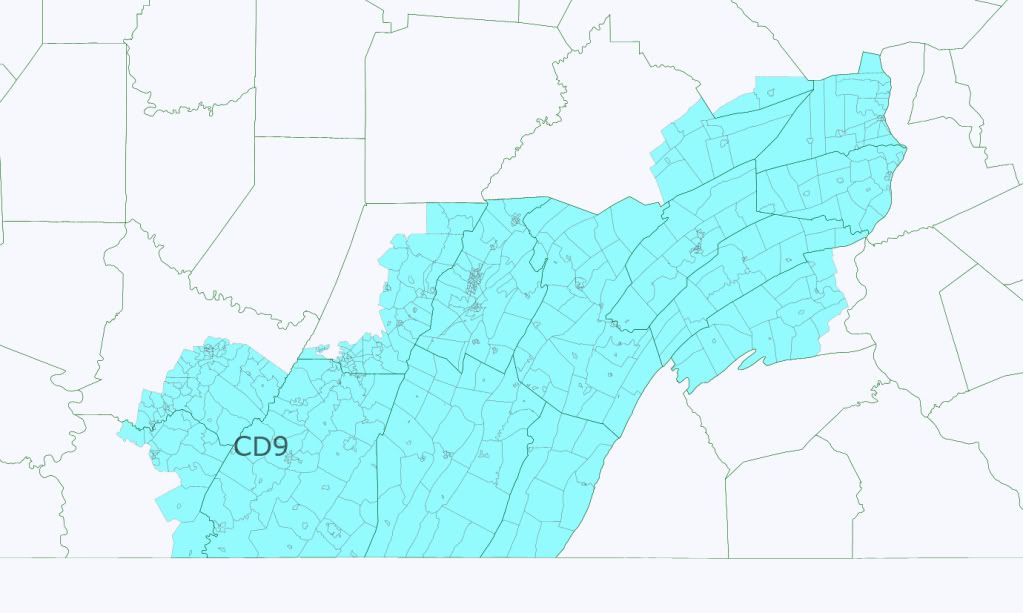
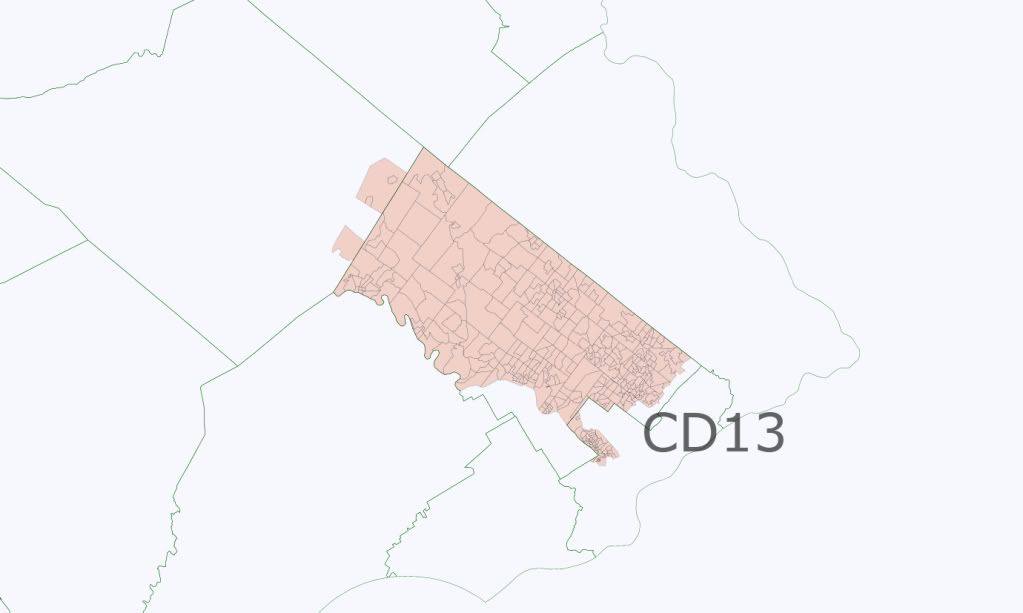
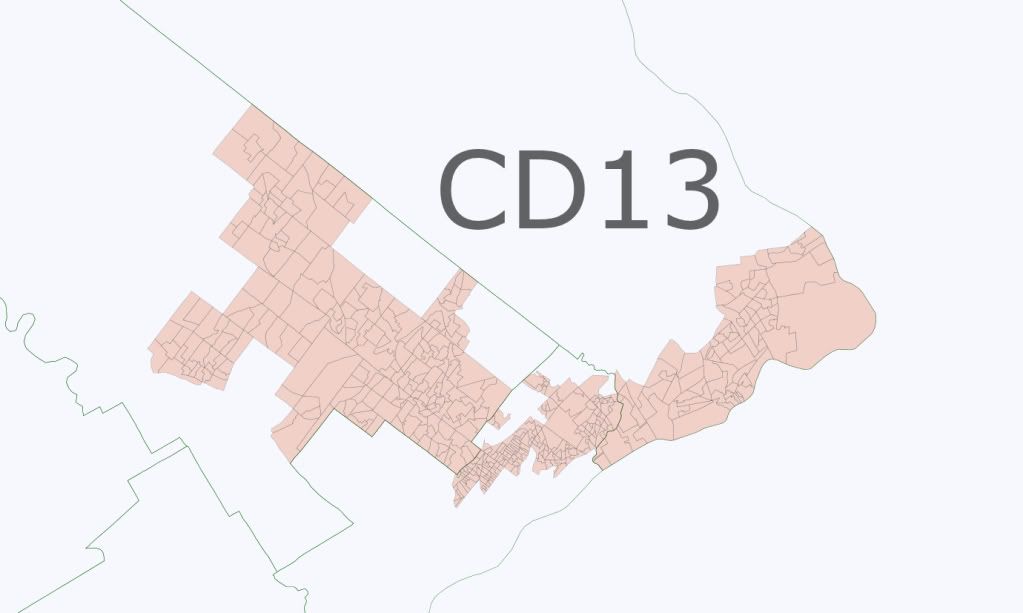
SW PA close-up

PA-13 (was PA-9)

Incumbent: Bill Shuster, Mark Critz


Population White Black Hispanic Asian
680879 96 2 1 0


Obama % McCain %
Old lines 35 63
New lines 42 57
% change +7% -6%

Removing Mark Critz really isn’t that difficult. He lives in Johnstown and derives his margin of victory from parts of Cambria County plus the towns along the Monongahela River.

By throwing all of Cambria County into the new 13th, which otherwise takes only a few small and red-leaning parts of Armstrong and Indiana from the old 12th, he’s left with a district a net fourteen points more Republican than the one he currently has. Meantime, Shuster keeps all his old base.

Otherwise, this district is basically just a much less ugly version of the old 9th. County fragments are reduced, with the district no longer taking in any of Fayette or heading north-west through the Appalachians towards Harrisburg. Spurs towards the Allegheny Plateau and Pittsburgh make it a little less compact than it might otherwise have been, but it’s a long way from the worst district on this map.

In the process, it goes from being a 35% Obama to a 42% Obama district, but there’s really not much need for an R+17 district in Pennsylvania. R+10 or so is fine.
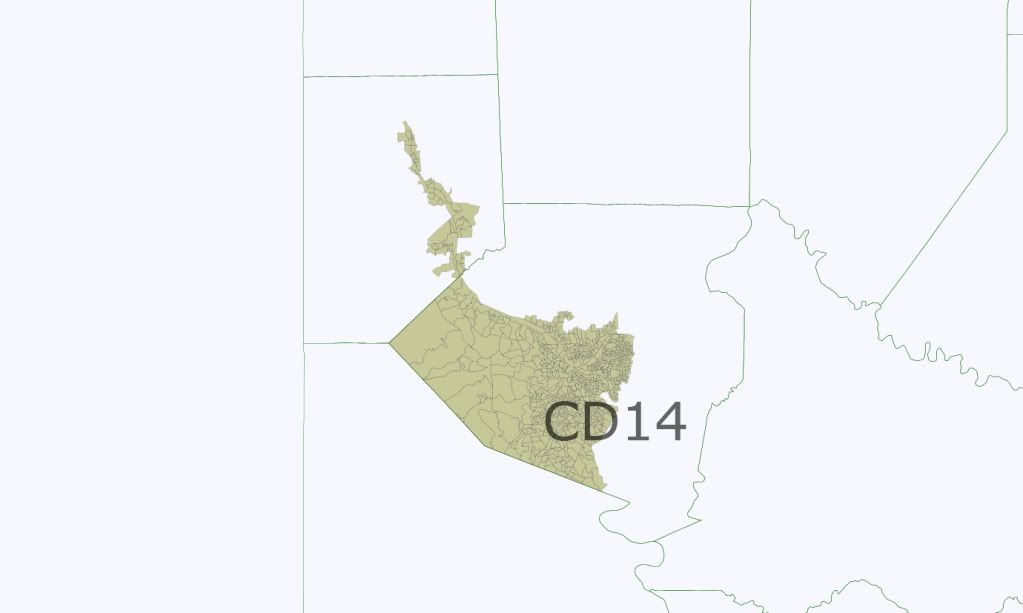
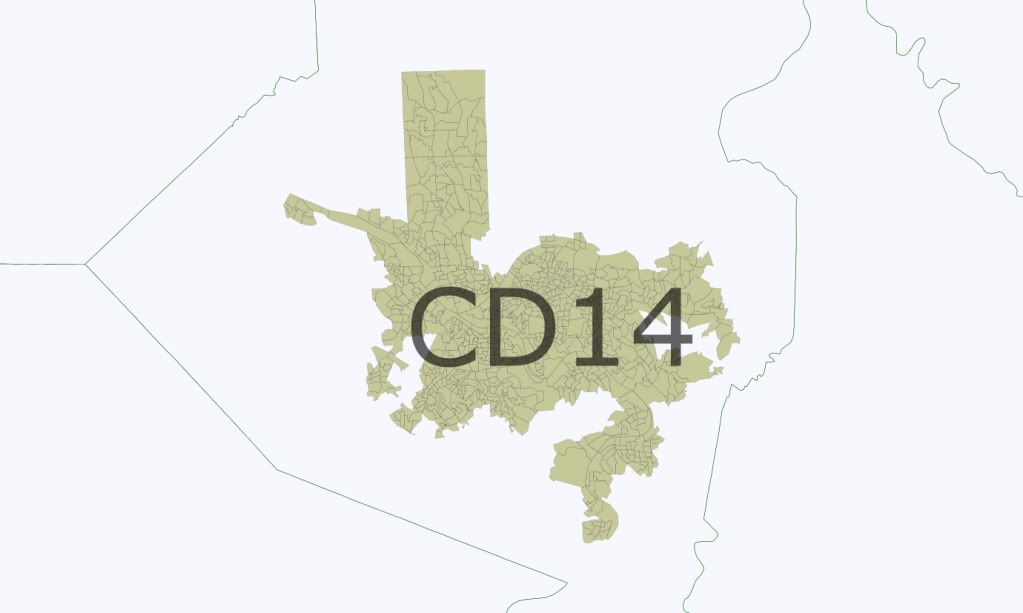
PA-14 (was PA-5)

Incumbent: G. T. Thompson, Kathy Dahlkemper


Population White Black Hispanic Asian
683996 95 3 1 0


Obama % McCain %
Old lines 44 55
New lines 46 52
% change +2% -3%

The most populous district designed for a Republican, this district remains broadly similar to the old 5th, it just shifts a county or so north-west.

In the process, the city of Erie is drawn into the district. Without Erie, the district is actually even more Republican than before (the removal of State College to the 11th helps). With it, the district moves towards the blue team, although as there’s a lack of Democratic strength anywhere in it outside the north-west of the district, it shouldn’t be overly vulnerable.

Kathy Dahlkemper lives here, but most of the district is new to her and the rest of the district could be won by just about any Democrat, so there’s no reason to assume she’d be the obvious 2012 challenger.
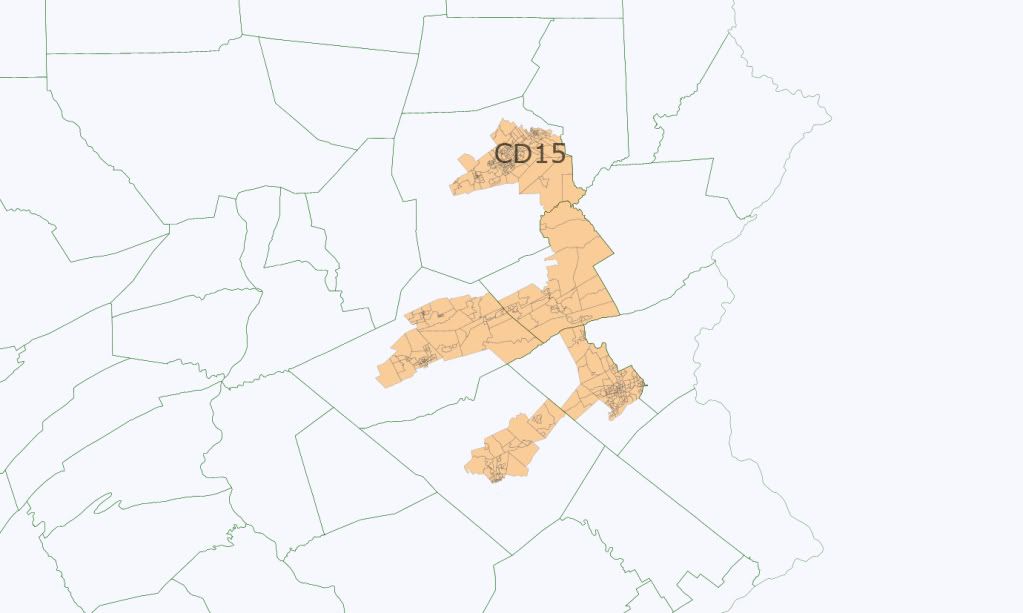
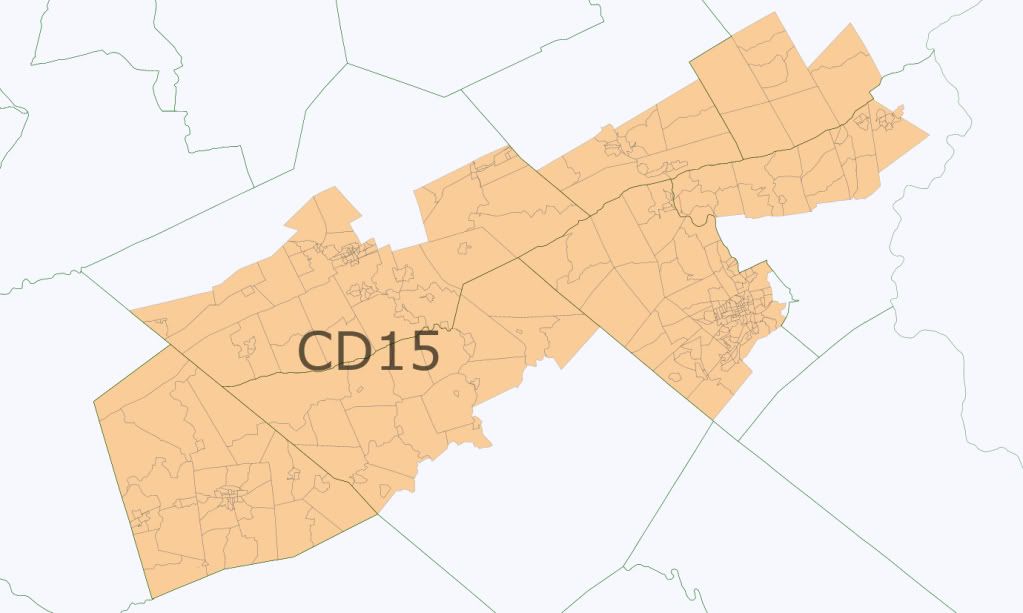
PA-15 (was PA-3)

Incumbent: Mike Kelly


Population White Black Hispanic Asian
681691 94 4 1 0


Obama % McCain %
Old lines 49 49
New lines 47 51
% change -2% +2%

I know almost nothing about Mike Kelly, so if he’s a complete nutter then you might need to give him a safer district. If he’s at least somewhat sub-Bachmann, however, this district, which maintains the core of the old 3rd, ought to be defensible by him.

Residual Democratic strength in Lawrence and Beaver Counties might cause him a little problem initially, but at least on a presidential level Democratic strength is already limited to the areas bordering the Ohio, Beaver and Shenango rivers, and if he’s still around by the end of the decade then Democratic strength in western PA may be a bygone memory.
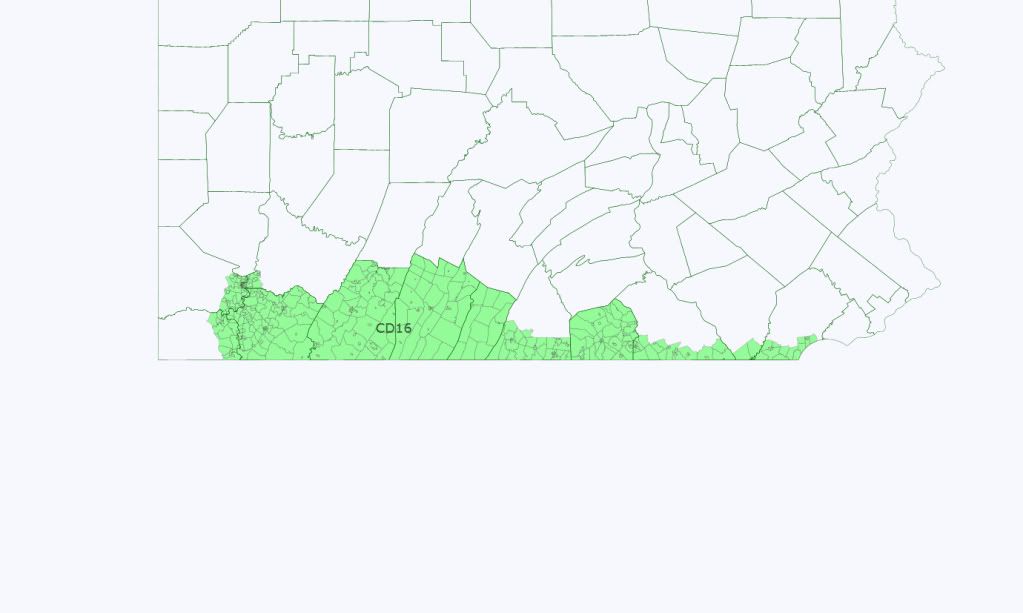
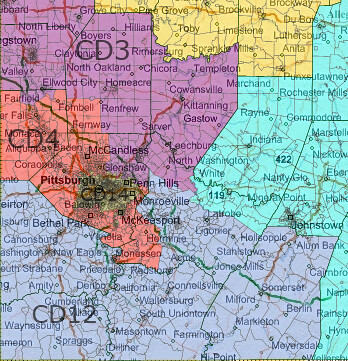
PA-16 (was PA-4)

Incumbent: Jason Altmire, Keith Rothfus


Population White Black Hispanic Asian
682825 96 2 1 1


Obama % McCain %
Old lines 44 55
New lines 42 57
% change -2% +2%

Altmire just hung on this year, but the unwinding of Democratic strength in the west will make his job a little harder everyday. This map just aims to make it that little bit harder.

Beaver and Lawrence counties, which still vote Democratic downticket, are replaced by large chunks the considerably more Republican Westmoreland County. Of the seven state representatives representing Westmoreland-based districts in the general assembly, Democrats hold two that was uncontested and one that was contested this year, Republicans hold three (including one gain), whilst the seventh representative was nominated by both parties, so the downticket trend is clearly well-advanced there.

In Allegheny, most of the land north of Pittsburgh and the rivers is taken, except for a small area in the north-east that I dumped into the 13th. South of the Ohio, a thin line of swingy tonwships is also taken to help out Tim Murphy.

This might not finish off Altmire entirely – you’d need to dissect his base and doing so could endanger somebody else – but it’ll make his life more difficult and make him that much more vulnerable to bad Democratic years.

His 2010 challenger, Keith Rothfus, remains in the district, but other and more intimidating candidates might emerge.

PA-17 (was PA-14)

Incumbent: Mike Doyle


Population White Black Hispanic Asian
684659 74 21 1 2


Obama % McCain %
Old lines 70 29
New lines 69 30
% change -1% +1%

Doyle’s district maintains its original core of the city of Pittsburgh and some close suburbs, but to achieve population equality and to screw over Mark Critz whilst protecting Tim Murphy, it then heads down the Monongahela valley, taking in parts of Allegany, Washington, Westmoreland, Fayette and Green counties and reaching almost to the West Virginia border. No townships are split, which is the reason the district becomes slightly less Democratic.

The district remains entirely safe, and the other half of Mark Critz’s base is securely esconced in a Democratic district.
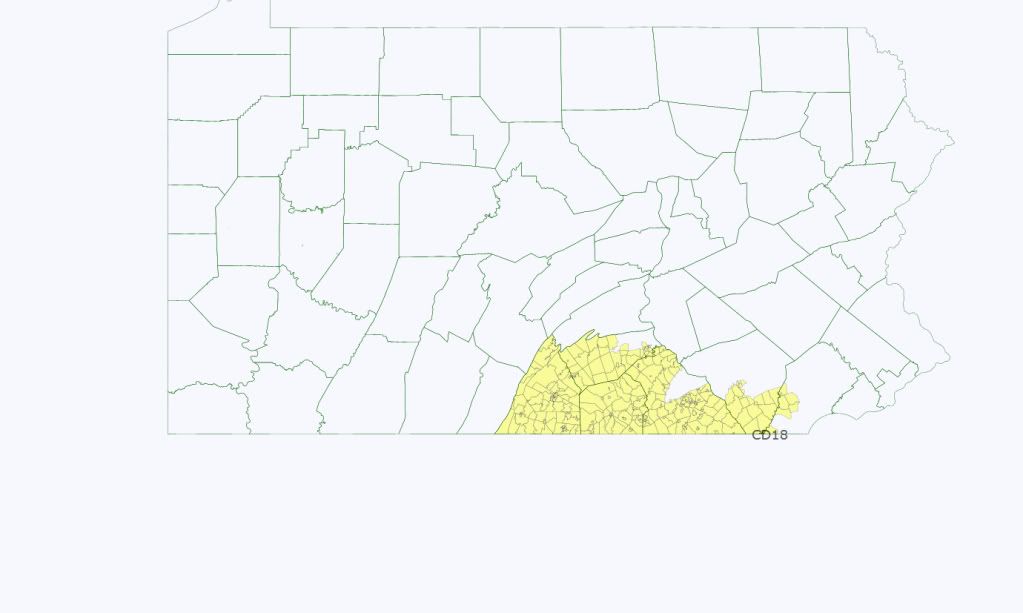
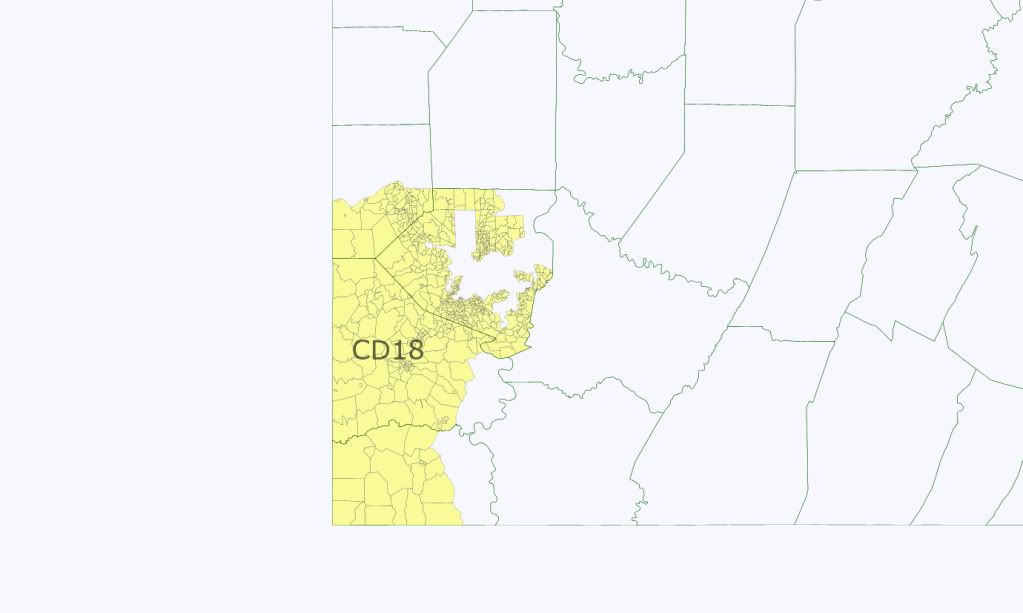
PA-18

Incumbent: Tim Murphy


Population White Black Hispanic Asian
683653 95 2 1 1


Obama % McCain %
Old lines 44 55
New lines 46 53
% change +2% -2%

Murphy takes, somewhat obviously, everything that’s left. This basically consists of non-riverine portions of Fayette, Greene and Washington, south-east Westmoreland and much of south and south-west Allegheny.

Whilst it does get a little more Democratic, Murphy has represented most of this area for long enough not to face too many problems.

–  –  –  –  –  –  –  –

I think it will have become clear by now where the major weaknesses with the map lie. How long can the GOP hold on to suburban Philadelphia seats that are trending against them, and would it be smarter just to give them up? How do you get three Republicans out of the Lehigh Valley and the north-east without making yourself very vulnerable to waves? Is it safe to split Erie County? How much do you have to weaken Altmire to guarantee his defeat? How much duct tape will be needed to shut up Joe Pitts?

I’d guess that at some point towards 2020 this map will be 10-8 Republican at best. It could get even worse. But I can’t see them abandoning any of their incumbents, so they have relatively little choice.

Suggestions as to how they can do this better are, of course, gratefully received

Pennsylvania gets wyoming’d

First of all, this is my first diary and my first redistricting so be gentle! Also, there is one small error in the bigger pictures, however it is fixed in the zoom ones.

I basically did a very dem friendly redistricting of Pennslyvania under the Wyoming plan. This gives PA 25 seats of about 491,242 that MassGOP has made diaries on.

Without further ado, the map: http://img.imgcake.com/pajpgbu…

Without counties/cities: http://img.imgcake.com/paunmar…

Zoom on Philadelphia: http://img.imgcake.com/phillyu…

East PA: http://img.imgcake.com/eastpai…

SEPA: http://img.imgcake.com/southea…

District 1 (Blue): Obama 73%

Plurality Minority  

Goes from Philly to chester county, covering most of delco along the way. I was surprised how democratic the district was. 49 W 44 B

District 2 (Green): Obama 58%

Just gave the district a chunk of philly then tried to make it more conservative, so it went into Bucks, Montgomery and most of South Delaware. Should be reasonably safe.

District 3 (Purple): Obama 56%

Northeast Philly and wraps around the 2nd and 4th. Most bucks, but also Northampton and Lehigh. Would lean strongly D, and it would only get moreso. Would be vulnerable in another 2010 like year.

District 4 (Red): Obama 55%

Takes Allentown and half of Bethleham. Goes into Montgomery, Bucks, a lot of lehigh, and northhampton. Should be ok in most years.

District 5 (Yellow): Obama 55%

Rest of Bethleham, Easton, and most of Hazleton. All of carbon and monroe counties. Only 2 people off the population goal. Should lean Dem.

District 6 (Teal): Obama 53%

Wilks-Barre, the scranton suburbs, a tiny piece of scranton, all of Montour, columbia counties and the majority of wyoming, luzurne and lackawanna. (Thank you the office for spelling of that). Would tilt D but probably require a blue dog.

District 7 (Silver): Obama 54%

The funniest district in the state, containing the rest of scranton, most or all of 3 northeastern counties, and going all the way to Penn State. Leans D

District 8 (Violet): Obama 64%

This one is ugly. Starts in Philly and just goes out. Snakes through Montgomery to get some of the central pa counties like Snyder and Mifflin. Easy D.

District 9 (Sky Blue) Obama 58%

The most Liberal parts of delco and montco along with eastern chester county. Leans D pretty heavily.

District 10 (Pink) Obama 53%

Harrisburg, Half of Lancaster and coatsville. Pretty tough to hold but def doable. Leans slightly

District 11 (Lime Green): Obama 73%

Starts in Philly and snakes.

District 12 (Robin’s Egg Blue): Obama 57%

Starts in Philly and snakes up to central. Easy Dem.

District 13 (Tan): Obama 89%

VRA district. 29 W 46 B 19 H

District 14 (Gold): Obama 39%

Huge by Land Area, takes a ton of the conservative areas into one votesink.

District 15 (Orange): Obama 53%

The one I’m perhaps most proud of. Goes from York to Pittsburgh. Takes Altoona, Johnstown, and some of the bigger Pitt suburbs. Blue dog should take this one easily.

District 16 (Slightly darker lime green): Obama 50%

Reading and the other half of Lancaster. True toss-up, very winnable.

District 17 (Navy Blue) Obama 40%

The surprisingly heavily populated York, Adams and Franklin counties in south central pa. Not a shot in hell for us to win it.

District 18 (Bright yellow): Obama 41%

Scraps. Takes parts of a lot of other counties. Easy R win.

District 19 (Pea Green): Obama 40%

A lot of the Southwestern counties. Easy R win.

Pitt close up: http://img.imgcake.com/pittclo…

District 20 (Light Pink): Obama 52%

Parts of Pitt and Washington county and Fayette county. Lean D or Toss-Up

District 21 (Blood Red): Obama 54%

East Pittsburgh, some suburbs and then it just snakes out east. Lean D

District 22 (Poo Brown): Obama 38%

One of the most conservative districts in the country. Easy easy R.

District 23 (Baby Blue): Obama 54%

Erie, Saint Mary’s and a lot of the more liberal areas in the Northwest PA. Lean D

District 24 (Dark Purple): Obama 55%

Lots of pittsburgh and Allegheny county. Likely D

District 25 (Pink-Red Mesh): Obama 49%

What was left. Surprised it was still winnable for us.

Lean Dem or better: 18

Toss-up: 2

Easy R: 5

Thoughts?

A rigged election in Bucks County

As Bucks County goes, so likely will the Commonwealth of Pennsylvania within 2% in both statewide races this year.  With about 640,000 residents and over 5% of the state’s voters, it is the fourth-most-populous county of PA and is located in suburban, exurban, and rural areas northeast and north of Philadelphia most of the way to the Lehigh Valley.  It is whiter, wealthier, more Asian, and lower in unemployment than the state average.  Stunning new evidence came to light this afternoon that the GOP-controlled Board of Elections tampered with Republican absentee ballot applications, altering and fixing those that were incorrect or incomplete to keep them from being rejected.  At the same time, the GOP Board has been rejecting hundreds of Democratic applications, often based on the same problems that they fixed on the Republican applications.

The new revelations continue to demonstrate a deeply troubling pattern by Mike Fitzpatrick’s GOP allies to target Bucks County Democratic applications for rejection and suppressing the Democratic vote. Over 600 absentee ballot applications have been rejected by the GOP Board – over 80% of which were from Democratic voters. In other words, the partisan Board of Elections has rejected 6 Democratic applications for every 1 Republican.  Former County Commissioner Fitzpatrick is in a rematch for the US House seat that he lost after one term in 2006 to Patrick Murphy (a great man whom I knew and admired at King’s College, Wilkes-Barre) by a fraction of a percent.  The 8th Congressional district includes Bucks and nearby areas of Montgomery and Philadelphia Counties.  The Democrats captured the registration edge early in 2008, although the Republicans retain the commissioner majority and all row offices in Bucks.

Michelle Merrick, a registered Republican from Bensalem, submitted an application for an absentee ballot, which included incorrect and missing information. The Board of Elections actually corrected the application for her.  Michelle registered to vote under her maiden name “Michelle Merrick,” but she filled out the application under her married name, “Michelle Rubin.”  In an attempt to salvage the application, the Board of Elections altered the application to read “Michelle Rubin Merrick.”  Despite the Board of Elections’ blatant attempt to salvage this Republican’s absentee ballot application vote, she still failed to include her birthdate, which should have invalidated her application.  It didn’t.  Meanwhile, Democratic applications have been denied for innocuous mistakes relating to the date of birth, like filling in “today’s date” instead.  But unlike Michelle, they will not have the opportunity to vote absentee or have their voice heard in Tuesday’s election – simply because of their political party.

Among the Democrats rejected was Wade Messer.  In the space for birthdate, Wade made a mistake and wrote in the date that he filled out the application: 8/15/10.  But Wade is a registered Democrat, and he didn’t get the same special treatment as Michelle.  Wade’s ballot application was rejected.  Scott Leossy made the same mistake, putting the date he applied – 8/25/10 – on the line for the applicant’s date of birth.  But Scott is a registered Democrat and he didn’t get the same special treatment as Michelle.  Scott’s ballot application was rejected.  These facts add to the pattern of GOP voter fraud and partisan politics at the Republican-controlled Board of Elections, coming on the heels of revelations that GOP candidates Mike Fitzpatrick and Rob Ciervo sent a letter to Bucks County voters instructing parents on how to commit voter fraud on behalf of their kids.  http://www.politicspa.com/gop-…

What is alarming in this case are the double standards employed in a blatantly-partisan manner.  I’m afraid that these revelations are a little too late to prevent Fitzpatrick from winning, but any criminal actions in this case must not go unpunished!  We must urge US Attorney General Eric Holder to use the Justice Department to investigate this matter aggressively.

Florida 2000.  Ohio 2004.  Bucks County and Washoe County, NV 2010.  Virginia 2012?  Rigged elections are as American as apple pie in the 21st century.  This shit has to cease!  Kindly take action.—BDH

Meanwhile, donate to fraud investigator/journalist Greg Palast at http://www.gregpalast.com/store/ so that you can read the comic “Steal Back Your Vote.”