5-2 Colorado Dem map

There have been many fantastic maps drawn that highlight the potential extremes of gerrymandering, from both political parties.  I humbly submit my attempt at making a safe 5-2 map in Colorado that will endure even in bad years for us.  Now, I know that either a compromise map or a court-picked one is likely due to the split control in the Colorado legislature, this is purely a what-if scenario if Democrats ran the process and were very aggressive.

Also, this is my first time using Dave’s redistricting app and I would appreciate comments and helpful criticism.

My goals were difficult.  Colorado is historically a Republican-leaning state and though our statewide ticket did great in 2010, we lost two of our five incumbent representatives.  The red counties simply got redder, but there is reason for optimism at the way some other areas of Colorado have trended, in particular the Denver area and suburbs, Boulder, and Fort Collins.

I started with this map as a baseline for what to expect in a tough election, that of the 2004 presidential race where Kerry lost Colorado by 5%, and compared that to Obama’s easy win in 2008.

Massive swings across the state, with the most impressive being those in the corridor from Colorado Springs, up to the top of the state.  Several counties flipped to blue in a big way…Larimer, Jefferson, and Arapahoe being the most significant I think for long-term Democratic strength in Colorado.

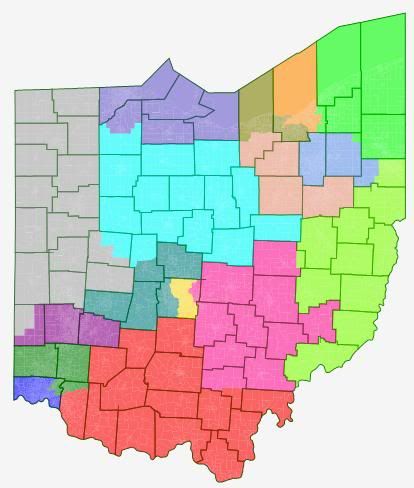
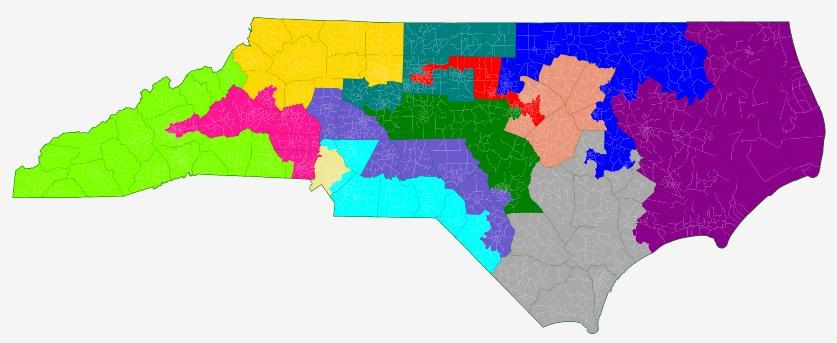
So it was my goal to build on the emerging Democratic strength in those areas, make two GOP vote sinks by combining Mike Coffman’s and Doug Lamborn’s districts, as well as Cory Gardner’s and Scott Tipton’s districts, and leave the rest reasonably safe for us.  Here goes:

In short, I looked to the maps being proposed by Colorado legislature Democrats for inspiration (primarily in what I did with CO-05, CO-06, and CO-07), and then read a number of good ideas in the comments that I tried to incorporate.

The maps proposed by Democrats in the legislature are good, and more or less ensure a 4-3 split for us by turning CO-06 into a Democratic district.  But they don’t budge the needle much in CO-03 or CO-04, leaving both as winnable, but still Republican-favored.  Such is the nature of compromise and preparing to win should they go to court.  I am free from such concerns.

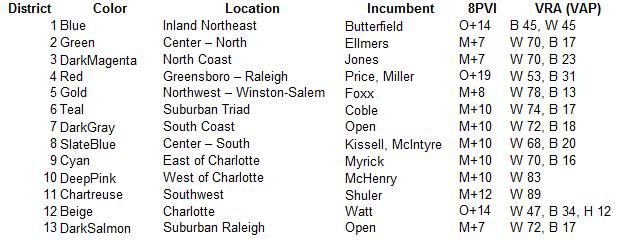
1st-Dark Blue: (DeGette).  Tradition seems to favor keeping the oddly shaped Denver county as whole as possible in this district, but I clipped the northern parts, and moved this district more to the south, eating up a portion of Arapahoe County and even getting into the northern-most parts of GOP stronghold Douglas county.  It certainly drops at least 10 points worth of Democratic performance, but this doesn’t come close to being competitive.  The bulk of the district is in precincts Obama was hitting 70% in.  There’s simply no reason to waste so many Democratic votes in CO-01.  Stats: 67% White, 6% Black, 21% Hispanic, 4% Asian (old: 52% W, 9% B, 33% H, 4% A).

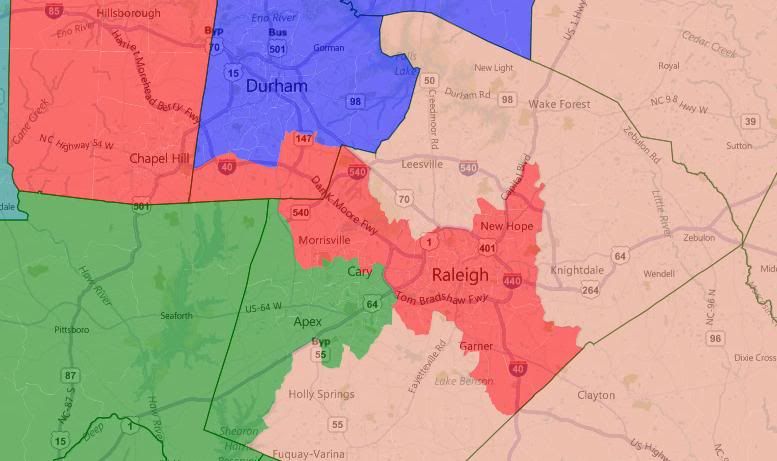
2nd-Green: (Polis).  State Democrats were already looking to expand this Boulder-based district out to grab more physical area than it has now.  Instead of sending him out to Grand Junction, I had him go north to take Larimer County (home of Fort Collins) which Obama won by 10%.  This is still a very safe Democratic district, and by depriving CO-04 of it’s biggest current county, I am able to do other fun things.  Stats: 81% W, 1% B, 13% H, 3% A (old: 79% W, 1% B, 15% H, 3% A).

3rd-Light Blue: (no incumbent).  There’s Dem-leaning Pueblo, all by itself down there in the current CO-03, and the proposed Dem maps take GOP-stronghold Grand Junction out but put in a bunch of red counties currently in CO-04 and CO-05 that still makes it hard for us.  I simply chose to have it go for the ski counties instead, and turned this into a district I’m sure Obama won by a good margin.  Since the Dem maps already attempt to split El Paso county this time, I figured I might as well follow suit, and sent a finger up to grab a bunch of majority-minority precincts in southern Colorado Springs.  Even if that is not politically likely, just by removing all the ultra-red counties along the western border, and substituting them for central ski counties, we should be able to make a Democratic seat.  Stats: 69% W, 3% B, 24% H, 1% A (old: 75% W, 1% B, 22% H).

4th-Red: (Gardner and Tipton).  Now the fun begins.  By removing Fort Collins from CO-04, it must seek additional population, so I simply had it run around the perimeter of the state and go up through the conservative counties of the current CO-03, in effect combining both districts to make an ultra-GOP vote sink, based in Greeley and Grand Junction.  Yeah it looks bad, but hey the Republicans are always complaining that the rural counties don’t get a voice…here’s your dream district!  Stats: 75% W, 1% B, 20% H (old: 79% W, 1% B, 17% H).

5th-Yellow: (Lamborn and possibly Coffman).  An idea I borrowed from the legislature Democrats.  Why have two solid GOP districts along the I-25 when the districts can be narrowed and combined into an ultra-GOP vote sink?  Coffman doesn’t live in this district but unfortunately for him most of the current CO-06 is here, including his best performing areas in Douglas County.  He could try to run in the new Aurora-based 7th but he would get destroyed.  My guess is he would seek other office or retire.  He wouldn’t be the first guy to see his district evaporate.  Stats: 79% W, 3% B, 11% H, 3% A (old: 77% W, 6% B, 11% H, 2% A).

6th-Purple: (no incumbent).  Also basically copied from the proposed maps.  Changes from an exurban GOP stronghold south of Denver into an east suburban Aurora district.  Contains swingy areas in the south, but the northern half of this district contains some of the most heavily minority precincts in the state…Coffman has no chance in this district, no Republican does.  It skips across a few county lines, but it’s fairly compact compared to the oddly-shaped current CO-07 that contains a lot of this area right now.  Stats: 51% W, 12% B, 29% H, 5% A (old: 88% W, 2% B, 6% H, 3% A).

7th-Orange: (Perlmutter).  Drops most of the eastern Aurora-based earmuff and settles into a nice compact Jefferson County based district.  The location plays to Perlmutter’s strength in Jefferson but even if he leaves, the pieces in Denver and Adams county ensure it will stay blue.  Stats: 68% W, 1% B, 25% H, 3% A (old: 69% W, 6% B, 20% H, 3% A).

A Democratic Washington

Washington voted for Obama in the 2008 presidential election by a wide margin, 57.6%-40.5% (17.1%). Therefore I’ve created a map where all ten congressional districts have the same Obama percentage, that is the same margin he won statewide.

All ten districts are within 0.05% Obama pecentage and 500 population of the median.  

A Democratic Mississippi

This map creates two Democratic districts with a PVI of at least D+10 and two Republican districts with a PVI of at least R+30, which would be the two most Republican in the country.

The districts are contiguous, even when they don’t really look like it, including a narrow strip along the gulf shoreline for the fourth district.

As always I crunched the actual precinct data to produce these maps. However in this case, to my horror, I could have saved a week of transcribing scanned county records and just maximised the minority districts since they produce almost exactly the same map. Nevertheless at least this way we have precise voting totals for each district.

1st(Blue): 63.2% Obama 37.8W 57.3B

2nd(Green): 66.2% Obama 36.1W 59.1B

3rd(Dark Magenta): 22.4% Obama 79.6W 16.0B

4th(Red): 22.3% Obama 78.8W 15.1B

Redistricting Oregon: O So Svelte

Dave Bradlee finally managed to sort the obnoxious problems with Oregon’s 2010 Census data, which means it’s time for me to give my home state a whirl.

Nothing too much has changed, as you can see. It just has pretty lines and definitely preserves communities of interest. Only three counties (Columbia, Josephine, and Lincoln) are split between congressional districts, and none of those three are split between more than two districts.

OR-01 (blue)

Democratic Rep. David Wu, who lives in Multnomah County, is out. Unfortunately, some depopulation along the Oregon Coast means this district is stretching a bit further south to find constituents, which is maybe the only part of this map I’m not thrilled about (for aesthetic reasons). As for the politics, as this is a horse-race elections site: Despite Yamhill County’s Republican lean, the great majority of this district’s population is in true blue northwestern Oregon. If Wu can be kept out by this redistricting job, state senators Suzanne Bonamici and Mark Hass are probably in line, provided Labor Commissioner Brad Avakian doesn’t want the job. The inside scoop is that if Wu’s job opens up, he’s got first right of refusal. Likely Democratic.

OR-02 (green)

Walden lives in Hood River. Hood River has been moved elsewhere. Even if Walden doesn’t move back – and I think the diehard conservatives in eastern Oregon, which is (surprisingly enough) one of the most conservative parts of the entire country, may prefer to send Oregon Senate Minority Leader Ted Ferrioli or Bend-area state senator and ambitious “rising star” Chris Telfer to Congress instead of Walden, a close ally of (the possibly doomed) Speaker Boehner who has taken flak for being a leading member of the quasi-moderate Main Street Partnership – this district is red enough to elect an Oregonian version of Christine O’Donnell without a fuss. Anyway, I felt Hood River County belongs with eastern Multnomah County in terms of communities of interest more than it belongs with the high desert cow counties. Safe Republican.

OR-03 (purple)

Democratic Rep. Earl Blumenauer’s district has consolidated all of Multnomah County, taken over Hood River County, and poked up into Columbia County just a tad bit, simultaneously withdrawing from Clackamas County. As for politics: Che Guevara could get elected here by double-digit margins. Walden could run here, but he would get clobbered. Wu could also run here, but he would also get clobbered. Mostly, I just think this district looks nice. Safe Democratic.

OR-04 (red)

One of the enduring mysteries of Congress is the charmed existence of Democratic Rep. Peter DeFazio, a blunt, unabashed, aggressively off-the-reservation left-winger sitting in a light-blue seat. Last year, when conditions seemed perfect for a Republican to potentially upset DeFazio, Republicans in the district nominated certifiable crazy person Art Robinson. DeFazio’s final margin was closer than expected, perhaps on account of his taking victory against Robinson pretty much for granted, but it was still fairly convincing. This district hasn’t changed much. DeFazio still has the red ball-and-chain that is Linn County tethered to him, but it’s easily offset by flaming liberal Benton and Lane counties, both of which are anchored by legendarily left-wing college towns. In terms of actually drawing the map, since I wasn’t consulting political data, it was basically just leftover western Oregon and as much of southern Oregon as fit with population limits stretching east from the coast (which turned out to be not much). Likely Democratic.

OR-05 (yellow)

What is there to do about Democratic Rep. Kurt Schrader? Well, one thing to do that would make Clackamas County residents happy would be to give the piece of OR-03 reaching down a little bit into Schrader’s home county back to this fairly swingy district. Another thing might be to embark on a registration drive in increasingly Hispanic Salem and its suburbs, but that’s not really redistricting’s job. Redistricting’s job is to preserve communities of interest, and that was my chief consideration here. As a progressive who generally supports Democrats, I’m not honestly worried about Schrader, and this is why: Republicans target OR-05 every cycle, and every time, they do worse than they were expecting. Last year, Schrader was supposed to lose to Scott Bruuuuuuuuuuuuuun (who, yes, still lives in this district). He won by over five points instead. Republicans were supposed to take over the district in 2008 when then-Rep. Darlene Hooley retired. Schrader crushed Hooley’s 2006 opponent (who was supposed to beat her then, too) by 16 points. Fun fact: in this D+1 district, Republicans haven’t even come as close as five points away since 1994 – the cycle before then-Rep. Jim Bunn lost to Hooley (in 1996) by a margin nearly identical to the margin by which Schrader prevailed last year. For whatever reason, this district is fools’ gold for the Oregon Republican Party. But my favorite part of this redrawn district? It consists simply of all of Polk, Marion, and Clackamas counties, and it’s just 515 heads over the target population. Sexy. Lean Democratic.

3 VAP African-American Districts in Louisiana!

It seemed way too easy to make 2 VAP (Voting Age Population) black districts in Louisiana. I feel like even if there wasn’t 3 VAP districts, there could easily be two with another heavily leaning Dem district, making the new delegation a 3-3 split with LA losing one seat this year.

As I gerrymandered through New Orleans, Baton Rouge and LaFayette, I realized I didn’t even have to really go to Shreveport to Monroe for 2 districts, and it seemed there were quite a few black precincts left so I decided to try to make 3 VAP districts. It took a lot of maneuvering and one area of water contiguity over the lake, but I did it! It’s the most horrible map, though, and would never obviously be drawn.

My other goals were to not use touch-point contiguity, which I did not, and also not use water contiguity, which I failed to do, but oh well.

All racial numbers are VAP, if it was simply out of all population, the black percentage numbers are a few points higher in all districts. Also, the biggest deviation from target population is the blue district, which has 5,691 more than the target.

Enjoy!

LA-01: The Green district here is the first VAP black district. It is centered on New Orleans, of course, and carefully zigzags around to avoid highly white voting districts and also to pick up extra black precincts outside of New Orleans. I have a feeling this district would have been much easier to create 7 years ago.

38.8% White, 50.1% Black, 6.5% Hispanic, 2.8% Asian

LA-02: The Blue district is where I used water contiguity. It takes in very, very white areas in Eastern Louisiana outside of Baton Rouge, and every white area imaginable inside New Orleans. Look at the big map I first posted for larger look of where the arms extend outside of the city.

79.0% White, 10.0% Black, 7.9% Hispanic, 2.3% Asian

LA-03: The purple district is the second VAP district, and this one is nasty. This district takes in virtually every black precinct imaginable without breaking contiguity, taking in parts of LaFayette, Baton Rouge, Lake Charles, New Iberia and Opelousas. I avoided every area I could that was extremely white (I would take places that were, say, 65% or 70% instead of 80% or 90%. This makes a HUGE difference.)

44.4% White, 50.1% Black, 2.8% Hispanic, 1.4% Asian

LA-04: The red district takes up everything in Southern Louisiana that isn’t black along the coast, and also LaFayette white areas. It also reaches some into Eastern Louisiana, but most of the district is along the coastal parishes. This is the whitest district.

81.9% White, 9.3% Black, 3.4% Hispanic, 1.4$ Asian

LA-05: The yellow district is almost as white as LA-04. It takes in everything that is white in Western and Central Louisiana. It was really annoying to make this contiguous with the last district, but I finally managed to do it without making the final VAP district go under 50.1%.

81.0% White, 12.8% Black, 3.0% Hispanic, 1.0% Asian

LA-06: Dark Green district. This was soooo hard to make VAP for awhile. I kept swapping territory to shed whiter areas to even just a few percentage points lower white areas, and also swapped territory with the purple district and I finally got it. It takes in black areas of Shreveport and Monroe, and also black areas further south in and around Alexandria in the central part of the state. This may be the ugliest district, along with LA-05.

45.7% White, 50.2% Black, 2.0% Hispanic, 0.7% Asian

Illinois Democratic Gerrymander 12-6 – Updated

Illinois is losing one congressional district this year – going from 19 to 18.  I have created a map that takes the current map with a delegation of 11 Republicans and 8 Democrats to one with 12 Democratic seats and 6 Republican ones.  I consider this an ambitious gerrymander favoring the Democrats, but one that is realistic and keeps a few things in mind:

1.) Michael Madigan is in charge and he will look out for his interests first.  He also will never do a dummymander.

2.) The Democratic incumbents also have input and their interests will be considered.  None of them will want their district lines to change much and all want their Democratic primary bases to be kept intact.  They also don’t want to be thrown from safe seats to possibly competitive ones.

3.) African Americans will insist on maintaining their three black majority districts, no matter how much population they have lost in the city.  The Hispanics will want at least one – two may be forced by the courts – but Madigan and his allies will likely push for one Hispanic district to maintain Lipinski’s seat.  Also, we have seen in the City of Chicago that Hispanic majority seats often go to white incumbents who control the Democratic machine.  Alderman Ed Burke’s 14th ward is 88% Hispanic, Madigan’s 13th ward is 72% Hispanic and just elected somebody named “Marty Quinn” to be Alderman.  

4.) Madigan will go after Freshman GOP before those with more seniority.  Not only are they easier targets, but having seniority on both sides of the aisle is good for Illinois.

Below is each new district with data and analysis.  I have calculated the results from the 2010 Senate race (Kirk v. Giannoulias) and from the 2004 Presidential race (Bush v. Kerry – I know, old).  I used the 2010 Senate race rather than the Governor’s race because it is on the Federal level, and to use data against moderate Republican.  I did not calculate data from the 2008 election, because Obama’s landslide was far too big  and unevenly distributed in Illinois (I feel Chicagoland was much more skewed than Downstate).  The 2010 numbers are exact (to the precinct) except for Tazewell, Marion, Moultrie, and Menard Counties, which I allocated votes by ratio of population in each district.  The same goes for 2004 numbers, except I had to extrapolate the precinct data for Lake and Will counties from 2010 data.

For now, here are three tables with election data, racial population data, and VAP data.  I will add more analysis in the next few days.


District  Kirk   Alexi    Bush   Kerry    PVI

1        24.80% 75.20% 23.00% 77.00% D+30

2        25.26% 74.74% 26.39% 73.61% D+28

3        48.14% 51.86% 44.25% 55.75% D+8

4        26.57% 73.43% 26.90% 73.10% D+28

5        47.72% 52.28% 41.53% 58.47% D+10

6        63.33% 36.67% 57.66% 42.34% R+6

7        18.61% 81.39% 15.81% 84.19% D+37

8        53.71% 46.29% 46.66% 53.34% D+4

9        47.77% 52.23% 39.12% 60.88% D+11

10       47.75% 52.25% 39.70% 60.30% D+11

11       68.75% 31.25% 60.55% 39.45% R+10

12       53.24% 46.76% 47.02% 52.98% D+4

13       49.12% 50.88% 45.12% 54.88% D+7

14       64.94% 35.06% 59.55% 40.45% R+8

15       68.33% 31.67% 59.68% 40.32% R+10

16       67.03% 32.97% 57.86% 42.14% R+8

17       56.61% 43.39% 46.84% 53.16% D+3

18       68.31% 31.69% 60.39% 39.61% R+10

ALL

District  White  Black  Hispanic  Asian

1        35.5%   52.7%   8.2%   2.0%

2        31.4%   52.8%   13.4%   0.8%

3        59.5%   6.1%   27.7%   5.4%

4        18.7%   4.1%   73.3%   2.9%

5        65.1%   2.2%   24.4%   6.7%

6        75.4%   3.7%   8.8%   10.3%

7        27.6%   54.5%   12.2%   4.1%

8        48.6%   8.7%   31.5%   9.1%

9        67.4%   7.8%   10.6%   12.0%

10       72.2%   3.4%   10.9%   11.5%

11       92.7%   3.2%   2.0%   0.8%

12       77.5%   16.6%   2.8%   1.1%

13       53.0%   12.7%   27.3%   5.0%

14       82.5%   1.6%   11.4%   3.2%

15       85.4%   6.8%   3.1%   2.9%

16       88.6%   2.6%   6.3%   1.1%

17       77.9%   12.4%   5.8%   1.5%

18       86.7%   5.4%   4.8%   1.6%

VAP

District  White  Black  Hispanic  Asian

1        38.0%   51.7%   6.9%   2.2%

2        34.5%   51.8%   11.7%   0.8%

3        64.0%   5.9%   23.5%   5.7%

4        23.2%   4.1%   68.3%   3.4%

5        69.1%   2.0%   20.9%   6.8%

6        77.7%   3.5%   7.5%   10.2%

7        31.1%   51.8%   11.0%   4.8%

8        54.1%   8.1%   26.9%   9.4%

9        69.2%   7.8%   9.3%   12.1%

10       74.7%   3.3%   9.3%   11.2%

11       93.5%   3.2%   1.7%   0.8%

12       80.0%   15.3%   2.4%   1.1%

13       58.3%   12.1%   23.4%   5.0%

14       85.3%   1.4%   9.4%   3.1%

15       86.7%   6.2%   2.7%   3.2%

16       90.8%   2.4%   4.9%   1.1%

17       81.7%   10.8%   4.6%   1.5%

18       88.7%   5.1%   3.8%   1.5%

Illinois Statewide

Illinois Statewide 2

Northeast Illinois

Northeast Illinois

Northern Chicagoland

Southern Chicagoland

Central Chicago

Central Illinois

Springfield and Decatur

Southern Illinois

Ohio Two-Ways: Fair Districts & GOP-Friendly

This diary presents two different flavors of Ohio maps: Fair Districts (a la Florida) and GOP-Friendly. Ohio doesn’t have partisan data in the App, so these maps represent my best guesses. I definitely consider these maps to be more discussion-starters about maps under the newly-released 2010 data than polished proposals. In the comments, please feel free to share your own maps or information about local partisan leanings that needs to be taken into account.

Fair Districts


Ohio’s geography doesn’t lend itself to “must draw” fair-districts as much as Florida’s does, but I think this is a pretty good stab at it. All three of the counties big enough to support a single district have them, and the rest of the districts are reasonably compact. There are 13 counties statewide split between two or more districts. Columbus is the only incorporated locality split between districts. This is mostly because Columbus has some bizarrely intricate boundaries that are hard to follow. I ended up using the Scioto River as my boundary guide instead of city limits.

If my ratings are to be trusted (and they probably aren’t), this would be a 9 R – 7 D map. VRA note: OH-15 is a plurality African American district, 47.0% VAP.

GOP Friendly


I used the first map as a base, which is probably not the best idea. But I like good-government maps, and I wanted to try to find a GOP map that conformed at least somewhat to good-government principles. All changes described are relative to the Fair Districts map above.

The basic idea here is to pair up Turner and Austria in a Dayton-based district and to pair up Fudge and Kucinich in a Cleveland-based district. Columbus also gets a Democratic vote sink, which means that this map calls for the Republicans to take the hit on both seats. That might not sound “GOP-Friendly”, but they’re maxed out in Ohio post-2010. I think 11-5 is not a bad target for them.

So what’s changed?

First, Cincinnati. Hamilton County is about 80k too many people for a district. In my Fair Districts map, that 80k were suburban whites added to Boehner’s district. In my GOP-Friendly map, that 80k is a plurality-African-American strip along the Ohio River, mainly in downtown Cincinnati, added to Schmidt’s district. Schmidt might not be able to carry a district that incorporates that part of Hamilton. But most Republicans should be able to, so I think worst case scenario is that they lose that district for a cycle. I’ve also wrapped Boehner’s district around Dayton again, so that he has more of his current constituents.

Second, the northwest. Kaptur’s (under this map) OH-08 has been stretched eastwards, pulling OH-07 and OH-09 north. OH-07 and OH-09 have also swapped some territory. I’m pretty sure under the Fair Districts maps the district that Latta lives in has more of Jordan’s old constituents and vice versa. I tried to rectify that here.

Third, the northeast. There are some major changes here. OH-08 and OH-09 have subsumed Lorain County. This has push OH-14 south and east, where it picks up all of Cuyahoga outside of OH-15 and plunges down into Summitt County and (re)gains Sutton as its incumbent. OH-12 becomes a dumbbell-shaped district linking Akron and Youngstown. It does some swapping with the neighboring OH 16 and OH 11 to get incumbents’ residences right. OH-13 drops out of Lorain and picks up Ashland, shoring it up relative to the Fair Districts map. I would be worried as a Republican about LaTourette, because without partisan data, I’m not sure were he stands in that district.

Fourth, the southwest. Johnson’s district drops Youngstown, to his relief. It stretches south into OH-04 (which went into Cincinnati). It still needs to grow though, so it pushes OH-10 north. This is convenient, because OH-10 needed to come north so that Gibbs would live in it. (I think he lives in Holmes County, but I’m not sure.)

Lastly, Columbus. This probably ought to change, since if the Republicans do create a Democratic vote sink here, they’ll want it to be the best one possible. But without partisan data by precinct, I have no idea what that looks like. If the Republicans aren’t willing to concede a distrct in Columbus (which seems likely, if foolhardy), I think they should probably look at splitting Franklin four ways. Again, without partisan data (and without knowing where exactly Stivers lives), it’s hard to say what that should look like. But here’s a possibility:


A Democratic Kansas

In a similar vein to my previous diary “A Democratic Nebraska” I moved a state south to see how Democratic a Kansan congressional district can be. However, early on I noticed that it was actually possible to make two districts in Kansas with a democratic lean, albeit a very, very slight democratic lean. As in the past the numbers are hand tabulated and should be quite accurate.

CD1(Blue): 53.5% Obama 73/9/10 W/B/H

The blight on the landscape that is CD1 stretches its hideous legs out from its nominal centre in Emporia to swallow up Pittsburg, Parsons, Wichita, Hutchinson, Manhattan, Junction City, Topeka, and parts of Lawrence whilst nimbly avoiding republican counties with any sort of significant population.    

CD2(Green): 53.5% Obama 76/9/10 W/B/H

Compared in to CD1 CD2 is has a positively tidy shape. Based in Kansas City (the part that is in Kansas anyway) it runs up along the Missouri through Leavenworth to Atchison and south into the more Democratic parts of Johnson county before turning west into the heart of Lawrence.    

CD3(Dark Magenta): 35.0% Obama 88/2/5 W/B/H

South-eastern Kansas wrapping around CD1. It would be a neater district if it was just southern Kansas and didn’t turn north-east at Hutchinson, honestly I just didn’t want to reassign the precincts south of Manhattan.

CD4(Red): 29.6% Obama 83/1/13 W/B/H

The rest of Kansas. Mostly the western and northern parts of the state but it does follow the Oklahoma state line quite a way east.

The single so called “super-democratic” district turned out to be 57.6% Obama (74/10/11 W/B/H) and appears below.

Arkansas Redistricting: Can It Be Done?

There has evidently been some discussion of drawing a minority-majority district in Arkansas to give the Democrats a buffer against an 0-4 Republican sweep.

My criteria for making this map was:

1. There must be a minority-majority district, no matter how hideous.

2. Rep. Ross must have a district he could potentially retain.

3. Rep. Griffin cannot be allowed to have a safe district to himself.

I’m not going to go district-by-district, mostly because I’m already up past my bedtime. But we have an open seat here, and it’s something new and blue. It’s also 49% white, 44% black, and although it goes up to majority-white when you VAP it, most Democratic primary voters will probably be black, and it’s diverse enough to be a solid Democratic district.

As for Ross and Griffin, they get to square off over my hideous reincarnation of AR-04, which includes a hefty portion of Pulaski County and has a PVI probably not too far off the current R+7 version. But I’m just eyeballing it, and I’ve never even been to Arkansas, so someone should correct me if I’m wrong.

Rep. Womack gets to sit pretty in AR-03, and Rep. Crawford should be quite comfortable in AR-02, a.k.a. the Jolly Green Giant.

North Carolina without an I-85 NC-12

I just wish I could see ten different ways of dealing with the Democrats in the Triad, rather than ten different variations that all deal with them the same way: using NC-12.

roguemapper

Two of the most recent NC redistricting diaries have featured roguemapper’s cri de couer against I-85-based NC-12s in their comments. Here, I’m only delivering two different ways of dealing with the Triad Dems instead of ten. I hope the comment section will make up for the missing eight.

The argument against an I-85-based NC-12 is threefold: (1) it was upheld in the courts as a partisan-based and not minority-based gerrymander; (2) creating a minority-majority NC-12 barely requires leaving Charlotte, let alone Mecklenburg County; and (3) state Republicans have said they don’t want one. I’m currently too lazy to source any of those statements and I’m not interested in arguing them. My purpose is to discuss North Carolina maps that treat that argument as true. Think about it like a move trailer, if it helps:

(booming movie announcer voice) In a world where North Carolina Republicans are committed to a compact, Charlotte-based, minority-majority NC-12… (/booming movie announcer voice)

I’m presenting two maps here. One is an  unaggressive and therefore unlikely map that cuts out Kissell but gives the Democrats a new district in the Triad. (It’s also got retrogression issues.) I’m posting it because I think it’s an interesting baseline for what a minimally gerrymandered map could look like. There’s a grand total of ten counties statewide that are split between two or more districts. The other is an extremely aggressive map which creates 10 McCain districts.

Pictures and discussion are after the jump.

(Note: I don’t generally like changing colors, because I’m used to the defaults and I assume others are too. But there are too many blues in the first 13 colors for a NC map. On the first map, NC-08 is Beige. On the second map, NC-12 is Beige.)

Map One


Not much to say about this one. It’s my best attempt to use county integrity as my first priority, with partisan effects as my second. All six Republicans should be fine in districts that McCain carried by at least 9 points by at least 5 pts. Correction: The preceding sentence was incorrect. My 8PVI rating means that McCain did at least 9 pts better than he did nationally in all six Republican districts, but that only means that he won them by at least 5 points, not 9. The seven Democrats have a more varied range of impacts. Shuler and Miller are in districts that are about one point more McCain-friendly. McIntyre’s district gets a seven point boost in Obama-friendliness. Kissell’s district is axed and relocated to the Triad. Miller and Watt hold steady.

NC-01, obviously, would be contentious. There are retrogression concerns in having it become majority-white in terms of VAP (total population it’s merely plurality white). It’s also lost about six points worth of Obama-friendliness. Something like this would require a Republican legislature that’s willing to test the bounds what the courts will let them get away with. If they were willing to adopt the rest of the map (not likely), some playing around with borders of NC-01 and NC-03 should be able to result in better districts for both Jones and Butterfield and satisify retrogression concerns.  (Note that this map has Jones drawn out of his district.)

I don’t actually endorse this version of NC-01 — again, this particular map is meant to be a baseline for county-integrity. This is important primarily because the Republicans in charge of redistricting have been talking a big game about a clean map. I wanted something to be able to compare to their eventual map.

Map Two

There should be more to say about this one, since it is an actual proposal. But I’m tired, so I’m going to let the pictures tell most of the story. This is, ostensibly, a 10-3 map. Note that is a fairly clean map as well, with a total of 19 counties split between two or more districts.


The three Democratic districts are Durham + the core of the old First, Greensboro + Chapel Hill + downtown Raleigh, and Charlotte. Foxx’s district is red enough to absorb all of Winston-Salem easily. McHenry’s is likewise red enough to absorb Asheville.

I’ve lumped two incumbent Democrats into one uber-Democratic seat in the north and two incumbent Democrats into one fairly-Republican seat in the south. I’m curious how the primary process would play out in this NC-04.

There are two new Republican open seats. Note how evenly spread Republican strength is — all in the McCain +7 to +12 range.


Update: Re-reading my diary, I realized that I incorrectly described the meaning of my 8PVI rating. I’ve struck through and corrected a sentence up in the Map One section. 8PVI is based on Cook PVI but only uses 2008 voting data. It’s a measure of how much better Obama or McCain did in a jurisdiction than they did nationwide. The nationwide balance was 53.5 Obama to 46.5 McCain. So O+10 means Obama won a jurisdiction 63.5 to 36.5. M+5 means McCain won a jurisdiction 51.5 to 48.5.

By what margin will Bob Shamansky win?

View Results

Loading ... Loading ...