North Carolina (Updated!): The Map That Gets Uglier Each Time You Draw It

The lack of political data is a bit of a drawback in coming up with these North Carolina maps, but I’ve drawn North Carolina a few times now. In my experience, it’s hard to draw a pretty map, and in fact, I think it keeps getting grosser and grosser the more I try.

The idea here was to draw a rather unfriendly 4-9 gerrymander for the Republicans. I think it came out largely successfully, though at least two of those GOP districts (and perhaps one Democratic district) may be prone to a bit of wobble. I’d call it a 4-8-1 overall.

NC-01 (blue)

Rep. G.K. Butterfield, the Democrat who represents this VRA district, has little to complain about. It’s not pretty, but it is 44.4% white, 46.7% black, and no Republicans will be interested in seriously challenging Butterfield out here. Safe Democratic.

NC-02 (green)

Hey, it’s an open seat. Well, maybe. This district gobbles up a lot of ruby-red central North Carolina, much of which is currently held by Republican Rep. Howard Coble in modern-day NC-06, one of the most Republican districts in the country. I’m not exactly sure where Coble resides in Greensboro, but most of Greensboro is in another district, so I think this is open. Rep. Renee Ellmers, the freshman Republican who claims this district today, is certainly drawn out. No matter who runs here, the Republican will win unless he or she is caught with a live boy or a dead girl, as the saying goes. Safe Republican.

NC-03 (purple)

Republican Rep. Walter B. Jones, Jr., gets more respect here than most Republican congressmen. He’s an ally of Rep. Ron Paul, the iconoclastic Texas Republican who kick-started the nascent libertarian uprising within the Republican Party back in 2007 and 2008 when he ran for president, then flatly refused to endorse the party’s nominee, Sen. John McCain, in favor of holding a rival event to the Republican National Convention across town. The quirky Jones should be happy with this district, which looks rather similar to his current turf. He benefits heavily from water continuity here, of course. Safe Republican.

NC-04 (red)

Yes. Here is where things get a bit twisted. Democratic Rep. David Price gets thrown into the blender together with current NC-13 Rep. Brad Miller, another Democrat, in this urban vote sink. A primary fight between Price and Miller, both of whom claim a very Democratic voting record and both of whom are members of the extremely endangered club of white Democratic congressmen from the South, could be the source of some yucky schadenfreude for delighted Republican spectators. Whoever is the Democratic nominee will hold this seat, guaranteed. Safe Democratic.

NC-05 (yellow)

This is where Coble goes out of his NC-06. It’s a combination of the northern parts of that district and the current NC-05. Republican Rep. Virginia Foxx, otherwise known as the Mean Granny, has been redistricted elsewhere, paying the price of living at the absolute extremity of her district. If the district absorbed swingy Winston-Salem, it might be more competitive, but in this configuration, Republicans won’t sweat it. Safe Republican.

NC-06 (teal)

Mean Granny actually ends up here, in the district that soaks up Winston-Salem. She has little reason to complain, though, as outside of some parts of the city, the district is eye-blisteringly red. Foxx is such a piece of work that it’d be nice to think a strong Democrat could take her out, but in this configuration, she or any other Republican who runs is basically secure starts out with a solid edge. Safe Likely Republican.

NC-07 (grey)

Somehow, Ellmers lands in this district, while current Democratic Rep. Mike McIntyre goes elsewhere. With all the grace of a drunken giraffe, this district lurches from Ellmers’s home of Dunn down to the South Carolina border, scooping up lots of ancestrally Democratic territory. McIntyre likely would have gotten the boot last year were he not matched up against accused murderer and former Goldman Sachs stooge Ilario Pantano, as demographic trends in this area have not smiled on the Democratic Party. I’d rate Ellmers the favorite, but she’s not exactly Albert Einstein herself, and a good Democratic recruit could give the party a chance at keeping this seat blue post-McIntyre. Lean Likely Republican.

NC-08 (slate blue)

McIntyre, of course, wound up here, in the district now represented in Congress by his fellow Blue Dog Democrat, Rep. Larry Kissell. There’s been some talk of McIntyre running against near-toxic Gov. Perdue for the Democratic nomination in next year’s gubernatorial election, and if he gets deathmatched against his buddy Kissell (as appears likely), the odds probably go up. This district is probably going to stay in the Democratic column thanks to Fayetteville and the potent incumbency of Kissell, but the PVI is going to be pretty close to EVEN and Republicans will probably still want to take a crack at flipping it. Likely Democratic.

NC-09 (cyan)

Rep. Sue Myrick, the longtime Republican congresswoman here, has kept a low profile on the national stage, but she’s well-connected and well-loved in suburban Charlotte. Her district has not changed too much at all, and she’s a lock for reelection if she runs. Safe Likely Republican.

NC-10 (magenta)

This district is the unlucky one charged with cracking the Democratic stronghold of Asheville, credited by some with keeping Rep. Heath Shuler, the Blue Dog Democrat representing NC-11, in Congress last year. Republican Rep. Patrick McHenry should be able to handle it, seeing as that most of the rest of his district remains the same (though it no longer stretches to the Tennessee border) and the modern-day incarnation is a dramatic R+17. Safe Republican.

NC-11 (chartreuse)

The man with the biggest target on his back in North Carolina redistricting this year, Shuler has been an irritant to the North Carolina Republican Party (as well as the national Democratic Party, but that’s another story) due to his apparent inability to lose despite occupying an intensely Republican district. But with about two-thirds of Asheville locked away in NC-10, this could be the end for Shuler. The thing is, I wouldn’t count the man out. Tossup/Tilt Republican.

NC-12 (cornflower blue)

I haven’t exactly made my loathing of Democratic Rep. Mel Watt, the congressman for Bank of America NC-12, a secret on this site. But he’s got a VRA district, albeit perhaps the most atrocious one in the country, and he’s not going anywhere. Republicans said they’d like to kill this grotesque district, which snakes from Charlotte up to Greensboro, but they also don’t want to get nerfed with a retrogression suit, because a court-drawn map of North Carolina would look a hell of a lot different than a Republican gerrymander. This district is 31.4% white, 47.6% black, and 14.2% Latino, which is about as strong a minority-majority district as can be drawn here. Safe Democratic.

NC-13 (salmon)

Despite its color, this district is not intended for every SSPer’s favorite authentic self-utilizing power along the lines of excellence, last seen launching a committee to explore just how many points he would lose by to independent Sen. Bernie Sanders of Vermont. With two pairs of Democratic congressmen deathmatched, this district must be North Carolina’s second open seat, and it’s a doozy. It’s basically an incomplete ring around the Research Triangle, joining together a bunch of white-collar suburbs and exurbs. It doesn’t exactly scream “recipe for Democratic strength”, but it’s an open seat, so it could be surprising. I’d bet strongly on a competent Republican candidate, though. Likely Republican Tossup.

UPDATE: roguemapper kindly calculated some political data (based on the 2008 election results) for the above map. This inspired me to get slightly more diabolical. If Republicans wanted to get very, very aggressive (and maybe a little bit spiteful), they could try a map like this:

I’d call this a 4-9, but I haven’t crunched the numbers yet. One of those Republican districts will belong to Rep. Heath “Captain Jack Harkness” Shuler, cursed with apparent political invulnerability, but there’s only so much you can do in redistricting.

NC-01 (blue)

No change from previous map. Safe Democratic.

NC-02 (green)

This district takes up a lot of swingy territory (helping to push a few marginal Republican seats deeper into the red) and tries to smother it with rural territory. It’s still an open seat, I believe. Democrats’ biggest foe here is its lack of geographic compactness; I don’t see a Durham-area Democrat running strongly in northern Cumberland County, for example, which would find a Blue Dog more palatable than Democrats from the Research Triangle would. Likely Republican.

NC-03 (purple)

No change here. Safe Republican.

NC-04 (red)

No change here. Safe Democratic.

NC-05 (yellow)

Scooping up more of Greensboro in exchange for some rural counties on the Virginia border will push the PVI of this district a point or two more Democratic, but it should remain a solid Republican district, especially with veteran Coble entrenched in the Greensboro area. Safe Republican.

NC-06 (teal)

No change here. Likely Republican.

NC-07 (grey)

No change here. Likely Republican.

NC-08 (slate blue)

One of the cruelest districts I’ve ever drawn, this minority-majority district basically screws both Kissell and McIntyre (who are both drawn into it) in the primary. That’s probably no benefit to Republicans, as Kissell and McIntyre are among the least loyal members of the Democratic caucus, but it fulfills the vendettas of the North Carolina Republican Party. Plus, if a black Democrat from Greensboro sneaks through in a primary, the consternation of ancestral Democrats happy enough to vote for Kissell and willing to begrudgingly pull the lever for President Obama in 2008 could give a moderate “good ol’ boy” Republican (including Kissell, if he switched parties) an opening. 45% white, 34.1% black, 8.2% Latino, 8.1% American Indian. Likely Democratic.

NC-09 (cyan)

Myrick gets a safer seat, with a lot of blueing Charlotte gobbled up by Watt and a lot of reddish territory incorporated into this district. Safe Republican.

NC-10 (magenta)

No change here. Safe Republican.

NC-11 (chartreuse)

No change here. Note that as before, the rating is only because Shuler is Shuler; in an unlikely open-seat scenario, it’s almost certain to flip. Tossup/Tilt Republican.

NC-12 (orange)

Yes, I changed the color. And the shape. Watt’s ugly snake-shaped district has been made more compact, and in turn, it has become much whiter. It remains minority-majority, but by a smaller margin, and it is white-plurality. 44.4% white, 35.6% black, 13.8% Latino. Safe Democratic.

NC-13 (salmon)

This district loses suburban Durham and Orange counties in exchange for exurban Chatham and Lee counties. This should be the district I meant to draw last time. Still an open seat. Likely Republican.

Nevada Redistricting: Silver State, It’s Your Time to Shine

Fast-growing Nevada is adding a fourth congressional district in this round of redistricting. The C.W. says Republicans, who control the governor’s mansion, and Democrats, who control both houses of the State Legislature, will work toward a 2-2 compromise, although the solidity of one Republican seat may be dubious. I tend to think a 2-1-1 map is likelier, with the swing district favoring the incumbent.

Forth Eorlingas:

Now, uh, before getting deep into this, I should note that unlike some of our Nevadan SSPers, I haven’t memorized the home addresses of every sitting congressperson in Nevada or every prospective candidate for the new NV-04 or a (likely) vacancy in NV-01 or NV-02. So, this map may need some tweaking. Just let me know, help me out.

I’ll start out of order, because the way districts are numbered in Nevada is weird.

NV-02 (green)

Rep. Dean Heller, the Republican congressman for this district, is widely expected to launch a primary challenge to sleazy Sen. Ensign, but he seems to be crossing his fingers for a retirement in the meantime. The trend for Republicans in Northern Nevada is…not great. Washoe County is quickly becoming another Democratic stronghold in the state, and the surrounding counties appear to be on a blue trend. Elko, in northeastern Nevada, is a Republican stronghold, and the minor population center there combined with the still-reddish sprawl around Reno and Carson City should keep this district on the Republican side of the PVI line, but it’s uncomfortably close to EVEN PVI and there doesn’t seem to be a lot Republicans can do about it. If Heller runs, he’ll probably retain it, but if he goes for Senate, it’s going to be very close in a presidential year. Tossup/Tilt Republican.

NV-01 (blue)

I think the expectation is that Democratic Rep. Shelly Berkley will run for Senate, potentially setting up a marquee battle with Heller, her colleague in the Nevada congressional delegation. I’m pretty sure her house is included in this district either way – but the person I had in mind while drawing this district is Steven Horsford, the term-limited Nevada Senate Majority Leader. Horsford, if elected, would become the first African American congressman from the Mountain West in…a while. The racial breakdown, for the curious, is 52.3% white, 13.4% black, 20.2% Latino, and 10% Asian. Safe Democratic.

NV-03 (yellow)

This district is represented by freshman Rep. Joe Heck, the Republican who put Southern-talkin’ Democrat Dina Titus on ice last year even as Sen. Reid stomped nutty Tea Party conservative Sharron Angle by a five-point spread. Interestingly enough, Heck would see his district balloon out substantially to eclipse NV-02 in size under this map. While the vast majority of this district’s population is in Clark County, the little fraction that comes out of the rest of the state has a huge geographic footprint, because the cow counties are so underpopulated (this may have something to do with them being a jumble of arid desert, craggy mountain ranges, and current and former nuclear test sites). Heck, who lives in Henderson, gets the lion’s share of exurban Clark County, as well as bedroom communities in Nye County, and the more conservative Las Vegas suburbs. Titus has been redistricted out, but she could always move back, I suppose. Likely Republican.
NV-04 (red)

Nevada is getting a brand-new district, and that means at least one open-seat contest next year. Potential Democratic candidates for this VRA seat (31% white, 10.1% black, 49.2% Latino, 6.7% Asian) include Ruben Kihuen, a Mexican American state senator with an independent streak; John Oceguera, the term-limited Speaker of the State Assembly, who would become the country’s only Native American congressman if elected; Richard Carrillo, also a member of the State Assembly; and Dina Titus, the former NV-03 representative. This district should be solid ground for the Democrats, whoever runs, although I think a Latino Democrat would be favored in the primary. Safe Democratic.

Redistricting in Missouri (Updated!): Return of the Revenge of the United States Census

Well, Missouri was one of the Big Losers once the 2010 Census numbers came in. It’s sloughing a congressional district, which probably means two or more congresspeople get drawn together.

Let’s do this.

The map, if you’re familiar with my previous proposals for redistricting Missouri, isn’t going to look scads different from maps I’ve drawn before. I had to draw this map from scratch in order to use the 2010 Census data – hence the (Updated!). Sorry about the confusion there. This map is roughly 2-5-1, with the swing district probably favoring the Republican by a smidgen.

MO-01 (blue)

The C.W. is that Rep. Lacy Clay, the Democrat, will have to take all of St. Louis City to maintain his VRA seat. This is not actually true. This district, as drawn, is actually 48.7% black, 43.4% white – and it’s hard to do better, as South City isn’t much less white than north St. Charles County (which actually does have some pockets of black-majority precincts for Clay to collect). Now, granted, any part of St. Louis City is probably more Democratic than just about anywhere in St. Charles County, but if 90% of blacks vote for the Democrat, it’s pretty damn hard to see this district being competitive for Team Red. Safe Democratic.

MO-02 (green)

As I said, Republican Rep. Todd Akin is talking up a prospective Senate bid, and it sounds like a deal may be in the works for former ambassador to Luxembourg and defeated candidate for Republican National Committee chair Ann Wagner to succeed him. This district takes in a large share of the Greater St. Louis exurbs and white-collar suburbs, though I believe it retains Akin’s home in Town and Country. Akin or Wagner or not, this district isn’t terribly likely to go blue; it occupies some of the most Republican parts of the state. Safe Republican.
MO-03 (purple)

I did all I could for Democratic Rep. Russ Carnahan, one of the scions of the powerful Carnahan political dynasty. I gave him the southern parts of St. Louis City. I tried to limit the damage in terms of the parts of modern-day MO-02 he soaked up. I kept the Republican territory snaking down the Mississippi River to Cape Girardeau to as plausible a minimum as I thought Missouri Democrats and Gov. Nixon might be able to get away with demanding, handing him Democratic-leaning Jefferson County to help balance things out. But I still would give Rep. Jo Ann Emerson, the Republican congresswoman drawn together with Carnahan, the slight edge here. Tossup/Tilt Republican.
MO-04 (red)

This district loses a lot of the sprawl into central Missouri in favor of scooping around urban Kansas City, picking up a portion of the northern environs currently contained in MO-06. Rep. Vicki Hartzler, the Republican representing this district, should be completely fine here; Republicans will want to protect her, as she just took over this seat last year, by cutting out some of Ike Skelton’s old stomping grounds around Jefferson City. The parts of Greater Kansas City Hartzler picks up should be red enough, too. Safe Republican.

MO-05 (yellow)

Rep. Emanuel Cleaver, the black Democrat representing this white-majority district, sees his turf consolidate around the more urban, likely-Democratic precincts of Kansas City. Democrats in the legislature will take pains to shore him up after his uncomfortably close reelection last year. Safe Democratic.

MO-06 (slate blue)

Republican Rep. Sam Graves gets pretty much all of “Little Dixie” in northeastern Missouri from modern-day MO-09. While Graves has been viewed in past cycles as potentially vulnerable, Republicans should be happy with the tweaks to his district, despite the addition of Jefferson City and Columbia; Little Dixie has a more Republican PVI than some of the swingy Kansas City suburbs picked up by Cleaver and Hartzler. Safe Republican.
MO-07 (magenta)

This district has changed very little. Republican Rep. Billy Long takes a bit of territory off Hartzler’s hands, but otherwise, it’s the same district. Safe Republican.
MO-08 (orange)

This district has changed very little except to exchange Emerson’s Cape Girardeau County with parts of central Missouri, including Republican Rep. Blaine Luetkemeyer’s home in Miller County. Safe Republican.
Now, if Emerson pushes back against the idea of being thrown into the octagon with Carnahan next year, I drew this map with a scenario in mind that has been floated recently: Red. Todd Akin, the Republican representative from MO-02, vacating his seat to run for Congress.

This map gives Luetkemeyer most of Akin’s turf, rather than letting him take over Emerson’s district from his convenient central location. It’s still a 2-5-1 map.

MO-01 (blue)

Not much different than in the other map, including racial breakdown (43.5% white, 48.6% black). Safe Democratic.

MO-02 (green)

This district connects Miller County, where Luetkemeyer resides, with the Greater St. Louis suburbs and exurbs currently represented by Akin. This should be blood-red Republican territory. Wagner might run against Luetkemeyer, but I don’t think the Republicans would draw this map if they wanted that to happen, unless Luetkemeyer decides to retire for some reason. Either way, it doesn’t really matter in terms of partisan breakdown. Safe Republican.
MO-03 (purple)

There are two real beneficiaries of this map as opposed to the previous one. Carnahan is one of them. This district should be very close to EVEN PVI, and his incumbency as well as his political connections should be enough to consider him a slight favorite. Tossup/Tilt Democratic.

MO-08 (orange)

Skipping ahead to Emerson’s district, as the other districts haven’t changed from the previous map: she is, of course, the other beneficiary of this alternate proposal, because she’s completely safe here in a district that has changed very little other than to take in some additional Republican territory. Safe Republican.

Questions? Comments? Complaints?

4-4 Gerrymander of Maryland

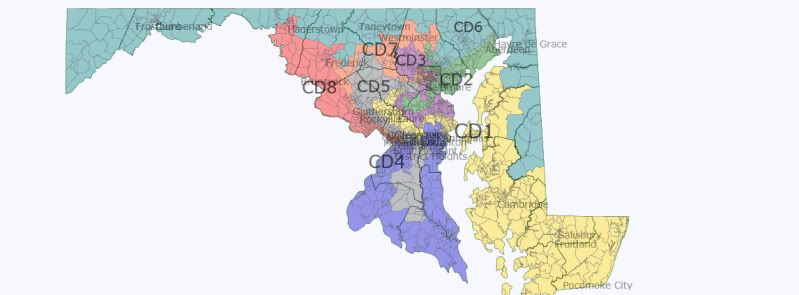
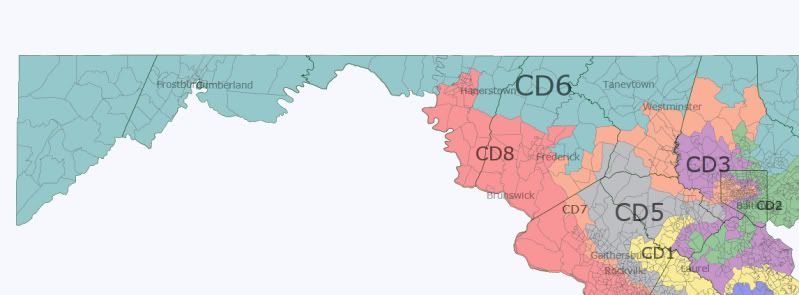
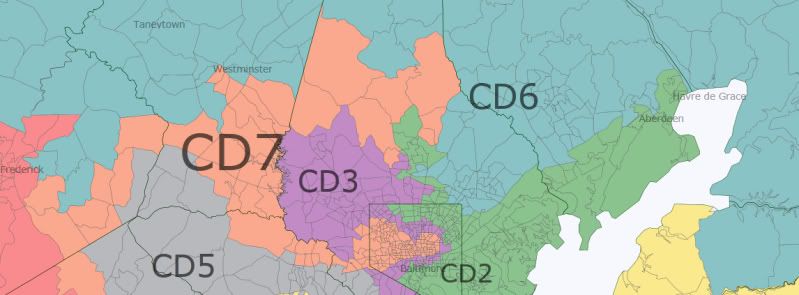
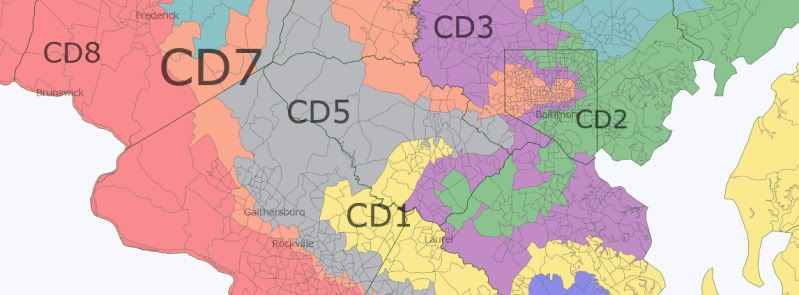
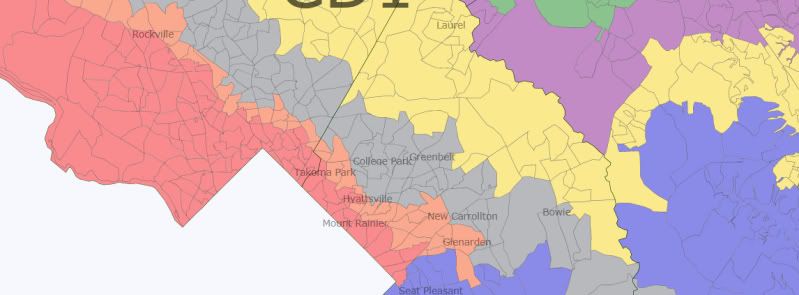
Obviously an exercise, inspired by the flood of 8-0 Democratic Marylands. Originally I had attempted to make five Republican seats in Maryland, but while it was possible to make five seats won by McCain it would have been a huge overreach and Republicans would have been unlikely to hold all five seats in even a neutral year (possibly none in a Democratic wave). Given that, the exercise became a matter of shoring up four seats as much as possible. While Maryland is quite a blue state these years the Democratic voting base is heavily concentrated so forcing it into four ultra Democratic seats was entirely possible. The remaining four Republican seats all ended up with a 44-54 Obama/McCain lean.    
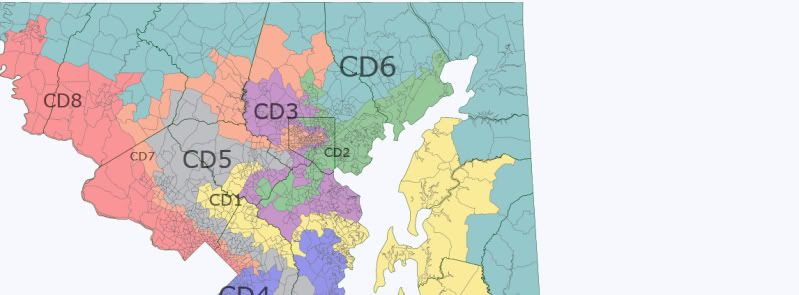
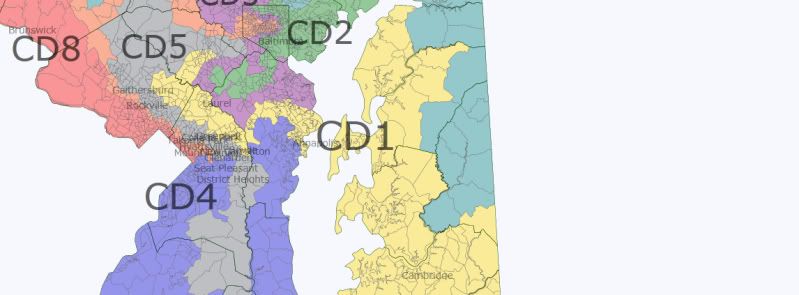
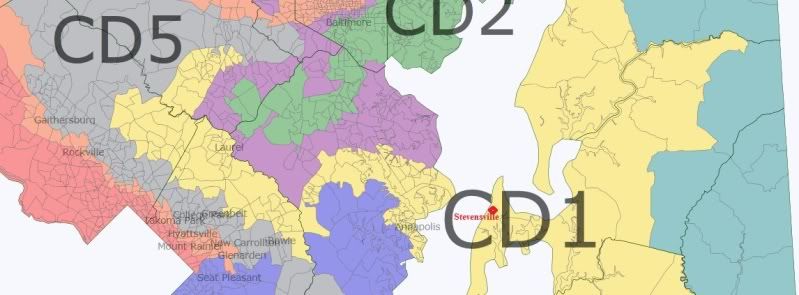
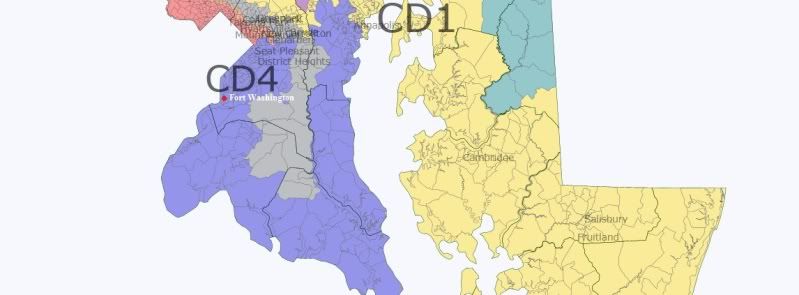
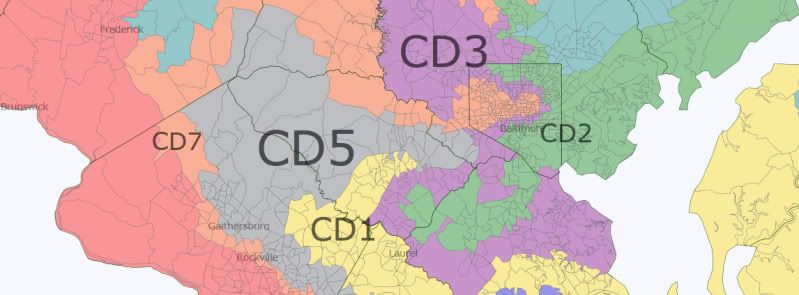
CD1 (Blue): W85 B10, O44 M54 Much of Anne Arundel county, coastal Baltimore county and smallish bits of Harford and Prince George’s. PVI R+9  

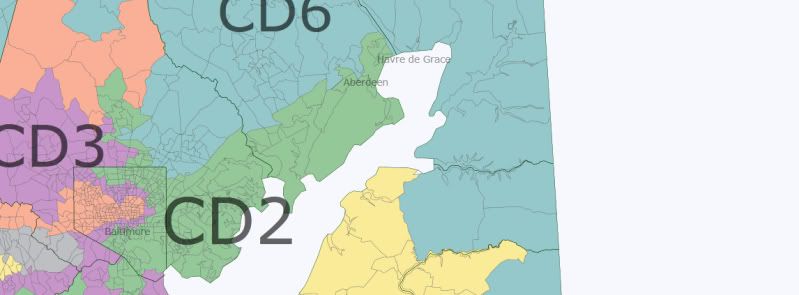
CD2 (Green): W31 B63 O87 M12 Most of Baltimore city with tiny amounts of Baltimore county. PVI D+34  

CD3 (Dark Magenta): W80 B16 O44 M54 The entire Eastern Shore, all of Calvert and St. Mary’s, and parts of Charles and St George’s in south Maryland, and a piece of Harford in the north. PVI R+9  

CD4 (Red): W21 B69 O91 M9 Mostly Prince George’s, with a little of northern Charles D+38

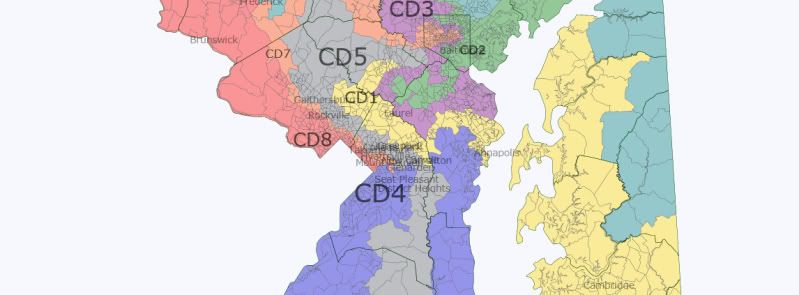
CD5 (Gold): W47 B36 O77 M21 Northern Prince George’s with a tendril stretching to Annapolis (the Severn river does maintain contiguity) and toward (though not into) Baltimore city. D+24

CD6 (Teal): W87 B7 O44 M54 Mostly Baltimore county but spilling over into adjacent counties. PVI R+9  

CD7 (Dark Grey): W58 B15 A12 H12 O73 M25 The most Democratic parts of Montgomery county. D+17

CD8 (Slate Blue): W88 B6 O44 M54 Western Maryland and the less Democratic parts of Montgomery county. PVI R+9  

Another 8-0 Maryland

Here is my take on an 8-0 Maryland. I must thank abgin for this incredible inspiration of using stripe-style gerrymandering (the famous map he did of NY). I employed this technique in reverse – I asked myself, how can I link all of these heavy Dem areas to Republican areas to dilute their votes? I thought of where their votes are concentrated, and the biggest source is Northern Maryland and the Baltimore Suburbs.

So, I set out to link Dem heavy areas to Republican areas in Northern Maryland, and it worked well. The map is not too bad looking, although Ruppersberger and Sarbanes would have trouble fitting into this map, but they can move. Hoyer and Van Hollen would have decent district and maintain a lot of their territory. Barlett and Harris are completely drawn out, and I managed to make two VRA districts that are 51% black, while they take in as many heavy R precincts as possible in Northern Maryland the Baltimore Suburbs so they can leave liberal white areas and other AA areas to shore up other districts.

I wanted the Obama-McCain lean to be roughly 60%-40%, and I did well in that regard, I think only one is 57% Obama and the rest are over 58% Obama, so all districts are around D+5 to D+8, with the VRA districts being more Dem heavy. The only district I think that would be in trouble would be the Eastern Shore based one, but if Kratovil runs, it is his. So, here you go!

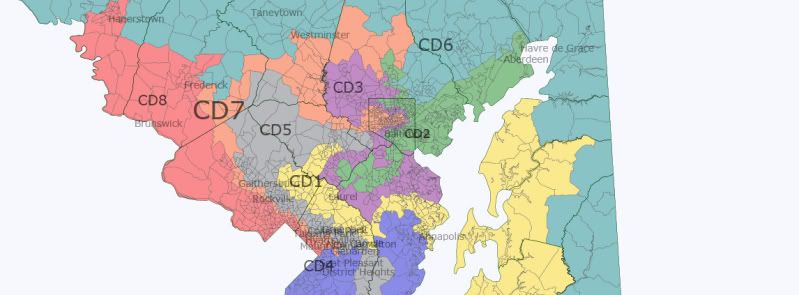
Below is the state as a whole. The CDs aren’t numbered well on my map, since I ended up editing a lot, so I’ll just leave the CD numbers off the map and make different numbers.

CD1 in Perriwinkle: Panhandle. Hagerstown, Frederick, Potomac – This district is similar to the ones others have posted to make this district less friendly to Barlett (currently the 6th.) There is no way he would win this district. This has much of Van Hollen’s 8th district, so I would assume he would run here. If he doesn’t live here, the move isn’t far. (Pictures are below)

Obama:59% McCain:40%

White:70% Black:10% Asian:9% Hispanic:8%

CD2 in Grey: Silver Spring and DC burbs extending to Northern Border – The worst thing about this district is that there seems to be no clear incumbent here. Cummings would move to a VRA district, Van Hollen would want the 1st (he could take this if he wants too I guess, his choice) so I suppose this would be a new Democratic Representative. Bartlett could try running here, but I doubt he’d come close. Fairly neat looking district.

Obama:60% McCain:38%

White:61% Black:13% Asian:8% Hispanic:16%

CD3 in Dark Green: College Park, Columbia and the Northern Border – Takes in heavily Dem areas in the DC burbs, through Columbia and then sucks up heavily R areas up north on the border. This district also presents a huge problem for current reps. I guess Ruppersberger may be willing to make the move… Cummings again wouldn’t be here, and there really is no one else who I can see running here.

Obama:59% McCain:39%

White:55% Black:24% Asian:8% Hispanic:11%

CD4 in Green: Eastern DC suburbs stretching to Baltimore Suburbs – The challenge I had with this map in general was diluting suburban Baltimore while keeping two majority black districts. This was one part in solving that problem. I was able to keep this 51% AA while stretching it from heavily AA precincts outside of DC to heavily Republican areas South and East of Baltimore City.  This district does take a lot of the AA territory from Donna Edwards current district, MD-4, so she should run here and be safe.

Obama:72% McCain:27%

White:41% Black:51% Asian:2% Hispanic:5%

CD5 in Purple: Southern Maryland to Annapolis– This district pretty much drew itself after the two black majority districts were drawn. I could take remaining AA precincts outside of DC, pull them in with rural more R leaning areas in Southern Maryland, then bring them to Annapolis naturally. Steny Hoyer would have a lot familiar territory, but now he gets Annapolis and AA areas outside of DC instead of areas NE of DC. Still should be a fairly easy hold for him.
Obama:60% McCain:39%

White:62% Black:30% Asian:3% Hispanic:4%

CD6 in Yellow: Northern Baltimore, Baltimore Suburbs, down to liberal areas northeast of DC– One of the nastier districts, this links two areas of Dem strength leftover from other districts – liberal areas between DC and Baltimore, and northern parts of Baltimore itself. I was able to perfectly combine these, while incorporating Baltimore burbs to dilute Republican votes while keeping this district solidly Dem leaning. Maybe Sarbanes would move to this district? Or Ruppersberger? Those two really are the odd men out in general. since their current districts are disgusting. If they want their jobs with this map, they need to move.

Obama:58% McCain:40%

White:63% Black:26% Asian:6% Hispanic:4%

CD7 in Blue: Western Baltimore City, Baltimore Burbs and Rural areas in Northern Maryland. – I had a hard time trying to keep this at 51% black while at the same time sucking up as much anti-Obama votes as possible. To do this I had to find the anti-Obama votes (much like abgin did in NY, where he drew all districts to NYC to find Dem votes.) Once I adopted that strategy, I was able to do the wrap-around kind of districts near Baltimore for CD6 and CD7 in my map. This naturally gave way to making all districts have a north-south orientation in order to dilute Republican strength in Rural North Maryland. Cummings keeps a lot of his old territory in Baltimore, so this district would fit him nicely.

Obama:71% McCain:27%

White:42% Black:51% Asian:3% Hispanic:3%

CD8 in Red: Eastern Shore stretching to Baltimore City– I’m sorry I divided you into 4 pieces, Baltimore. But Kratovil would love this district. It is fairly Democratic, even someone more liberal than Kratovil can win here. But this would be a perfect fit for him. Harris would never win. I did use a tiny, TINY bit of water contiguity near Perryville where the shore meets to mainland in a U-shape (you can kinda see it, its not too bad.) I did this to keep the district from having to take in a couple R-heavy precincts, and the district honestly doesn’t look any worse than any MD district currently.


Obama:57% McCain:42%

White:66% Black:27% Asian:2% Hispanic:3%

Redistricting: A Maryland Monstrosity (7-1 Dem Map)

Maryland, my Maryland. The Democrats currently have a 6-2 edge in representation in this fairly blue state, and with redistricting just around the corner, the question on Democrats’ minds is how can we make this an even larger edge? An 8-0 map has seemed impossible to make where it would sufficiently protect the incumbent Democrats, although I’m confident that someone will make one. I know there have been recent attempts but those created an essentially perfect swing district in MD-01 to get us to 7-1 (or 8-0).

My goal is to create a 7-1 map where MD-01 is sufficiently blue so that a moderate Democrat like Frank Kratovil can retake the district and hold it while accounting for:

1.Based on Nathaniel90’s recent “Redistricting Outlook” that discussed Maryland, it appears that I need to keep two minority-majority black districts while I pursue the goal of 7-1.

2. Keeping the Democratic incumbents’ hometowns in their respective districts (I actually ended up drawing both Republicans out of their residences).

3. Increasing the partisan advantage of the more “vulnerable” incumbents.

As for how this map turned into a monstrosity…When you add together the sandbox atmosphere of Dave’s Redistricting App with the already crazily drawn districts in Maryland, you can end up with an absurd map like this one.

NOTE: I used the new population estimates with voting precincts.

So here’s what I came up with:

Photobucket

Clearly, there are some ridiculous districts on this map. But let’s break them down.

MD-01 (Yellow)

Naturally, we’ll start with MD-01.

Photobucket

Here’s the data on Mr. Kratovil’s old and hopefully new district:

Photobucket

A zoom in on this district’s mainland “hook”:

Photobucket

Based on Wikipedia, the old PVI for this district was R+13. With the President’s numbers from 2008, the new district would be a solid D+5, thus very winnable for a candidate like Kratovil (whose hometown Stevensville is shown above). Most importantly, Kratovil’s hometown is in this district whereas GOP incumbent Andy Harris’ is not (it’s in the new 7th and he would have to challenge Elijah Cummings to return). The only question mark about this district is whether or not crossing the Chesapeake Bay allows the district to still be considered “contiguous.”

MD-02 (Green)

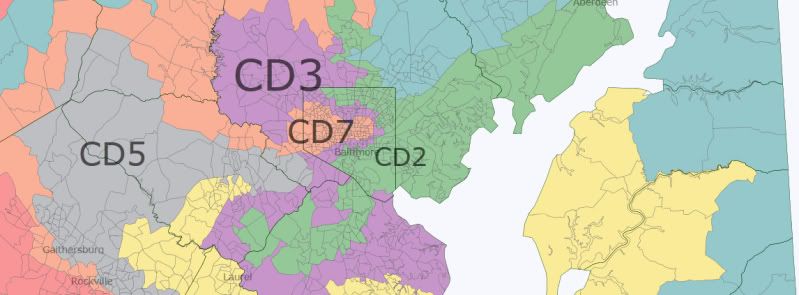
Now, for MD-02. Dutch Ruppersberger’s new district looks like this:

Photobucket

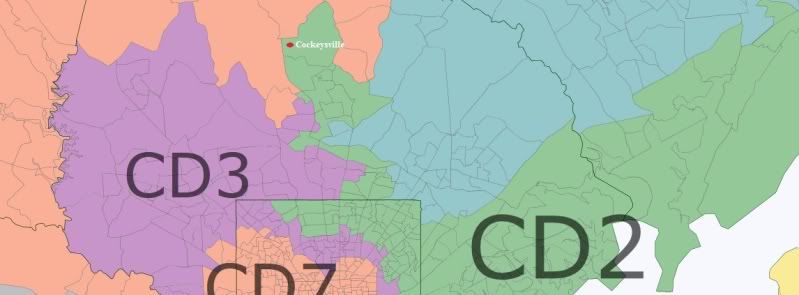
The most north-central part stretches up to snare Cockeysville, Ruppersberger’s hometown (Andy Harris lives somewhere in the vicinity as well because his hometown is listed there, too). The rest of the district is based somewhat on his current set up except that now his seat is even more secure. The data:

Photobucket

Some more pictures of the new MD-02. Here’s the most northern part so you can actually see its fullest extent:

Photobucket

The central part where Cockeysville is:

Photobucket

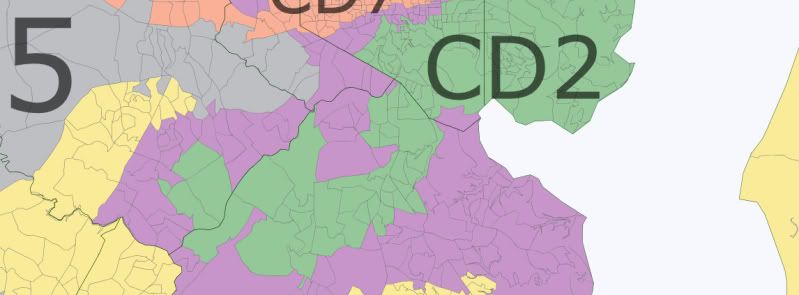
And the southern section:

Photobucket

MD-03 (Purple)

Now, the other non-minority-majority Baltimore district, MD-03. Incumbent John Sarbanes is fairly safe but I’ve made his work even easier.

Photobucket

And the data for MD-03:

Photobucket

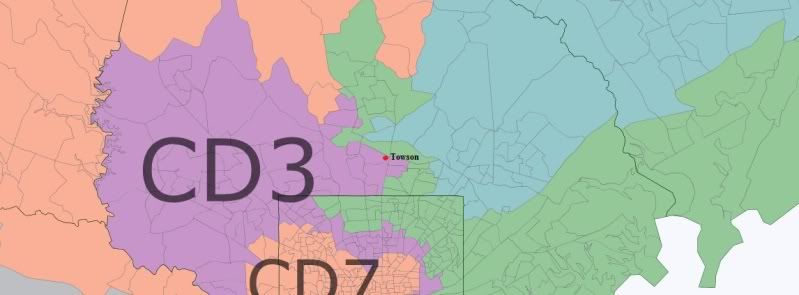
While I know which district on this redistricting map is the “worst,” this one is certainly competing for the second most meandering. Like Ruppsberger’s hometown, Sarbanes’ Towson is barely in his district.

Photobucket

And the most southern part of the MD-03, curling in with MD-02 and MD-01:

Photobucket

MD-04 (Blue)

Moving on, we have MD-04, represented by Donna Edwards. It’s the first minority-majority district to discuss. Basically, much of the district is Steny Hoyer’s old district, forming a large U from D.C. to suburban Annapolis for reasons to be explained shortly in the MD-05 (gray) section. Edwards lives in Fort Washington, so that’s not an issue.

Photobucket

The data for MD-04:

Photobucket

Fifty-one percent African American puts it over the hump for continuing to be a minority-majority district. Although it loses some PVI, it had plenty to lose in the first place.

MD-05 (Gray)

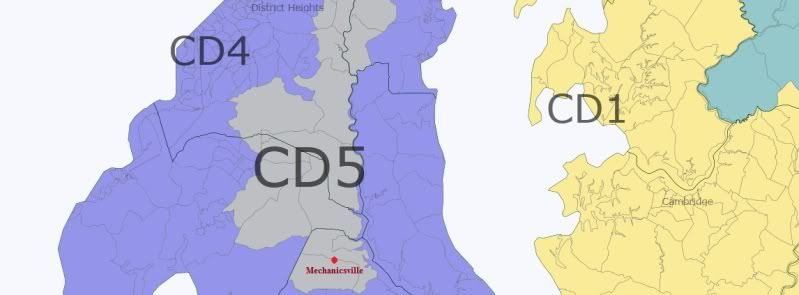
Originally when I was drawing up this map, I gave Donna Edwards all of southeastern Maryland because I thought Steny Hoyer lived closer to College Park. Turns out his home is in Mechanicsville, and I don’t think you can draw the Democratic Minority Whip out his district. Thus, the even more extended nature of his district, which I had going into the suburbs of Annapolis first. Now Edwards goes there and Hoyer stretches down to his hometown.

Photobucket

More specifically, the southern part of the district and Hoyer’s hometown:

Photobucket

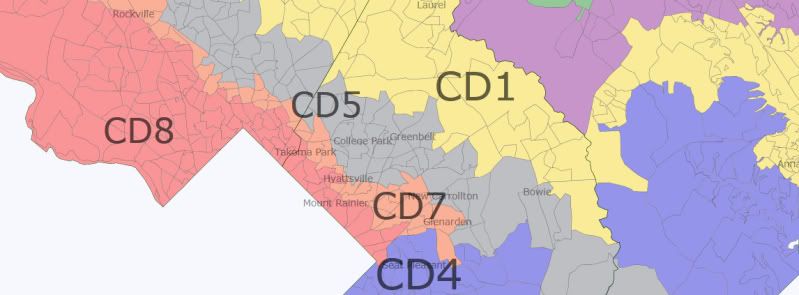
Hoyer’s district, like the prospective MD-01, crosses through the D.C. suburbs and stretches northwest. That stretch looks like this:

Photobucket

The northern-most part looks like this:

Photobucket

And MD-05’s overall result? A safer district for Steny:

Photobucket

MD-06 (Teal)

Now for the lone safe Republican seat on this map. The giant L of a district has to violate any rules about compactness but it sure isolates the Republicans. As Roscoe Bartlett lives in Frederick, this map actually draws him out of his district because Frederick is now in Chris Van Hollen’s MD-08.

The western part of the district:

Photobucket

And the eastern part:

Photobucket

MD-06’s data:

Photobucket

MD-07 (Orange)

People are going to ask how in the hell did I end up sending this district from central Baltimore all the way to Prince George’s County. Basically, I was having trouble keeping the 7th over 50% black because it is the other minority-majority district. My original draw out had made MD-04 nearly 60% black so I decided I would “steal” African American voters from it, and at the same time I could leave more of the less-black Democratic areas of greater Baltimore to Sarbanes and Ruppersberger. At the same time, I managed to eat up a lot of blank GOP space that wouldn’t have to go into Hoyer or Van Hollen’s district as I stretched it west. I also drew Andy Harris into the 7th, forcing him to either move or find something else to run for. The end result was the “claw.”

Photobucket

Obviously, this would seem to break any rule on “communities of interest” as we’d have central Baltimore coupled with part of Laurel in suburban D.C. But it satisfied the minority-majority clause as we can see from the data:

Photobucket

The northern part of the district:

Photobucket

The narrow stretch curling down into greater D.C.:

Photobucket

And the suburban D.C. area:

Photobucket

MD-08

Lastly, we have Chris Van Hollen’s MD-08 which now stretches well beyond suburban D.C. all the way to Hagerstown, capturing the few very Democratic areas in Frederick and Hagerstown.

Photobucket

In the southern part of the district, it mixes in with MD-04 and MD-07:

Photobucket

And lastly, MD-08’s data:

Photobucket

In conclusion, here is the data from all eight districts:

Photobucket

Thanks for reading!

Republican Gerrymander of New York

This diary presents a theoretical Republican gerrymander of New York (27 representatives) that should, in the normal course of events, yield a 16D-11R delegation. Exactly how Republican a seat needs to be to be safe is a matter for debate, but in none of the projected Republican seats did Obama receive more than 47% of the vote which I feel should be safe most of the time. This map make makes quite a bit of use of water contiguity both around Long Island and Lake Ontario, however there is no touch point contiguity. Population deviations are all less than 1000 (within 0.15%).

Districts are numbered in reverse order to the current system, low numbered districts are upstate and high numbered are downstate.

NY-1 (Blue): More or less similar to the current 28th including the most Democratic parts of Buffalo, Niagara Falls, and the western Democratic parts of Rochester. Uses water contiguity on Lake Ontario instead of following the coastline which helps to push the PVI a little more Democratic. O 71% M 27%  

NY-2 (Green): Reasonably similar to the current 26th in that it includes parts of the Buffalo and Rochester suburbs and the areas in between. O 47% M 51%  

NY-3 (Dark Magenta): At this point upstate New York starts to take departures from reality and no longer resembles the current districts. The western parts of the southern tier, the south Buffalo suburbs, and wraps around Rochester to take in the eastern suburbs.  O 47% M 52%  

NY-4 (Red): Eastern and southern democratic leaning areas of Rochester, water contiguity to Oswego and a thin strip to metro Syracuse, tendrils to both Utica and Ithaca. O 64% M 35%  

NY-5 (Gold): The remainder of the southern tier, the territory between Syracuse (including its western suburbs) and Rochester, wraps around to southern Syracuse avoiding Ithaca. O 47% M 51%  

NY-6 (Teal): Northern Syracuse, northern Utica, Rome, north along the Lake Ontario coastline before turning east and then south, terminating short of Albany. O 47% M 52%  

NY-7 (Dark Grey): The Democratic leaning northernmost counties, a narrow strip running down the eastern state line, Saratoga Springs, Schenectady, and Albany. O 62% M 36%  

NY-8 (Slate Blue): Otsego County centred, with arms running off in every direction sucking in Republican leaning districts. O 47% M 51%

NY-9 (Cyan): Both the east and west state lines with convoluted lines grabbing the most Republican parts of Rockford County O 46% M 52%  

NY-10 (Deep Pink): Binghampton, Middletown, Peekskill, Newburgh, Poughkeepsie, Kingston, and the land connecting them. O 60% M 39%  

NY-11 (Chartreuse): The Democratic parts of Rockland and parts of Westchester, down the Hudson river coastline a little. O 66% M 33%

NY-12 (Cornflower Blue): More of Democratic Westchester, including New Rochelle and Mount Vernon, plus some of the northern Bronx. O 85% M 14%  

NY-13 (Dark Salmon): Southern Bronx, much like the current 16th. O 93% M 7%  

NY-14 (Olive): Northern Manhattan, much like the current 15th. O 92% M 7%  

NY-15 (Dark Orange): Southern Manhattan. O 82% M 17%  

NY-16 (Lime): Little bits of Kings, Queens, the Bronx, and Manhattan. O 79% M 20%  

NY-17 (Dark Slate Blue): Mostly Queens. O 81% M 19%

NY-18 (Yellow): North-eastern Kings. O 95% M 5%  

NY-19 (Yellow Green): North-western Kings and the northern shore of Staten Island. O 90% M 9%

NY-20 (Pink): South-western Kings and Staten Island minus its north shore. O 47% M 53%

NY-21 (Maroon): South Eastern Kings, and connected by water contiguity, the entire south coast of Long Island from Long Beach to Montauk.

O 46% M 53%

NY-22 (Sienna): Mostly Queens. O 71% M 29%

NY-23 (Aquamarine): Horrendously tortuous district picking up everything republican in southern Westchester, Bronx County, Queens, and Nassau and using repeated water contiguity over Eastchester Bay and the Long Island Sound to do it. O 47% M 52%

NY-24 (Indigo): Republican areas north of Jamaica bay in Queens, as well as southern Nassau, and a little south-western Suffolk.  O 47% M 52%

NY-25 (Pale Violet Red): The most Democratic parts of central and southern Queens and Nassau. O 90% M 10%

NY-26 (Grey): The republican parts of Eastern Long Island O 47% M 53%

NY-27 (Spring Green): The Democratic parts of Eastern long island, in four sections, each connected by water contiguity along the Long Island Sound. O 63% M 37%

The Van Hollander (8-0 Map of MD)

Sorry about the corny title. I felt that after the infamous Delaymander of Texas, this needed a similar name, and Steny Hoyer’s name didn’t lend itself to this as much as Chris Van Hollen’s name did. Anyway, this map attempts to defeat Andy Harris and Roscoe Bartlett while keeping all Democratic incumbents safe. And as an added bonus, it draws a new majority-minority district, just for the hell of it. Overall, this map is probably even cleaner looking than the current map of MD (which was always unnecessarily ugly, IMO). The only really ugly looking district is the 3rd, and even that looks better than it did before.

DC Area:

Baltimore:

Starting in the west, the panhandle is now in MD-08. In most of this area, the I-270 serves as the barrier between MD-08 and MD-06, with the area SW of the 270 in the 8th and the area NE of the 270 in MD-06. The 8th is 61%O/38%M and the 6th is 62%O/37%M. Van Hollen should be safe, and Bartlett is toast. MD-05 is the new majority-minority district. The racial stats are 49%W/28%B/15%H/7%A. I actually wasn’t intending to do this, but it just so happened that when I drew MD-05 it turned out 51% white, so I decided to tinker with the borders a little to make it majority-minority. The citizen voting age population is probably still majority-white, but that doesn’t really matter as this wasn’t required anyway. MD-04 takes in Calvert and some GOP parts of Anne Arundel Co. It is 39%W/53%B and 75%O/24%M. The 1st loses all its territory in the Baltimore suburbs and now crosses the water in the south into St. Mary’s, Charles, and a tiny part of PG Co. It is now 50%O/48%M, which would be slightly Republican leaning nationally but should be easy for Kratovil to win, especially now that Andy Harris is drawn out of the district. Interestingly, the PG Co parts of the district make up a tiny 33K people, or 5% of the total population of the district, however without these areas the district goes from 50/48 Obama to 47/51 McCain.

In the Baltimore area, the 2nd and 3rd districts have lost their spagetti-like shape and become much more compact. The 2nd district contains Harford and most of northern Baltimore counties as well as the northern part of Baltimore city. The district is 58%O/40%M, which is slightly less than the previous total of 59%O/39%M, but not significantly enough to affect this district much. The 3rd is now a crescent shaped district that stretches around from John Sarbanes’s home in Towson around Baltimore, Howard, and Anne Arundel counties as well as some liberal white areas of Baltimore around the Inner Harbor and Fells Point. It is now 59%O/39%M, which like the 2nd is slightly less than the 60%O/38%M it was before but not significantly. The 7th composes most of the majority black areas of Baltimore, however it stretches out to grab up Republican areas in Baltimore county from the surrounding districts. It is 42%W/52%B and 70%O/28%M.

I guess this map isn’t technically an 8-0 map, as the 1st still has a slight Republican lean. That could easily be gotten rid of by messing with the borders between the 4th and the 1st some more, however I decided that wasn’t necessary and it would require making the map look a little uglier. This 1st contains Kratovil’s base in the Eastern Shore, where he always did very well, but not the Baltimore suburbs that he consistently lost. I guess it’s theoretically possible that the GOP could pick up the 2nd or 3rd in an open-seat situation (maybe), however I really, really doubt they have much more of a chance than they do under the current map.

By what margin will Bob Shamansky win?

View Results

Loading ... Loading ...

“Start spreading the blues…I want to be a part of it, New York, New York.”

In a perfect world, with New York losing a seat in the 2010 reapportionment, we could create 28 districts that would, more-or-less, give the Democrats a shot at winning 27 of them, some more easily than others. To do this, I had to ignored political reality, as you will see in the way districts were shaped (e.g. the sole GOP district or Staten Island’s bifurcation). As a corollary to ignoring political reality, I also did not attempt to make as many completely safe Dem seats as possible; otherwise, it would have been difficult to create 27 legitimately lean-Dem or better seats. However, I believe I did a fairly good job of creating favorable numbers for New York Democrats, at least in the sense that President Obama only won three of the 27 Democratic districts by less than 10% in 2008.

Note: I actually did this back in November ’10 but only now am I posting my efforts. It’s possible that updates have occurred to New York’s data since then. Also, I’m aware that New York ended up losing two seats in reapportionment, not just one as I originally thought while drawing this up.

Given that the great majority of Republican vote in New York lies Up State, I started out with the 28th district and sought out the most Republican voting districts. What I ended up creating was essentially a large U. How perfect for “Up State,” don’t you think?

Here’s how the northern part of New York turned out:

Photobucket

And here is the data for the eight most easily seen districts here, 20 through 28. Note that “Dev.” is deviation from the ideal population for each district. I believe the rest of the data is self-explanatory.

Photobucket

Unsurprisingly, the least diverse district in the state is the U-district, 28, with a stunning 95% white percentage, something one only sees in Utah. Or Wyoming. Clearly, this district would get struck down in any court outside of North Carolina or Florida. But I think people in Batavia, Elmira, Little Falls, and Johnstown actually have a lot in common and would enjoy having a common Member of Congress to represent their roughly 225-mile long district.

Among the Dem-tilting districts, District 22 is the only one to have an under D+10 net based on the 2008 election as the east coast of Lake Ontario is not the most liberal place in the state.

As we move further south in the direction of the city, we find Districts 18 and 19, both exurban and suburban.

Photobucket

And their info:

Photobucket

Just below these two is CD-17, and its image allows us to see the little part of CD-18 that stretches down below the previous shot of it (around White Plains, and Rye below that).

Photobucket

And CD-17’s info:

Photobucket

Now we get into the bluest part of the city, specifically the Bronx and upper Manhattan:

Photobucket

Here are the nice numbers:

Photobucket

Moving down the peninsula and east, we see Lower Manhattan and western Queens:

Photobucket

Numbers:

Photobucket

Getting a little out of order in CD numbers (I don’t feel like re-numbering), we’ll move down to Brooklyn and Staten Island. Clearly, in real life Staten Island would be very difficult to divide politically. However, for the sake of creating Dem-leaning or safe districts, it is absolutely vital to split up the Staten Island vote. And that is what I have done here, creating two Brooklyn-Staten Island districts. Additionally, the backward-S Brooklyn-based CD-6 and almost completely Brooklyn-based backward-C CD-9 can be seen here:

Photobucket

And the info for those four districts:

Photobucket

Moving back up into Queens, we find CD-10 which slightly abridges the Kings and Queens County border to cut into northern Brooklyn.

Photobucket

And CD-10’s numbers:

Photobucket

Next, CD-11 stretches across northern Queens and into northwestern Nassau. Since it’s an awkward district to get a picture of with Dave’s App, this picture will serve as kind of an update on where we are at this point:

Photobucket

Photobucket

Now we’ve reached the challenge of Long Island. Honestly, creating the U-district was easy compared to all the time I spent adjusting the borders of these districts in an attempt to get the most Dem-leaning districts possible.

First, CDs 4 and 5. CD-4 crosses southern Queens, Nassau, and even has one voting district from Suffolk County in its boundaries. Meanwhile, CD-5 does the same, stretching from the Queens’ coast to even deeper into Suffolk.

Photobucket

And the info for these two districts:

Photobucket

CD-3 also crosses from Queens to Suffolk, clearly to get more Dem votes to make up for the Republican lean of some of the Long Island areas this district crosses.

Photobucket

CD-2 covers the southern and eastern coast of much of Long Island (“Strong Island” to quote a former roommate of mine from there). It is tied with CD-19 as the least Democratic district besides CD-28. Meanwhile, CD-1 covers the remaining northern half but reaches into some Democratic stretches of Nassau to gain votes.

CD-2:

Photobucket

And a somewhat better shot of CD-1:

Photobucket

Finally, the info for CDs 1, 2, and 3:

Photobucket

In sum, here’s a table of all the districts and their statistics:

Photobucket

Thanks for reading my first diary.

2R-1D Gerrymander of NM

Just for fun, I decided to see how pro-GOP you could make a map of New Mexico. My strategy was to pack as many Democrats as possible into a super-Democratic district running from Albuquerque up along the Rio Grande, thus making the other districts as Republican as possible. This is what I came up with:


The districts are:

NM-01 (Blue)

32% W, 6% N, 57% H

74%O-25%M

NM-02 (Green)

44% W, 18% N, 34% H

49%O-50%M

NM-03 (Purple)

49% W, 44% H

48%O-50%M

Two McCain districts in a state that voted for Obama by a 15% margin. That’s what horrendously ugly gerrymandering like this can do. You could actually get the blue district up to the high 70’s by taking it into the Navajo Reservation area, but that would inevitably end up splitting up the Navajo Reservation which was too much for even this map. What’s really interesting to me about this map is that all of the districts are majority-minority here, but two of them still vote Republican.