Analysis: How well did Minnesota Candidates Spend Money?

(Great, great stuff. – promoted by James L.)

Cross-posted from MN Campaign Report and Big Orange at DavidNYC’s request – hope it’s up to snuff!

The National Journal (subscription req’d) recently dug into disbursement records for Congressional and Senate candidates in the 2006 election to answer an interesting question:  How much did a given candidate spend on each vote he or she eventually received?  Alternately, how efficiently did candidates spend their hard-earned warchests?

As noted, this is an interesting question, especially when it comes to Minnesota.  The 2006 U.S. Senate race between Hennepin County Attorney Amy Klobuchar and Sixth District Congressman Mark Kennedy saw nearly $20 million in candidate committee disbursements, and the race between Michele Bachmann and Patty Wetterling to succeed Kennedy in his Congressional seat was quite expensive as well. 

But there’s something missing from the National Journal’s analysis.  Even in an underfunded position, a certain number of voters are always going to vote a certain way – what’s usually known as “the base”.  The Republican base was never going to vote for Amy Klobuchar in statistically significant numbers, nor was the DFL base going to defect in droves to the Kennedy banner.  It’s the votes beyond the base – the marginal votes earned – that might yield more insightful data.

Likewise, there’s a margin in terms of dollars spent.  Even marginally competitive candidates are going to raise and spend at least a certain level of money – it’s what they raise and spend beyond that level that we can focus on as a measure of their effectiveness.

This Marginal Dollars per Marginal Positive Outcome has been used by Baseball Prospectus in analyzing clubs’ efficiency in spending – high-revenue teams like the Yankees, Red Sox, Cubs, and Dodgers pay dearly for each win above what a team of rookies, each paid the league minimum, would achieve.

Enough baseball – more political statistics!

Some definitions:

  • Net Disb:  Net Disbursements from the candidate’s primary campaign committee, courtesy of FEC.gov
  • dBP:  District Base Percentage.  This is a somewhat fudged figure, based on convention wisdom about the political dynamics in each district and statewide.  It accounts for a slight DFL tilt statewide, conservative tilts in the Second and Sixth Congressional Districts, a heavy tilt toward the DFL in the Fifth, and a generally even balance in the First.
  • dTV:  District Total Votes.  Total number of votes cast in this race for competitive major-party candidates.  Fifth District candidate Tammy Lee counted in this analysis, as did John Binkowski in the Sixth, but Robert Fitzgerald and others did not.
  • Bvotes:  Base votes.  Candidate’s vote total times their base percentage – again somewhat fudged due to conventional wisdom.
  • Mvotes:  Marginal votes.  Total votes minus base votes – this is an attempt to represent votes the candidate earned over the course of the campaign beyond those that would vote for a carrot with the right letter after its name.
  • Mdisb:  Marginal Disbursements.  This is another somewhat fudged figure.  In the several competitive congressional races in Minnesota, I defined the minimum spending level as that of Alan Fine, Republican candidate in the Fifth District, who raised and spent a shade under $200,000.  For the Senate race, I defined “competitive funding” as a cool $3,000,000 – in an inexpensive media market, three million should provide at least a modicum of competitiveness in a statewide federal race.  If anyone has a better figure for this, I’m all ears.
  • mD/mV:Marginal Dollars Spent per Marginal Vote Earned – the mother lode.

Caveats:  There are several fudge points in this analysis, including the base percentages and disbursement levels.  I hope they’re generally accurate.  This analysis also does not account for larger political events and trends, including hurricanes, wars, and ineptitude leading to popular dissatisfaction.  Nor does it account for independent expenditures by political parties and outside organizations, the effects of which are difficult to quantify.

Nevertheless, in the aftermath of 2006, this analysis may further clarify who spent money well and who did not.

The chart above reveals some interesting trends.  Many of the mD/mV numbers make sense – Mark Kennedy spent a lot of money on each vote he earned, because he didn’t get many beyond his base.  Tim Walz, in defeating entrenched incumbent Gil Gutknecht, spent his smaller warchest efficiently.  Although Keith Ellison had a natural advantage in a DFL-friendly district, it turns out that he spent a fairly high dollar amount for each vote beyond the hardcore DFL vote, and Tammy Lee spent efficiently, if only to achieve a 25% finish.  And fittingly, the Sixth District race saw two candidates spending massive amounts of money for each vote beyond their bases.

Given the final outcome, it appears that this was an extremely inefficient race on which to spend money.
2006 House Race Expenditure Round-up, Part Three

(I accidently mis-filed this one. – promoted by James L.)

Today brings our next and final installment in our round-up of 2006 House race expenditures (see here, here, and here for the other entries). Sorry for the lag between entries–I had a busier week than I expected (to make up for it, today’s diary will feature glorious color).

Today, we’ll look at two areas: competitive open seats and the handful of races where Democratic incumbents were on the defensive.

As usual, the “Spent” column indicates candidate expenditures, and “Other IEs” includes all independent expenditures made by PACs who filed with the FEC, but not 527 activity. The column on the far right, labeled “MoV”, indicates the current members’ margin of victory. In most cases I used Secretary of State numbers, but in a few races I relied upon CNN. All numbers were subject to rounding.

First, the open seats:


District Candidate Spent NRCC IEs Other IEs Candidate Spent DCCC IEs Other IEs MoV
AZ-08 Graf $1.32M $108k $178k Giffords $2.4M $653k $116k D+12
CO-05 Lamborn $884k $149k $33k Fawcett $631k (none) (none) R+19
CO-07 O’Donnell $2.75M $556k $104k Perlmutter $2.84M $2.01M $39k D+13
FL-13 Buchanan $8.06M $94k $12k Jennings $2.72M (none) $240k R+0
FL-16 Negron $760k $1.67M $11k Mahoney $2.46M $429k $6k D+2
ID-01 Sali $1.04M $610k $534k Grant $704k (none) $40k R+5
IL-06 Roskam $3.26M $3.36M $11k Duckworth $4.46M $3.17M $580k R+3
IL-17 Zinga $406k (none) $25k Hare $789k (none) $161k D+14
IA-01 Whalen $2.27M $2.44M $124k Braley $2.23M $1.90M $50k D+12
MN-06 Bachmann $2.46M $2.48M $65k Wetterling $4.23M $1.15M $646k R+8
NE-03 Smith $1.22M $97k $111k Kleeb $966k $138k $80k R+10
NV-02 Heller $1.6M $482k (none) Derby $1.55M $416k $142k R+6
NY-24 Meier $1.55M $2.25M $12k Arcuri $2.14M $1.92M $54k D+9
OH-06 Blasdel $1.07M $664k (none) Wilson $1.67M $608k (none) D+24
OH-18 Padgett $845k $3.4M $36k Space $1.55M $2.48M $4k D+24
TX-22 Snelly Gibbr $910k $1.68M $11k Lampson $3.49M $127k $2k D+10
VT-AL Rainville $1.12M $720k (none) Welch $1.7M $424k (none) D+8
WI-08 Gard $2.85M $1.12M $142k Kagen $3.14M $1.22M $336k D+2
Total $34.4M $15.3M $1.5M $39.7M $16.6M $2.5M

One thing to note here is that when tallying IE expenditures, I did not include expenditures by PACs against candidates who did not make it through the primary (e.g. the money that the Club For Growth spent against Dean Heller and for Sharon Angle in the NV-02 GOP primary). It’s noteworthy to highlight that GOP-allied PACs were more likely to show up in these open seat races than they were in races where Republican incumbents were on the defensive, but Democratic allies still outspent them by a 5-3 ratio. Of these expenditures, the most heartwarming perhaps is the $3.4 million that the NRCC spent against Zack (“Lost In”) Space, only to see the former Dover Law Director clean up by a whopping 24 points. More curiously, though, was the decision by both committees to largely stay out of the ultra-competitive FL-13 race. I could understand the NRCC holding back, when their candidate had bottomless pockets, but I’m not sure what the DCCC’s strategy was here.

Finally, we have the shortlist of “competitive” Democratic races. A few of these were legitimately competitive, while some represent nothing more than wishful thinking from national Republicans earlier on in the election cycle. Do you remember how badly the NRCC and the White House wanted to spook John Spratt (SC-05) in 2005? With Spratt’s 14-point victory and Republicans retreating from the battlefield early, you have to wonder if anyone significant will have the fortitude to try again in 2008.


District Candidate Spent NRCC IEs Other IEs Incumbent Spent DCCC IEs Other IEs MoV
CO-03 Tipton $822k (none) $5k Salazar $2M $29k (none) D+25
GA-08 Collins $1.97M $672k (none) Marshall $1.84M $210k (none) D+2
GA-12 Burns $2.06M $308k $20k Barrow $2.2M $813k $13k D+0
IA-03 Lamberti $1.99M $1.02M $11k Boswell $2M $885k $33k D+5
IL-08 McSweeney $5.01M $2.37M $82k Bean $4.18M $1.28M $482k D+7
IN-07 Dickerson $62k (none) $4k Carson $591k $69k (none) D+8
LA-03 Romero $1.92M $24k (none) Melancon $2.46M $53k (none) D+15
OR-05 Erickson $1.80M $8k (none) Hooley $1.81M $428k $6k D+11
SC-05 Norman $1.34M $24k $12k Spratt $2.56M (none) (none) D+14
TX-17 Taylor $2.34M $30k $28k Edwards $3.06M $204k $20k D+18
Total $19.3M $4.4M $0.16M $22.7M $3.9M $0.55M

2006 House Race Expenditure Round-up, Part Two

On Tuesday, we looked at the biggest non-party independent expenditures of 2006 in House races, and yesterday, we looked at expenditures of all kinds in 22 of the 23 races where Democratic challengers beat House Republican incumbents. Let’s pick up where we left off and take a look at the heartbreakers of 2006–34 competitive races where the Democratic candidate fell short of toppling an incumbent.

How do we define “competitive”? Well, in this study, I used a compromise of a number of metrics: races where either party committee made significant expenditures, races where the incumbent had a margin of victory under 15%, races with significant (usually $1M+) challenger expenditures, and races with significant independent expenditures. In most of these cases, there is significant overlap between those guidelines of “competitiveness”.

As usual, the “Spent” column indicates candidate expenditures, and “Other IEs” includes all independent expenditures made by PACs who filed with the FEC, but not 527 activity. I have also added a column on the far right indicating the incumbents’ margin of victory. In most cases I used Secretary of State numbers, but in a few races I relied upon CNN. All numbers were subject to rounding.


District Candidate Spent DCCC IEs Other IEs Incumbent Spent NRCC IEs Other IEs Victory Margin
AZ-01 Simon $1.5M (none) $128k Renzi $2.22M $24k $21k R+8
CA-04 Brown $1.65M (none) $53k Doolittle $2.35M $356k $10k R+3
CO-04 Paccione $1.93M $348k $237k Musgrave $3.18M $1.81M $16k R+2
CT-04 Farrell $2.94M $1.64M $183k Shays $3.72M $1.66M $2k R+3
FL-08 Stuart $992k (none) $5k Keller $1.66M (none) $102k R+7
IL-10 Seals $1.85M $158k $25k Kirk $3.48M (none) (none) R+7
IL-11 Pavich $526k (none) (none) Weller $1.84M (none) (none) R+10
IN-03 Hayhurst $691k (none) (none) Souder $634k $225k $1k R+8
KY-02 Weaver $878k $331k $104k Lewis $1.96M $42k $10k R+11
KY-04 Lucas $1.47M $2.71M $10k Davis $3.87M $2.31M $13k R+8
MI-08 Marcinkowski $551k (none) (none) Rogers $1.85M (none) $8k R+12
MI-09 Skinner $384k (none) (none) Knollenberg $2.78M (none) $3k R+5
NC-08 Kissell $683k (none) $200k Hayes $2.37M (none) $8k R+0
NE-01 Moul $979k (none) (none) Fortenberry $1.12M (none) $4k R+17
NE-02 Esch $411k (none) (none) Terry $962k (none) $1k R+9
NJ-07 Stender $1.89M $103k $3k Ferguson $2.92M $48k $16k R+1
NM-01 Madrid $3.32M $2M $1.17M Wilson $4.66M $2.03M $831k R+1
NV-03 Hafen $1.5M $308k $1.14M Porter $2.99M $476k $2k R+2
NY-03 Mejias $908k (none) (none) King $2.06M (none) $1k R+12
NY-25 Maffei $912k $446k $5k Walsh $1.77M $375k $51k R+2
NY-26 Davis $2.37M $423k $248k Reynolds $5.2M $1.03M* $32k R+4
NY-29 Massa $1.44M (none) $144k Kuhl $1.46M $233k $5k R+4
OH-01 Cranley $2M $1.28M $699k Chabot $2.95M $1.46M $21k R+5
OH-02 Wulsin $1.02M (none) $237k** Schmidt $750k $333k ? R+1
OH-12 Shamansky $1.64M (none) $3k Tiberi $2.97M (none) (none) R+15
OH-15 Kilroy $2.68M $1.62M $1.35M Pryce $4.63M $1.81M $82k R+0
PA-06 Murphy $4.04M $3.01M $222k Gerlach $3.46M $3.89M $52k R+1
PA-15 Dertinger $88k (none) (none) Dent $1.26M (none) (none) R+10
VA-02 Kellam $1.59M $1.16M $719k Drake $2.32M $1.36M $15k R+3
VA-10 Feder $1.54M (none) (none) Wolf $1.72M (none) $2k R+16
WA-05 Goldmark $1.15M $321k (none) McMorris $1.84M (none) $6k R+12
WA-08 Burner $2.98M $2.02M $727k Reichert $2.98M $2.36M $22k R+3
WV-02 Callaghan $614k (none) (none) Capito $3.07M $25k (none) R+14
WY-AL Trauner $927k (none) (none) Cubin $1.25M $249k $64k R+0
Total $50.1M $17.9M $7.6M $81.6M $22.1M $1.4M


Notes: *This expenditure was made by the RNC, not the NRCC.

**Due to the labyrinthian backstory of Jean Schmidt’s travails in OH-02 from 2005-06, it’s difficult to sort out which expenditures apply to which period of her career: the special election of 2005, the primary battle last spring, and the 2006 general. I did my best to sort it out, but the picture isn’t entirely clear. For that reason, take these figures with a grain of salt.

Unsurprisingly, Republicans enjoyed more of a financial edge in these races; combining all expenditures, there was a nearly $30 million gap between Republican and Democratic expenditures in these 34 districts. The NRCC did not swamp out the DCCC in these districts by a large margin. NRCC/RNC buys amounted to 55% of the party committee expenditures, while the DCCC was responsible for the remainder. This is very close to the 56-44 NRCC ratio in the seats that the Democrats did pick up from incumbents.

Obviously, this list will bring up some woulda-coulda-shouldas: imagine what Larry Kissell or Eric Massa or Linda Stender could have accomplished with more DCCC IEs, for instance. But it should also highlight some badly underperforming incumbents for next time: Knollenberg in MI-09, Terry in NE-02, and Dent in PA-15, for instance, all posted very underwhelming returns given the financial uncompetitiveness of each of their races.

Oh, and speaking of Linda Stender, here’s one maddening note from last November’s results: if the 3176 votes that the “Withdraw Troops Now Party” candidate won in NJ-07 had been cast for Stender instead, she would have won by about 250 votes. Sigh.

On the weekend, I’ll conclude this series with expenditure round-ups for competitive open seats and the select districts where Democratic incumbents were on the defensive.

2005/06 House Race Expenditure Round-up, Part One

Continuing our analysis of House race expenditures of the 05/06 elections cycle (we looked at the top ten non-party committee expenditures of the cycle on Tuesday), today I’ll be posting total expenditures from the 22 races where a Democratic challenger beat a Republican incumbent (with the exception of TX-23, where I haven’t been able to accumulate all the relevant data yet). And by total, I mean everything except expenditures from the shadowy 527s: candidate expenditures (listed under the “Spent” column), party committee expenditures, and independent expenditures from all sources.

Here’s what I’ve tallied up:


District Candidate Spent DCCC IEs Other IEs Incumbent Spent NRCC IEs Other IEs
AZ-05 Mitchell $1.89M $2.12M $1.02M Hayworth $2.94M $2.25M $7k
CA-11 McNerney $2.34M $216k $1.1M Pombo $4.51M $1.43M $18k
CT-02 Courtney $2.37M $2.07M $1k Simmons $3.09M $2.74M $14k
CT-05 Murphy $2.44M $2.08M $975k Johnson $4.98M $1.88M $456k
FL-22 Klein $4.14M $2.31M $25k Shaw $5.19M $3.35M $217k
IN-02 Donnelly $1.49M $918k $355k Chocola $3.39M $383k $43k
IN-08 Ellsworth $1.72M $2.21M $166k Hostettler $530k $1.87M $21k
IN-09 Hill $1.86M $3.08M $75k Sodrel $2.64M $3.25M $69k
IA-02 Loebsack $443k (none) (none) Leach $519k $21k (none)
KS-02 Boyda $655k $652k (none) Ryun $1.03M $272k (none)
KY-03 Yarmuth $2.2M $321k $5k Northup $3.4M $248k $1.01M
MN-01 Walz $1.23M $371k $722k Gutknecht $1.69M $409k $22k
NC-11 Shuler $1.75M $171k $267k Taylor $4.11M $1.54M $19k
NH-01 Shea-Porter $286k (none) (none) Bradley $856k $21k (none)
NH-02 Hodes $1.47M $1.12M $198k Bass $1.21M $472k $24k
NY-19 Hall $1.57M (none) $5k Kelly $2.46M $19k (none)
NY-20 Gillibrand $2.47M $789k $333k Sweeney $3.38M $592k (none)
PA-04 Altmire $1M $399k $739k Hart $2.17M $619k $19k
PA-07 Sestak $2.92M $1.93M $277k Weldon $2.89M $3.56M $13k
PA-08 Murphy $2.35M $1.72M $189k Fitzpatrick $3.13M $3.62M $11k
PA-10 Carney $1.51M $1.11M $683k Sherwood $2.27M $1.51M $10k
Total $38.1M $23.6M $7.1M $56.4M $30.1M $2M

Now, obviously, these numbers don’t tell anything close to the full story–they don’t discern between positive and negative expenditures, the nature of the expenditures, and the time frame of the expenditures. But the basic framework makes it a decent starting point for our discussion. Note that total expenditures from all sources gave the Republicans a nearly $20 million edge ($89M to $69M) in these 21 districts. Also note how the mediocre fundraising of former New Hampshire Reps. Bass ($1.2M) and Bradley ($0.86M) foreshadowed their surprise defeats last November. Another interesting fact: in this top tier of House races, Republican-allied PACs were almost nowhere to be found–in fact, if it weren’t for the $1 million spent by the National Association of Realtors PAC in support of Anne Northup (KY-03), Democrats would’ve enjoyed a 7-to-1 non-party IE advantage in these districts. Instead, they settled for 7-to-2.

Tomorrow I’ll be posting part two of this discussion, featuring expenditures from open seats, competitive races where Democratic challengers fell short, and the few races where Republican House challengers put Democratic incumbents on the defensive.

The Top Ten Non-Party Independent Expenditures of 2005/6

Over the past few weeks, I’ve been spending a bit of time doing research into independent expenditures made by party committees and independent PACs to get a better sense of how the IE battle played out in many key races across the country. One of the things that I thought would be interesting to share with you all is a top ten list, for both our side and theirs, of the biggest non-party committee expenditures of the cycle for House races. Here’s what the Republican-allied side looks like:


District Candidate Committee For/Against Total Expenditures
KY-03 NORTHUP, ANNE NATIONAL ASSOCIATION OF REALTORS PAC For $1,004,275.00
NM-01 WILSON, HEATHER NATIONAL ASSOCIATION OF REALTORS PAC For $761,734.00
ID-01 GRANT, LARRY CLUB FOR GROWTH INC PAC Against $441,437.17
CT-05 JOHNSON, NANCY AMERICAN MEDICAL ASSOCIATION PAC For $318,426.00
FL-22 SHAW, CLAY AMERICAN MEDICAL ASSOCIATION PAC For $202,179.00
GA-06 PRICE, THOMAS PAC OF THE AMERICAN ASSOCIATION OF ORTHOPAEDIC SURGEONS For $200,000.00
AZ-08 GRAF, RANDY MINUTEMAN PAC INC For $115,482.80
CT-05 JOHNSON, NANCY PAC OF THE AMERICAN ASSOCIATION OF ORTHOPAEDIC SURGEONS For $100,000.00
FL-08 KELLER, RIC NATIONAL RESTAURANT ASSOCIATION PAC For $100,000.00
IA-01 WHALEN, MIKE NATIONAL RESTAURANT ASSOCIATION PAC For $100,000.00

And here’s what our side looks like:


District Candidate Committee For/Against Total Expenditures
OH-01 CHABOT, STEVE AMERICAN FEDERATION OF STATE COUNTY & MUNICIPAL EMPLOYEES Against $620,670.00
OH-15 PRYCE, DEBORAH AMERICAN FEDERATION OF STATE COUNTY & MUNICIPAL EMPLOYEES Against $530,425.00
VA-02 DRAKE, THELMA MOVEON.ORG POLITICAL ACTION Against $529,537.70
CT-05 JOHNSON, NANCY AMERICAN FEDERATION OF STATE COUNTY & MUNICIPAL EMPLOYEES Against $514,354.00
AZ-05 HAYWORTH, JD NEA FUND FOR CHILDREN AND PUBLIC EDUCATION Against $480,763.99
CA-11 POMBO, RICHARD DEFENDERS OF WILDLIFE ACTION FUND Against $470,004.36
IL-08 BEAN, MELISSA NATIONAL ASSOCIATION OF REALTORS POLITICAL ACTION COMMITTEE For $465,568.00
CT-05 JOHNSON, NANCY MOVEON.ORG POLITICAL ACTION Against $444,424.00
OH-15 PRYCE, DEBORAH MOVEON.ORG POLITICAL ACTION Against $417,623.00
PA-10 SHERWOOD, DON AMERICAN FEDERATION OF STATE COUNTY & MUNICIPAL EMPLOYEES Against $361,750.00


Aside from a few big players (most notably the National Realtors PAC, who also made considerable expenditures on behalf of Ed Case‘s primary challenge to Sen. Daniel Akaka, as well as Melissa Bean’s re-election campaign), there is a steep drop-off on the Republican side in terms of the number and quality of IEs relative to the robust and broadly-focused expenditures made by Democratic-allied PACs. Another thing to note is that these Republican expenditures are listed as disproportionately positive, while the Democratic expenditures were disproportionately classified as negative expenditures. Keep in mind, though, that such homogenous categories may betray the shades of grey that exist in such expenditures–this money could have been spent on advertising that contained a mix of positive and negative messages, but the particular committee may have chosen to file an expenditure as “for” a candidate rather than “against” someone else.

I’m still puttering around with a lot more numbers like these, so if anyone has any other research suggestions under the category of expenditures, please feel free to make a suggestion.

Narrowest Dem House Incumbent Performances in 2006

The following incumbent House Dems won with 55% or less this year. The chart is sorted by margin of victory:


District Member Margin PVI
GA-12 Barrow 0.61% D+2.1
GA-08 Marshall 1.09% R+8.4
IA-03 Boswell 5.20% D+1.4
IN-07 Carson 7.42% D+8.7
IL-08 Bean 7.48% R+5.2
OR-05 Hooley 11.39% D+0.5
LA-03 Melancon 14.70% R+4.8

Melancon and Bean are rising sophomores and both won very narrowly in 2004. It’s not a surprise to see them here, especially since Bean received an insanely well-funded challenge this year. Both Melancon and Bean also had their vote totals chiseled away at the left, in Bean’s case by a former Dem who ran as a third-party spoiler this year, and in Melancon’s by a nobody Dem who was able to run on Nov. 7th in Louisiana’s, ah, unique “jungle primary” system.

Carson, Boswell, and Hooley (all multi-year incumbents) are on the under-55 list for the second straight cycle. Boswell’s margin was nearly halved (10.5% in 2004), though he also received a serious top-tier challenge. He hasn’t had an easy pass since 2000, though, and his bouts with illness (Boswell is in his 70s) seem to make him a regular target.

Carson’s health and age are also continually an issue in her district, and, like Boswell, she hasn’t gotten over 55% since 2000. Unlike Boswell, though, her last two challengers were absolute nobodies who raised nothing. Her margin from 2004 to 2006 also shrunk more than three points, despite this being a strong Democratic year. And, as you can see, her district is by far the bluest on this list – John Kerry won here 58-42.

Hooley, meanwhile, did about three points better this time around, despite facing a challenger who raised almost $1.8m. 2004 was no cakewalk either, when her opponent raised $1.3m.

That leaves the two Georgia members, Barrow and Marshall. Both saw their districts become much more Republican after the GA state legislature embarked on a mid-decade redistricting (following Tom DeLay’s cue in Texas). Barrow, like Bean and Melancon, was also a freshman. Both he and Marshall also saw top-tier, big-money challenges. Yes, they barely held on in a big Dem wave, but they also ran in districts which were half-new to them.

To put this list in some perspective, the following GOPers who got under 55% in 2004 lost this year: Rob Simmons (CT-02); Chris Chocola (IN-02); John Hostettler (IN-08); and Mike Sodrel (IN-09). Bob Beauprez’s open seat (CO-07) also changed hands. And Chris Shays (CT-04), Jon Porter (NV-03), Heather Wilson (NM-01), Randy Kuhl (NY-29), Jim Gerlach (PA-06) and Dave Reichert (WA-08) all had very close shaves.

2006 Elections: The 35 Closest House Races (w/poll)

In the 2006 House Races, the Democratic Party picked up a total of 31 seats (incl. VT-AL). Unfortunately we missed picking up seats in 19 very close contests, by less than 10,000 votes in each District. We ended up short by 88,577 votes or an average of 4,662 votes per District. By contrast our candidates won 16 seats in districts by less than 10,000 votes. We captured/held those 16 seats by a total of 82,480 votes for an average of 5,155 votes per District.

Some have asserted that if the DCCC had reacted to some of these races and provided necessary funding, we could have picked up more seats. Others have claimed that the DCCC did the best it could with the resources on hand and the fact that the RNCC had to pour money & resources into normally safe GOP Districts, benefited us nationwide.

I’ll let y’all come to your own conclusions about that, because the purpose of this Diary is more from a Statistical/Tactical Perspective for 2008 regarding the lessons we’ve learned from the 2006 Midterms.

Caveat: Races won by over 10,000 votes (either side) are not included in the Parameters of this Study, though any number of those could be in play in ’08, plus many other seats may be on the horizon that were not in-play in 2006. On the same note, many of these races shown below may not be close for us in ’08, but are sure to get some attention.

More below the fold. Enjoy!

1. CT-02

Courtney-D 121,248 50.002%
Simmons-R 121,165 49.998%
Margin=  +83 D

2. NC-08
Hayes-R 60,926 50.01%
Kissell-D 60,597 49.99%
Margin = +329 R

3. FL-13

Buchanan-R 119,309 50.008%
Jennings-D 118,940 49.992%
Margin = +369 R

4. NM-01

Wilson-R 105,986 50.02%
Madrid-D 105,125 49.98%
Margin = +861 R

5. GA-12

Barrow-D 71,651 50.3%
Burns-R 70,787 49.7%
Margin = +864 D

6. WY-AL

Cubin-R 93,336 48.3%
Trauner-D 92,324 47.8%.
Rankin-Lbt  7,481 3.9%
Margin = +1,012 R

7. OH-15

Pryce-R 110,714 50.2%
Kilroy-D 109,659 49.8%
Margin = +1,055 R

8. PA-08

Murphy-D 125,667 50.3%
Fitzpatrick-R 124,146 49.7%
Margin = +1,521 D

9. GA-08

Marshall-D 80,660 50.55%
Collins-R 78,908 49.45%
Margin = +1,752 D

10. OH-02

Schmidt-R 120,112 50.45%
Wulsin-D 117,595 49.39%
Noy-NP  298 0.13
Condit-NP  76 0.03
Margin = +2,517 R

11. NJ-07

Ferguson-R 98,399 49.43%
Stender-D 95,454 47.95%
Abrams-WTD  3,176 1.6%
Young-Lbt 2,046 1.02%
Margin = +2,945 R

12. PA-06

Gerlach-R 118,807 51.9%
Murphy-D 115,806 48.1%
Margin = +3,001 R

13. NY-25

Walsh-R-C 110,525 50.8%
Maffei-D 107,108 49.2%
Margin = +3,417 R

14. NV-03

Porter-R 102,232 48.5%
Hafen-D 98,261 46.6%
Silvestri-Lbt 5,157 2.4%
Hansen-I 5,329 2.5%
Margin = +3,971 R

15. FL-16

Mahoney-D 115,832 49.55%
Foley (Negron)-R 111,415 47.66%
Ross-NPA  6,526 2.8%
Margin = +4,417 D

16. NY-19

Hall-D-WFP 100,119 51.2%
Kelly-R-C 95,359 48.8%
Margin = +4,760 D

17. IL-06

18. Roskam-R 91,382 51.35%
Duckworth-D 86,572 48.65%
Margin = +4,810 R

18. VA-02

Drake-R 88,777 51.27%
Kellam-D 83,901 48.73%
Margin = +4,876 R

19. NH-01

Shea-Porter-D 100,691 51.3%
Bradley-R 95,527 48.7%
Margin = +5,164 D

20. KY-03

Yarmuth-D 122,489 50.62%
Northrup-R 116,568 48.18%
Mancini-Lbt 2,134 0.9%
Parker-I 774 0.3%
Margin = +5,921 D

21. WI-08

Kagen-D 141,570 50.95%
Gard-R 135,622 49.05%
Margin = +5,948 D

22. IA-02
  Loesback-D 107,683 51.52%
Leach-R 101,701 48.48%
Margin = +5,982 D

23.CO-04

Musgrave-R 109,732 45.61%%
Paccione-D 103,748 43.12%
Eidness-Lbt 27,133  11.28%
Margin = +5,984 R

24. NY-29

Kuhl-R-C 106,077 51.46%
Massa-D-WFP 100,044 48.54%
Margin = +6,033 R

25. CT-04

Shays-R 106,510 50.96%
Farrell- 99,45 47.58%
Maymin-Lbt  3,058 0.15%
Margin:  + 7,060 R

26. WA-08

Reichert-R 129,362 51.46%
Burner-D 122,021 48.54%
Margin = +7,341 R

27. KS-02

  Boyda-D 114,139 50.6%
Ryun-R 106,329 47.1%
Tucker-F 5,094  2.2%
Margin = +7,810 D

28. AZ-05

Mitchell-D 101.838 50.4%
Hayworth-R 93,815  46.4%
Severin-I 6,357  3.1%
Margin = +8, 023 D

29. FL-22

Klein-D 108,688 50.9%
Shaw-R 100,663 47.1%
Evangelista-I  4,254  2.0%
Margin = +8,025 D

30. NY-26

Reynolds-R-C 109,257 51.98%
Davis-D-WFP 100,914 48.02%
Margin = +8,343 R

31. CA-04

Doolittle-R 135,818 49.1%
Brown-D 126,999 45.9%
Warren-Lbt 14,076  11.28%
Margin = +8,819 R

32. OH-01

Chabot-R 105,680 52.25%
Cranley-D 96,584 47.75%
Margin = +9,096 R

33. PA-04

Altmire-D 124,674 51.9%
Hart-R 115,394  48.1%
Margin = 9,280 D

34. MI-07

. Walberg-R 122,348 49.93%
Renier-D 112,665 45.98%
Hutchinson-Lbt 3,788 1.55%
Horn-UST  3,611 1.47%
Shwarz-R(WI)  2,614 1.07
Margin =+ 9,683 R

35. IN-09

Hill-D 110,454 50.02%
Sodrel-R 100,469 45.48%
Schansberg-Lbt 9,893 4.5%
Margin = +9,985 D


These Election Results are based on Certified Election Returns from the individual States’ Secretary of State/Board of Elections Sites, or in the case of Illinos, the two County sites, Cook & DuPage, as the State site is pitiful.(The Commonwealth of Virginia site gets an A++.) Should anyone come up with varying results, please feel free to post them and the source info, so that it can be verified.

Percentage calculations are rounded and may not add up to 100.000%. If anyone would like the links to SOS BOE sites for each/any race, please ask and I will provide in a Comment reply.

Originally posted at Daily Kos on 12/18/06. Some typos regarding vote totals and percentages have been since corrected there and here. Thanks for any input.

By what margin will Bob Shamansky win?

View Results

Loading ... Loading ...

Graphic Anatomy of Victory: Illinois (w/maps)

his is the eight in a series of diaries depicting the Democratic victory in this year’s midterm elections. Other diaries in this series can be seen here.

Already covered have been New England, NY, NJ, MD, and DE, PA, OH, IN, MI, and Wisconsin.

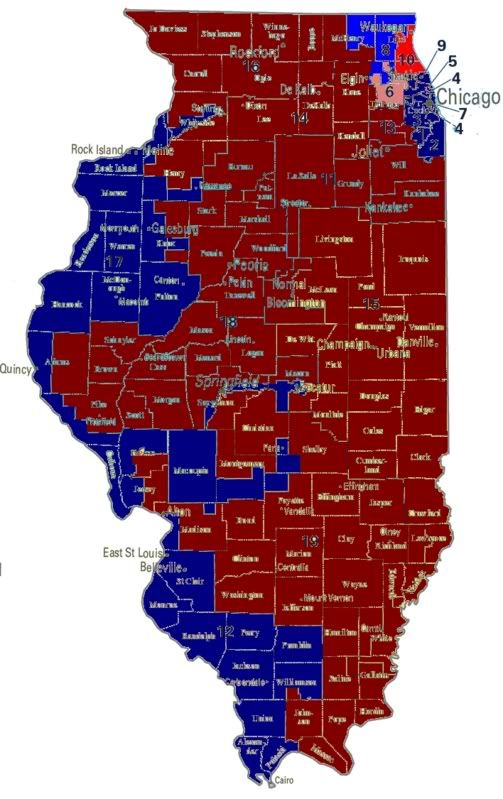
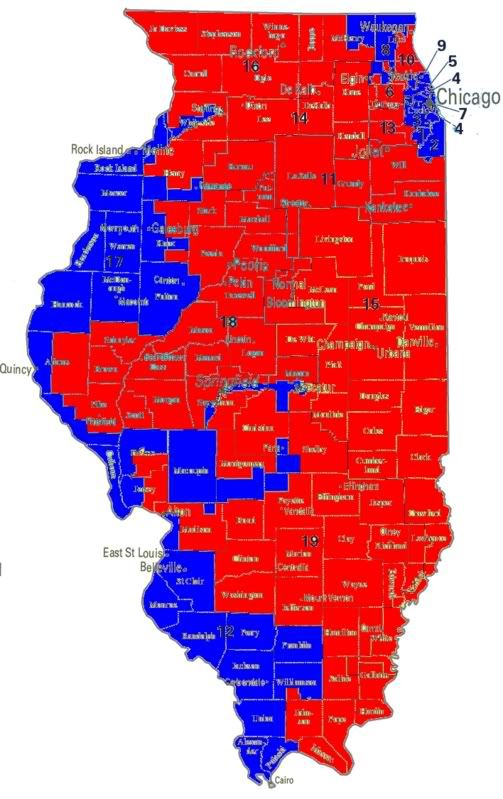
Today’s diary will focus on Illinois. As always first up are the seat control maps, no seats changed hands in Illinois.

Illinois

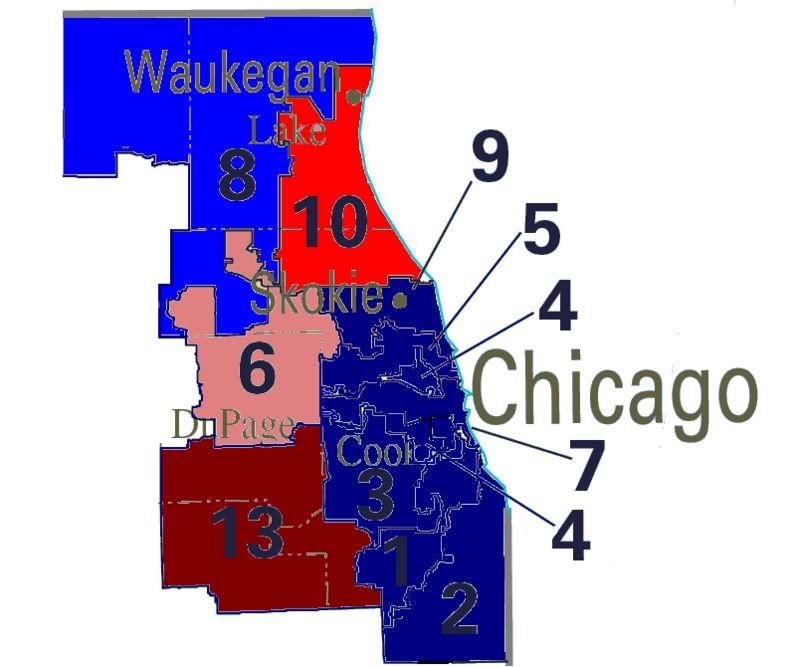
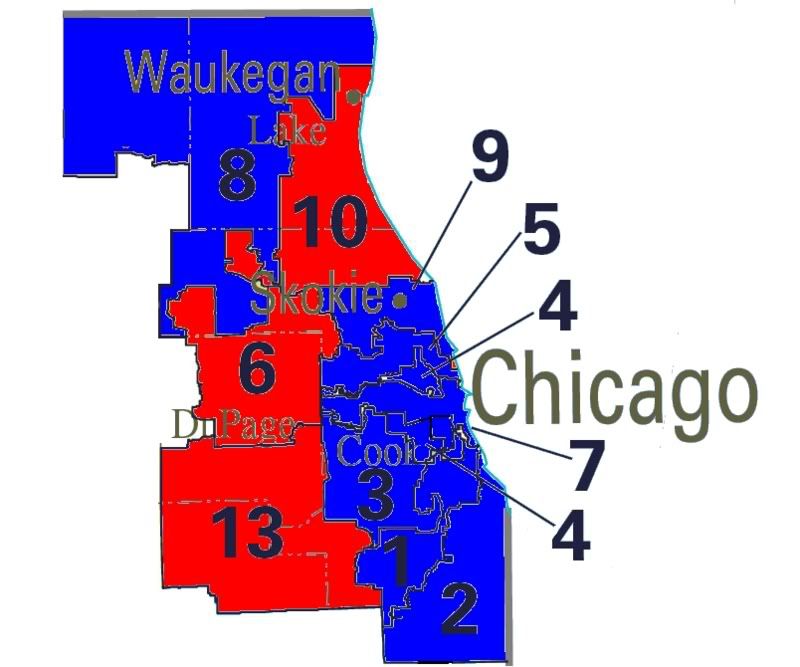
Chicago Metro Area


Of the 3,453,132 votes cast in the 2006 US House races in
Wisconsin,  1,986,431  votes (57.5%) were cast for Democratic candidates, while 1,443,076 votes (41.8%) were cast for Republicans.  Including unopposed races that Democrats had an 15.7% vote total advantage, a 3.9% improvement over 2004.  

2006 Vote Margins

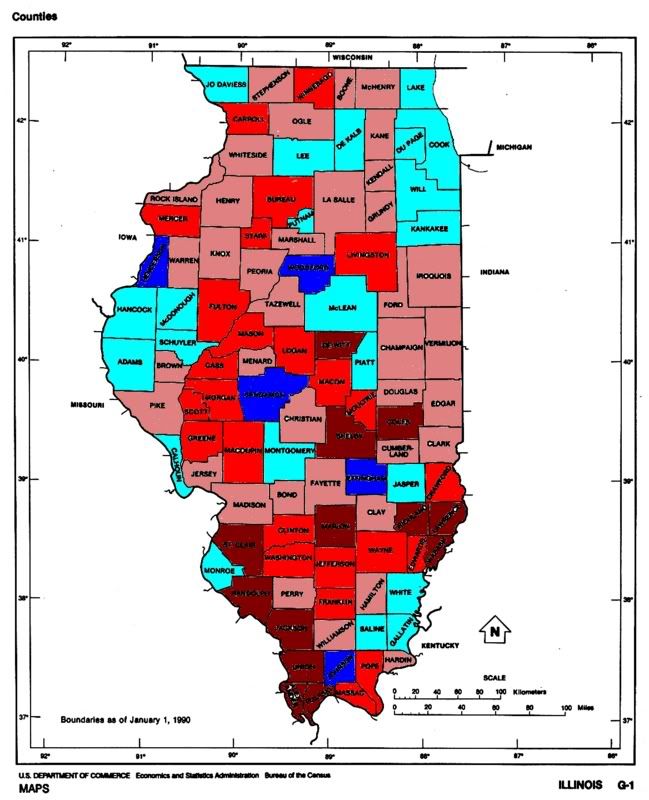
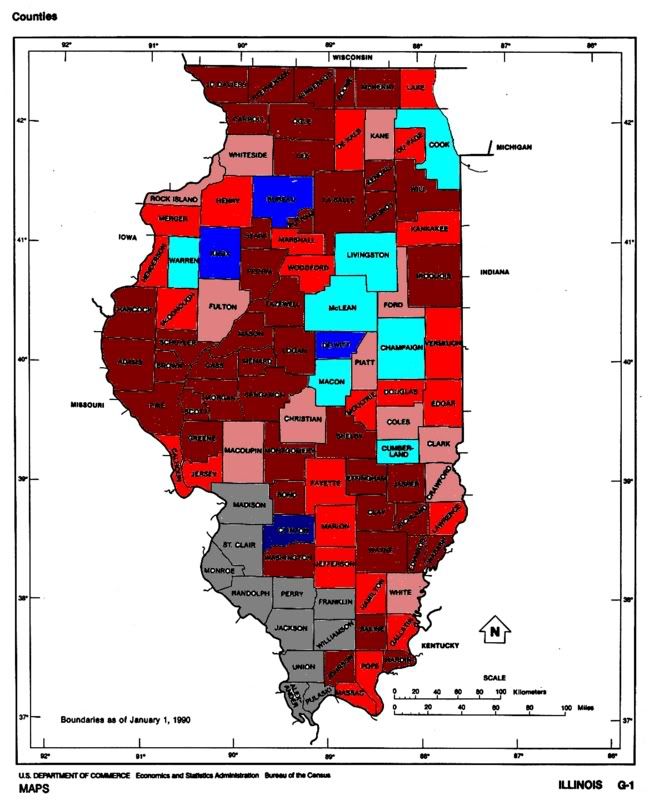
The deepest blue indicates a Democratic vote share over 60%, medium blue 55-60%, light blue 50-55%, pink 45-50%, medium red 40-45%, deep red 40% or less.

As is clear from the map Cook county (Chicago) is both a Democratic powerhouse, and is not clear Cook County is by far the most populous county in the state.  With 2,710,118 registered voters, Cook County is home to over 1/3rd (36.7%) of registred voters in Illinois. Expanding to the full Chicago MSA (Metropolitan Statistical Area, includes Cook, DeKalb, DuPage, Grundy, Kane, Kendall, Lake, McHenry, and Will counties) the Chicago area is home to 4,530,906 voters, or 61.4% of the state’s
registered voters. Excluding the Chicago area, Illinois bears a strong resemblance to Ohio and Indiana, with Republican areas in the center of the state, and ancestral Democratic districts in the southern part of the state.

The two closest races in the state were located in Chicago’s northwestern suburbs. In the closest race, the IL-06, Republican Peter Roskam scored a narrow  4,810 vote margin (2.7% ) over Iraq war vet Tammy Duckworth. In the IL-10, Democrat Dan Seals was defeated by Republican incumbent Mark Kirk by  14,731 vote margin (6.8%).  

Turning to vote shar gainse between the 2004 and 2006 elections, the IL-10 saw the Democratic vote share surge.

2006 Vote Gains

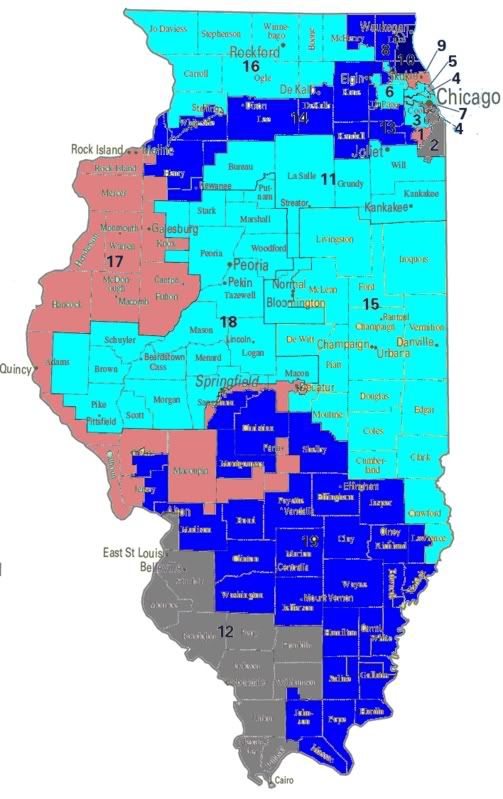
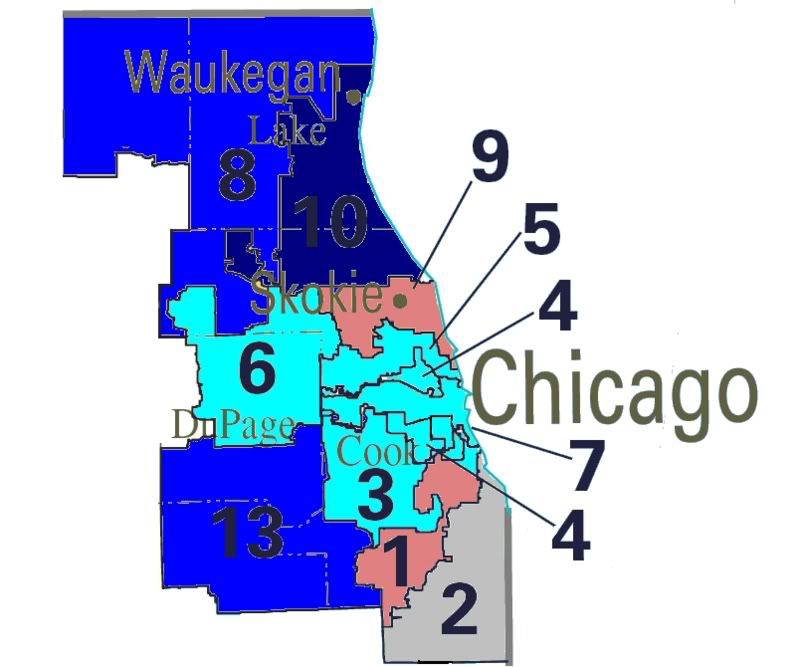
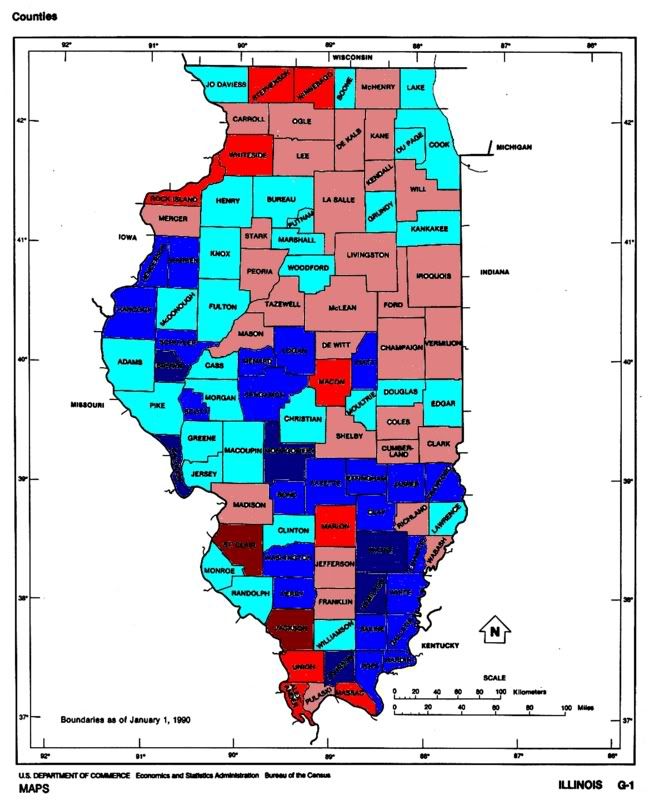
The deepest blue indicates a Democratic vote gain of over 10%, medium blue 5-10%, light blue 0-5%, pink 0 to -5%, medium red -5 to -10%, deep red -10% or less.

The IL-02 and IL-12 are both grayed out because in one of the two years the district was uncontested. Again, the most impressive Democratic vote gain was in the IL-10 where the Democratic vote share rose from 35.7% in 2004 to 46.6%.  As well, Democrats in both the IL-14 and IL-18 saw the Democratic vote share rise by 6.8%, with Democratic candidates raising vote totals from the low
30’s in 2004 to just around 40% this year. In general, while the Chicago area is largely a static area as Democratic vote shares top out as the area has been transformed to a Democratic stronghold, downstate and in the river counties there is a still a large potential for growth.

As a result of this dynamic, further gains in the Chicago area will likely come from get out the vote campaigns, while downstate populist economic messages might offer the potential to convert rural Republicans worried about the exodus of factory jobs that have hit the state.

Looking at differences in turnout between 2004 and 2006, something very important about the Chicago area emerges.

2004

2006

These maps show deviation from statewide turnout. The deepest blue indicates a turnout of 10% or more over the state average, medium blue 5-10%, light blue 0-5%, pink 0 to-5%, medium red -5 to -10%, deep red -10% or less of the statewide turnout average.

Statewide turnout in the 2006 election was 48.6%, a 22.7% drop off from the 2004 turnout at 71.6%.  The most obvious change between the two years comes in the Chicago area with turnout in Cook County and neighoring DuPage and Will counties turnout dropping by more than a quarter. With victory in the Chicago are largely falling to the effectiveness of campaigns in turning out the vote, this augurs well for Democratic opponents in the IL-06 and IL-10 in 2008.  As turnout in these counties increases due to the presidential election in 2008, Democrats downticket in the Chicago area stand to benefit.  Looking at this another way, below I’ve created a map that demonstrates the midterm dropoff.


Midterm dropoff
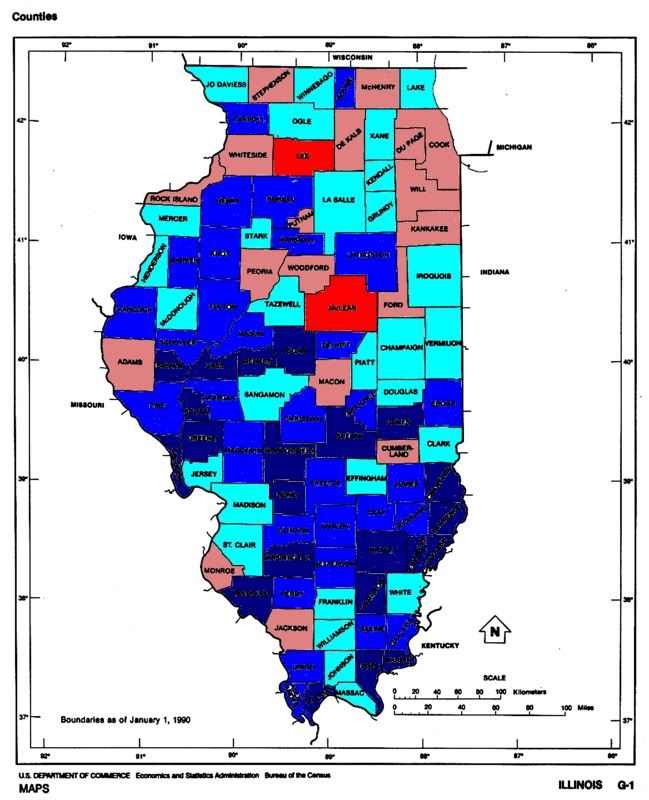
Shading indicates deviation from 2006 statewide dropoff of 22.7% from 2004 election. The deepest blue indicates a dropoff of 10% or more over the state average, medium blue 5-10%, light blue 0-5%, pink 0 to-5%, medium red -5 to -10%, deep red -10% or less  

On this map, the more blue the county is shaded the less variation in turnout between 2004 and 2006.  More so than the other maps this shows the magnitude of the midterm dropoff effect in the Chicago area.  While turnout in Chicago are dropped by more than a quarter, downstate while turnout did drop, it did so only by about 10%.  Thus, the biggest driver behind the midterm effect in Illinois was the Chicago region.  Basically, what emerges is a divide between urban Chicago where turnout determines who wins elections, while downstate victory will depend on the ability of Democrats to win over enough Republican voters to overcome the slight Republican lean of much of the region. Using the vote share totals from the Comptroller, Secretary of State, and Treasurer races, I’ve created a measure of base Democratic performnace,which I’ve mapped below.

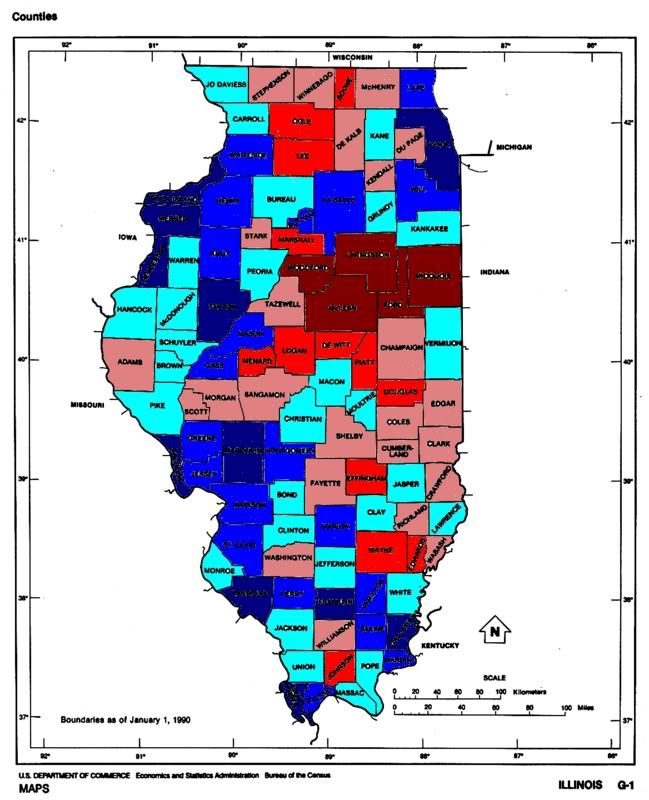
The deepest blue indicates a base Democratic vote share over 60%, medium blue 55-60%, light blue 50-55%, pink 45-50%, medium red 40-45%, deep red 40% or less.

Top 5 Democrat Counties

County        % DEM  Region

Cook        74.6%  Chicago
Gallatin    68.0%  Southern
Calhoun        65.0%  Western
Rock Island    64.5%  Western
Alexander    64.1%  Southern

Bottom 5 Democrat Counties       

County        % DEM  Region

Ford        31.5%    Central
Iroquios    33.4%   Central
Livingston        34.2%    Central
Woodford    35.0%   Central
McClean        39.6%   Central

Again, Cook County emerges as the deepest blue part of the state.  Other areas of Democratic strenght can be found in the Rock Island, East St Louis, and Cairo areas. Republican strenth is concentrated in the east central area of the state, with most of the red areas of the state being competitive.  Slightly more than 5% of Illinois voters live in counties where Republicans, as measured by base partisanship, constitute more than 55% of the electorate.  While Democrats have grown incredildly strong in the Chicago area, for the most part in the rest of the state Democratic congressional candidates significantly underperformed the base partisanship.

Congressional Democratic Performance
The deepest blue indicates a Democratic congressional vote share over 10% or more over the base, medium blue 5-10%, light blue 0-5%, pink 0-5%, medium red -5-10%, deep red -10% or less.

Counties included in the IL-12 are grayed out because the Democrat in that district ran unopposed.  Looking at the state, it’s clear that Democratic candidates have significant room for growth throughout the state.  The measure of base partisanship I’ve constructed is the mean of three low profile state races where voters most often vote for the party rather than the person.  While many people use the Presidential or Governor vote share as a measure of partisanship, that is misleading.  Because the purpose of a measure of base partisanship is measure the effect of party cues on voters, yet in those high profile races party cues play very little role in determining vote choice. In low profile state races party cues constitute the principal way in which voters choose who to vote for.

Looking back on what we’ve covered today, two themes emerge.  

1. Chicago is a mature electorate.  In Cook County, Democrats are dominant, and the large dropoff in midterm elections augurs well for 2008.

2.  In the rest of the state, Democrats are underperforming by a large margin.  Voters who lean Democratic, voting for Democratic candidate for Secretary of State, Comptroller, and Treasurer, are not voting for Congressional Democrats. Democrats took 57.8% of the state’s congressional vote, and constitute 60.3% of the state’s electorate when using base partisanship measures. If Democrats succeed in breaking through to rural voters who choose Democrats for low profile races, but give their vote to Republicans for Congress 2-3 seats above and beyond those identified earlier could come into play.

In this series I have created a race tier system that is I will explain in the next few sentences. Tier 0 races are those where the Democratic candidate won by a margin of less than 5%, the presumption being that incumbency grants an advantage of 5-10% that with the fundraising advantage that comes with holding office should be sufficient for these candidates to defend their seats without funding from the party.  The assumption that incumbency gives a 5-10% advantage drives the classification of the pickup categories.  Tier 1 races are those where the incumbent won by less than 5% in 2006, while tier 2 races are those where Republicans won by less than 10%. Looking at Illinois there is one Tier 1 race, and one Tier 2 race.

Tier 0

Race   D%       R%        Margin        2006 D Cand.

No races meet the criteria for this tier.

Tier 1

Race      D%      R%     Margin    2006 D Cand.

IL-06     48.6    51.4   2.7%      Tammy Duckworth

Tier 2

Race      D%      R%     Margin    2006 D Cand.

IL-10     46.6    53.4   6.8%      Dan Seals

And finally the running totals for the series.

Tier 0 (5)

CT-02, NY-19, NH-1, IN-09, WI-08

Tier 1 (10)

CT-04, IL-06, NJ-07, NY-25, NY-26, NY-29, OH-2, OH-15, PA-06, MI-07

Tier 2 (5)

OH-01, PA-15, IL-10, IN-03, MI-09

States Covered

CT, IL,IN, MA, MD,ME, MI, NH, NJ, NY, OH,PA, RI, WI, VT

Graphic Anatomy of Victory: Wisconsin (w/maps)

This is the eight in a series of diaries depicting the Democratic victory in this year’s midterm elections. Other diaries in this series can be seen here.

Already covered have been New England, NY, NJ, MD, and DE, PA, OH, IN, and Michigan.

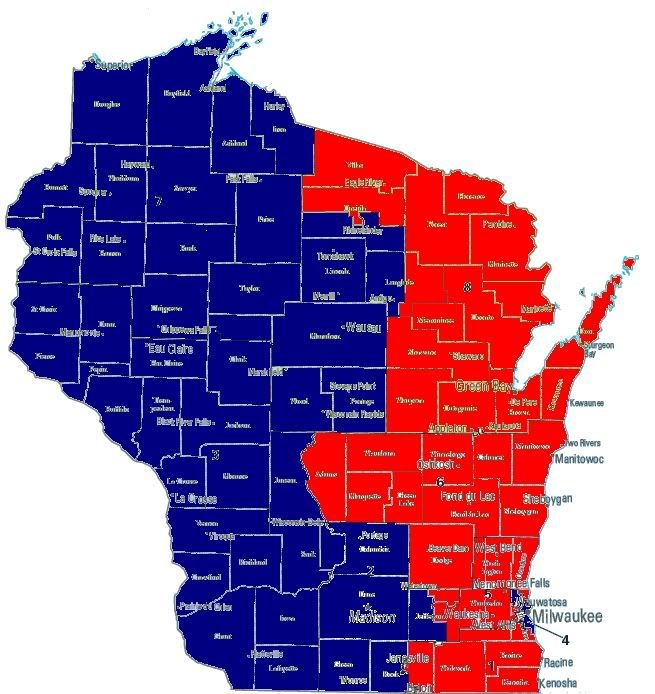
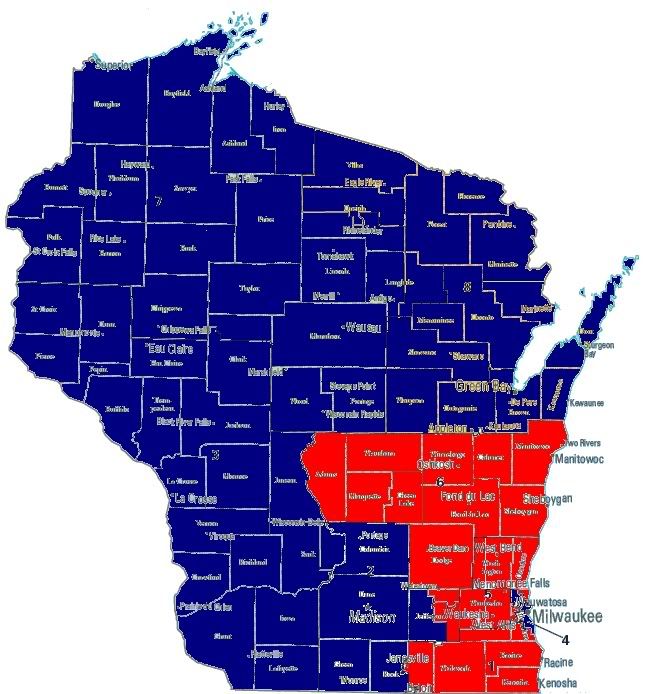
Today’s diary will focus on Wisconsin. As always first up are the seat control maps.

2004

2006

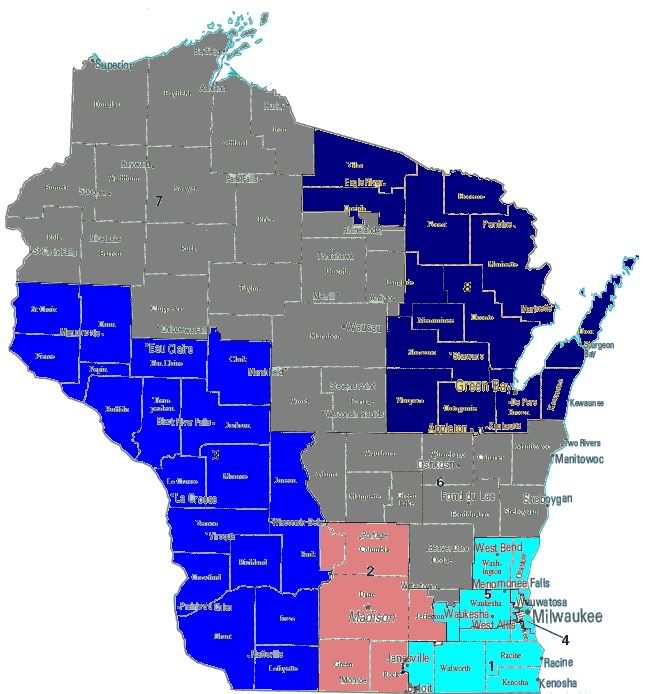
Of the  1,852,619 votes cast in the 2006 US House races in Wisconsin,  1,001,254 votes (54%) were cast for Democratic candidates, while  836,054 votes (45.1%) were cast for Republicans.  Including unopposed races that Democrats had an 8.9% vote total advantage, a 5.1% improvement over 2004.  

2006 vote totals for the the race in the WI-06 are not currently available online, so the numbers above don’t include that district.

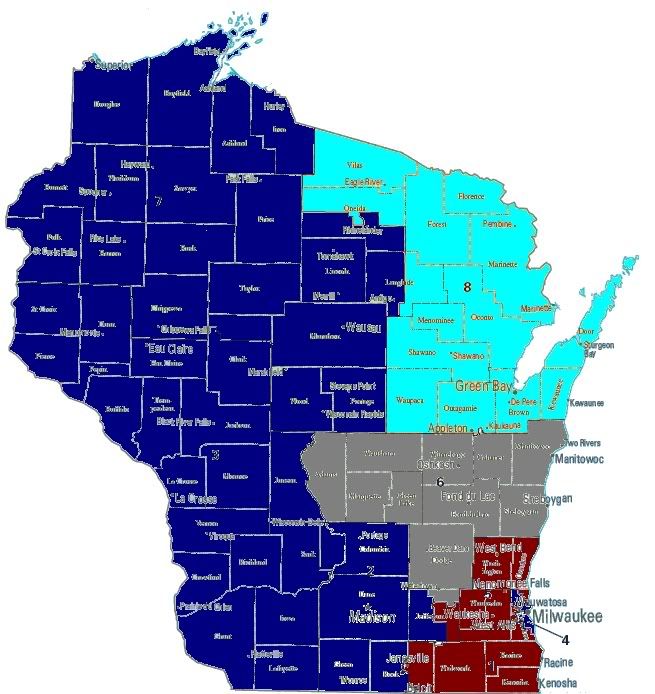
2006 Vote Margins

The deepest blue indicates a Democratic vote share over 60%, medium blue 55-60%, light blue 50-55%, pink 45-50%, medium red 40-45%, deep red 40% or less.

Democrat Steve Kagen won in the open seat in the WI-08 defeating Republican State Assembly Speaker John Gard by 6,608 votes (2.4%).  This represents a 21.4% surge over the 2004 Democratic vote share (29.8%) in this district.  Coming in at over $4 Million , Democrat Steve Kagen spent $1.7 Million of his own money outspending Republican John Gard by over $100,000.

All other races in Wisconsin were won by margins of over 10%.

2006 Vote Gains

The deepest blue indicates a Democratic vote gain of over 10%, medium blue 5-10%, light blue 0-5%, pink 0 to-5%, medium red -5 to -10%, deep red -10% or less.

2006 vote totals for the WI-06 where the Republican went unchallenged are unavailble, and the WI-07 is grayed out because there was no 2004 Republican challenger.

The most impressive vote gain was in the WI-08 as was mentioned above. In the WI-02, there was a 0.4% shift towards the Republican, while  Democrats made an 8.4% gain in the WI-02, yielding  much large Democratic margin of victory than in 2004.  In the Milwaukee suburbs, Democrats made 4.8% and 4% gains in the WI-01 and WI-05 respectively.  However, the Republican margin of victory in these districts was over 25% in 2006.

In this series I have created a race tier system that is I will explain in the next few sentences. Tier 0 races are those where the Democratic candidate won by a margin of less than 5%, the presumption being that incumbency grants an advantage of 5-10% that with the fundraising advantage that comes with holding office should be sufficient for these candidates to defend their seats without funding from the party.  The assumption that incumbency gives a 5-10% advantage drives the classification of the pickup categories.  Tier 1 races are those where the incumbent won by less than 5% in 2006, while tier 2 races are those where Republicans won by less than 10%.  It’s really quite simple.

Tier 0

Race   D%       R%        Margin        2006 D Cand.

WI-08  51.2%   48.8%      2.4%          Steve Kagen  

Tier 1

Race      D%      R%     Margin    2006 D Cand.

No races meet the criteria for this tier.

Tier 2

Race      D%      R%     Margin    2006 D Cand.

No races meet the criteria for this tier.

And finally the running totals for the series.

Tier 0 (5)

CT-02, NY-19, NH-1, IN-09, WI-08

Tier 1 (9)

CT-04, NJ-07, NY-25, NY-26, NY-29, OH-2, OH-15, PA-06, MI-07

Tier 2 (4)

OH-01, PA-15, IN-03, MI-09

States Covered

CT, IN, MA, MD,ME, MI, NH, NJ, NY, OH,PA, RI, WI, VT

A Graphic Anatomy of Victory: Michigan (w/maps)

This is the sixth in a series of diaries depicting the Democratic victory in this year’s midterm elections.

Already covered have been New England, NY, NJ, MD, and DE, PA, OH, and Indiana.

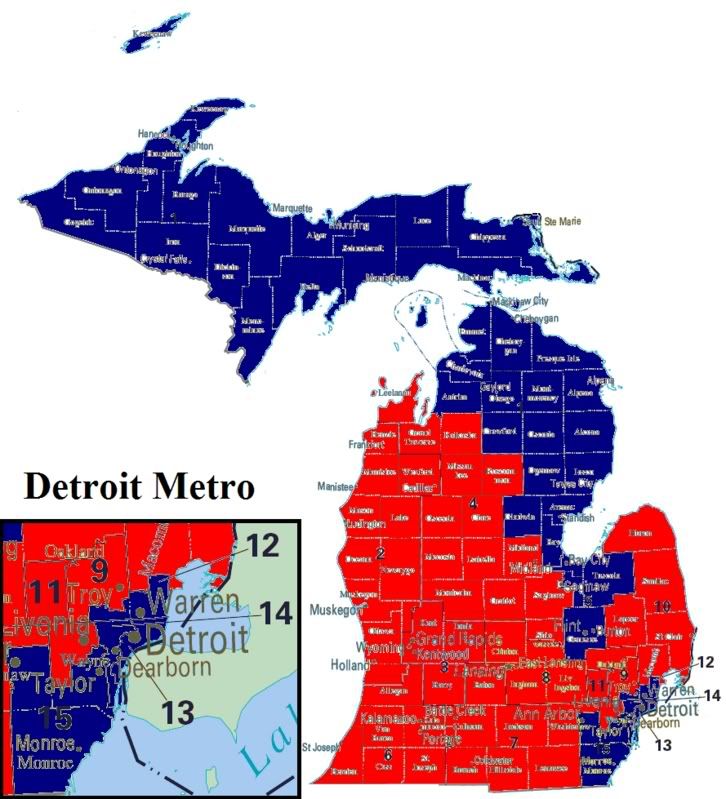
Today’s diary will focus on Michigan.  As always first up are the seat control maps, and in this case there’s only one map because no seats changed hands in 2006.

2004 & 2006

Of the  3,646,436 votes cast in the 2006 US House races in Michigan,  1,922,808 votes (52.7%) were cast for Democratic candidates, while  1,626,399 votes (48.4%) were cast for Republicans.  Including races that the Repubicans didn’t oppose in 2006, this represents a 4.1% shift from 2004, excluding the two Detroit races Republicans choose not to oppose in 2006 the modified Democratic vote share at 48.4% represents a 3.1% shift  over totals in the same 13 races in 2004. As stated above no seats changed hands.

Democrats took 6 (40%) of Michigan’s 15 Congressional districts while winning 48.4% of the state Congressional vote, rising to 52.7% if totals from the two Detroit districts left unopposed by Republicans are included. If seats were apportioned according to vote totals, i.e. proportional representation,  Compare this to Indiana where Democrats took 55.5% of the state’s Congressional seats while winning only 48.5% of the state Congressional vote.  

The difference?  

Democrats controlled redistricting in Indiana, while Republicans controlled the redistricting process in Michigan in 2000. While Democrats control both the governor’s offices and the Michigan House, Republicans retained control of the Michigan Senate.  With the redistricting process controlled by the legislature, this points to the need to put the press on Republican Michigan Senators for 2008.  However, attmempts at redistricting at this point probably would do more harm than good.  Using the fairer Democratic performace standard I’ve created below, we find that statewide Democratic performance  is at 51.8% which if reflected in the distribution of Congressional seats would create two new Congressional seats for the Democratic party.

The 50 State Strategy can’t be a one hit wonder, we have to work to get Democratic candidates elected at all levels.  If we do we’ll have strong candidates to run for office in other races.  We need to build a farm league, officeholders who’ve already represented part of the district at a another level of government who can run for Congress.  Half the fight for a challenger is getting the public to recognize your name.  If you’ve got someone who’s familiar from having already held office you’ve got a running start.  This is how the Republicans win, they build up networks that stay in place long after any one race has been finished.  

Senators and Congressional representatives who have large warchests should be asked to pay an apportionment to state parties.  And we need strong competition within the party organization to ensure that state parties aren’t controlled by a few wealthy donors to the detriment of the working public.

Returning to Michigan, there’s hope that we can take two Congressional districts without redistricting.  While there were no Congressional pickups in Michigan, Democratic candidates came within striking distance in the MI-07 and MI-09.


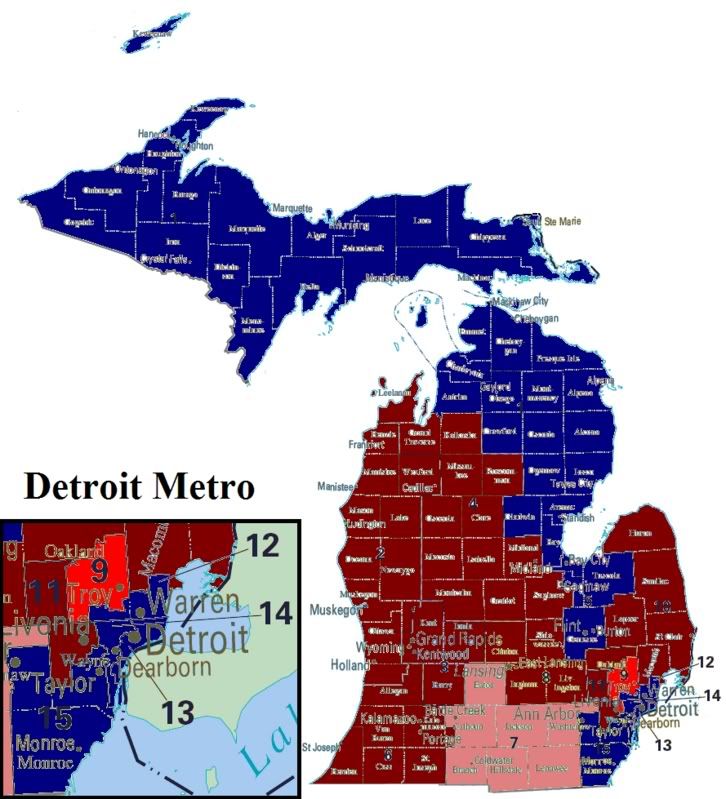
2006 Vote Margins
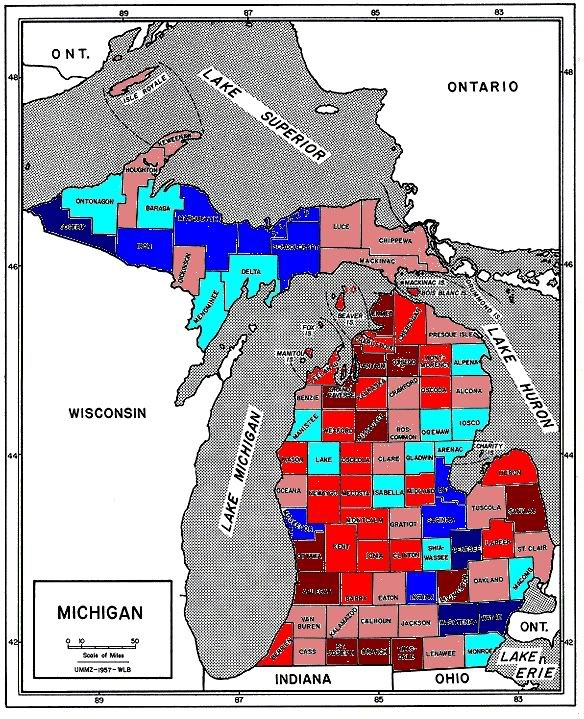
The deepest blue indicates a Democratic victory of over 60%, medium blue 55-60%, light blue 50-55%, pink 45-50%, medium red 40-45%, deep red 40% or less.

In the MI-07, Club for Growth Republican candidate Tim Walberg defeated the incumbent Republican candidate Joe Schwarz in the August primary. Walberg’s campaign faced contreversy in late October when a local paper revealed that a Walberg aide had pled guilty to child abuse charges in September.  Walberg won with a narrow 10,0017 (4.1%) margin over Democratic candidate Sharon Marie Renier.  While measures of base partisanship show that the western edge of the district leans Republican, vote totals from the Governor’s race show the impact that a high profile race with a winning message can have in the area, turning red to blue.

The second pickup opportunity for 2008 lies in the in the I-09 where incumbent Republican Joe Knollenberg faced a strong challenge from Democratic candidate Nancy Skinner.  Despite winning his district by a 18.9% margin in 2004, a poll taken in August showed Knollenberg in deep trouble.  Well under 50%, Knollenberg was running at 44% to Skinner’s 40%.  In a district dominated by the auto industry, Knollenberg’s postions for NAFTA and steel tarriffs that hurt domestic auto production ran showed a disconnect with the people back home.  Knollenberg’s 14628 (5.3%) vote margin yielded a narrow 51.5% victory him, and a great big target on his seat for 2008.


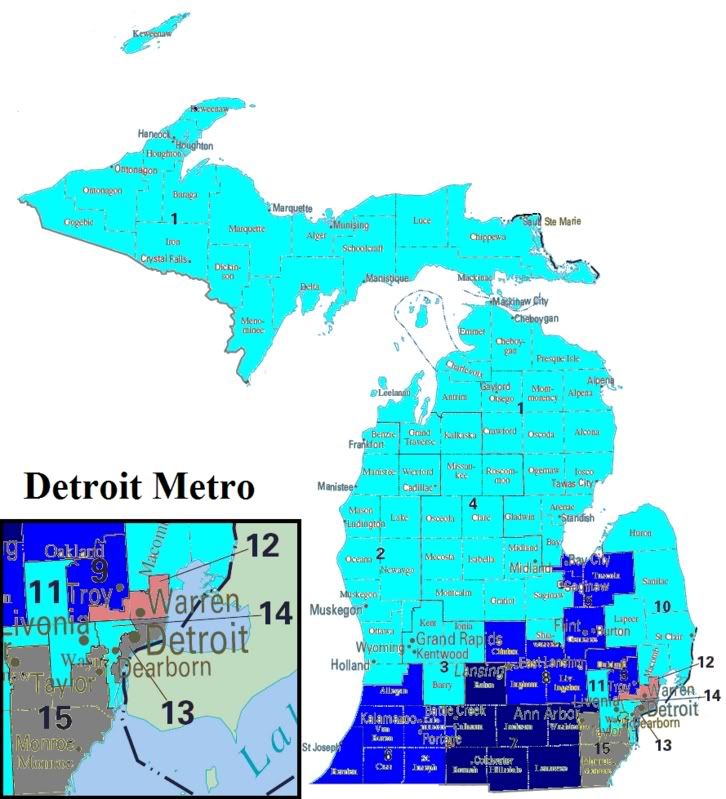
2006 Vote Gains
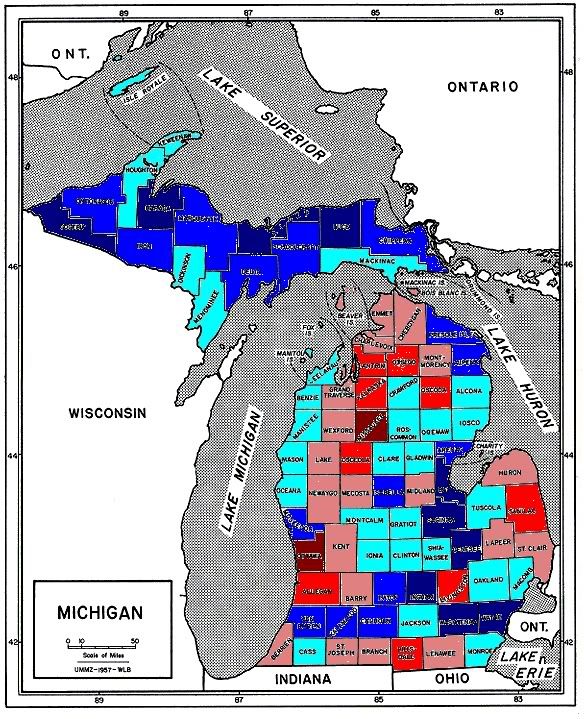
The deepest blue indicates a Democratic vote gain of over 10%, medium blue 5-10%, light blue 0-5%, pink 0 to-5%, medium red -5 to -10%, deep red -10% or less.

If there’s a lesson to be learned from Michigan it’s that a Democratic message that focuses on confronting the very real problems presented by corporate globalization and the dismembering of state regulatory regimes that protected workers, consumers, and the environment is a winner. Our two greatest surges came in the already mentioned MI-07 where the Democratic candidate surged by 10.1% over the 2004 Democratic performance at 36.3%.  In the MI-09, Skinner rose 6.7% over the 39.5% Democratic candidate showing in 2004. We need a populist economic message if we want to make gains in 2008.

There’s a war brewing in the party right now because of this.
Sirota’s right when he goes after the lack of geographic diversity among the pundit class and the subsequent impact that this has on the polical dialogue in this country.  We need people like Sherrod Brown to make trade an issue.  Even more damning is the piece written by Gjohnsit noting that 27 of the 29 Democratic pickups this year came from the defeat of “free trade” Republicans.  And back in Michigan, our biggest gains came against Republicans toeing to neo-liberal economic policy framework that working people don’t want.  If the Democratic leadership and the pundit clases can’t get the message they need to have their asses shipped off to the unemployment line.  Turnabout’s fair play, let’s see how they like it when they spend a year without a paying job.

But the war in the party brews, I may have to stop to take a break from the Graphic Anatomy of victory series to give this  the treatment this deserves later this week.

The point is that Democrats can win in rural areas.  Looking at a map of base Democratic performance in Michigan we see that except for the Upper Peninsula, Democratic strength is largely held in the Detroit metro area.


2006 Base Partisanship
The deepest blue indicates a Democratic base partisanship of over 60%, medium blue 55-60%, light blue 50-55%, pink 45-50%, medium red 40-45%, deep red 40% or less.

The measure of base partisanship is predicated on a belief in the role of information in politics.  Basically, where voters are unfamilar with candidates and issues they rely upon party to make their decision.  Most of us have had the moment in the polling booth when we get down to low profile races like Clerk of Courts, and having not a clue to either the candidate’s running or the issues at hand we vote the only way we know how, by party designation.  I’m planning to develop a more thorough measure that looks for low profile state races where total spending per capita was low to calculate means that give us an idea of how people vote with no other information but party.

To create the measure I’ve displayed on the map above, I took  the mean of Democratic vote share (note that all races elect 2 candidates) in the Wayne State University Board of Governors, Michigan State University Board of Trustees, and University of Michigan Board of Regents races.

Top 5 Dem Michigan Counties

CTY         Area        Base Democratic Vote

WAYNE     Detroit       69.8%
GENESEE   Detroit       62.9%
GOGEBIC   Upper Pen.    60.5%
WASHTENAW Detroit       60.2%
MARQUETTE Upper Pen.    59.4%

As you can see Democratic strength is concentrated in the Detroit metro area, and the parts of the Upper Peninsula near Wisconsion.  The Upper Peninsula is was dominated by the mining industry at the beginning of the 20th century, and continues to have a large forestry industry.  Also this is the the only area in the US where a Finnish ancestry dominates.  In many ways the Upper Peninsula belongs more culturally and demographically to Wisconsin and Minnesota than it does to Michigan.

While the red swath in western Michigan may look unconquerable, results from the 2006 Governor’s race where Democrat Jennifer Granholm prevailed prevailed over Republican Dick DeVos.  Granholm took 56.3% of the vote with DeVos taking only 42.3% of the vote despite having spent  almost $40 million of largely his own money attempting to unseat Granholm.  De Vos is heir to the Amway fortune, and was attacked by the AFL-CIO for outsourcing Michigan jobs, and has a long record of support for neo-liberal economic policies on trade and education. Looking at the returns from the 2006 Governor’s race Granholm was able to garner strong support in strongly Republican areas.


2006 Governor’s Race
The deepest blue indicates a Democratic victory of over 60%, medium blue 55-60%, light blue 50-55%, pink 45-50%, medium red 40-45%, deep red 40% or less.

Granholm’s most dramatic gains were in the Upper Peninsula where she outperformed the base Democratic vote by 16.1% in Luce county, and in the Kalamazoo area where she performed 9.6% over the base Democratic vote.  Statewide Granholm only performed 4.6% over the base Democratic vote, however her overperformace was concentrated in Republican areas denying De Vos his Republican base.

Tier 0

Race      D%      R%     Margin    2006 D Cand.

No races meet the criteria for this tier.

Tier 1

Race      D%      R%     Margin    2006 D Cand.

MI-07     46.4    50.5   4.1       Sharon Marie Renier

Tier 2

Race      D%      R%     Margin    2006 D Cand.

MI-09     46.2    51.5   5.3       Nancy Skinner

And finally the running totals for the series.

Tier 0 (4)

CT-02, NY-19, NH-1, IN-09

Tier 1 (9)

CT-04, NJ-07, NY-25, NY-26, NY-29, OH-2, OH-15, PA-06, MI-07

Tier 2 (4)

OH-01, PA-15, IN-03, MI-09

States Covered

CT, IN, MA, MD,ME, MI, NH, NJ, NY, OH,PA, RI, VT