Redistricting Maryland

 I already did a map with Maryland redistricting in September but now that Obama/McCain election results are incorporated into maps of Maryland, I decided to create a new map this time knowing how each congressional district I made voted for Obama. I decided to do an 8-0 Democratic map without creating a convoluted gerrymander. I also wanted to make sure none of the district violated the Voting Rights Act. If you are confused with the district labeling, CD4 is for the red district while CD8 is for the light purple district. CD3 is for the purple district and CD6 represents the teal district. I think I gerrymandered a bit with the 1st and 3rd Congressional districts but on the most part, I probably avoided a large gerrymander. My main goals here were to shore up Frank Kratovli (D) who barely won in the heavily Republican 1st Congressional district last year. I also wanted to make Roscoe Bartlett’s 6th district too Democratic so he would retire. Here is a link to the current map of Maryland’s Congressional districts: http://http//www.mdp.state.md….

Here is a link for Maryland’s demographic data: http://http//quickfacts.census…

Here is yet another link, this time for 2008 election results in Maryland: http://http//uselectionatlas.o…

Here is the link for the first Maryland map

http://swingstateproject.com/d…

Here are the maps:

West Maryland

East Maryland

Central Maryland

1st District Frank Kratovli (D)

I could not split the eastern shore because the Maryland State Legislature would probably not back that kind of plan. The old district went onto the western shore taking in heavily Republican parts of Anne Arundel, Baltimore and Harford counties. For this plan, I sent the 1st into Democratic Annapolis and up north towards Prince Georges County. Along the way, I slipped in some Democratic parts of Anne Arundel County besides Annapolis and put about 130,000 people in Prince George’s County into the 1st. This raises Obama’s percentage of the vote to 54% which is about the same as my old map. Prince Georges County had high turnout in 2008 because of Obama but the turnout may drop in an off year election, causing trouble for Kratovli. He should still win because the Republican base in the 1st district is in the Eastern Shore which is Kratovli’s base. In 2008, the Republican challenger did well on the western shore. Demographics are 25% African American and 66% White. Status is Likely Democrat.

2nd district Dutch Ruppersberger (D)

By creating a more compact district, I included more Republican areas in the district. Giving the 2nd district more of Baltimore compensates a bit but I still decreased the African American population from 27% to 23%. The 2nd district represents many working class neighborhoods in Baltimore City and Baltimore County and most of those votes should support Democrats except they might lean towards former Governor Bob Ehlrich (R). Unless a candidate like Ehlrich runs, Ruppersberger should have no trouble winning. Obama won 56% of the vote here. Demographics are 23% African American and 68% White. Status is Safe/Likely Democrat.

3rd district John Sarbanes (D)

I removed all of Anne Arundel County and parts of Baltimore County. I replaced those areas with Carroll County, more of Howard County and a bit more of Baltimore City. Even though Carroll County is heavily Republican, the Democratic areas in Howard County, Baltimore City and County make the 3rd district heavily Democratic. Also, I increased the African American percentage from 16% to 23%. In my last map, the 3rd district voted 55% for Obama because I did not have enough of Howard County and too much of Carroll County. Now with these changes, Obama won a solid 60% of the vote. Demographics are 23% African American, 6% Asian and 64% White. Status is Safe Democrat.

4th district Donna Edwards (D)

Originally, this district contained heavily Democratic areas in Prince Georges and Montgomery Counties. In my old map I gave the district some Republican parts of Frederick County. Now this version of the 4th district has part of Carroll County too. The district also does not violate the Voting Rights Act because 50% of the population in my 4th district is African American. Donna Edwards should have no trouble winning here against a Republican. Obama won 75% of the vote here. Demographics are 50% African American, 9% Hispanic and 33% White. Status is Safe Democrat.

5th District Steny Hoyer (D)

Steny Hoyer is the House Majority Leader so he should get whatever kind of district he wants. By removing parts of Prince Georges County and adding Republican parts of Anne Arundel County, the district grows less Democratic. Even though he should win in this district, he may not view it as safe enough for him. Still, the 27% African American population should be enough to protect him. Obama won 57% of the vote here. Demographics are 27% African American and 64% White. Status is Safe Democrat.

6th District Vacant

This district formerly belonged to octogenarian Roscoe Bartlett (R) but since I moved his home out of the 6th, the district is currently vacant. Since I put the majority of the district in Montgomery County, the district turns from heavily Republican to heavily Democratic. I also slipped in a small piece of Prince George’s County which was in the old 8th district and basically caused Chris Van Hollen (D) to win there in 2002. The Republican areas in the west should not be enough to offset Democratic margins here. Obama won 61% of the vote in the new 6th. Demographics are 14% African American, 7% Asian, 12% Hispanic and 64% White. Status is Safe Democrat.

7th District Elijah Cummings (D)

This district also barely meets the VRA standards but it does. It also includes heavily African American and Democratic parts of Baltimore City and County (Obama won 98% of the vote in many of the precincts) but also goes to the Pennsylvania border and includes heavily Republican exurban areas in Baltimore and Harford Counties. Even though the suburban areas are extremely Republican, the district still remains heavily Democratic and Cummings should not have much trouble with reelection. Obama won 66% of the vote here. Demographics are 50% African American and 42% White. Status is Safe Democrat.

8th District Chris Van Hollen (D) v. Roscoe Bartlett (R)

Since Bartlett is very old and this district is anchored in Montgomery County, he should just retire instead of facing a hard race. Van Hollen is a strong candidate with deep pockets. Anyway, Van Hollen’s new district contains most of Frederick County which leans Republican and retains part of Montgomery County which leans Democratic. Obama won 64% of the vote here. Demographics are 14% African American, 11% Asian, 13% Hispanic and 58% White. Status is Safe Democrat

By what margin will Bob Shamansky win?

View Results

Loading ... Loading ...

How Christie Won: Urban and Northern New Jersey

This was cross posted at http://frogandturtle.blogspot….

Here is my next and last post in analyzing county by county why Christie beat Corzine in New Jersey. Here is my first post: http://swingstateproject.com/s…

Here is the link to the 2008 election results (red is Democratic and blue is Republican)http://uselectionatlas.org/RESULTS/

Here is the link to the 2009 election results: http://http://uselectionatlas….

Here is the link for New Jersey demographics by county: http://http://quickfacts.censu…

Urban New Jersey

This area contains Union, Essex and Hudson Counties. Christie underperformed the most in this part of the state with Corzine winning it almost 2-1. This was no surprise because Urban New Jersey is by far the most Democratic part of the state. It is minority majority and mostly resembles a city instead of suburbs. Christie also was unable to make large inroads here. In Hudson County where Obama won 73%-26%, Corzine won 69%-27% which only shows a decrease in the Democratic margin by 5 points, the smallest decrease of any county in New Jersey from 2008 to 2009. Hudson County is 35% White, one of the smallest percentages in New Jersey. Christie had a difficult time making inroads among minority voters. The main reason for Christie’s small increase is that Corzine lives in Hoboken, a really nice town in Hudson County where many of transplants from Manhattan live. Corzine’s proximity was a large factor in Hudson County. Since Christie had a difficult time winning minority voters, it appears that Republicans can still win in New Jersey without having to make inroads among minorities if they want to win. Essex County which contains heavily Democratic Newark voted 67%-28% for Corzine while Obama won there 76%-23%. This shows a 14 point decrease in the Democratic margin, only 5 points below the statewide decrease of 19 points. Even though Corzine appeared to hold minorities, there are many independent high income white voters in the western part of Essex County that trended heavily toward Christie, causing the Democratic margin in Essex County to shrink. Union County is where Christie performed the best, decreasing Obama’s 28 point margin to an eight point margin for Corzine. While Union County contains Elizabeth and Plainfield, two cities with large minority populations, Union County is basically Somerset County in the west with heavily white and high income Westfield and Summit. In my post about what to watch for in the New Jersey gubernatorial race, I said Corzine had to win Union County but ten points or more and unfortunately, he did not. Overall, Corzine did very well in Urban New Jersey by preventing Christie from making large inroads among minorities.

Northern New Jersey

Except for Passaic and Bergen Counties, Christie did very well here. He pulled a combined margin of about 30,000 votes out of Sussex and Warren Counties, even though Daggett did very well in them winning 9% and 10% of the vote there. Christie won his home county, Morris by 28 points and its residents are mostly high income white voters. The trend towards Christie over 2008 was 19 points, the same as the overall trend towards him in New Jersey. The reason for the trend not being too sharp in Morris County is party due to Daggett’s strong 8% of the vote here and that Christie appeared to spend more time campaigning on the Shore than here. Passaic County is a different story where Corzine won 51%-44% and Obama won there by 22 points. Passaic County is a mixture of Hispanic immigrants in the city of Paterson and high income white voters in the suburbs along with some working class white voters. The Hispanics probably kept Passaic County from trending too far to the right but it appears that Christie did very well with white voters and Corzine failed to excite the base enough. Corzine won Bergen County by 3 points, only a 6 point decrease from Obama’s 9 point win. Corzine was definitely helped by his running mate Loretta Weinberg who has held political office in Bergen County for more than 20 years. Bergen County is full of high income white voters and if Weinberg were not on the ballot, Christie would probably win Bergen County by about 7 points. Weinberg was not perfect because she was unpopular with party bosses which probably contributed to low turnout in Democratic areas. Also, Corzine’s close proximity in Hudson County may have swayed a few voters.

So overall, what happened to make Corzine lose? On the issues, people swayed towards Christie not because he was a fantastic candidate. In New Jersey, almost all campaigns are negative so the candidates spent most of their time criticizing each other. People believed Corzine was an ineffective Governor who caused the New Jersey economy to sour while he sat in his office counting all his money. Also, Corzine made the mistake of not appeasing the New Jersey Democratic Party. If he had chosen a popular party official as his running mate instead of Weinberg who was unpopular with the party, Corzine may have been able to boost turnout enough to offset Christie’s margins. A good person for running mate would be Richard Codey who was the New Jersey Senate President. He was active Governor in 2005 and he is extremely popular with New Jersey’s Democratic Party. He was even considered last August as a candidate to replace Corzine on the ballot. The turnout levels in Democratic counties was about 50%-60% of the 2008 Presidential election turnout while turnout in Republican counties was closer to 66%. Christie on his part excited the base because he portrayed himself as one of the voters on the Shore or in the high income suburbs. He also took independents by highlighting New Jersey’s poor economy. The main reason though is that Christie swept the high income voters who trended towards the Democrats in the 1990’s because the Republicans were too socially Conservative. Now that the Republicans are downplaying their social Conservatism and highlighting the poor economy, they are able to win in the Northeast suburbs again. Democrats do not need to completely focus on the suburban voter, they just need to win enough of them to lower Republican margins. If Democrats want to start winning in New Jersey again, they have to excite the base while also reaching out to the white high income socially moderate but economically Conservative suburban voter.

By what margin will Bob Shamansky win?

View Results

Loading ... Loading ...

How Christie Won In New Jersey: Southern and Central New Jersey

The New Jersey Gubernatorial race’s polls appeared to resemble the polls in one of the Obama/Clinton primaries in 2008. In those primaries, Clinton led until about two weeks before the primary where Obama started kicking his volunteers into full gear. Then in the last few days (or the last second as in New Hampshire,) Clinton came from behind and won. The comparison does not include Clinton’s tactics or political beliefs; it just includes what the polls showed in the primaries. In early 2009, Chris Christie (R) was ahead of incumbent Governor Jon Corzine (D) and in the summer, Christe lead by ten points. I was not too worried until then because since 1997, Republicans have not won a statewide race in New Jersey. There is this saying that Republicans are Charlie Brown trying to kick the football from Lucy. Christie painted himself as a new voice and blamed Corzine for the economic recession. Corzine highlighted his experience on Wall Street and pointed out how Christie had no plan to fix the economy (Christie, releasing the same economic plan twice does not mean you have two economic plans.) Then in September, the race became very narrow. Independent Chris Daggett began to take independents on the Jersey Shore and Republican suburbs around Somerset and Morris Counties. Corzine, the former CEO of Goldman Sachs began running ads with his gigantic war chest and overall spent around $23 million, about 12 million more than Christie. These two factors heavily contributed to Christie’s slip in the polls but Daggett was the more prominent factor. He had numbers in the teens throughout October while Christie and Corzine hovered around 40%. This pattern remained until the last few days until Election Day on November 3rd. Many Daggett supporters realized that Daggett could not win so they began drifting towards Christie. This explains the final result where Christie beat Corzine and his running mate Loretta Weinberg from Bergen County 49%-45% with Daggett winning most of the remaining 6%.

It looks like Charlie Brown finally kicked the football. Corzine also learned that running ads criticizing your opponent’s weight does NOT gain voters. On average, Corzine won 12 points less than Obama and the margin between 2008 and 2009 shifted towards the Republicans by 19 points. Corzine did not lose much ground among minority voters but Obama performed much better among independent white voters. Yes, the main reason Corzine lost was that Daggett’s poll numbers fell down the drain. In this post though, I will explain how Christie won by analyzing each county in Southern and Central New Jersey. In an earlier post, I wrote about what to watch in New Jersey during election night. Besides analyzing the gubernatorial race results, I will also compare to my last post. As in the last post, the geographical designations are in the same places. Okay, here are the links: http://uselectionatlas.org/RES…

for election results in 2008. Once you click the link, go to the icon choose another office, select gubernatorial races, select a year and you should find yourself a map. Yes, the maps here have red for Democrats and blue for Republicans.

http://quickfacts.census.gov/q…

this is for New Jersey’s demographic data. Click on a county and you will find the data for each county.

Southern New Jersey

In my last post, I said that even Corzine wins, he should still lose Southern New Jersey. Corzine lost and he definitely lost Southern New Jersey. Camden County is the most urban county in Southern New Jersey and Obama won 67% of the vote there in 2008. I said that Corzine needed to win by at least 15 points to win. Corzine barely missed, winning by 14 points. This explains that Christie was able to win white middle class independents but Christie lost Camden County because of heavily Democratic Camden City and its close suburbs. In my last post, I said that if Corzine won Gloucester County, he was successful with winning white voters in Camden County. Christie won Gloucester County by three points so Christie’s success among the Camden County suburban voter was widespread. Gloucester County has the same demographics as Camden County without the inner city. I found heavily white and rural Salem County’s result unexpected. Christie won by six points and since the county narrowly voted for Obama, I would have expected a larger Christie win. The answer to this question could be that Daggett peeled away enough Christie voters to narrow the margin. Daggett won 10% of the vote in Salem.

Another interesting result is Cape May County where Obama won 45% of the vote but Corzine won 38%, higher than counties with similar counties on the Jersey Shore. This could be because Kim Guadango, Christie’s running mate helped him in Monmouth and Ocean Counties further north but not at Cape May. Corzine won Cumberland County 50%-42% winning ten points less than Obama. I expected a smaller drop here due to large numbers of minority voters. As always, Atlantic County was the complete bellwether in the race as it was in 2000, 2004, 2005 and 2008. Christie won 49% of the vote and only 0.05% less than his statewide average, 48.75%. Atlantic County’s population is 61% White, one point less than New Jersey’s 62% White population. Atlantic County culturally may be closer to Las Vegas on the beach than the rest of New Jersey but Atlantic County has a close proportion to the rest of New Jersey of urban, suburban and rural areas. Ocean County just to Atlantic County’s north voted for Christie by 38 points and the increase over McCain’s margin in 2008 was only a bit above the average increase. The important point is the turnout which is about 2/3 the level of 2008, showing that Christie was able to turn out the base. Another important county was Burlington County which usually votes 1-2 points more Democratic than New Jersey and has similar demographics to Camden County. Christie won Burlington County by two points showing his narrow margin among the demographic of southwestern New Jersey white voters. Overall, Southern New Jersey voted similar to what I expected.

Central New Jersey:

Christie received large margins here, losing only one county. Christie lost Mercer County which contains heavily Democratic Trenton by only 16 points, 19 points less than Obama. Most of the voting was polarized with Christie gaining more than average over McCain while Christie gained less in heavily Democratic areas. Mercer County was a different story because even though it was a base county, the base did not turn out and Christie made inroads among the white voters here. In Monmouth County on the Shore, Christie’s running Kim Guadango who is from Monmouth County definitely helped him there. Obama lost Monmouth County by three points even though it is an upper class county that is 77% White. Christie won by 31 points, improving over McCain’s margin by 28 points. The large increase is probably due to not only Guadango but also that Daggett was unable to garner enough votes. He won only 6% of the vote and I expected the Shore would be a strong area for Daggett. If Daggett stayed strong and won somewhere around 15% of the vote, he probably would have reduced Christie 64,000 vote margin in Monmouth County by about 15,000. Another reason for Monmouth County’s strong Christie result is that the New York suburban white voter is trending towards the Republicans. As long as the Republicans stay away from cultural issues, they can start winning these voters again. If Democrats want to keep these voters, they need to highlight how they will keep your job or create one for you.

Moving onto Hunterdon County, Christie won there by 40 points, 27 points higher than McCain’s 13 point margin. Hunterdon County has wealthy independents and the large shift towards Christie is probably because Obama over performed with wealthy independents and they are reverting back to their normal voting patterns. Also, many of the wealthy voters may have trusted Wall Street so were angry that a former Wall Street corporate executive could not fix their economy. Somerset County is less Republican but contains many of the same voters as Hunterdon County. When I saw the Middlesex County result, I was pretty shocked. Obama won there by 22 points but Christie won by three. Middlesex County was not extremely white; its population was 53% White. Most of the minorities were Hispanic or Asians but Christie did not appear to make inroads among those groups. My explanation would be that Corzine failed to turn out the base and Christie did extremely well with white independents. Northwestern Middlesex County is close to his home, Mendham so Christie’s close proximity probably helped him.

Overall in Southern and Central New Jersey, Christie and Guandango’s homes helped them win voters while sweeping independents and preventing Corzine from turning out his base.

My next post, this time analyzing Urban and Northern New Jersey should be up in about a week.

Oh one more thing: check out http://frogandturtle.blogspot…. for more political analysis.  

By what margin will Bob Shamansky win?

View Results

Loading ... Loading ...

How Christie Won In New Jersey: Southern and Central New Jersey

The New Jersey Gubernatorial race’s polls appeared to resemble the polls in one of the Obama/Clinton primaries in 2008. In those primaries, Clinton led until about two weeks before the primary where Obama started kicking his volunteers into full gear. Then in the last few days (or the last second as in New Hampshire,) Clinton came from behind and won. The comparison does not include Clinton’s tactics or political beliefs; it just includes what the polls showed in the primaries. In early 2009, Chris Christie (R) was ahead of incumbent Governor Jon Corzine (D) and in the summer, Christe lead by ten points. I was not too worried until then because since 1997, Republicans have not won a statewide race in New Jersey. There is this saying that Republicans are Charlie Brown trying to kick the football from Lucy. Christie painted himself as a new voice and blamed Corzine for the economic recession. Corzine highlighted his experience on Wall Street and pointed out how Christie had no plan to fix the economy (Christie, releasing the same economic plan twice does not mean you have two economic plans.) Then in September, the race became very narrow. Independent Chris Daggett began to take independents on the Jersey Shore and Republican suburbs around Somerset and Morris Counties. Corzine, the former CEO of Goldman Sachs began running ads with his gigantic war chest and overall spent around $23 million, about 12 million more than Christie. These two factors heavily contributed to Christie’s slip in the polls but Daggett was the more prominent factor. He had numbers in the teens throughout October while Christie and Corzine hovered around 40%. This pattern remained until the last few days until Election Day on November 3rd. Many Daggett supporters realized that Daggett could not win so they began drifting towards Christie. This explains the final result where Christie beat Corzine and his running mate Loretta Weinberg from Bergen County 49%-45% with Daggett winning most of the remaining 6%. It looks like Charlie Brown finally got what he wanted. Corzine also learned that running ads criticizing your opponent’s weight does NOT gain voters. On average, Corzine won 12 points less than Obama and the margin between 2008 and 2009 shifted towards the Republicans by 19 points. Corzine did not lose much ground among minority voters but Obama performed much better among independent white voters. Yes, the main reason Corzine lost was that Daggett’s poll numbers fell down the drain. In this post though, I will explain how Christie won by analyzing each county in Southern and Central New Jersey. In an earlier post, I wrote about what to watch in New Jersey during election night. Besides analyzing the gubernatorial race results, I will also compare to my last post. As in the last post, the geographical designations are in the same places. Okay, here are the links: http://uselectionatlas.org/RES…

for election results in 2008. Once you click the link, go to the icon choose another office, select gubernatorial races, select a year and you should find yourself a map. Yes, the maps here have red for Democrats and blue for Republicans.

http://quickfacts.census.gov/q…

this is for New Jersey’s demographic data. Click on a county and you will find the data for each county.

Southern New Jersey

In my last post, I said that even Corzine wins, he should still lose Southern New Jersey. Corzine lost and he definitely lost Southern New Jersey. Camden County is the most urban county in Southern New Jersey and Obama won 67% of the vote there in 2008. I said that Corzine needed to win by at least 15 points to win. Corzine barely missed, winning by 14 points. This explains that Christie was able to win white middle class independents but Christie lost Camden County because of heavily Democratic Camden City and its close suburbs. In my last post, I said that if Corzine won Gloucester County, he was successful with winning white voters in Camden County. Christie won Gloucester County by three points so Christie’s success among the Camden County suburban voter was widespread. Gloucester County has the same demographics as Camden County without the inner city. I found heavily white and rural Salem County’s result unexpected. Christie won by six points and since the county narrowly voted for Obama, I would have expected a larger Christie win. The answer to this question could be that Daggett peeled away enough Christie voters to narrow the margin. Daggett won 10% of the vote in Salem. Another interesting result is Cape May County where Obama won 45% of the vote but Corzine won 38%, higher than counties with similar counties on the Jersey Shore. This could be because Kim Guadango, Christie’s running mate helped him in Monmouth and Ocean Counties further north but not at Cape May. Corzine won Cumberland County 50%-42% winning ten points less than Obama. I expected a smaller drop here due to large numbers of minority voters. As always, Atlantic County was the complete bellwether in the race as it was in 2000, 2004, 2005 and 2008. Christie won 49% of the vote and only 0.05% less than his statewide average, 48.75%. Atlantic County’s population is 61% White, one point less than New Jersey’s 62% White population. Atlantic County culturally may be closer to Las Vegas on the beach than the rest of New Jersey but Atlantic County has a close proportion to the rest of New Jersey of urban, suburban and rural areas. Ocean County just to Atlantic County’s north voted for Christie by 38 points and the increase over McCain’s margin in 2008 was only a bit above the average increase. The important point is the turnout which is about 2/3 the level of 2008, showing that Christie was able to turn out the base. Another important county was Burlington County which usually votes 1-2 points more Democratic than New Jersey and has similar demographics to Camden County. Christie won Burlington County by two points showing his narrow margin among the demographic of southwestern New Jersey white voters. Overall, Southern New Jersey voted similar to what I expected.

Central New Jersey:

Christie received large margins here, losing only one county. Christie lost Mercer County which contains heavily Democratic Trenton by only 16 points, 19 points less than Obama. Most of the voting was polarized with Christie gaining more than average over McCain while Christie gained less in heavily Democratic areas. Mercer County was a different story because even though it was a base county, the base did not turn out and Christie made inroads among the white voters here. In Monmouth County on the Shore, Christie’s running Kim Guadango who is from Monmouth County definitely helped him there. Obama lost Monmouth County by three points even though it is an upper class county that is 77% White. Christie won by 31 points, improving over McCain’s margin by 28 points. The large increase is probably due to not only Guadango but also that Daggett was unable to garner enough votes. He won only 6% of the vote and I expected the Shore would be a strong area for Daggett. If Daggett stayed strong and won somewhere around 15% of the vote, he probably would have reduced Christie 64,000 vote margin in Monmouth County by about 15,000. Another reason for Monmouth County’s strong Christie result is that the New York suburban white voter is trending towards the Republicans. As long as the Republicans stay away from cultural issues, they can start winning these voters again. If Democrats want to keep these voters, they need to highlight how they will keep your job or create one for you. Moving onto Hunterdon County, Christie won there by 40 points, 27 points higher than McCain’s 13 point margin. Hunterdon County has wealthy independents and the large shift towards Christie is probably because Obama over performed with wealthy independents and they are reverting back to their normal voting patterns. Also, many of the wealthy voters may have trusted Wall Street so were angry that a former Wall Street corporate executive could not fix their economy. Somerset County is less Republican but contains many of the same voters as Hunterdon County. When I saw the Middlesex County result, I was pretty shocked. Obama won there by 22 points but Christie won by three. Middlesex County was not extremely white; its population was 53% White. Most of the minorities were Hispanic or Asians but Christie did not appear to make inroads among those groups. My explanation would be that Corzine failed to turn out the base and Christie did extremely well with white independents. Northwestern Middlesex County is close to his home, Mendham so Christie’s close proximity probably helped him.

Overall in Southern and Central New Jersey, Christie and Guandango’s homes helped them win voters while sweeping independents and preventing Corzine from turning out his base.

My next post, this time analyzing Urban and Northern New Jersey should be up in about a week.

Oh one more thing: check out http://frogandturtle.blogspot…. for more political analysis.  

By what margin will Bob Shamansky win?

View Results

Loading ... Loading ...

What to watch for in the New Jersey Gubernatorial Race on Election Night

This race has definitely been turning in every direction possible. In the beginning of 2009, Republican Chris Christie had a small lead. In the summer, Christie was leading easily and now, it looks like an extremely close race. I have seen a few suggestions that Corzine should win by two to three points. I actually have to agree with them. The main question I plan to address in this diary is what to watch for on election night. I am not planning to address campaign strategies; it will only be what you should watch in each county while the votes are reporting. A gubernatorial election is extremely different from a Presidential election. It does not matter if Corzine or Christie wins the swing counties, it matters who racks up the most votes. For example, if Corzine won all the swing counties, it could require only a shift of a few votes for Christie to win them. However, the swing counties determine how well Christe, Corzine and Independent Chris Daggett are doing in parts of New Jersey. During this diary, I will split New Jersey into four geographical areas. They are Southern New Jersey, Central New Jersey, Northern New Jersey and Urban New Jersey. The counties in Southern New Jersey are Burlington, Ocean Counties and all the counties south of them. The counties in Central NJ are Monmouth, Mercer, Hunterdon, Somerset and Middlesex. Urban New Jersey is Union, Essex and Hudson Counties. All the other counties are in Northern New Jersey.

Here is the link to 2008 Presidential election results in New Jersey. If you look around, you can find results for Corzine’s 2005 and 2000 runs. http://www.uselectionatlas.org…

This link has a map of New Jersey and if you click on the counties, you will see the demographics, income and population of each county. http://quickfacts.census.gov/q…

Southern New Jersey

This area leans Democratic in most elections. I believe that Christie should beat Corzine here for a few reasons: Corzine tends to do better than average in urban areas but below average in suburban areas. Southern New Jersey’s population is mostly suburban and rural except for Camden County which has 517,000 people. Southern New Jersey has more white voters and more independents than the rest of the state and Christie should do well with these groups. If Daggett grows stronger, southern New Jersey should be one of his strongholds. He goes to Ocean County every summer but then again, so does almost everyone in New Jersey. The beaches in the summer there are FULL. The only solid stronghold Corzine has here is Camden County which he won 60% of the vote in 2005 and Obama won 67% of the vote there in 2008. Theoretically, if Corzine wanted to win, he would have to win in Camden County by more than 21 points. He should make up lost ground in Northern NJ and Camden County is 63% White, just above the 62% White population of NJ. Therefore, I believe that Corzine needs to beat Christie in Camden by more than 15 points if Corzine wants to win. To do that, Corzine needs to maximize minority turnout but also win over middle class white voters in the Camden suburbs. Other counties in Southern Jersey are mostly swing counties except for Ocean County which is going solidly for Christie due to all the Conservative retirees there. Cape May County should also go the same way. Salem County is a small rural county which Obama barely won but Christie should win due to its working class voters. If Corzine were successful with white working class voters in Camden County, he would win Gloucester County which demographically is Camden County without the heavily Democratic city Camden and its close in suburbs. Cumberland County with Vineland is 53% White with large numbers of Hispanics and African Americans. Due to the large minority population, Christie should fail to win this county where Obama won 60% of the vote. If Christie wins Cumberland County, expect Christie to be moving to Trenton and Corzine moving back to Hoboken. Burlington County which gave Obama 59% of the vote seems to be one of the three big bellwethers. Even though it voted 2 points more for Obama than the rest of the state, the population is 72% White. Most of the white voters are the working class voters Corzine needs to win over along the Pennsylvania border from Salem County to Trenton. The other bellwether county is Atlantic County. In one sense, it is completely different from most of New Jersey. It represents beach communities while New Jersey has some nice beaches New Jersey is basically a suburb, not a beach resort nor is it Las Vegas. Obama won 57% of the vote here, Corzine in 2000 won 50%, in 2005 Corzine won 53%. These percentages are also the percentages of the respective candidates’ statewide wins. Demographically, Atlantic County is like the rest of New Jersey. The population is 62% White, the same as New Jersey. Also, there is a correct balance between urban and suburban. Atlantic County has Atlantic City as the urban area, some suburban mainland communities and some rural areas in the Pine Barrens. This relates to New Jersey as a whole because there are urban areas in Essex and Hudson Counties with suburban counties further out and a few rural areas. Since Christie appears more popular on the shore, I could see him winning Atlantic County by one or even two points but still losing. This is why I believe that if Corzine wins Atlantic County, he wins the Governorship.

Central New Jersey

I will start with Mercer County where Trenton, New Jersey’s capital is located. With heavily African American Trenton and Princeton University, Christie has absolutely no chance winning in Mercer County. John McCain even failed to win a single municipality in Mercer County which explains why he won only 31% of the vote here. There are some working class voters here but not as many as the other Delaware River counties. Corzine’s percentage should drop below Obama’s because Corzine will not get Obama’s boost of African American and University turnout even though Obama’s recent visit may help a bit. To hold down Christie, Corzine needs to beat him here 3:2 and if Corzine can do that, this shows he was able to bring Democrats out to the polls. Monmouth County along the shore is 77% White with a mix of Conservatives and middle class voters should be an easy win for Christie and his Lieutenant Governor candidate Kim Guadango who lives there.  Daggett could over perform so if he gets more than 20% of the vote here, expect Christie to be in trouble. Hunterdon County is a high income Conservative area where Christie needs to slow down Daggett’s advances. Somerset County should be watched carefully. It has high income voters and Bill Clinton in 1992 and 1996 lost the county. Somerset County definitely has been trending Democratic with Obama winning 52% of the vote and Somerset County barely trended toward Bush from 2000 to 2004, even with 9/11. Corzine’s success as a businessman may appeal to the high income voters but Christie’s close proximity in western Union County and the independent streak of the voters should give Somerset County to Christie. Daggett has a chance to over perform here among all the independents so if Christie can carry Somerset County by more than 15 points, he definitely has won. Christie can still win with a few less votes here. Middlesex County is 53% White. It does not have a significantly high African American or even Hispanic population, Middlesex County is 19% Asian. Middlesex County is not the most important county in New Jersey but Corzine should try to keep his margin at about 10 points.

Urban New Jersey

There is a fair argument for including Passaic and Bergen Counties but most of those counties are suburban. Hudson, Essex and Union County are all expected to go for Corzine and Daggett should win few votes in these areas because independents are less abundant here. Also, an important group here is Hispanics who are 41% of the population in Hudson County. Corzine has not cracked down harder on immigrants but he has not pushed to help them. Christie however does not address immigration directly on his website. Corzine does not either but he does address diversity, has worked to improve health care for minorities and he started a panel that discussed immigration reform. Since Christie and Daggett represent the more Conservative suburban voters, I do not see Christie and Daggett making inroads in Hudson County. Corzine lives in Hoboken which is a really nice Liberal town filled with transplants from Manhattan. Corzine has always over performed in Hudson County, winning 75% of the vote there in 2005 in his successful gubernatorial race against Republican Douglas Forrester. Corzine won 53% of the vote, like John Kerry but Kerry won 67% of the vote in Hudson County, much worse than Corzine. Another county to watch is Essex County which contains Newark and is heavily Democratic. Christie should make few inroads there due to its large minority population. Corzine would at least need to receive about 60% of the vote there if he wants to win. Union County is probably the most crucial county in Urban New Jersey. It is basically Essex County in the east and Somerset County in the west. Even though it is Christie’s home county, Corzine should still win it due to margins in Elizabeth. If Christie can pull it close in his home area, it shows he is winning overall. This is why Christie needs to hold Corzine below a 10 point win in Union County.

Northern New Jersey

Except for Passaic County and possibly Bergen County, Christie looks set to sweep this area. Warren and Sussex Counties are both heavily Republican and lightly populated so Christie should have no trouble winning them. Morris County also looks like a set Christie win because Morris County is traditionally Republican and McCain won 54% of the vote there. The issue for Christie in Morris County is that Daggett should be able to garner votes there. During the election, I expect Christie’s and McCain’s percentages to remain similar and if Christe beats Corzine by more than 20 points, Christie’s percentage in Morris County should be near McCain’s. If Christie wins Morris County by less than 20 points, it will show Daggett made inroads or Corzine over performed so Christie needs to win by more than 20 points. Passaic County is the only county in northern New Jersey that Corzine looks set to win. If Corzine does not win Passaic County, it will demonstrate he failed to increase turnout in the central cities and therefore he will lose. I believe if he is reelected, he will have won Passaic County by six points or more. In 2000, Corzine won Passaic County by eight points and won the Senate seat by three. Passaic County includes heavily Hispanic Paterson but also some Republican suburbs which are outnumbered by Democratic areas. The real county to watch is Bergen County. Obama won 54% of the vote, 3 points less than his 57% statewide win. Corzine lost the county by three points in 2000. The White population is above average for New Jersey. On paper, it appears that Corzine can lose Bergen County but still beat Christie. I would agree except the Lieutenant Gubernatorial candidate is Loretta Weinberg who is from Bergen County. Weinberg is 74 years old but neither Christie nor Daggett has made her age an issue. She represents that 37th Legislative district which is mostly in southeastern Bergen County, a Democratic area. Someone running for Lieutenant Governor should not have the biggest influence on the voters but Weinberg has been in Bergen County politics since Gerald Ford was president. She was elected in 1975 to countywide office and has remained in Bergen County politics since. Her problem is that party bosses are not crazy about her but that should not impact Bergen County as much as other counties. If Weinberg had a large effect on the campaign, Corzine could win Bergen County and still lose to Christie but if Weinberg’s effect was minimal, Corzine could lose Bergen County but still beat Christie.

Here are the last words: If you look at the final map and see Corzine won a line of counties stretching from Bergen to Cumberland, Corzine has won. Also, ask yourself; is Christie pulling up large margins along the shore, is there large turnout in Urban New Jersey, which way is Union County swinging, who is leading in Bergen County and how large is Corzine’s margin in Camden?

By what margin will Bob Shamansky win?

View Results

Loading ... Loading ...

Alabama Redistricting 4-3 Republican

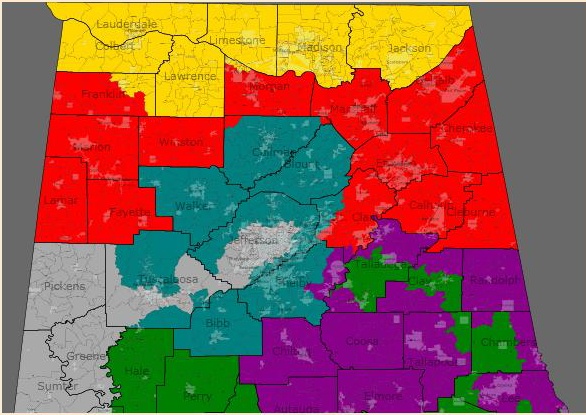
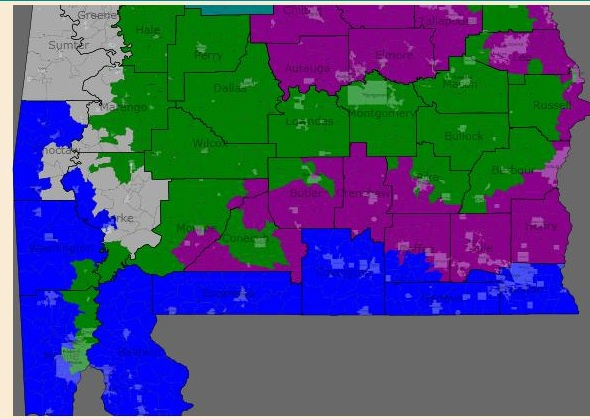
Here is a bipartisan redistricting of Alabama with a slight Democratic lean. My goal was to keep the representation at 4-3 Republican. I know Bobby Bright is a Conservative blue dog so I gave him a heavily Black district. This should make his voting record more Liberal or a Black candidate could easily challenge him in a primary and win. At the same time, I kept Artur Davis’s district majority Black to protect his sucessor if he vacates his seat to run against Richard Shelby. I thought a 4-3 Democratic map would be too risky and too grotesquely gerrymandered. As for the four Republicans, they are all safer than they used to be, including Mike Rogers. I had to make some sacrifices but I thought it would be better if we had 2 solid seats and 1 shaky one instead of just one solid seat and two shaky ones. I still was unable to strengthen Griffith because I could not go Cleo Fields and send a finger down to the Black belt. Still, I could not avoid an extremely grotesque gerrymander but there have been worse. Here are the maps:

Northern Alabama

Southern Alabama

This link is for the current map of Alabama http://en.wikipedia.org/wiki/F…

1st District Jo Banner (R) Blue

Yes, this district grows more convoluted. I added Covington, Geneva counties and Houston Counties to the east which are heavily Republican. I removed Monroe County which leans Republican but has some Democratic areas. The main change to this district was sending a finger from Bobby Bright’s district down to Mobile to take in Black precincts. I kept in Republican parts of Mobile so I probably kept Banner’s home in here. I kept his district contiguous by water with Mobile Bay. The courts may object to this district but since it gets more Republican, Banner should be happy. McCain probably won 70% of the vote here, up from 61% in the old district. Demographics are 16% Black and 77% White. Status is Safe Republican.

2nd District Bobby Bright (D) Green

He keeps his Montgomery County home base but besides that, his district completely changes. I removed heavily Republican southeastern Alabama from his district. I replaced it with all of Montgomery County and some Democratic counties currently in the 3rd such as Macon and the 7th such as Dallas. Yes, this district is the culprit of the Mobile County finger. I sent up the finger to Talladega to stregthen the 2nd and 3rd districts for their respective parties. Overall, I wanted to knock down two birds with one stone in this district. Not only would there be another Black majority district in Alabama that was heavily Democratic, Bobby Bright will have a tough time holding onto the seat if a Black candidate challenges him in the primary. Unless Steve Cohen from Memphis decided to move here and run, Bright should probably lose. A possible candidate would be the Liberal Black mayor of Mobile, Sam Jones. He is pretty old but he was also the first Black mayor of Mobile. Overall, this district looks set to change. Obama probably won 67% of the vote here. Demographics are 57% Black and 38% White. Status is Safe Democrat.

3rd District Mike Rogers (R) Purple

To protect the 2nd district, I had to stregthen Rogers because it was impossible to make the 2nd district safe and keep the 3rd vulnerable. Rogers won only 53% of the vote in 2008 against Democrat Joshua Segall so Rogers should be thrilled with the new plan. I made some drastic changes to protect him by removing heavily Democratic Montgomery, Macon and part of Russel Counties. I added heavily Republican counties to the south of the old district. As a bonus, I removed Segall’s home in Montgomery into the 2nd so Rogers now has no strong challenger. Just to shake Rogers up, I removed his home and put it in the 4th district. Overall, I reduced the Black percentage from 33% to 22%, so McCain win to probably 66% of the vote here. Demographics are 22% Black and 72% White. Status is Safe Republican.

4th District Rodney Aderholt (R) Red

I made some minor changes to the district but McCain still crushed Obama here. I removed Cullman and Blount Counties, both areas where residents of Birmingham are moving. More than 70% of the old district’s residents lived in rural areas and more do now. I added Calhoun and Clerburne Counties, both rural and heavily Republican. Those counties explain the makeup of the entire district. McCain probably won 73% of the vote here, a bit lower than the current percentage but not much different. Demographics are 8% Black and 85% White. Status is Safe Democrat.

5th District Parker Griffith (D) Yellow

This was the district that is closest to its current form. I could not move it at all because this was the safest district I could make for Griffith. I hope we can keep him and if he survives 2010, he probably will keep winning. The problem is that in 2008 when he was elected, there was high Black turnout. In 2010, it should be normal unless Artur Davis runs for U.S Senate. Since Blacks are only 17% of the district’s population, they do not make a big impact. I want most blue dogs to become Liberals but Griffith should remain as Conservative as he wants, he is another vote for a Democratic speaker. McCain probably won 61% of the vote here. Demographics are 17% Black and 74% White. Status is Lean Democrat.

6th District Spencer Baucus (R) Teal

On the most part, I was able to leave Baucus alone. His old district was the most Republican district in the U.S in 2008 and should be even more so. I removed Chilton and Coosa Counties which are Republican but not as Republican as Cullman and Blount Counties which I put into the district. I pushed this district further out of slow growing Jefferson County so overall, I reduced the Black percentage from 11% to 8%. McCain probably won 80% of the vote here. Demographics are 8% Black and 85% White. Status is Safe Republican.

7th District Artur Davis (D) Gray

Davis is currently the only Black member of Congress in Alabama. He may no longer be if he gets the nomination to become Governor in 2010. I feel that no one has viewed Davis as a formidable candidate. He might appeal to some white voters because he is pretty Conservative on a few issues. He could be the Harold Ford of Alabama without the corrupt family background. In Tennessee, Ford lost to moderate (for the South) Republican Bob Corker. Shelby is a Conservative and a turncoat which he probably could not use to his advantage. If Davis can bring Black turnout up to 30%, he would have to win about 30% of the white vote to win. In Alabama, this appears hard to do but Davis has a shot. Back to the district, I barely kept the 7th district majority Black because I had to trade some areas such as Hale County with the 2nd and I took in more of Jefferson County for population purposes. Even with the reduced Obama percentage, I expect Davis or his replacement to win. Obama probably won 59% of the vote here. Demographics are 51% Black and 44% White. Status is Safe/Likely Democrat.

By what margin will Bob Shamansky win?

View Results

Loading ... Loading ...

Redistricting Virginia 7-4 Democrats

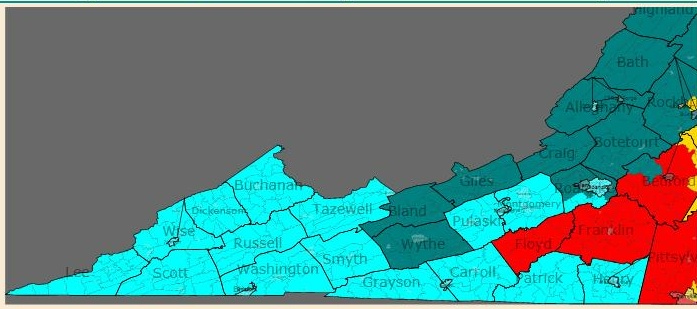
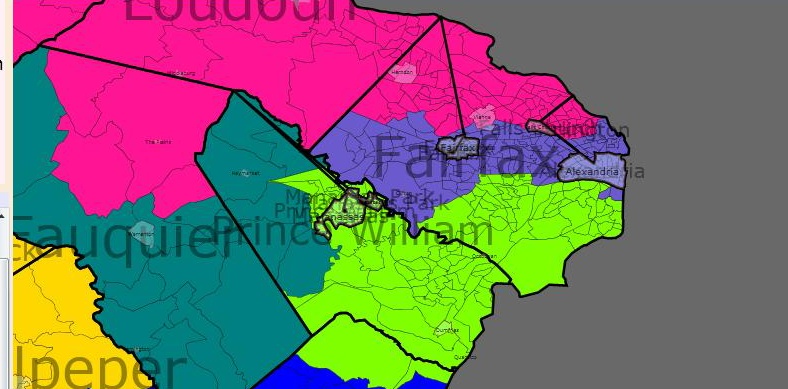
I know this is not very realistic but I decided to go for a 7-4 Democratic plan. Democrats should control at least the State House but it would unlikely if they had total control of everything. Most Republicans would probably like most of the plan except that I weaken Frank Wolf from the 10th district. He claims to be a moderate but he is actually a Conservative. My other main priority was to strengthen all the Democratic incumbents. On a different note, this is the first time in awhile I have asked you which state I should do next. Here are the maps:

Virginia State Map

Western (not west) Virginia

Northern Virginia

Hampton Roads

Here is a link to the current Congressional map of Virginia: http://www.nationalatlas.gov/a…

1st District (Blue) Robert Whitman (R)

Even if Republicans do not like the plan, they should be happy about this district. I removed all of Prince William County which is trending Democratic quickly. I also removed the slivers of Hampton and Newport News because Obama easily won those two areas. I also removed Caroline, Essex and King and Queen Counties because Obama barely won those counties and I wanted to put them in the 5th district. The new counties in the district were Hanover (which McCain won by 19,000 votes,) Orange and New Kent. The latter two are Republican. Even though the district looks rural, it is mostly concentrated on fast growing Republican suburbs. Stafford and Spotsylvania counties might be marginal in the 2012 presidential election as minorities and voters from D.C move there. Whitman should be safe here in a district where McCain probably won 56% of the vote, up from 51% under the old plan. The demographics are 15% Black (down from 18%) and 76% White. Status is Safe Republican.

2nd District Glenn Nye (D) Green

Nye barely won and Obama barely won the old district too. Even though Nye is a blue dog, a strong Republican could easily unseat him, especially in a year like 2010. So I added all of Hampton and Newport News to the district. Those two cities voted for Obama by a combined 51,000 votes. I may have overprotected Nye by creating a grotesque gerrymander including Black neighborhoods in Virginia Beach and White neighborhoods in Norfolk. The parts of Norfolk I included may not be heavily Democratic. I did at least remove Republican parts of Virginia Beach. Anyway, the district becomes heavily Democratic while the 3rd district is still majority Black. The only problem is that 3rd district Congressman Bobby Scott’s home is in the district. Since the 3rd contains most of his old territory, he could just run there and be safe. Obama probably won 61% of the vote here. The demographics are 34% Black, 5% Hispanic and 54% White. Status is Safe Democrat.

3rd District Bobby Scott (D) Purple

The district changes a bit and no longer jumps over the river. It loses all of Hampton and Newport News while scooping up every Black precinct on the southern bank of the James River. Most of the new precincts are from the current 4th district. Also, the 3rd drops Republican New Kent County while extending an arm into Hopewell which leans Democratic and Petersburg where Obama won 89% of the vote. Besides these changes, I added a few more precincts in Richmond City and Henrico County. I also added some in Chesterfield County which had high Black turnout but McCain still won it. Basically, all the new additions came in here so I could strengthen the 4th district. With these small changes, Scott should be safe. Obama probably won 75% of the vote here. Demographics are 55% Black and 36% White. Status is Safe Democrat.

4th District Randy Forbes (R) Red

I mentioned this map would be a gerrymander. I definitely made this district convoluted even though it is nothing compared to (you can probably figure that out.) Still, I kept in most of Chesapeake where Forbes lives. Since the 3rd district and the 5th took away all the heavily Black precincts, I sent this district west to take away Republican areas in the 5th and 9th districts. The district has a long string along the Virginia/North Carolina border to a clump of Republican counties formerly in the 5th and 9th districts. I see no reason for Forbes to complain unless he wanted a more compact district. Since I reduced the Black population from 33% to 20%, Forbes should be safe. McCain probably won 59% of the vote here. Demographics are 20% Black and 72% White. Status is Safe Republican.

5th District Tom Perrillio (D) Yellow

First, I am sorry about this extremely convoluted gerrymander that should not be on this map. I do not see Republicans objecting to it because it helps shore up possibly endangered incumbents such as Whitman, Forbes and Cantor. The district’s new changes include a finger into the old 1st district to take some Democratic areas. The district then goes toward Richmond. The last major change was extending the district up to Rappahannock County which is 83% White but Democratic Senator Jim Webb still carried it in 2006. What is amazing is that Black percentage remains stagnant. The areas the district picks up such as Harrisonburg in the Shenandoah Valley are filled with white Democrats. Perrillio should face a major challenge in 2010 but if he survives, this plan will protect him. Obama probably won 54% of the vote here. Demographics are 23% Black and 69% White. Status is Likely Democrat.

6th District Bob Goodlatte (R) Teal

This district stays mostly the same in area. Goodlatte keeps the Shenandoah Valley and loses Democratic areas in it such as Harrisonburg and part of Roanoke. Just to shake him up, I took his home out but since this district contains most of his old territory, he would probably pick it. I gave him some Republican counties in the current 9th district. The biggest change I made was moving this district closer to D.C. I gave him most of Fauquier County which used to be in the 1st district. I even gave him a slice of Prince William County. D.C politicians might complain but Goodlatte will not. The area I gave him is pretty Republican. The only problem I see for him is that Deeds might take a run at this district if he loses the gubernatorial election. The 6th district contains most of his old State Senate district. He could run it close but would probably lose by about ten points because I do not see Republicans in the northern part of the district backing Deeds. I will give Deeds a better chance if he performs extremely well in rural areas during the gubernatorial election. In other cases, Goodlatte should be safe. McCain probably won 62% of the vote here. Demographics are 5% Black and 89% White, the whitest district in Virginia. Status is Likely Republican if Deeds runs, Safe Republican if Deeds does not.

7th district Eric Cantor (R) Gray

Unlike Goodlatte, Cantor keeps his home in his district but the rest of his territory is switched. I split his old territory with the 1st and 5th districts. Most of his new territory was Republican parts of the 4th and the 5th. The reason I took Republican areas away from the 4th was for population purposes. I know this is gerrymandered but as long as he has a safe district, Republicans and Cantor should not complain. McCain probably won 55% of the vote here. Demographics are 17% Black and 74% White. Status is Safe Republican.

8th District Jim Moran (D) Purple (in the north)

I kept most of Arlington and all of Alexandria in the district. The main changes I made were taking out the thin corridor that heads to Reston in northwestern Fairfax County. I sent Moran’s district to western Fairfax County to take in some territory that is mixed. Obama probably pulled even in the western part but Arlington and Alexandria should save Moran from any trouble. The close in suburbs should help make this district heavily Democratic. Obama probably won 65% of the vote here. Demographics are 10% Black, 16% Hispanic, 14% Asian and 55% White. Status is Safe Democrat.

9th District Rick Boucher (D) Light Blue

This district mostly remained unchanged after most redistricting. I decided to change that. I put some heavily Republican counties into the 6th district. The only spot of worry is that I slipped in Roanoke which votes Democratic but Goodlatte lives there. Again, I am assuming Goodlatte would not want to risk a run against Boucher when Goodlatte could easily win the 6th. The Republicans may field someone else but that candidate would have a poor chance of beating Boucher. McCain probably won 56% of the vote here, down from 59% in the old district. Demographics are 8% Black and 86% White. Status is Safe/Likely Democrat.

10th District Frank Wolf (R) Pink

His district is 69% White so it appears unchanged at a first glance from its current form. Wolf’s problem is that many of those white voters are Liberals. His old district contained many white voters from the Conservative Shenandoah Valley. I will admit I did not give him much new territory. I did, however take out all of the Shenandoah Valley. The only Conservative areas are Clarke County and part of Fauquier County. I kept most of his old territory in the district with all of Loudon County and northern Fairfax County. He is probably entrenched there. Still, he should lose because I added Vienna, Reston, Falls Church and about half of Arlington. Those areas combined probably gave Obama a combined 40,000 vote margin. Also knowing that Wolf’s old territory he keeps voted for Obama, Wolf is in trouble. Brian Moran, Jim Moran’s brother might run here as a comeback after his failed Gubernatorial primary run earlier this year. With his brother’s support, Brian Moran would crush Wolf in Fairfax County and that should offset anything from Loudon County. Obama probably won 58% of the vote here. Demographics are 6% Black, 10% Hispanic, 12% Asian and 69% White. Status is Likely/Lean Democrat, depending on the challengers.

11th District Gerry Connelly (D) Light Green

This district shrank in size like the 10th due to large population gains. I sent this district to the Alexandria border and kept it out of the Republican western Prince William County. I also added Manassas and the surrounding area which Obama won. I cut out central Fairfax County due to population constraints. Another change was adding Democratic parts of Stafford County which Obama may turn blue in 2012. Overall, this district now easily protects Connelly. Obama probably won 60% of the vote here. Demographics are 17% Black, 17% Hispanic, 9% Asian and 52% White. Status is Safe Democrat.  

By what margin will Bob Shamansky win?

View Results

Loading ... Loading ...

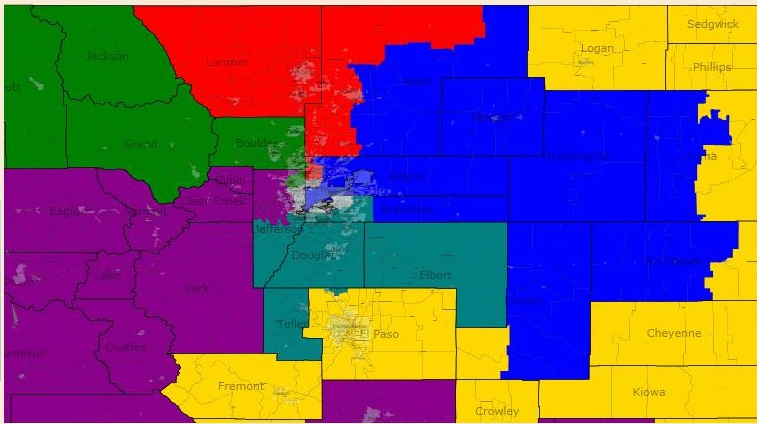
Colorado Redistricting

I am worried about the Colorado Governorship but the Democrats should still control one part of the State Legislature. They have large majorities in both houses. This calls for an incumbent protection plan even though I already expect one because the Democrats want to protect Betsy Markey and John Salazar. Salazar seems pretty safe but I decided to protect him anyway because eventually, the Republicans will find a strong challenger. The two other Republicans should have no problems under this plan. Here are the maps:

Northwest Colorado

Northeast Colorado

Southeast Colorado

Southwest Colorado

District 1 Diana De Gette (D) Blue

This district resembles Betsy Markey’s current district a bit because I extended it out into the heavily Republican prairie. Even though these counties are heavily Republican, they have barely any people. Since Denver is so Democratic, Republicans have no chance at this district. To satisfy minority politicians, this district is also minority majority. Obama probably won 69% of the vote here. Demographics are 8% Black, 38% Hispanic and 48% White. Status is Safe Democrat.

District 2 Jared Polis (D) Green

Okay, I did not make everyone stronger. I sent Polis’s district out to the Utah border to include Mesa County (Grand Junction) which McCain won by 20,000 votes. Polis should not worry because Boulder County (Boulder) went for Obama by 80,000 votes. Excluding the slice of Jefferson and Adams Counties, the vote results for the new 2nd district were Obama 174,567 and McCain 116,890. I estimate Obama won about 56% of the vote in the Jefferson and Adams County portions so Obama probably won 59% of the vote in the district.  Polis is a Boulder Liberal and the district should be Democratic enough to protect him. Demographics are 13% Hispanic and 81% White. Status is Safe Democrat.

District 3 John Salazar (D) Purple

I removed Grand Junction and nearby Republican counties in return for more ski resort counties in the Rocky Mountains like Eagle County. The Jefferson County part I added should not interrupt the district because it only has about 14% of the district’s population. Overall, Obama probably won 55% of the vote here. Salazar won here easily but now, I am sure he will win reelection here until he retires. Demographics are 22% Hispanic and 72% White. Status is Safe Democrat.

District 4 Betsy Markey (D) Red

Obama barely lost the old district because it had most of the heavily Republican counties to the east. I took those out and exchanged them with some Democratic territory in Adams County. The 4th district still has Republican Weld County but its votes should be offset by Adams County. Obama probably won 53-54% of the vote here, enough to protect Freshman Betsy Markey. Demographics are 19% Hispanic and 75% White. Status is Safe/Likely Democrat.

District 5 Doug Lamborn (R) Yellow

This district was already heavily Republican, even though Obama did much better here than Kerry. Those eastern counties needed to get into a district so I chose this one. Since it retains its base at Colorado Springs, Lamborn should be here indefinitely. McCain probably won 61% of the vote here. Demographics are 5% Black and 14% Hispanic. Status is Safe Republican.

District 6 Mike Coffman (R) Teal

Coffman gets a boost too under the new map. He loses small portions of Arapahoe and Jefferson Counties which lean Democratic. Since Douglas County is the fastest growing county in Colorado, the 6th district does not need much new territory to balance population. I also added heavily Republican Teller County. Overall, the district becomes more Republican. In the later part of the 2010’s, the district might become shaky as more Democrats move into the suburbs. For now, Coffman is safe unless he faces an extremely hard challenge. McCain probably won 55% of the vote. Status is Safe/Likely Republican.

District 7 Ed Perlmutter (D) Gray

I kept the district mostly the way it was. The changes I made were taking out Republican parts of Adams County, a bit of Jefferson and I added a touch of Denver. These changes should make the district even more Democratic, ensuring Perlmutter’s safety. I decided it was too risky to try to swap some territory with the 6th district to weaken Coffman. It would not be worth it because there will be Republican years. The Democratic incumbents need to be as safe as possible. Obama probably won 62% of the vote here. Demographics are 7% Black, 23% Hispanic and 62% White. Status is Safe Democrat.  

By what margin will Bob Shamansky win?

View Results

Loading ... Loading ...

Maryland Redistricting, 8-0 Democrats

Recently, I saw quite a few redistricting maps, especially on Maryland. Here is my perspective. Instead of playing it safe, I went all out for an 8-0 map. The Democrats are in control and may try for a map like this. I know what you are thinking; it will be too difficult for Democrats to hold. I feel that I definitely made each Democrat’s district safe enough for them without throwing the VRA down the drain. The Democrats have large majorities in the State Legislature and if they retain the Governorship, this map is realistic. Enough chatter, here are the maps.

Central/eastern Maryland

West Maryland

Balitmore Area

District 1 Frank Kratovli (D) Blue

This district did go to the western shore to pick up population. Yet it picked up heavily Republican areas to keep out of the 2nd and 3rd districts. Now that Maryland is trending Democratic, adding Republican areas to other districts will be offset by Democratic margins. This left me free to slip in Democratic Annapolis into Kratovli’s district as well as a hunk of Prince George’s County. These changes raised the Black percentage from 11% to 24%. If a Republican could not win in a district that is 11% Black, watch him or her try to win in a district with Prince George’s County. Obama probably won 54% of the vote here. Demographics are 24% Black and 67% White. Status is Likely Democrat.

District 2 Dutch Ruppersburger (D) Green

His district is less gerrymandered but should be safe. I added some Republican areas of Baltimore and Harford Counties but I slipped in more of Baltimore City. These changes should make the district a little more Republican. Ruppersburger is a popular representative and should handle himself. Obama probably won 53%-54% of the vote here. Demographics are 22% Black and 69% White. Status is Safe/Likely Democrat.

District 3 John Sarbanes (D) Reddish Purple

Okay, I see the flaws. Yes, I know I took Sarbanes’s home out of the district. I had to because the district would be too convoluted if I kept it. I also know that Carroll County is heavily Republican. I included Democratic territory in Howard County which should offset Republican margins in Carroll County and more. For any more Republican areas, Baltimore City should offset their margins. Bartlett is Sarbanes is the son of longtime former Senator Paul Sarbanes (D). I do not see Sarbanes losing here anytime soon. Obama probably won 56% of the vote here. Demographics are 23% Black, 5% Asian and 65% White. Status is Safe/Likely Democrat.

District 4 Donna Edwards (D) Red

Her district extends into Republican Frederick County but Edwards should be content. The 4th district is VRA protected. Obama probably won 73% of the vote here. Demographics are 50% Black, 5% Asian, 9% Hispanic and 33% White. Status is Safe Democrat.

District 5 Steny Hoyer (D) Yellow

I took out northeastern Prince George’s County and pushed the district into Republican parts of Anne Arundel County. I only reduced the Black percentage by 1% and should probably get higher in the mid 2010’s because of Blacks moving into Prince George and Charles counties. Hoyer and is successor are safe. Obama probably won 60% of the vote here. Demographics are 29% Black and 62% White. Status is Safe Democrat.

District 6 Vacant Teal

No current representative lives here. Even though I put in some heavily Republican counties in western Maryland, I more than erased that margin by 60% of this district in heavily Democratic Montgomery County. I slipped in about 84,000 people in Prince George’s County just to ensure Democratic votes. That area gave Chris Van Hollen (D) his winning margin against Connie Morella (R) so it had to be in this district to ensure it will vote Democratic. Mark Shriver (D) might want to run in this district. It would be nice to have another Kennedy in Congress. Obama probably won 62% of the vote here. Demographics are 13% Black, 8% Asian, 14% Hispanic and 61% White. Status is Safe Democrat.

District 7 Elijah Cummings (D)

This district is BARELY protected the VRA. I tried to squeeze in as many Republican precincts as I could while keeping the Black percentage at 50% or above. This district used to go into Howard County but now takes in Republican suburbs in Baltimore, Carroll and Harford Counties. Since almost all the Baltimore precincts in the 7th voted around 90% for Obama, Cummings should be very safe. Obama probably won 67% of the vote here. Demographics are 50% Black and 43% White. Status is Safe Democrat.

District 8 Chris Van Hollen (D) vs. Roscoe Bartlett (R) Purple

Bartlett is 83 years old and about 63% of the 8th district is in Montgomery County, Van Hollen’s home base. Bartlett can campaign as a moderate but I see Montgomery County voters sticking with Van Hollen. With Bartlett out of the picture, Van Hollen should have an easy ride to reelection. Obama probably won 63% of the vote here. Demographics are 16% Black, 10% Asian, 13% Hispanic and 58% White. Status is Safe/Likely Democrat if Bartlett decides to run, Safe Democrat without Bartlett.

By what margin will Bob Shamansky win?

View Results

Loading ... Loading ...

An Overview of the California State Senate Races 2-20

Yes, this is my first diary about my home state and my second diary not involving redistricting. I have noticed many of you (including myself) believe that Democrats will gain seats in the California State Senate, State Assembly and in U.S House Representation. Even though the Democrats are falling nationally, they should not be falling in California. If the Republicans cannot reach out to Hispanics (a Survey USA poll on July 25th showed that 73% of California Hispanics approve of Obama’s job,) Democrats should have a good year in California, especially southern California. It should take an election or two to have Californians vote more Democratic at a statewide level. So a 50% for McCain win in a State Senate district would probably rank Lean Republican, not a Toss Up. Here is an analysis of the first ten State Senate Districts up for reelection (in 2010, only the even numbered districts are up for reelection.) I will post a diary about the other ten (eventually.) Overall, Democrats should gain 1-2 seats. Here is a link to the map of the California State Senate districts.

http://www.sen.ca.gov/~newsen/…

This link is for the California State Assembly Districts

http://www.legislature.ca.gov/…

State Senate District 2 Pat Wiggins (D)

We are lucky that her district is not trending Republican anytime soon. Here is a basic overview of Wiggins: July 13th, State Senate passes bill introduced by Wiggins to help rid Sonoma County of domestic violence.  On June 22nd, the State Senate passed a Wiggins bill that supports expanding Marine Sanctuaries off the coast of California. On June 3rd, the State Senate passed two Wiggins bills that expanded solar power opportunities and production. We should not lose her until 2014. Her district voted 69% for Obama. The demographics as of 2000 are 5% Black, 7% Asian and 16% Hispanic.

Status is Safe Democrat.

State Senate District 4 Sam Aanestad (R)

Aanestad’s website says that his main priorities are protecting Northern California water and rural health care. He will not fight for those issues for long. He is term limited out in 2010.  Two Republicans are lined up to take his seat. They are Rick Keene and Doug LaMalfa. Rick Keene is the former Assemblyman from the 3rd district and he lives in Chico. He supports low taxes and is a big supporter of North State water rights (since the water is shared with other parts of the state and reservoirs are low, water rights are a big issue in North State. ) Keene also promises to fight for “Conservative values.” Those include deregulation and getting rid of environmental burdens. I would not vote for Keene. LaMalfa seems to be a favorite. His website is more organized because he has the endorsements page up while Keene’s says “endorsements coming soon.” LaMalfa endorsements are influential and they include most of the sheriffs and district attorneys of the 4th district. Also, the State Senate Republican Leader Dennis Hollingsworth and the Assistant Leader Mimi Walters support LaMalfa. LaMalfa was in the State Assembly and represented the 2nd district. He is against high taxes but he is inconsistent on his views like some “Libertarians.” His website says quote, “Doug LaMalfa’s firm beliefs are that government should do no harm and that limited government means government should do only what people cannot do for themselves, in the most efficient manner possible,” unquote. Yet his website also says quote, “Doug helped lead Northern California efforts to protect marriage on both Proposition 22 and Proposition 8 that reaffirmed marriage is only between one man and one woman,” unquote. He can campaign for the government’s right to prevent people from marrying who they love as much as he wants. He should at least remove the line about supporting small government off his site! Something people CAN do for themselves is marry so why should LaMalfa interfere? Besides an endorsements page, his volunteer page is more developed and he has people sign up for email alerts, unlike Keene’s website. That leads me to believe that LaMalfa will win because he has better organization. No clear Democrat has emerged yet. His district voted 54% for McCain. The demographics are 4% Asian and 12% Hispanic. Status is Safe Republican.

State Senate District 6 Darrel Steinberg (D)

Steinberg is the President Pro Tempore of the State Senate. He succeeded Don Perata who carried a concealed gun due to death threats from anti gun control advocates. Steinberg hit the news for filing a lawsuit against Schwarzenegger because some of the budget cuts may be unconstitutional. He will be President Pro Tempore until he reaches term limits. Obama won 64% of the vote in his district. Demographics are 14% Black, 15% Asian and 18% Hispanic. Status is Safe Democrat.

State Senate District 8 Leland Yee (D)

Yee has a spotty background but at least he works hard in the State Senate. On August 17th, the Assembly approved SB 242 which Yee authored. SB 242 says that people cannot be denied a job based on the language they speak. Yee should not worry about a Republican challenge. He may worry about Tom Ammiano, a State Assemblyman from San Francisco. Ammiano was elected in 2008 but he is active in San Francisco. He ran for mayor in 1999 and was a San Francisco Supervisor. Ammiano is very Liberal, even for San Francisco. I expect that Ammiano may pass on this seat to wait for 2014, when Yee and he are term limited out of their seats. If he ran for 2010, I do not expect him to win. The reason is that Yee’s district is more working class and not as ultra Liberal as Ammiano’s Assembly district. Ammiano will definitely run to the left so I do not see him winning. Yee appears safe because he has a large presence in the area. He was elected to the State Assembly in 2002. Obama won 76% of the vote here. Demographics are 16% Hispanic and 35% Asian. Status is Safe Democrat.

State Senate District 10 Ellen Corbett (D)

Corbett is fighting hard to prevent a NUMMI plant in Fremont from being closed. On August 21st, she rallied with workers at the plant. No Republican has a shot at winning this district because it is too Democratic. She has had a presence in this district for more than 10 years. With no looming baggage, she should have an easy ride through 2010. Obama won 71% of the vote here. Demographics are 7% Black, 21% Hispanic and 32% Asian. Status is Safe Democrat.

State Senate District 12 Jeff Denham (R) Term Limited Out!

If Democrats want to gain a 2/3 majority, they have to pick up seats such as Denham’s. With a Republican incumbent gone, Democrats have a great shot at it with a 13% registration advantage and 46% Hispanic population as of 2000. State Assemblyman from Modesto Tom Berryhill (R) might look at the race. He does not live in it but as we learned from carpetbagger Tom McClintock, people can just move to a suitable district and run. If I were him, I would probably stay in his safe district containing Republican parts of Modesto and the Sierras. He is term limited out in 2012. Possible Democratic candidates include Anna Caballero from Salinas. She is not term limited out until 2012. She said is interested in running but has not formerly announced yet. Her background includes chairing the Youth Violence Prevention Committee and representing unions in a strike. Other candidates include Luis Alejo (D), an attorney from Watsonville. Jamie De La Cruz (D) will run if Caballero does not run. Francisco Dominguez (D) from Gilroy has worked on a school board for 12 years. He will run if Caballero decides not to run. He said, “I’m very frustrated, just like other folks, about what’s happening in Sacramento – not being able to resolve the budget and deliver to residents,” he said. “There needs to be more cooperation in the legislature. My style is to resolve conflict.” Rick Rivas (D) was Caballero’s campaign manager in 2006 so I assume he will run if Caballero decides not to run. The last candidate is Eugenia Sanchez (D) who is the mayor of Hollister and served on Hollister’s School Board. It is too early to tell who will win if Caballero runs. If someone from the Central Valley jumps in, that person could sweep the Central Valley while the other candidates split the Coastal area. If Caballero runs, the other candidates may defer to her. If they do not, I still believe she should win. The reason is that all the other candidates are Hispanic; they will split the Hispanic vote while Caballero sweeps the white vote. A Hispanic candidate would have a better chance to win this district because he or she could generate a large Hispanic turnout. The primary could damage the Democrats but it looks like the Democrats should win. Obama won 58% of the vote here. The Demographics are 46% Hispanic and 42% White. Status is Lean Democrat.

58%

State Senate District 14 Dave Cogdill (R)

Cogdill was the Senate Republican Leader from April 2008 to February, 2009. He seems to be in touch with his district because he supports cleaner air quality, low taxes and agricultural groups. One bill he proposed would cut red tape for agricultural vehicles but also protect the environment. He appears to be Conservative on most issues but moderate on others. He joined Darrel Steinberg and Schwarzenegger to campaign for the May 19th budget propositions. Since he is term limited out in 2014, he should be reelected in 2010. McCain won 56% of the vote. Demographics are 28% Hispanic and 5% Asian. Status is Safe Republican.

State Senate District 16 Dean Florez (D)

Florez appears to be sitting in the light of power. He became Senate Majority Leader in 2008 and will run for Lieutenant Governor in 2010. His grandparents are farm workers and he fights for farm worker’s rights in the Senate. One main priority of Florez’s is speaking out against using the Central Valley as a big dump for waste. Other accomplishments include sponsoring SB 700 which made farmers follow the Clean Air Act and supporting bills to make farm worker vans safer.  Possible candidates for replacement include Danny Gilmore (R) of the 30th Assembly district and Juan Arambula (I) of the 31st Assembly district which covers Hispanic areas in the southern Central Valley. Gilmore won against Fran Florez (D), the mother of Dean Florez in 2008. Gilmore was a former marine. He may run because he has a shaky hold on the 30th district. I expect due to the district’s large Hispanic population, a Hispanic Democrat will win in 2010. Even though it should be a Republican year, Gilmore was the Joseph Cao of California. He was Cao because he won an upset in a heavily Democratic district that will go back to normal by 2010. Arambula used to be a Democrat but switched parties in June 2009. Seeing an open seat, he may leap for the seat and because he is Hispanic, I see him winning. Obama won 59% of the vote here. Demographics are 63% Hispanic, 7% Black, and 6% Asian. Status is Likely Democrat.

State Senate District 18 Roy Ashburn (R)

Republicans may be dwindling in California. They still have this area as a stronghold. The 18th district contains Republican parts of Kern, Tulare, Inyo and San Bernardino counties. This totals up to a McCain win with 61% of the vote. Even though Ashburn represents the most Conservative district in California, he is fairly moderate. During the budget crisis, he voted with the Democrats to increase taxes to help the economy. His constituents were furious so his political career should be finished. Voters will not have a chance to prove it because Ashburn is term limited. A possible candidate to replace him is Republican Jean Fuller. She represents the 32nd State Assembly District which is centered in Bakersfield. She was the former Superintendent of Bakersfield schools until she became a state legislator in 2006. Like Ashburn, she is not a Tom McClintock Conservative. She supports allocating more money for education. Besides Fuller, Republican Bill Maze will seek the seat and so will Democrat Carter Pope. Maze formerly represented California’s 34th State Assembly District which covers Tulare County and some rural areas in Inyo County. In the Assembly, he was on numerous committees such as the Select Committee for Foster Care. Maze appears more Conservative than Fuller and he represented the 34th district for six years. The race should be a duel between Kern County and Tulare County.  Maze has a better chance to win because he is more Conservative and he is more entrenched. I expect the race will split about 53%-47% or even closer. Democrat Carter Pope appears to have no legislative experience or political experience so he is should lose. The demographics for this district are 27% Hispanic. Status is Safe Republican.

State Senate District 20 Alex Padilla (D)

Like San Francisco mayor Gavin Newsom, Padilla is a young rising star. Apparently, Newsom agrees with me because he appointed Padilla to chair his gubernatorial campaign calling Padilla, “One of the brightest and most accomplished rising stars in the country.” Even if Newsom’s poll numbers depict his as a falling star, Padilla is not falling. The Hispanic Business magazine named him one of America’s most influential Hispanics. He spearheaded a tobacco tax bill last August and is trying now to get a fire protection bill passed. The San Gabriel Mountains near his district are on fire, why am I not surprised?  Other projects include starting the Children’s Museum of Los Angeles. Since he was elected in 2006, he sponsored 29 bills.  Would he be LA Mayor Villaraigosa’s replacement when Villaraigosa retires? Anyway, he should not worry about reelection. Obama won 72% of the vote here and the demographics are 61% Hispanic, 9% Asian and 23% White. Status is Safe Democrat.  

By what margin will Bob Shamansky win?

View Results

Loading ... Loading ...