New York Redistricting

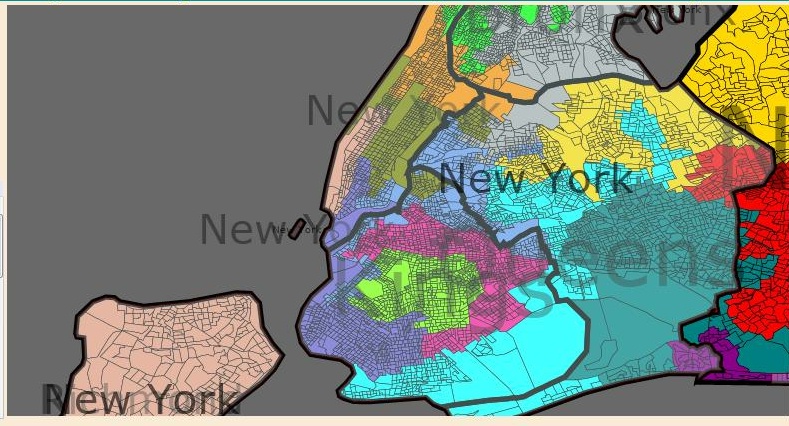
This is my first diary since July 24th. This time, I am redistricting New York assuming the Democrats still control the New York State Senate. I drew this map assuming New York will lose one vote. I tried to create a 27-1 Democratic delegation. I decided 28-0 was too risky but I made the 1 Republican district competitive. I know 2010 should be a Republican year but 2012 will not be because Obama should be reelected. He will probably rebound like Bill Clinton did in 1995 and win reelection easily. Back to redistricting: even though the 6th district is no longer Black majority, I made two Hispanic majority districts. I also increased the 5th district’s minority population so a minority candidate will probably elected when Ackerman retires. In this diary, I am going to focus mostly on LI and Upstate Democrats because NYC Democrats are pretty safe. I gerrymandered Downstate New York a bit but in Upstate, I tried not to split counties except for population and contiguity. This is what my rankings mean: Safe means safe for the incumbent party, Likely means currently safe but possibly competitive, Lean means competitive but not a nail biter, Toss Up means a nail biter. Here are the maps.

New York Redistricting Long Island

New York City

Westchester County Area

Hudson Valley

Northern New York

Buffalo Rochester Area

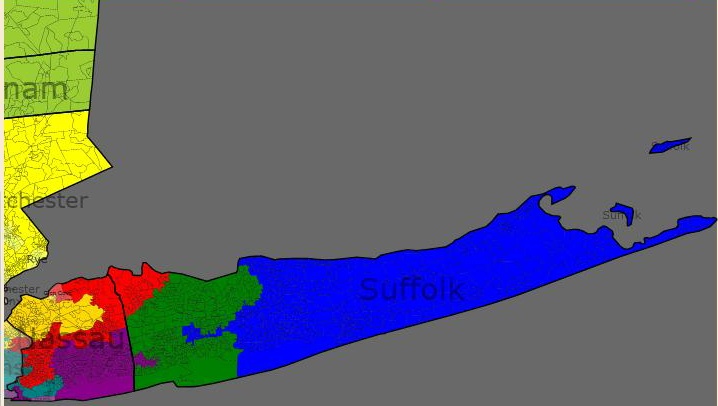
District 1 Tim Bishop (D) (Dark Blue)

Even though Bishop has won easily recently, he could eventually face a real challenge. That is why I sent a finger to take in some heavily Hispanic areas. That should help protect him. Besides that, his district does not change much. Obama probably won 53% of the vote here. Racial stats are 5% Black, 13% Hispanic and 77% White. Status is Likely Democrat.

District 2 Steve Israel (D) (Green)

I weakened Israel a bit by adding the white northern and southern parts of Suffolk County. Unless he faces a tough challenger, he should win. Obama probably won 53% of the vote here. Racial stats are 7% Black, 13% Hispanic and 73% White. Status is Likely Democrat.

District 3 Peter King (R) (Purple on Long Island)

With the exclusion of white areas in northern Nassau County, the inclusion of heavily Democratic Hempstead and putting 8% of the district in Queens, this district appears to be unfavorable territory for King. Even though I include King’s base, the Democratic areas I included should offset margins from his base. I wonder if King will agree with me and run in the 2nd district instead of retiring. I bet Israel can hold off King. I know that I kept most of King’s base here but since I raised the minority population alot, King should still be in jeopardy. I am not too familiar with local candidates in Nassau County so if anyone can tell me about some, that would be great. I think Obama won 55%-56% of the vote here. Racial stats are 19% Black, 16% Hispanic and 60% White (down from 86% White in the old district.) Status is Likely Democrat if King retires, Lean Democrat if he runs.

.

District 4 Carolyn McCarthy (D) (Red)

I changed her district around a lot so King would think that her district is too Democratic to win. With the inclusion of some Queens neighborhoods, I am not too worried about McCarthy’s chances. Obama probably won 56%-58% of the vote here. Racial stats are 7% African American, 12% Hispanic, 11% Asian and 66% White. Status is Likely Democrat if King runs, Safe Democrat if he does not run.

District 5 Gary “Caroline Kennedy is no more qualified to be president than Sarah Palin” Ackerman (D) (Yellow)

Reducing the white population from 44% to 37% was partly motivated by my personal opinions and that minority groups will try to get more minorities elected to Congress. I had to remove white areas, put them in the 9th and snake the district closer to Manhattan. Unless Ackerman faces a strong challenge, he should keep his seat because whites are a plurality. To protect other districts such as the 7th and the 12th, I could not increase his minority population much more. Besides the Kennedy/ Palin issue, this guy is pretty Conservative. He submitted H.Con.Res.362; a bill which is basically declares war on Iran. Racial stats are 25% Hispanic, 30% Asian and 37% White. Status is Safe Democrat.

District 6 Gregory Meeks (D) (Teal)

Meeks’s district is no longer Black majority but they still make up the majority of the primary voters. Minority groups might sue but Charlie Rangel whose district is 30% Black seems pretty content with his district. Blacks are the definite plurality so Meeks has no worries. I sent his district into LI to weaken Peter King. Racial stats are 46% Black, 18% Hispanic, 12% Asian and 18% White. Status is Safe Democrat.

District 7 Joseph Crowley (D) (Gray)

Personally, I have no problem with Crowley but his district was the best suited to make Hispanic majority. Even though they do not make up the majority of the voters, this district will probably elect a Hispanic when he retires. Racial stats are 22% Black, 50% Hispanic, 8% Asian and 18% White. Status is Safe Democrat.

District 8 Jerrold Nadler (D) (Purple)

Nadler does not actually live in this district. He lives in the Upper West side but he will probably run here because it contains most of his old district. The Brooklyn parts of the district lean Democratic but the Manhattan part of this district raises its Democratic percentage. Racial stats are 9% Hispanic, 21% Asian and 65% White. Status is Safe Democrat.

District 9 Anthony Weiner (D) (Bright Blue along Jamaica Bay)

His district looks more convoluted now. It still stays the same politically: competitive at a national level but heavily Democratic at a local level. Racial stats are 5% Black, 15% Hispanic, 15% Asian and 62% White. Status is Safe Democrat.

District 10 Edolphus Towns (D) (Fuchsia)

The African American population drops but not nearly enough to alter the voting in this district. Racial stats are 53% Black, 21% Hispanic and 21% White. Status is Safe Democrat.

District 11 Yvette Clarke (D) Light Green

Not much change here either. Racial stats are 57% Black, 11% Hispanic, 5% Asian and 23% White. Status is Safe Democrat.

District 12 Nydia Velazquez (D) (Light Blue)

Velazquez seems safe but I made this district Hispanic majority so a Hispanic has an easier time getting elected when she retires. Racial stats are 8% Black, 50% Hispanic, 18% Asian and 21% White. Status is Safe Democrat

District 13 Michael McMahon (D) (Tan)

Since he was elected in 2008, I made his district solidly Democratic while keeping Staten Island within one district. With 30% of the district in Manhattan, McMahon’s only problem should be a very strong moderate Republican running here. Obama probably won 56% of the vote here. Racial stats are 8% Black, 14% Hispanic, 7% Asian and 68% White. Status is Likely Democrat depending on the challengers.

District 14 Carolyn Maloney (D) (Dirty Green)

She loses some Hispanic precincts to the 12th district and her district extends to the Hudson River. It is still heavily Democratic. Racial stats are 10% Hispanic, 11% Asian and 74% White. Status is Safe Democrat.

District 15 Charlie Rangel (D) (Orange)

It extends further south into Manhattan and into Riverdale. Minorities are still the overwhelming majority here. The Chairman of the Ways and Means Committee should be happy with this new district. I reduced the Hispanic population from 48% to 44% to strengthen Hispanic representation in the 7th and 16th districts. Even though the Hispanic turnout is not very high, there should be a close contest between a Black and a Hispanic when Rangel retires. The reason is that the Hispanic population will keep growing. Racial stats are 30% Black, 44% Hispanic and 20% White. Status is Safe Democrat.

District 16 Jose Serrano (D) (Light Green)

The district gets whiter and less Hispanic but Serrano should be safe. Racial stats are 27% Black, 58% Hispanic and 9% White. Status is Safe Democrat.

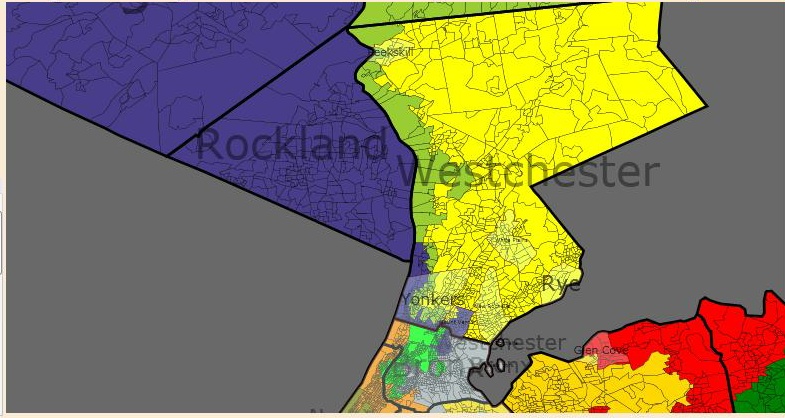
District 17 Eliot Engel (D) (Purple above New York City)

Due to population growth, I had to remove parts of Bronx and add in parts of Orange County. Heavily Democratic neighborhoods in the Bronx and Yonkers should keep this district in the Democratic column. Obama probably won 60% of the vote here. Racial stats are 22% Black, 15% Hispanic, and 55% White. Status is Safe Democrat.

District 18 Nita Lowey (D) (Yellow in Westchester County)

This district is now completely in Westchester County, extending all the way to the Putnam County border. Obama probably won 60% of the vote here. Racial stats are 8% Black, 16% Hispanic, 6% Asian and 67% White. Status is Safe Democrat.

District 19 John Hall (D) (Light Green)

Hall seems safe in his current district because he won 58% of the vote there in 2008 even though he was elected in 2006. I solidified his hold by extending his district into some heavily Democratic precincts in Westchester County. I also kept in the cities in Orange County while removing more rural areas. These changes should keep Hall safe. Obama probably won 55%-57% of the vote here. Racial stats are 10% Black, 16% Hispanic and 68% White. Status is Safe Democrat or Likely Democrat depending on the challengers.

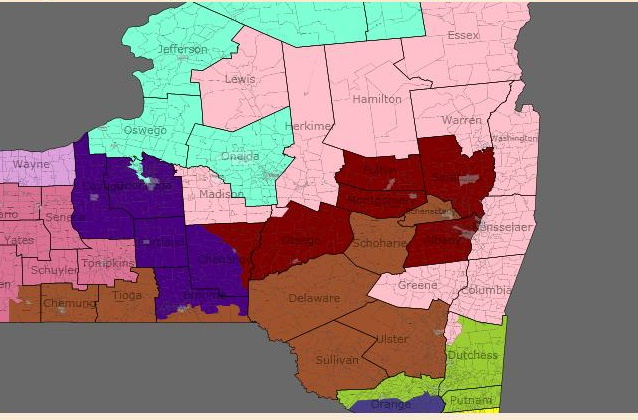
District 20 Scott Murphy (D) (Light Pink along eastern New York border)

Murphy was elected to Congress against Republican State Assembly Minority Leader Jim Tedisco by a hair. Democrats will probably remove Tedisco’s home in Saratoga County and send the district up to the Canadian border to take in some Democratic counties. Here are the vote totals for the district except for the chunks of Dutchess and Otsego Counties: Barack Obama 159,784 and John McCain 143,853. Obama won about 52% of the vote in this district including the Dutchess and Otsego County chunks. Obama’s percentage rose by one point but with Tedisco’s base removed and Murphy’s home base in the district, Murphy appears safe. Racial stats are 91% White. Status is Likely Democrat.

District 21 Paul Tonko (D) (Mahogany Brown)

To protect the 20th and 22nd district, I removed Democratic Schenectady and Troy while adding some marginal rural counties. The voting totals for this district except for Chenango County are Obama 182,927 and McCain 137,887. It should be about two hundred votes less for Obama and McCain because the 20th district contains 900 people in Otsego County. Obama won about 56%-57% of the vote in the district. Racial stats are 5% Black and 86% White. Status is Safe Democrat.

District 22 Maurice Hinchey (D)vs. Eric Massa (D) (Dirt Brown)

I made a few changes by removing Cornell University and adding Schenectady. Except for Broome and Steuben Counties, the vote totals for this district are Obama 154,312 and McCain 127,453. Hinchey is still safe. Massa is a freshman Democrat so he may run in the 25th district. Obama probably won 55% of the vote overall. Racial stats are 5% Black, 5% Hispanic and 85% White. Status is Safe Democrat.

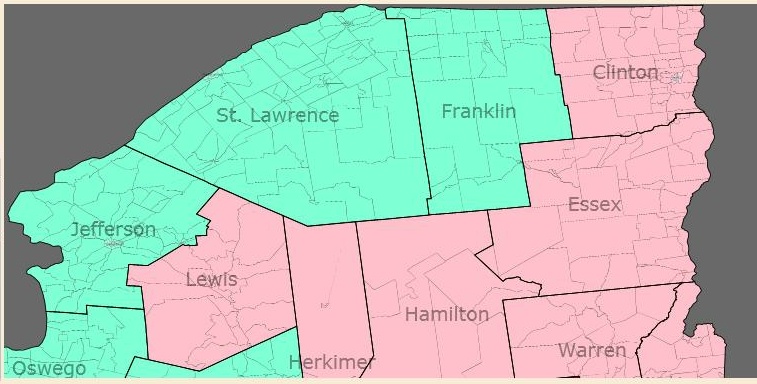
District 23 Michael Arcuri (D) (Light Turquoise)

I eliminated Republican John McHugh’s vacant seat assuming a Republican wins it. Arcuri loses most of his old 24th district but keeps Oneida County. The numbers for the district excluding Onondaga County are: Barack Obama, 120,726 votes and John McCain with 116,679 votes. Yes, I know it is close but Onondaga has heavily Democratic and Arcuri splits the city with the 24th district. Obama only wins about 52% of the vote here but Arcuri will probably win his Oneida County home base. His Republican challenger in 2008 Richard Hanna gave him a close race but I removed his home from the district. Racial stats are 87% White. Status is Likely Democrat but could change to Lean in a Republican year.

District 24 Dan Maffei (D) (Purple in Upstate)

I move his district around a bit but with heavily Democratic areas in Broome and Onondaga Counties, Maffei should have no worries. Obama probably won 56% of the vote here. Racial stats are 6% Black and 86% White. Status is Safe Democrat.

District 25 Vacant (Pink but NOT the district in Rochester)

Except for Tompkins County (Cornell University,) this district is mostly Republican. Since Maffei has all the Democrats he needs, Cornell has to go somewhere and I wanted to split as few counties as possible. Excluding split counties (Steuben and Wyoming) Obama has 127,859 votes to McCain’s 127,339 votes. Yep, equally divided between the parties but McCain is the overall winner. Steuben and Wyoming Counties are heavily Republican so they would make McCain carry the district. Chris Lee, the Republican Congressman from the 26th does not live here but he may run here because his home is in the Democratic 27th. 2012 should be an Obama year so Tompkins County should have high turnout which could propel a Democrat into office. Lee seems to be a good campaigner so he would be the frontrunner. Eric Massa may run here even though the district tilts Republican. Racial stats are 91% White. Status is Lean Republican.

District 26 Brian Higgins (D) vs. Chris Lee (R) (Gray)

I put this district entirely in Erie County and increased the minority population. These changes strengthen Obama’s performance. Higgins’s only problem is Chris Lee who would probably run in the more Republican 25th. Higgins has won easily in 2006 and 2008 so he should be safe. Obama probably won 56% of the vote here. Racial stats are 9% Black and 82% White. Status is Safe Democrat if Lee does not run, Likely Democrat if Lee runs.

District 27 Louise Slaughter (D) (Light Green)

It gets less Democratic but with the inclusion of Rochester and Buffalo central cities, this district remains Democratic. Obama probably won 58% of the vote here. Racial stats are 17% Black and 74% White. Status is Safe Democrat.

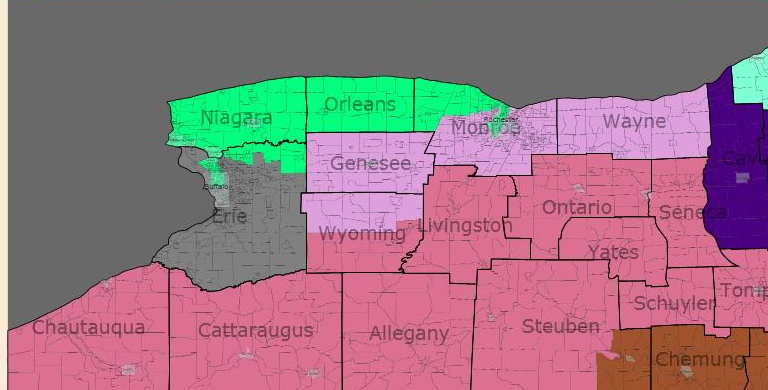
District 28 Vacant (Pink District in Rochester)

I tinkered with the district a bit by including more of Monroe County (Rochester) and splitting Rochester with the 27th. Republican Wyoming, Genesee and Wayne Counties should not be enough to offset Democratic margins. Eric Massa is the current representative of the 29th. He does not live here but since it contains part of his current district and it is Democratic, he might take a run at it. A Democrat should win it anyway. Obama probably won 55% of the vote here. Status is Safe Democrat.

By what margin will Bob Shamansky win?

View Results

Loading ... Loading ...

Pennsylvania Democratic Gerrymander

Here is another Democratic gerrymander, this time in Pennsylvania. I am not sure if we can pick up the entire legislature and retain the governorship. If we did, they would probably try to protect new Democrats instead of heading for an all out gerrymander. In my opinion, my map is not too realistic but just in case the Democrats have total control…. This map protects new Democrats while eliminating one Republican seat and endangering the incumbents of two others. I eliminated Charlie Dent’s seat assuming he survives 2010.I am aiming for a 14-4 Democratic delegation as a revenge for the planned 13-6 Republican delegation. My only worry for the Democrats is the 11th district with Paul Kanjorski but even there he should be safe. Here are the maps.

East Pennsylvania

East Pennsylvania

West Pennsylvania

West Pennsylvania

Philadelphia Area

Philadelphia Area

Pittsburgh Area

Pittsburgh Area

District 1 Robert Brady (D) Dark Blue

Robert Brady’s district was safe with the old map and will remain safe this time, even though his district is less safe. I removed some African American areas in western Philadelphia and Delaware County. I added some white parts of Delaware County but they should not affect the voting habits of this district much. Obama probably won 73% of the vote here. Racial stats are 19% African American, 18% Hispanic, 6% Asian and 53% White. Status is Safe Democrat.

District 2 Chaka Fattah (D) Dark Green

For population purposes, I had to send this district up into some white parts of Montgomery County but that should not alter the voting of this district. It stays mostly the same. Obama probably won 85% of the vote here. Racial stats are 58% African American and 32% White. Status is Safe Democrat.

District 3 Kathy Dahlkemper (D) Dark Purple

I was worried about her because she is a freshman. To protect her, I removed all of heavily Republican Butler County and substituted it with some marginal territory along the border. I extended it into the middle of the state to pick up Elk County which Obama barely won. I probably raised Obama’s performance to 53%. She should be safe without a strong challenge. Racial stats are 92% White. Status is Likely Democrat.

District 4 Jason Altmire (D) vs. Tim Murphy (R) Red

To strengthen Altmire, I removed all of Butler County and added some of marginal Washington County. I slipped in some precincts in Pittsburgh as well. He appeared safe in 2008 and he should be even safer. Murphy will probably run in the heavily Republican 17th district so Altmire should not worry. McCain probably won 50% of the vote here. Racial stats are 5% African American and 91% White. Status is Likely Democrat.

District 5 G.T Thompson (R) Yellow

I made this district more Republican to strengthen Democrats in the 3rd and 10th districts. This district basically goes further east, loses Penn State and stays heavily Republican. McCain probably won 63% of the vote here. Racial stats are 95% White, the whitest district in Pennsylvania. Status is Safe Republican.

District 6 Open (Gerleach) (R) Teal

Trust me; this district is not electing a Republican anytime soon. With Gerleach out, this new district would oust any Republican who might have won in 2010. That will probably not be necessary because the Democrats have some good candidates here. The changes I made were removing most of Chester County while giving the district more of Montgomery County. For good measure, 9% of the district is in Philadelphia. The part it has is 75% African American. I see almost no way for a Republican to win here. Obama probably won 64% of the vote here. Racial stats are 13% African American and 78% White. Status is Safe Democrat.

District 7 Open Joe Sestak (D) Gray

I’m a bit worried about this district because I had to extend it all the way out into Republican areas in Lancaster County. I definitely offset Republican margins from Lancaster by putting in heavily African American parts of Philadelphia in this district. Since Chester County is trending Democratic, this district should stay with the Democrats. Obama probably won 57% of the vote here. Racial stats are 14% African American and 77% White. Status is Safe/Likely Democrat.

District 8 Patrick Murphy (D) Light Purple

All I did here was help shore up Murphy by putting in more of Philadelphia which is now 22% of the district’s population. I also removed part of northern Bucks County. Murphy should be fine now. Obama probably won 57% of the vote here. Racial stats are 86% White. Status is Safe Democrat.

District 9 Bill Shuster (R) Bright Blue

I kept the district pretty much the way it is. All I did was move it east so that it is only a few miles away from Harrisburg. I took in Snyder and Union Counties to help strengthen Chris Carney. Anyway, Shuster is safe in the most Republican district in Pennsylvania. McCain probably won 65% of the vote here. Racial stats are 94% White. Status is Safe Republican.

District 10 Chris Carney (D) Pink

If Chris Carney does not represent this district, he probably lost in a primary, retired or the Republicans found the strongest candidate possible. I took out all the heavily Republican western counties and snaked the district into Northampton County (Bethlehem) and Monroe County which voted for Bush but McCain lost it by 17 points. The rural counties to the north lean Republican but they only gave McCain a combined 6,000 vote margin. The only worry I have is that Dent will run but the Democratic margins from Lackawanna, Luzerne and Monroe Counties should offset Dent’s margins from his old district. With the inclusion of most of Lackawanna County are more of Luzerne, Carney is safe. Obama probably won 55% of the vote here. Racial stats are 87% White and 5% Hispanic. Status is Safe Democrat, Likely Democrat if Dent runs.

District 11 Paul Kanjorski (D) Light Green

I am a bit worried about Kanjorski. I had to shore up other Democrats so he lost a few Democratic areas. I tried to help him by sending his district into Lehigh County (Allentown) which Obama won by 15 points. Republican Charlie Dent who represents the 15th district in Allentown may want to run here. Kanjorski had a tight race in 2008 but if he loses, a strong Democrat will probably beat the Republican who won it. Obama probably won 56% of the vote here. Racial stats are 84% White and 9% Hispanic. Status is Lean Democrat.

District 12 John Murtha (D) Indigo

Due to calling his constituents “racists,” Murtha had a ‘tough’ race in 2008 but won by 16 points. The Republicans probably will challenge him again. I’m not the biggest fan of John Murtha myself but we need as many Democrats as possible and a safe district when he retires. To shore him up, I removed all of Armstrong County and part of Westmoreland County. I added in a slice of Alleghany County, all of marginal Fayette County and Penn State. Murtha should be happy. Obama probably won 52% of the vote here. Racial stats are 92% White. Status is Safe Democrat.

District 13 Allyson Schwartz (D) Tan

I had to change Schwartz’s district quite a bit. First, I took out much of Philadelphia and replaced it with part of Bucks and Northumberland Counties. Since those areas both voted Democratic, Schwartz should be safe. She should worry about a primary challenge from the Bethlehem area but her Philadelphia base should probably keep her in Congress. Obama probably won 58-59% of the vote here. Racial stats are 7% African American, 6% Hispanic and 80% White. Status is Safe Democrat.

District 14 Mike Doyle (D) Algae Green

To help protect Altmire, I had to remove the western part of Pittsburgh from this district and substitute it with more Conservative suburbs to the north and south. They should not be nearly enough to endanger Doyle, he appears safe. Obama probably won 65% of the vote here. Racial stats are 19% African American and 74% White. Status is Safe Democrat.

District 15 Tim Holden (D) Orange

Even though Holden seems pretty safe (he won by 28 points in 2008,) I figured that the Republicans would eventually field a strong candidate against him. To help Holden, I added part of Allentown and removed part of Republican Lebanon County. Holden should have no problem at all now that his district is more Democratic. If Charlie Dent ran here, he would probably lose. Obama probably won 51%-52% of the vote here. Racial stats are 7% African American and 5% Hispanic. Status is Safe Democrat.

District 16 Joe Pitts (R) Light green (in Lancaster County)

I am not completely sure if we can knock off Pitts but we definitely have a good shot at it. I removed some of the rural areas in Lancaster County making the district more centered on the city Lancaster. Even though I included part of Republican Lebanon County, I added more of Democratic Reading. The final blow to Pitts is that even though he loses part of Democratic leaning Chester County, he gets heavily Democratic areas in Delaware County and even a couple of precincts in Philadelphia. This should attract some Delaware County Democrats to run. It should be a tight race because Pitts is pretty entrenched yet his margins are dropping. Obama probably won 52% of the vote here. Racial stats are 9% African American, 14% Hispanic and 73% White. Status is Toss Up.

District 17 No Incumbent (R) Dark Purple

If I were Tim Murphy, I would move to this district and run here. It contains part of his old district and takes in the heavily Republican areas of Butler and Armstrong Counties. Other Republicans will probably aim for this seat but Murphy should probably beat them. McCain probably won 61% of the vote here. Racial stats are 95% White. Status is Safe Republican.

District 18 Todd Platts (R) Yellow (on the southern border)

This district stays basically the same. All I changed was that I shrank the district and added some rural areas in Lancaster. Platts is fine. McCain probably won 59% of the vote here. Racial stats are 89% White. Status is Safe Republican.

By what margin will Bob Shamansky win?

View Results

Loading ... Loading ...

South Carolina Redistricting with Republicans in Control

I finally decided to create a map that is realistic. Since Republicans seem to be in control of South Carolina, I think they will aim for a map like this one. It is 5-2 Republican even though some of the Republicans should have shaky holds on their districts. I decided to think like a Republican would to draw this map. My main objectives were to strengthen Republicans Henry Brown and Joe Wilson while creating a new Republican district. I also strengthened John Spratt because it is almost impossible to weaken him enough to beat him while protecting the other Republicans. Anyway, Spratt is heavily entrenched. Also, I want to say thanks to Dave of Dave’s Redistricting App for enhancing the feature. Now here are the maps.

South South Carolina

Southern South Carolina

Up Country

Up Country

Eastern South Carolina

Eastern South Carolina

Charleston Area

Charleston Area

District 1 Henry Brown (R) Blue

The Republicans biggest worry should be that Brown has not been strengthened enough by redistricting. Yes, he does have most of Charleston County but the parts he has are mostly Republican. I did not alter the old district boundaries there much. Also, he has Republican Horry County to offset Democratic margins. I am not sure if I strengthened Brown enough. McCain probably won 55%-57% of the vote here. The racial stats are 17% African American and 75% White. Status is Likely Republican.

District 2 Joe Wilson (R) Green

Wilson also had a surprisingly competitive race even though he won by 10 points. I helped shore him up and reduced the African American percentage of the population by three points. I removed most of the Democratic rural counties and the parts I included were only to connect the coastline to Aiken and Lexington Counties. I strengthened Wilson even more by putting in Republican parts of Berkeley and Dorchester Counties. McCain probably won 56% of the vote here. Racial stats are 23% African American, 5% Hispanic and 68% White. Status is Likely Republican if Democrats want to challenge this district.

District 3 Gresham Barrett (R) Purple

There is not much difference here. Barrett is pretty safe with heavy Republican margins from Oconee and Pickens Counties. Even with McCormick County which leans Democratic, Barrett has no worries. I even reduced the African American population by two points. McCain probably won 64%-65% of the vote here. Racial stats are 18% African American and 76% White. Status is Safe Republican.

District 4 Bob Inglis (R) Red

I did not alter this district much either. Inglis is pretty safe without any worries. The only changes I made were removing Union County and part of Spartanburg County, mostly for population purposes. McCain still probably won about 60% of the vote here. Racial stats are 18% African American, 6% Hispanic and 71% White. Status is Safe Republican.

District 5 No Incumbent (R) Yellow

This is the new district I created for the Republicans. It basically contains Republican areas in the Up Country, Conservative Lexington County and some white parts of Richland County. I slipped in part of Chester County which Obama barely carried but this should still be Republican. I do not know who the new Republican congressman might be here. I found the names Jeff Duncan and Mac Toole, Republican members of the South Carolina State House whose districts contain part of the 5th. I have no idea if they are potential candidates or not. It would be great if someone who knows South Carolina better could elaborate on it. McCain probably won 62% of the vote here. Racial stats are 21% African American and 71% White. Status is Safe Republican.

District 6 James Clyburn (D) Teal

Since Clyburn is pretty safe, I left him alone pretty much. All I did was remove some northeastern precincts to strengthen John Spratt. All I can really say about this district is that it is still African American majority and Republicans have no shot at winning it. Obama probably won 67% of the vote here. Racial stats are 57% African American and 37% White. Status is Safe Democrat.

District 7 John Spratt (D) Gray

Since the Republicans would be pushing all the Republican areas into other districts, they had to leave behind some Democratic areas and many of them went here. Spratt is strengthened by the removal of most of York County and the inclusion of some African American precincts from the old 6th district. This increases the African American population from 32% to 39%. The changes do not matter much because Spratt is pretty safe. They do help elect a Democrat when he retires. Obama probably won 53% of the vote here. Racial stats are 39% African American and 56% White. Status is Safe Democrat.

By what margin will Bob Shamansky win?

View Results

Loading ... Loading ...

Map for Redistricting Arizona

Yes, I have created another Democratic gerrymander. I think the redistrictors in Arizona  must create competitive districts. I was able to create some competitive ones. My main objectives were to strengthen Gabrielle Giffords, Ann Kirkpatrick and Harry Mitchell. They are all Democrats elected to the U.S House in 2006 and 2008 in districts that McCain won in the single digits. Except maybe for Kirkpatrick, I probably strengthened those Democrats. I was able to weaken John Shadegg enough to attract strong competition. As for the other Republicans, I kept their district safely Republican while creating two new Republican districts. I had to do that because all those Republicans had to go somewhere. It is pretty difficult to aim for a 5-5 or 6-4 Democratic delegation in a state McCain won with 53% of the vote. Now here are the maps.

northern Arizona

Northern Arizona

southern Arizona

Southern Arizona

Phoenix area

Phoenix area

Tucson area

Tucson area

District 1 Ann Kirkpatrick (D) Blue

I am sorry I could not strengthen Kirkpatrick much. The best I could do was to remove only a small slice of Conservative Yavapai County. Also, I wish I could include the Hopi Reservation to allow more Democrats but because of a rivalry with the Navajo, I am unable to put both tribes in the same districts. Except for taking out a bit of Yavapai County, the district pretty much remains the same. Since Kirkpatrick easily won here by 16 points, she should be safe enough. McCain probably won 53% of the vote here. Racial stats are 16% Hispanic, 21% Native American and 60% White. Status is Likely Democratic.

District 2 Trent Franks (R) Green

This district stays pretty much the same except I moved a bit of eastern Glendale and western Phoenix out of the district. I took in some White parts of Yuma County and a bit more of Coconino County which totals to about only 7,000 people. This district probably voted about 60% for McCain. Racial stats are 17% Hispanic and 73% White. Status is Safe Republican.

District 3 John Shadegg (R) Bright Purple

Shadegg should be in for a tough race with this map. I removed the more Conservative northern part of his district. Even though I slipped in part of the current Republican 2nd district, this should not alter the political leanings of this district enough. To weaken Shadegg tremendously, I added in parts of the heavily Hispanic 4th district. This increases the Hispanic population from 14% to 30%. In 2008, Shadegg said he wanted to retire and then retracted the statement. Such a shaky district would probably propel him to retire. With Shadegg gone, this district is a prime pickup for the Democrats. The redistricting panel will like it because it is competitive enough. Obama probably won 51% of the vote here and he certainly would have won more voters if McCain were not from Arizona. The racial stats are 30% Hispanic and 59% White. Status is Toss Up if Shadegg stays, Lean Democrat if he retires.

District 4 Ed Pastor (D) Red

I had to move this district into some Republican areas to strengthen Obama’s performance in other districts. I remember Michael Barone in the Almanac of American Politics 2006 said that Republicans can dominate because they win fast growing areas. Well Michael, did you know that the fastest growing Arizona district is the heavily Hispanic 4th? The growth of Hispanics has been useful in shoring up other districts. Still, Ed Pastor should be fine in this majority Hispanic district. Obama probably won 64% of the vote here. Racial stats are 6% African American, 58% Hispanic and 31% White. Status is Safe Democrat.

District 5 Harry Mitchell (D) Yellow

I removed most of northern Scottsdale from the district and part of Tempe. I substituted that by adding part of the current 4th district to boost the Hispanic population here. Mitchell is in his late 60’s and he may retire soon. This district should be safe for him or any other Democrat who represents it. Minorities should become the majority here in a few years. Obama probably won 54% of the vote here. Racial stats are 5% African American, 34% Hispanic and 53% White. Status is Likely Democrat if Mitchell retires, Safe Democrat while he represents it.

District 6 Jeff Flake (R) Teal

I kept Flake’s district pretty much the way it used to be. I removed all of Pinal County and kept the district centered on Mesa (just for trivia, Mesa is larger than Cleveland, OH but most people in the East have never heard of it.)  There are a few Hispanic neighborhoods in Mesa but they should not be nearly enough to offset the Republican majorities in the rest of the city. McCain probably won 60% of the vote here. Racial stats are 23% Hispanic and 68% White. Status is Safe Republican.

District 7 Raul Griljava (D) Gray

This district is about the same except I moved most of the Tucson area and substituted it with heavily Hispanic areas in Phoenix. I took out some Republican areas in Yuma as well as La Paz County. The Pinal County portion stays the same except I added a few Hispanic precincts. Since this district has a Hispanic majority, Griljava should not worry. Obama probably won 55% of the vote here. That should be safe enough. Racial stats are 5% African American, 5% Native American, 54% Hispanic and 34% White. Status is Safe Democrat.

District 8 Gabrielle Giffords (D) Purple

One of my priorities was to protect Giffords from a strong challenge even though she seems pretty safe in her district. To protect her, I removed every inch of Cochise County from this district and replaced it with almost all of Tucson and some Hispanic areas in Pinal County. With Republican battles for the 10th district over in Cochise County, Giffords should have no strong opponent. Obama probably won 54% of the vote here. Racial stats are 35% Hispanic and 55% White. Status is Safe Democrat.

District 9 No Incumbent (R) Light blue

If a Republican does not win here, I am shocked. I removed the whitest areas I could find from the 3rd and 5th districts and slipped in parts of the 6th district due to population growth. It would be great if someone could tell me about state legislators who might run here but former Congressman J.D Hayworth might take a run at this seat. I imagine there will be a big Republican battle for the seat but Democrats will have token opposition. McCain probably received 62% of the vote here. Racial stats are 12% Hispanic (the lowest amount for any of my districts) and 81% White (the highest for any of my districts.) Status is Safe Republican.

District 10 No Incumbent (R) Pink

This district basically takes in Republican parts of the old 8th, 7th and 1st districts. With the more Democratic areas in those districts, the 10th should stay heavily Republican. The only possible problem is growth of Hispanics but that should not be an issue for awhile. The competition in this district will be in the Republican primary. The candidates could be Randy Graf from the southern part of the district or someone from Maricopa/Pinal County. McCain probably won 59%-60% of the vote here. Racial stats are 22% Hispanic and 69% White. Status is Safe Republican.

By what margin will Bob Shamansky win?

View Results

Loading ... Loading ...

Maps for Georgia Redistricting

I think the map is just not realistic enough to pass. Even if we can elect Democrat Roy Barnes as Governor, the best we could do is probably a bipartisan redistricting. Anyway, this is the map I would draw if I could decide what the Georgia map would be. I planned to try for an 8-6 Democratic map with creating a new Democratic district and weakening one Republican. If I tried really hard, I might have created a new Democratic district in the Atlanta metropolitan area. I did not want to weaken new Democrats and Obama turnout may have overestimated the Democratic Party strength around Atlanta. However, the minority population around Atlanta is growing quickly. This will make the Democrats stronger there. Just so people know, Safe Democrat/Republican means that the district is solidly for one party. Likely Democrat/Republican means that the district appears safe but could become competitive. Lean Democrat/Republican means that the district will be competitive but one party is ahead. Toss Up means that the district could go either way. Now here are the maps (Yes, I finally did not use a camera to get these shots.)

north georgia

North Georgia

South Georgia 2

South Georgia

atlanta area (2)

Atlanta area

District 1 Jack Kingston (R) Blue

I kept this district mostly the way it is. It contains most of southern Georgia but Democratic areas are taken into the 2nd, 3rd and 12th district. I took out some counties that were in the 12th to get them into here. I also extended this district to take in some Conservative parts of Warner Robins. Jack Kingston and any Republican should have no trouble here. It probably voted 69% for McCain.

Stats are 21% African American and 71% White. Status is Safe Republican.

District 2 Sanford Bishop (D) Green

Unfortunately, I had to weaken Bishop a bit to strengthen Democrat Jim Marshall in the 8th district. I put in some Republican counties that were originally part of the 8th. The district contains the southwestern part of the state which leans Democratic but extends east a bit to take in Republican counties that were in the 8th. Basically, I made the map of southern Georgia look like the map it used to be. Still, Bishop has been winning easily and unless he faces a big challenge, he should continue to win. I think that McCain won here with 51% of the vote.

Stats are 43% African American and 49% White. Status is Safe Democrat.

District 3 Lynn Westermoreland (R) Purple

Not much change to this district. All I did was remove some African American areas in the Republican counties this district contained. Since many African Americans are moving out of the Atlanta core, the African American population is growing here. Still, it should not be enough to affect the leaning of this district. I was also surprised that this district is more rural than suburban. Its growth was below the Georgia average. I think McCain won about 68% of the vote here.

Stats are 19% African American and 75% White. Status is Safe Republican

District 4 Hank Johnson (D) Red

This is one of the African American majority districts. It is centered in De Kalb County and for population purposes; I gave it a slice of Gwinnett County. I had to reduce the African American percentage a bit to strengthen other districts. Still, the only threat to Hank Johnson is a primary challenge. Obama probably won about 77% of the vote here.

Stats are 52% African American, 12% Hispanic and 29% White. Status is Safe Democrat.

District 5 John Lewis (D) Yellow

I kept this district mostly where it used to be and it should stay safe. It is another African American majority district. Even though I took out a few Atlanta precincts and extended the district into Cobb County, it is still very safe for John Lewis. This is a solid district and since Lewis is very popular, he does not even have to worry about a primary challenge. Obama probably won with 75% of the vote here.

Racial stats are 52% African American, 7% Hispanic and 36% White. Status is Safe Democrat.

District 6 Tom Price (R) Teal

I hope I put enough Democrats in this district to knock out Tom Price. Even though I kept some areas of the old 6th district in such as Roswell, this should not be much of a threat to a Democratic takeover. I removed all of Cherokee which gave McCain a margin of 48,000 votes. The rest of the old district probably gave a 20,000 vote margin to McCain. I removed all of Cobb County too and added part of Gwinnett County. I even sent a little finger down into Atlanta to pick up some heavily African American precincts. In parts of the South, the electorate is almost completely racially polarized. That means that race almost completely determines the party. In this district, the percentage of White Democrats is much higher than the percentage of minority Republicans. With the inclusion of a bit of Atlanta, this will weaken Price and he may want to run in another district even though he lives in Roswell. He was elected in 2004 so he is not as entrenched as he could be. I believe that Obama won about 52% of the vote here.

The racial stats are 18% African American, 14% Hispanic, 8% Asian and 58% White. Status is Toss Up/Lean Democrat depending on the competition.

District 7 John Linder (R) Gray

This district mostly contains the leftovers from other districts in Gwinnet County. I designed this to take in all the Republican parts of Gwinnet County and other Republican suburbs. If the minority growth in the Atlanta area does not slow down, this district might be more competitive in about ten years. For now, it is safe for John Linder. McCain probably won here with about 67% of the vote.

The racial stats are 10% African American, 7% Hispanic and 79% White. Status is Safe Republican.

District 8 Jim Marshall (D) Light Purple

Marshall recently has had a few close races in a district that voted 56% for McCain. This is why I decided to focus on strengthening his district. I extended it further east to pick up heavily Democratic Hancock County and Washington County. I sent this district further west to pick up Talbot, Macon and a few other Democratic counties. I had to remove the swing county Newton because Mac Collins (R) lives in it and he gave Marshall a very tough race in 2006. Most of the southern Republican counties in this district went to the 2nd and 1st districts. With the addition of Democratic counties and the exclusion of more Republican ones, I was able to increase the African American percentage from 32% to 41%. That should be high enough to protect Marshall. I estimate that Obama won about 51% of the vote in this district.

The racial stats are 41% African American and 53% White. Status is Likely Democrat.

District 9 Nathan Deal (R) Bright Turquoise

I did not change this district much. What is there to change anyway? The district was pretty Conservative before and it is still heavily Republican. If the growth in Atlanta continues, the counties closest to Atlanta in this district will start filling up with people. That should be the only change to this district. Either way, it is Republican for the foreseeable future. McCain probably won 72% to 77% of the vote here.

Racial stats are 6% African American, 10% Hispanic and 82% White. Status is Safe Republican.

District 10 Paul Broun (R) Bright Pink

I should say what I said about the 9th district. No Democratic will win here anytime soon. It will be even harder for one because I removed Athens from this district. I put it back into the 12th. The only bit of worry Broun should have is that Gainesville in Hall County has a fast growing Hispanic population. It should not be enough to alter the politics of the district too much. I estimate that McCain got about 70% of the vote here

. The racial stats are 10% African American, 10% Hispanic and 77% White. Status is Safe Republican.

District 11 Phil Gingerly (R) Light Green

Due to large population growth, this district just shrunk down to size. Also, I extended it into Cobb County which is more densely populated so that was another reason for the shrinking of this district. Even though Gingerly had a weak district when the Democrats drew the 2002 map, I gave him a strong one now. The reason I could not give him a weaker district was that I had to protect the 13th. Anyway, I do not believe Gingerly would be weakened enough if I gave him the Democratic parts of Cobb County. Cobb County voted 55% for McCain and the Republican suburbs make the Republican percentage increase. I estimate that McCain won here somewhere in the neighborhood of 65% of the vote.

The racial stats are 14% African American, 7% Hispanic and 75% White. Status is Safe Republican.

District 12 John Barrow (D) Light Blue

Again, I tried to make the lines resemble the 2002 Democratic redistricting. I gave Barrow all the Democratic parts of Savannah, Augusta and extended the district up to Athens. Whites are now a minority so I do not see the Republicans winning here. Even if Max Burns, the former Congressman from this district runs, he should not beat Barrow. I estimate that Obama won with 58%-60% of the vote here. Barrow is safe with the inclusion of Athens and the exclusion of Republican counties.

The racial stats are 43% African American and 49% White. Status is Safe Democrat.

District 13 David Scott (D) Tan

I kept his district pretty much the same except that I moved out the eastern part of his district. This district looks a bit gerrymandered because I moved it everywhere I could to pick up African American areas. Even though this district includes less of Clayton County than it used to, this district should still be heavily Democratic. I did not include enough African American areas to make their population go above 50% so this is not protected by the Voting Rights Act. Still, David Scott should have no problem getting elected here. Obama probably won here with about 70% of the vote.

The racial stats are 46% African American, 11% Hispanic and 39% White. Status is Safe Democrat.

District 14 No Incumbent Algae Green

This is really an eastern extension of the 2002 redistricted 13th. I send this district up into Gwinnet County to take in some heavily African American and Hispanic precincts. It also goes into Democratic trending Rockdale and Newton Counties. They are trending Democratic so quickly. Kerry won 40% of the vote in Rockdale County and Obama won 54%. Even though Whites are a plurality here, this district should have no trouble going for a Democrat. I estimate that Obama won here somewhere in the mid 60’s.

Racial stats are 38% African American, 13% Hispanic, 6% Asian and 41% White. Status is Safe Democrat.

By what margin will Bob Shamansky win?

View Results

Loading ... Loading ...

Minnesota Redistricting Maps

Here is another Democratic gerrymander. I chose Minnesota because the majority of the poll voters picked it. For those of you who voted for Georgia, that is my next state.  For Minnesota, a gerrymander like this is possible but it could be a long shot. This would only happen if the Democrats retain the State Legislature and capture the Governorship. I drew this map assuming that Minnesota would lose one electoral vote. I probably was able to create a 6-1 Democratic map even though there is a chance it might be a 5-2 Democratic map. My main objectives were to keep all Democrats safe while weakening Republican Erik Paulsen of the 3rd district and combining Republicans John Kline and Michelle Bachman. They are both so Conservative so at least we can knock away one of them. The pink lines are the boundaries of the old districts.  Here is the link to my maps http://frogandturtle.blogspot.com

District 1 Tim Walz (D) Blue

Even though I would have loved to strengthen Walz but I could do that because I needed enough Democratic counties to protect Collin Peterson (D) in the 6th district. Anyway, this district is pretty much the same as it is except I took in Democratic leaning Rice and Lincoln Counties as well Le Suer and part of Goodhue County. Le Suer and Goodhue are both marginal. I probably raised the Obama performance in the district by just a bit. I estimate that Obama won 52% to 53% of the vote here. The racial stats are 91% White. Status is Likely Democrat.

District 2 John Kline (R) vs. Michelle Bachman (R) Green

I have heard some talk from Republicans about combining Minneapolis and St. Paul into one district. I bet they did not consider that the Democrats could combine most of the Republican suburban areas into one district. I strengthened the 2nd district’s Republican performance by adding more Republican territory near St. Cloud and removing Rice County. McCain probably won only 55% of the vote here so a strong Democrat could possibly make it competitive. Michelle Bachman’s home Stillwater is in the district. The 2nd district contains part of her old 6th so she will probably choose to run here. John Kline is more entrenched so he will probably win, forcing Michelle Bachman to finally get out of Congress. Racial stats are 90% White. Status is Safe Republican if Kline wins, Likely Republican if Bachman wins.

District 3 Erik Paulsen (R) Purple

I know one thing about this district; Paulsen is in for a tough race with this district. He was elected in 2008 so he had almost no time to become entrenched into his district. To weaken him, I removed part of western Hennepin County, put in the most urban parts of Washington County and added some heavily Democratic areas in Minneapolis. Paulsen won by eight points in 2008 against Ashwin Maida, an impressive candidate. This definitely drops the chances of clearly knocking off Paulsen but with some new territory, it should be much easier. Obama won 56%-57% of the vote here. Racial stats are 8% African American, 6% Asian and 81% White. Status is Toss Up/Tilt Democratic.

District 4 Betty McCollum (D) Red

Her district looks very different from the one she has now. I had to unfortunately extend it out into the Republican suburbs because of population loss and the elimination of Michelle Bachman’s district. Her district extends all the way out to St. Cloud now. Ramsey County gave Obama a margin of 96,000 votes and the part McCollum has Obama probably pulled out a 75,000 vote margin there. The suburban part of the district probably gave McCain a 15,000 vote margin. A 60,000 Obama margin should be enough to protect McCollum. If Bachman decided to run here, she would probably not win. Obama probably won 59% of the vote here. The racial stats are 6% African American, 6% Asian, 6% Hispanic and 79% White. Status is Safe Democrat.

District 5 Keith Ellison (D) Yellow

Even though I slipped in part of the old 3rd district, Keith Ellison should have no worries. Minneapolis will keep him safe and sound. Obama probably won here with 68%-72% of the vote. Racial stats are 10% African American, 8% Hispanic, 5% Asian and 73% White. Status is Safe Democrat.

District 6 Collin Peterson (D) Teal

Even though I have tried to strengthen every Democrat here, I had to weaken Peterson a bit. I took away a few northern Counties that lean Democratic and added some of Stearns and Sherburne Counties which lean Republican. I may have compensated for those counties by adding a touch of Minneapolis. Weakening Peterson should not hurt him much. He is a moderate Democrat who is the chairman of the Agriculture Committee and has been representing the 7th district since 1991. He should be safe even though McCain probably won 51% of the vote here. Racial stats are 90% White. Status is Safe Democrat.

District 7 James Oberstar (D) Gray

This district has slow population growth so I had to extend it to the North Dakota border. The counties there lean Democratic so the new additions do not alter the 7th district’s political leanings much. It would not matter how many Republicans are here because Oberstar has represented this district since the 1970’s. He creamed former Senator Rod Grams when he ran for House in 2006. No question about it, Oberstar is safe. Obama probably received 56% of the vote here. Racial stats are 93% White. Status is Safe Democrat.

South Carolina Redistricting Maps

I made this map aiming for a 4-3 Republican delegation. Even though I strengthened shaky Republicans like Henry Brown and Joe Wilson from the 1st and 2nd districts, I was able to create a new safe Democratic district. This is assuming that South Carolina gets another district and that Joe Wilson and Henry Brown survive 2010. My main objectives were to keep John Spratt and James Clyburn safe and create a new Democratic district. The problem is that I wanted to create a new African American majority seat but I was unable to. Maybe the new district could be branded as a coalition district since Whites are a minority. This plan will probably not pass if Republicans control the legislature and the Governorship. Anyway, my next map will be Georgia or Minnesota. There will be no “different state” on the poll this time. Yes, I love giving polls and I have been asking the same question, I will admit. I guess I do not need to explain what the rankings mean. Well, here is the link to the maps http://frogandturtle.blogspot….

District 1 Henry Brown (R) Blue

Yes, I had to strengthen him even though I did not want to. He won by 4 points against openly lesbian Linda Ketner. In South Carolina, such a narrow win against an openly gay candidate is humiliating to Brown. I strengthened Brown by removing most of Charleston County (his district connects by water.) He should be safe with a strong base in Horry County and the Republican parts of Charleston County. I think McCain won this district with about 60% of the vote. Racial stats are 15% African American, a few points lower than the percentage for the current 1st and 78% White. Status is Safe Republican.

District 2 No Incumbent Green

This was my failed attempt at an African American majority district. It takes in most of Charleston County and Democratic parts of Berkeley and Dorchester Counties. I know I am going to get criticisms for not exchanging some parts of the 2nd district with the 1st. I wanted to make the White population a minority here so I could form a coalition district. I am not sure if I can do that with such a low Hispanic population. This district also takes in every Democratic area near the coast and even snakes up into heavily Republican Aiken in Central South Carolina. Even though I could have made this an African American majority district, I had to protect Clyburn without creating a district more convoluted than the old NC-12. Anyway, Obama probably won 58% of the vote here. Racial stats are 46% African American and 47% White. Status is Safe Democrat.

District 3 Gresham Barrett (R) Purple

I know that Wilson won by eight points in the last election but I needed to strengthen the 2nd district. I changed the look of this district a bit by extending it completely up the border of South Carolina and Georgia all the way up to the North Carolina border. I removed all of Richland County (Columbia) and almost all of Conservative Lexington County. Even though Gresham Barrett has his home here, Joe Wilson might take a run because it contains most of his old district. From the looks of the district, only a strong challenger could make this competitive. McCain probably won here with 63% of the vote. Racial stats are 20% African American and 74% White. Status is Likely Republican.

District 4 Bob Inglis (R) Red

Since the South Carolina Up Country is so Conservative Inglis should have no trouble here winning against a Democrat. I made the district even more Republican by removing the inner city of Spartanburg. This district is still based in Greenville and I had the district take in part of Pickens County. I think McCain won here with 64% of the vote. The racial stats are 16% African American (lower than the 20% African American population from the old 4th,) 6% Hispanic and 75% White. Status is Safe Republican.

District 5 Joe Wilson (R) Yellow

Joe Wilson should be strong in his Lexington County base but he should be wary of a challenge from the northern part of the district. An Up Country Republican may take a run at this district and looking at Wilson’s not so large 54% winning percentage from 2008, he may be in trouble in a primary. He should not worry about the general election because the territory the district includes is heavily Republican. McCain probably won here with 67% of the vote. The racial stats are 17% African American and 75% White. Status is Safe Republican.

District 6 John Spratt (D) Teal

Even though I needed to keep the African American percentage high for two other districts, the African American population of this one did not change much. It decreased by one point, to 31%. Since I kept most of the old territory in this district, I believe that Spratt should not worry about a challenge. He has been Congressman since 1982. I think that McCain won with 53% of the vote here. The racial stats are 31% African American and 64% White. Status is Safe Democrat.

District 7 James Clyburn (D) Gray

This district looks a bit convoluted. I had to make it this way to keep it an African American majority district so the Voting Rights Act can protect it and also protect Clyburn. I barely succeeded in keeping the African American population above 50%. I had to extend it all the way up to Spartanburg and I almost sent it into Greenville to take in African American precincts without endangering the 2nd or the 6th district. Clyburn should be safe even from a primary challenge. Obama probably received 62% of the vote here. Racial stats are 51% African American and 43% White. Status is Safe Democrat.

By what margin will Bob Shamansky win?

View Results

Loading ... Loading ...

Louisiana Redistricting Maps

Well, I checked the poll results from my New Jersey map and the most popular result was Louisiana. I next plan to do Minnesota or Georgia so you can help me decide by voting in the poll below. Mainly because of Katrina, Louisiana will lose one electoral vote. Unfortunately, most of the population loss comes from New Orleans, a Democratic stronghold. This means that I had to extend the 2nd district all the way out to Baton Rogue through some marginal territory. My main objectives were to keep the 2nd district at Black majority status, keep the 3rd district safe enough for a Democrat. Charlie Melancon, its current Representative is running for Senate so the district needs to be safe enough for him if he loses the Senate race and decides to return to the 3rd. It also needs to be safe for another Democrat who would replace him if Melancon beats Vitter. I was able to create the majority Black 4th district which is very convoluted. You will see it before I even tell you what color it is. I think the map will create a 3-3 delegation. Trust me, a Republican controlled Legislature and Governorship will never let this plan pass. Feel free to share your thoughts. The link to my maps is http://frogandturtle.blogspot….

District 1 Steve Scalise (R) Blue

This district contains St. Tammany and Livingston Parishes. It contains parts of Jefferson, Ascension, Tangipahoa, and Washington Parishes. I tried to make this district as Republican as possible and I think I got it to be somewhere in the low 70’s. I slightly increased the Black population to 14% and the white population is 77%. Since Bill Cassidy is losing his Baton Rogue based district, he might want to take a run at this one. He probably will lose to Scalise, the current 1st district congressman. This is definitely a safe Republican hold. Status is Solid Republican.

District 2 Joseph Cao (R) Green

Since New Orleans lost a lot of people through Katrina, I had to snake the district up into Baton Rouge. This was detrimental to my plan and may have inadvertently weakened a few Democrats. The district contains all of Orleans Parish, parts of Jefferson, St. Bernard, St. Charles, St. John the Baptist, St. James, Ascension, Iberville, West Baton Rouge and East Baton Rouge Parish. This district barely has an African American majority and I hope that a Democrat holds it instead of Cao by the time they redistrict. It looks to me like a safe hold for a Democrat so we should not worry. Well, the stats are 52% Black and 39% White. Obama’s numbers here were probably between 58% and 64%. Status is Solid Democrat if Cao loses in 2010 which will probably happen.

District 3 Charlie Melancon (D) Purple

Before I tell you more about this district, I just want to say to Charles Melancon that I wish I gave you more Democratic precincts. I removed a lot of the river ones when I gave them to Districts 2 and 4. Anyway, the district has been Conservative while Melancon had it and he has been able to win not by nail biters. Since its original form has not been altered much, he could probably find a way to hold on unless a strong Republican ran against Melancon. Unfortunately, I put in some Republican precincts in East Baton Rogue but I think they should not alter the district too much. They might encourage Bill Cassidy to run in this district. Since he is unfamiliar to the voters outside of the Baton Rogue area, he does not have a strong chance of winning. The stats for the district are 24% Black and 69% White. They are the same as the current demographics for the district so I think Melancon will hold it unless Boustany decides to bail out and not run in the 6th. This district should vote Democratic in statewide elections. Status: Likely Democrat if Melancon runs without the 6th district congressman, Lean Republican if he does not.

District 4 No Incumbent Red

Boy, did I try here to pull off one. I created it to connect precincts with African Americans from Baton Rouge to Shreveport! It meanders along the river then extending across the northern border into Shreveport. It snakes into Monroe to take in a few Black precincts. Still, the northern parishes are Conservative and they drastically reduced the Black percentage of the population. Also, I had to extend the district to the east a bit because the 1st had too many people. I did it reluctantly but the eastern areas should not offset the Democratic areas enough. I do not know who would run here but I think Dan Cazayoux might want to give it a go. Or the guy who almost won the Shreveport seat might try too and since the bases are equal, this could trigger a large primary on the Democratic side. The Black population is 51% and the White population is 44%. This means that the district is now protected under the Voting Rights Act. It resembles the Cleo Fields district from the 90’s but this district is now much more Democratic. I estimate Obama won in this district somewhere in the range of 53% to 57%. Unless the Republicans can find a credible challenger, this district appears to be headed for the Democratic column. Status is Likely Democratic.

District 5 Rodney Alexander vs. John Fleming Yellow

Stats are 26% African American, 70% white. You could say that this district is the leftovers from the 4th district. The 5th district is meant to be safe for whichever Republican wins it. It should be safe for him and McCain probably won it within the 65% range. It contains the northern part of the state except for most of Shreveport, the border with Arkansas and the Mississippi River. Alexander could have a competitive primary with John Fleming but Alexander should probably win because the new 5th contains more of his district. Status is safe Republican.

District 6 Charles Boustany (R) Teal

This district closely resembles the old one. It has a 24% Black population and a 70% white one. I estimate McCain won this in the neighborhood of 66% of the vote. It takes in part of Lafayette and goes up the Texas border almost to Shreveport. John Fleming might take a go at this district but would probably lose to Boustany. This district might be competitive in statewide elections but in national races, the Republican hold it. Status is Safe Republican.  

By what margin will Bob Shamansky win?

View Results

Loading ... Loading ...

Redistricting Map for New Jersey

I drew this map assuming New Jersey will lose a congressional district. I tried to create 10 Democratic districts and 2 heavily Republican districts. I think at least 2 of the Democratic districts are shaky but the other 8 should hold fine. What I did was eliminate two Republicans, create a new Democratic district and strengthen Obama’s percentage in the 2nd district held by Frank LoBiondo. I did not want to go all out and try for an 11-1 Democratic delegation. My first priority was to strengthen shaky Democrats. The next map I will do will be either Georgia or Louisiana. I have not completely decided yet. I am also starting work on a Minnesota map. That is why I put a poll here to see which one you want me to do first. Safe Democrat/Republican means that the incumbent party solidly has a hold on that district. Likely Democrat/Republican means that the district appears solid but could become competitive. Lean Democrat/Republican means that the district is competitive but one party has a lead. Toss Up means the district is 50-50. With a tilt, it means that the party it tilts to has a 55%-60% chance of winning. You can view the maps at http://frogandturtle.blogspot….

District 1: Rob Andrews (D) (Blue)

This district goes far out of the former area. It takes in Salem and parts of Cape May and Cumberland Counties. I gave it all of Gloucester but took out a lot of Camden County. I kept in Camden and some other heavily Democratic towns to keep it safe for Andrews. Obama probably won around 60% of the vote here. The district contains Gloucester County and parts of Camden, Cape May and Cumberland Counties. The stats are 17% Black and 14% Hispanic with a 66% white population. Status is Safe Democrat.

District 2 Frank LoBiondo (R) (Green)

By taking out most of Cape May and adding part of Camden County, I hope I gave LoBiondo enough Democrats to be kicked out. I kept his home in this district so he would not be inclined to run against Rob Andrews and give him a tough race. I do not know who the challenger to Frank LoBiondo would be but I am sure the Democrats in Camden can find someone. I intended to make this district Democratic enough to throw out LoBiondo. The district contains Atlantic County and parts of Burlington, Camden, Cumberland, Cape May and Ocean Counties. I estimate that Obama won it with about 55% to 59% of the vote. The stats are 13% African American, 9% Hispanic and 73% White. Status is Toss Up if Lo Biondo runs, Lean Democrat if he bails out.

District 3 John Adler (D) (Purple)

Since he is a freshman Congressman who barely won in this district, my first priority was to protect him. I removed all of Ocean County from this district. I added part of Trenton and Mercer County which I estimate gives him an extra 15,000 to 20,000 vote margin for Obama. The margin for Obama in Burlington County is about 55,000 votes and Cherry Hill in Camden gave Obama a 10,000 vote margin. Even though I had to put a bit of Monmouth County in for population purposes, it should take more than 15,000 votes away from Adler. The district contains parts of Burlington, Camden, Monmouth and Mercer Counties. I estimate that Obama won here between 59% and 63% of the vote. The stats are 14% Black, 9% Hispanic and 69% White.  Status is Safe Democrat.

District 4 Chris Smith (R) (Red)

As much as I dislike Chris Smith, I decided to give him a safe Republican district. He was elected the same day Reagan was elected so I figured wherever I put him, he would hold his roots. I gave him most of Ocean County and southern Monmouth County, excluding Democratic precincts in Neptune and Asbury Park. I created this district to pack in all the Republicans so I could make the 2nd, 3rd, 6th and 7th more Democratic. The district contains parts of Ocean and Monmouth Counties. The stats for this district are 7% Hispanic and 85% White. McCain probably won this area with a margin between 56% and 60%. Status is Safe Republican.

District 5 Rodney Frelinghuysen (R) vs. Leonard Lance (R) vs. Scott Garrett (R) (Yellow)

Now wasn’t that a good idea to put three Republicans in the same district? There is no question that a Republican will win this district. It contains all of Sussex and Warren Counties with parts of Bergen, Hunterdon, Morris and Somerset Counties. McCain probably won this with 57% to 61%. The question is which Republican will win it? It looks pretty masterful, sticking all these Republicans in the same district. Both Lance and Frelinghuysen are moderates. My biggest worry is that Frelinghuysen will run in the 11th district which I created for a Democrat. With his moderate voting record, Frelinghuysen could win it if he faces weak opposition. If Lance and Frelinghuysen faced off, I think Frelinghuysen would win because he is more entrenched in his district and he has more of it in District 5 than Lance does. Garrett’s old district only contains Sussex and Warren Counties. That could be enough to win. The district contains Sussex and Warren Counties as well as parts of Bergen, Hunterdon, Morris, Passaic and Somerset counties. The stats are 86% White. Status is Safe Republican.

District 6 Frank Pallone (D) (Teal)

I had to remove some heavily Democratic areas such as Plainfield and part of New Brunswick mostly to strengthen the 7th and the 11th districts. Still, I kept enough Democratic areas in to keep the district strongly Democratic. Even though a lot of the district is in Monmouth County, I gave it Democratic areas like Neptune and Asbury Park. Since Pallone has been a Congressman here for awhile, he should be safe. I estimate that Obama won this district with about 58% to 61% of the vote. The district contains parts of Monmouth and Middlesex Counties. The racial stats for this district are 9% Black, 12% Hispanic, 13% Asian and 64% White. Status is Safe Democrat.

District 7 Rush Holt (D) (Gray)

Yes, this district looks very safe for Rush Holt. Maybe I went a little too far to protect him, giving him parts of New Brunswick and Plainfield, heavily Democratic areas. I just wanted to protect him enough to make sure Lance decides not to run against him. I think Holt can handle himself but Lance is a pretty strong competitor. Lance won by 8 points in an open seat race in 2008. He ran in the 7th district and Obama won it. I think half of Trenton and the heavily Democratic areas in Middlesex and Plainfield should keep Holt safe. The district contains parts of Hunterdon, Mercer, Middlesex, Somerset and Union Counties. I estimate that Obama won this district with about 57% to 62% of the vote. The stats are 16% Black, 14% Asian, 13% Hispanic and 56% White. Status is Safe Democrat.

District 8 Bill Pascrell (D) (Light Purple)

I’d like to tell Bill that I am sorry I had to push his district so far out into the not-so Democratic western Bergen County. Still, he should be fine in his district containing all of heavily Democratic Paterson and some other Democratic cities like Passaic. That portion of the county probably voted for Obama somewhere in the neighborhood of 50,000 votes. The Bergen County portion should not be more than 20,000 votes at the highest for McCain. This leaves Pascrell with a district that voted about 57% for Obama. This should be safe unless Scott Garrett surprisingly jumps into the race. That probably should not happen so it looks like Pascrell is safe for now. The district contains parts of Bergen, Essex and Passaic Counties. The racial stats for the district are 8% Black, 26% Hispanic, 7% Asian and 58% White. Status is Likely Democratic.

District 9 Steve Rotham (D) (Bright Blue)

Even though I extended his district far out to the New York border, I think Democratic margins in Hackensack and other Democratic areas will counter the Republican margins by a lot of votes. I think Obama won this district with 59% of the vote but I am not completely sure. This district should be safe for Steve Rotham. It contains parts of Bergen, Essex and Hudson Counties. The stats are 7% Black, 21% Hispanic, 16% Asian and 55% White. Status is Safe Democrat

District 10 Donald Payne (D) (Dark Pink)

I believe he is the safest Democrat in NJ. It was hard for me to keep it majority Black and I barely did. I wish I could give more of this district to strengthen the 8th and 11th but I could not because of the Voting Rights Act. It says that the 10th district will not be protected if it has less than a majority of a certain minority. I virtually tried to keep it the same as it is now. I estimate that Obama won here somewhere in the 85% range. The district contains parts of Essex, Hudson and Union Counties. The stats are 50% African American, 19% Hispanic, 5% Asian and 24% White. Status is Safe Democrat.

District 11 No Incumbent (Light Green)

My biggest fear is that Frelinghuysen will run in this district to prevent a challenging primary in the 5th. I tried to make the district as Democratic as possible and I removed Frelinghuysen’s home from it to discourage him from running here. I was careful to put in towns like Dover and Morristown which are heavily Democratic towns in Morris County. I also slipped this district into Essex County to take in areas that the 10th district did not contain. Even though the 10th contains all the heavily Democratic areas in Essex County, I still found room for some in the 11th district. I also extended it into Union County to take in the moderate suburbs of Westfield and Summit. Obama won them each by about 10 points. I was able to get part of heavily Democratic Plainfield into this district. It should be safe enough for a Democrat. The district contains parts of Essex, Middlesex, Morris, Somerset and Union Counties. I think that Obama won with 54%-56% of the vote here. The racial stats are 9% Black, 9% Asian, 11% Hispanic and 71% White. Status is Toss up/Tilt Democratic if Frelinghuysen runs. Status is Likely Democrat if Frelinghuysen does not run here.

District 12 Albio Sires (D) (Light Blue)

I designed this district to be a Hispanic majority district. I just barely succeeded. Still, Sires should be safe from a primary challenge from a non Hispanic candidate. This is a pretty long and thin district. It stretches from Perth Amboy in Middlesex County and goes up to the Hudson/Bergen County border. The district contains parts of Essex, Hudson, Middlesex and Union Counties. I estimate that Obama won here with about 74% of the vote. The racial stats are 9% Black, 7% Asian, 50.0% Hispanic and 33% White. Status is Safe Democrat.

By what margin will Bob Shamansky win?

View Results

Loading ... Loading ...

Redistricting Maps for Nevada

Nevada Redistricting

According to the population estimates, I decided that Nevada would get a new congressional district even though it was hard hit by the foreclosure crisis. My goal was to create a new Democratic district while protecting newly elected Democrat Dina Titus in the 3rd Congressional district. I believe I succeeded  in packing most of the Republican areas into one district. I made the map with Dave’s Redistricting App which is really fantastic. My next map should be either Louisiana or New Jersey. Enough talk, here is the link to my maps: http://frogandturtle.blogspot….

District 1 Shelly Barkely (D) (Blue)

I gave Barkley a strong Democratic district containing much of Las Vegas and neighborhoods in North Las Vegas with high minority populations. Still, I believe I kept enough heavily Democratic areas out of the 1st to protect Titus and strengthen the 2nd. The district is still minority majority and I believe Barkley or any Democrat will have no trouble winning this district. It probably voted about 66% for Obama. The racial stats are 12% Black, 31% Hispanic, 8% Asian and 46% White. Status is Safe Democrat.

District 2 No Incumbent (Green)

This was the new district I created that I hope will vote Democratic. The current representative is Dean Heller and I put his home in Carson City outside of the district. I hope that will deter him from running here. Even though most of his district is here, it is the more Democratic parts. The district stretches from the northern border, through Reno, along the western border and finally goes to take in some Democratic neighborhoods in Clark County (Las Vegas.) I think 20% of the district is in Clark County and 60% is in Reno. This would almost ensure that if a Democrat is elected, he or she will be from Reno. Looking at the numbers, Obama won the northern part of the district by about 13,000 votes but I am not sure of his margin in the Clark County portion. I estimate that he still won about 53%-55% of the vote in this district. That percentage should be enough to elect a Democrat. The racial stats for this district are 3% Black, 24% Hispanic, 6% Asian and 64% White. Status is Lean Democrat.

District 3 Dina Titus (D) (Purple)

I definitely strengthened Dina Titus enough by giving her some precincts that were formerly in the 1st district and by taking out Republican parts of Henderson and the outer Las Vegas suburbs. I believe the district is too Democratic for Jon Porter. He will probably run for the Republican 4th district. Dina Titus should worry about nothing except that she might face a minority candidate in the primary. Whatever way it goes, this district is in Democratic hands for the foreseeable future. It probably voted around 61% for Obama. The racial stats are 10% Black, 31% Hispanic, 8% Asian and 49% White. Status is Safe Democrat.

District 4 Dean Heller (R) (Red)

This district is where I put most of the Republicans. It looks like it is centered in the “Cow Counties” or the counties outside of Clark and Reno Counties. Actually, it is based in Clark County and takes in Republican parts of Henderson. Even though I put Dean Heller’s home in the 4th district, I believe that Jon Porter or another Clark County Republican would run for this district. Dean Heller is a relatively new representative and he would definitely face trouble. Since most of the constituents live in Clark County, Heller will have to struggle to introduce himself to the people there. Still, I think it would be easy for a Clark County Republican to brand Heller as a Republican from the far corner of the state. Heller will probably lose but the district will most likely remain Republican. It probably voted about 56% to 59% for McCain. Racial stats are 4% Black, 18% Hispanic, 5% Asian and 70% White. Status is Safe Republican

By what margin will Bob Shamansky win?

View Results

Loading ... Loading ...