MO-Sen turnout notes and some reality too

We’re doomed, oh what a world! At least according to people who have never been wrong about the future like NRO. Those dudes sense that total doom awaits because Robin Carnahan’s vote total didn’t beat Roy Blunt’s in St. Louis County. (They had to be reminded that STL City is it’s own entity, but still, obviously they’re experts)

So here’s the map.

The overall totals were 64% of votes cast for the Republicans running for the Senate, and 35% cast for the Democrats. Which can be categorized as a lousy turnout on our side. After all, with zero competitive state primaries and 99 degree heat in KC (and apparently a lot of heat in STL too), don’t we know that we’re just supposed to automatically vote?

Also, if you believe the people who are either going to lean on Carnahan/Blunt totals, or turnout. Then obviously everybody voting in the Democratic primary was a Democrat and everybody voting in the Republican primary was a Republican. I’d imagine in their world, people were picking up Republican ballots, not because there were lots of competitive visible races in their primary, but because they’re all diehard Republicans now. (And goodness forbid, I doubt any Democrats voted in Republican primaries, because doing that would make them melt. Kind of like garlic to vampires.)

MO-7, MO-4, SD6 (Jeff City Area), SD28 (It’s shaped oddly), SD8, SD2 (could you blame a St. Charles Dem who’d vote against Cynthia Davis?). None of those had any influence on the turnout, i’m sure.

The last year has not been the model of how to do various political things, nationally or otherwise. But at the same time, beating an entrenched DC Republican is not supposed to be easy. So 64-35 is ridiculous. But you know that’s not how it breaks down in November.

Analysis of Blunt v. Carnahan PPP poll

Public Policy Polling, 11/13-15, 769 voters

Carnahan (D) 43%

Blunt (R) 42%

Undecided 15%

Blunt 53%

Purgason 16%

Undecided 31%

Carnahan (D) 42%

Purgason (R) 35%

Undecided 23%

More info under the fold

Favorable/Unfavorables

Obama: 43/52

Carnahan: 40/36

Blunt: 30/38

Purgason: 7/14

Congressional Democrats: 27/58

Congressional Republicans: 21/62

“Next year do you think you will vote in the Democratic Primary, the Republican primary, or will you not vote in a primary?”

Democratic 41%, Republican 41%, Not Sure/Won’t Vote 18%

“Do you think that Congressional Democrats are too liberal, too conservative, or about right?”

“Do you think that Congressional Republicans are too liberal, too conservative, or about right?

59% say Dems are too liberal, 29% say Reps are too liberal. 12% say Dems are too conservative, 43% say Reps are too conservative. 29% say that Dems are about right, 28% say that Reps are about right.

During Roy Blunt’s 13 years in Congress do you think he has been part of the problem or part of the solution when it comes to huge deficits and too much government spending?

Problem: 65%

Solution: 35%

If you are a Democrat, press 1. If you are a Republican, press 2. If you are an independent or identify with another party, press 3.

Democrats: 36%

Republicans: 32%

Independent/Others: 33%

How about some internals?

82% of Dems approve of how Obama’s doing his job, 88% of Reps disapprove of Obama’s job performance, Indys split 59/32 unfavorable. Obama’s best demo is 18-29 (46/44) and his worst is 65+ (57/37). 816 (KC area) and 314 (STL) approve of Obama, the rest disapprove by 30 points or more.

53% of Republicans view Blunt favorably, 53% of Democrats view Blunt unfavorably, with 30%+ unsure on both sides. Indies split 44/23 unfavorable. Blunt doesn’t top 32% amongst any age demo. Amongst 417 (SW MO) respondents, Blunt has 38% favorability and 38% of people viewing him unfavorably. Yes, amongst his “base”, for every person who likes him, someone dislikes him.

67% of Republicans view Carnahan unfavorably, 74% of Democrats view Carnahan favorably. Indies split 40/33 unfavorable. Carnahan’s best Demo is 46-65. The least certain demo is 18-29 (37% unsure). Robin has a positive with 314 and 816, and is within 10 with 660 respondents.

82% of Republicans picked Blunt, 83% of Democrats picked Carnahan. Indies split 44/32 Blunt. Carnahan wins 18-29 and 46-65. Carnahan wins 314 and 816, Blunt wins 417, 573 and 636 by 15+. Blunt wins 660 by a 42/35 margin.

10% of McCain voters will vote in the Democratic primary, 5% of Obama voters will vote in the Republican primary. (originally I did McCain/Obama splits before getting to the DRIs and editing. But this is more interesting than the DRI split here)

Blunt beats Purgason, 61/10 amongst Republicans and loses Democrats who got lost and who’d vote in a Republican primary, while winning 37/24 amongst Independents.

60% of Democrats view Congressional Democrats favorably, 94% of Republicans view Congressional Democrats unfavorably. Indies split 66/17 unfavorable. 40% of 18-29 view them favorably, and every other Demo is baaad for the Congressional Democrats. Only 314 respondents view Congressional Dems favorably.

44% of Republicans view Congressional Republicans unfavorably, 38% of Republicans view Congressional Republicans favorably. 79% of Democrats view Congressional Republicans unfavorably. Indies split 68/14 unfavorable. 18-29% is 30% favorable, 65+ is 53% unfavorable, the best showings for the Grand Obstructionist Party. 417 respondents had a 20% net unfavorable, a high for the Republicans.

57% of Democrats think Congressional Democrats are just right. 21% say too conservative. 22% say too liberal. 91% of Republicans say Congressional Democrats are too liberal. 46-65 are the best demo for “just right”.

50% of Republicans think that Congressional Republicans are just right, and 38% think that Congressional Republicans are too liberal. 73% of Democrats say that Congressional Republicans are too conservative. 36% of 18-29s say that Congressional Republicans are too liberal, compared to 35% in that demo..

36% of Republicans think that Blunt’s part of the problem, to go along with 83% of Democrats. But 48% of McCain voters think that Blunt is part of the problem. 74% of Indies think that Blunt is part of the problem.. Around 73% of voters from 18 to 45 think Blunt is part of the problem.

And how about some maps?

Roy v. Robin

Obama’s job approval

Blunt, problem or solution?

Conclusions

1) Robin Carnahan has some room to expand amongst some favorable demographics (18-29).

2) Roy Blunt’s base likes him as much as base Republicans liked John McCain.

3) Nobody know who Chuck Purgason is, but his polling numbers exceed his name recognition.

4) People in the KC and STL areas still like Democrats.

5) Roy Blunt is a Washington Insider who is part of the reason for the problems we’re seeing today, and people at least see his time as a GOP leader as a problem.

6) Independent voters don’t like anybody.

7) Congress isn’t popular. Good luck to any current Congressmen who were Republican leaders on selling themselves as outsiders.

Florida Redistricting using the DRA

Dave’s Redistricting Application brought us this fun.

A summary of the districts

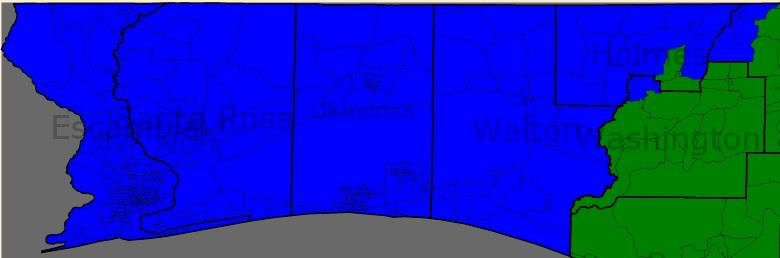
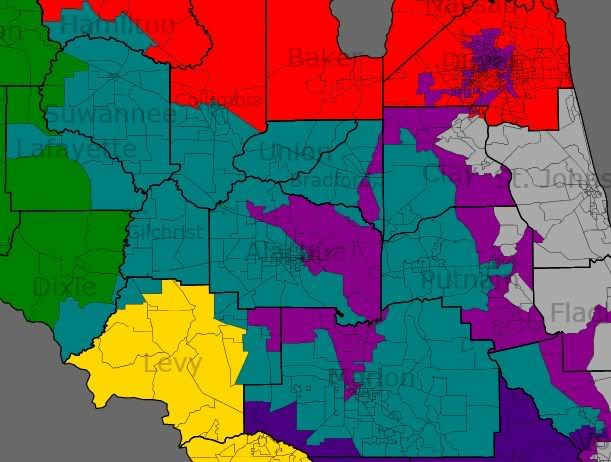
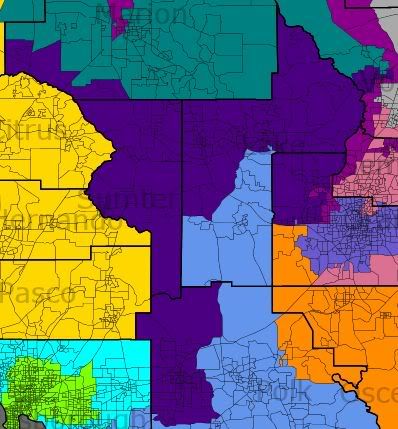
FL-1 (Incumbent Jeff Miller [R], pop. 704958, 76% white/14% African-American): This district removes the coastal tail in Okaloosa/Walton Counties and it shrinks overall (except some tracts in Jackson County). Overall, it should be Republican as usual.

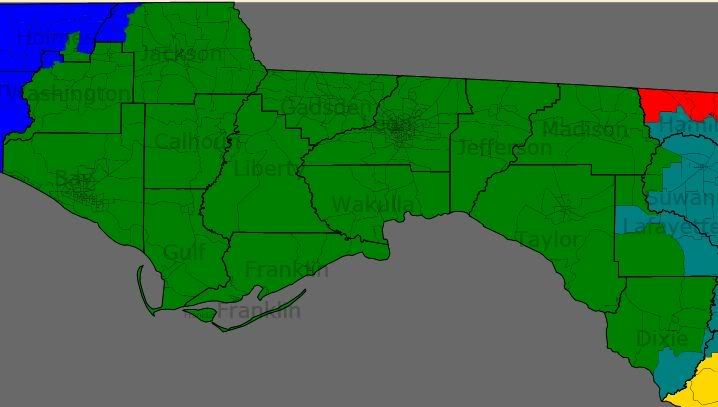
FL-2 (Incumbent Allen Boyd [D], pop. 704923, 67% white/25% African-American): This district was previously 72/22 white. It adds CD4 in Madison County westward and Washington County. It loses Suwanee County and parts of Taylor and Dixie Counties. It should be fine for Boyd and likeminded Moderate Dems.

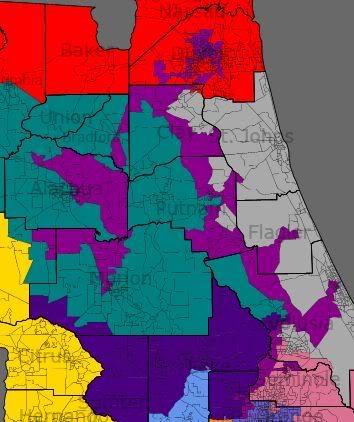
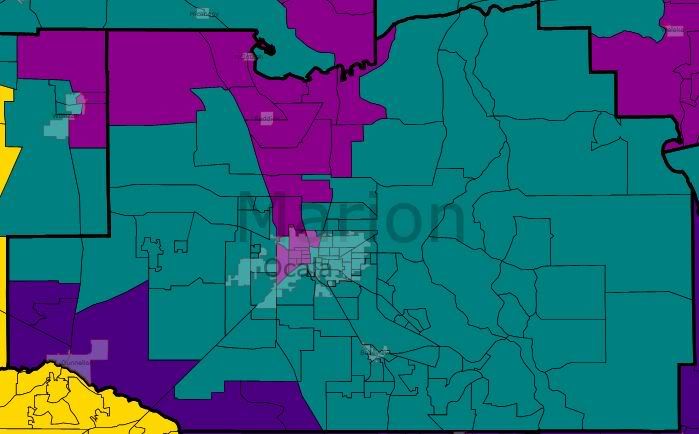
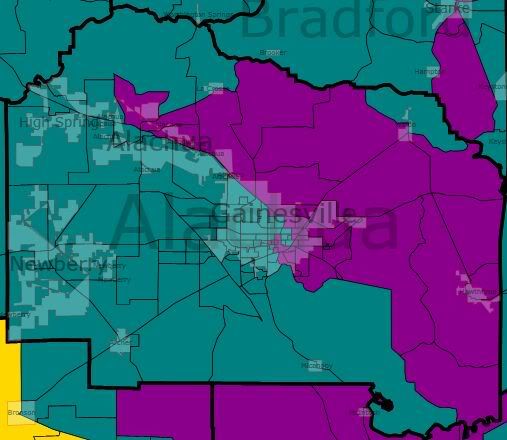
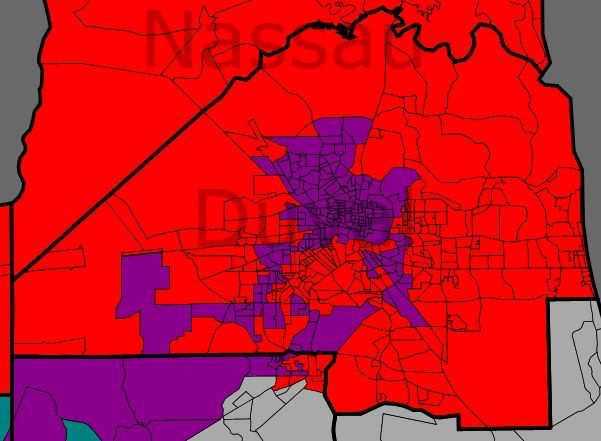
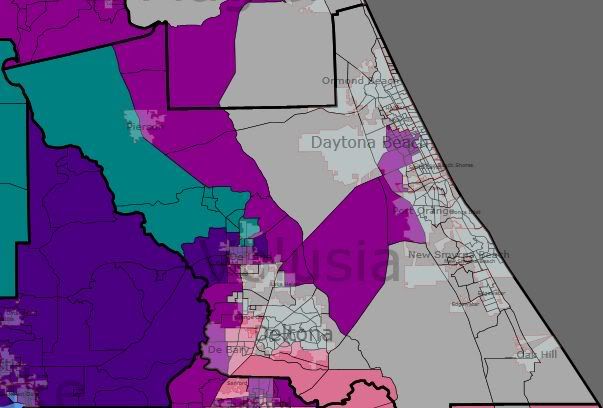
FL-3 (Incumbent Corrine Brown [D] pop 704874, 45% African-American/43% White): This district resembles the 1992 version of this district, which is probably not ideal since the 1992 version of this district got struck down by the Supreme Court. The district starts in Ocala, moves north, takes in part of Williston, includes parts of Gainesville, includes a slice of Starke, then it moves north to include parts of Jacksonville, it goes back south through Clay County, then it goes to Palatka, then includes part of Palm Coast, it goes farther south, takes in part of Daytona Beach, DeLand, Sanford, and ends with part in Apopka, and some tracts near Orlando. Overall, I’m not satisfied with the final product in regards to VRA. But the 2000 district was 49/38 African-American.

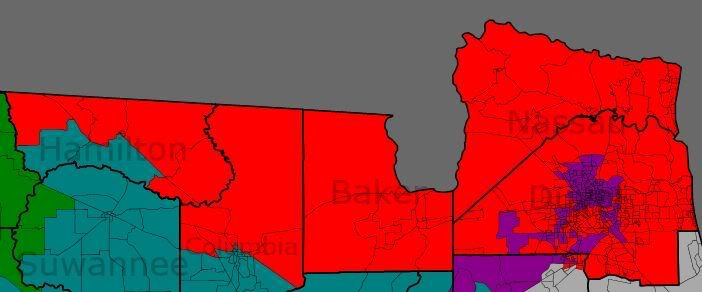
FL-4 (Incumbent Ander Crenshaw [R], pop. 704958, 75% White/14% African-American): This district is actually not as white as the 2000 district, despite losing random appendages and taking in more of Jacksonville.

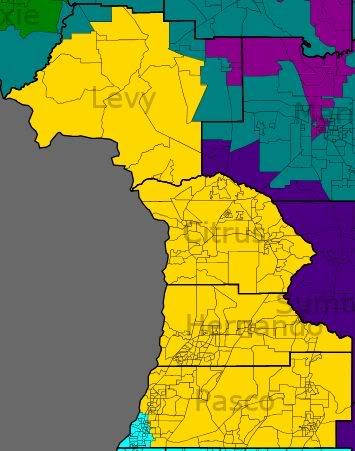
FL-5 (Incumbent Ginny Brown-Waite [R], pop. 704953, 83% White/5% African-American): This district gains coastal parts of Pasco County. It loses Sumter County and anything east of Citrus/Hernando/Pasco.

FL-6 (Incumbent Cliff Stearns [R], pop. 704932, 78% White/9% African-American): This district changes shape quite a bit and wraps around the 3rd.

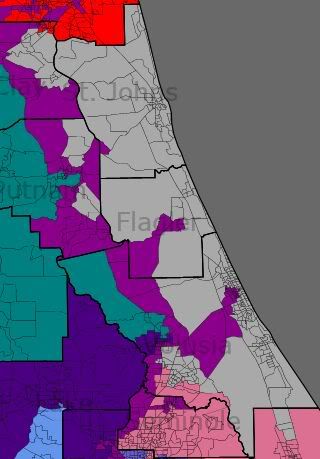
FL-7 (Incumbent Suzanne Kosmas [D], pop. 704882, 82% White, 6% African-American): Kosmas current district [the 24th] is also whiter than this district. Since putting Mica’s house in the 7th wasn’t as practical as putting Kosmas’ house in the 7th, this arrangement was decided upon.

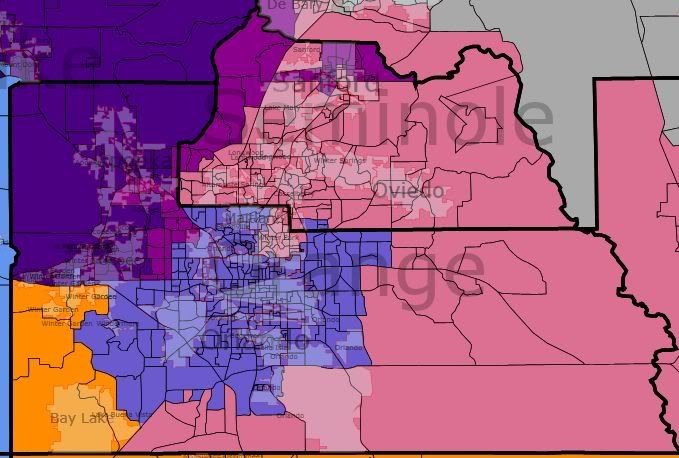
FL-8 (Incumbent Alan Grayson [D], pop. 704986, 48% White, 26% Hispanic, 20% African-American): Not only is this a total gift of a district for Grayson, it’s also not a horrendous gerrymander. The district unites Orlando in one district.

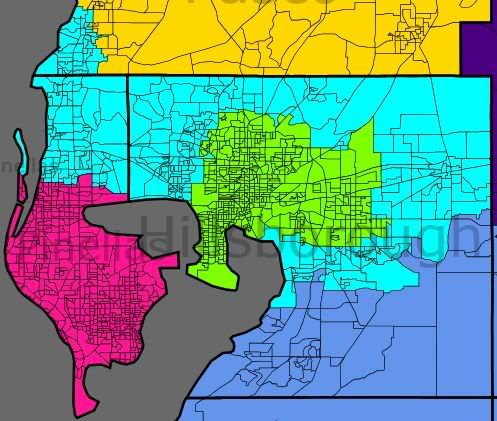
FL-9 (Incumbent Gus Bilirakis [R], pop. 704968, 75% White, 15% Hispanic, 5% African-American): Gus gives up parts of the coast on Pasco, and his district wraps around FL-11 now. And the White percentage drops here while the Hispanic percentage surges upwards.

FL-10 (Incumbent Bill Young [R], pop. 705002, 76% White, 12% African-American, 8% Hispanic): Here, the White percentage also drops, and we get a logical looking district including St. Petersburg.

FL-11 (Incumbent Kathy Castor [D], pop. 704964, 50% White, 23% Hispanic, 21% African-American): Despite making this district look logical, the demographics don’t particularly change.

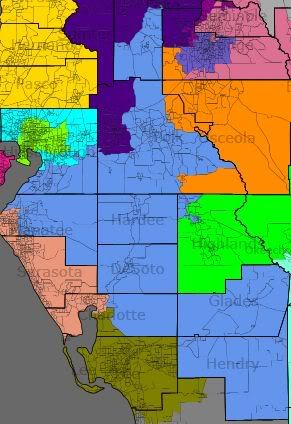
FL-12 (No known incumbent, pop. 704768, 66% White, 20% Hispanic, 11% African-American): This district basically meandered since it was one of the last ones I did and it took in a lot of extras from everybody else. Depending on who wins the FL-12 election, this district may or may not have an incumbent.

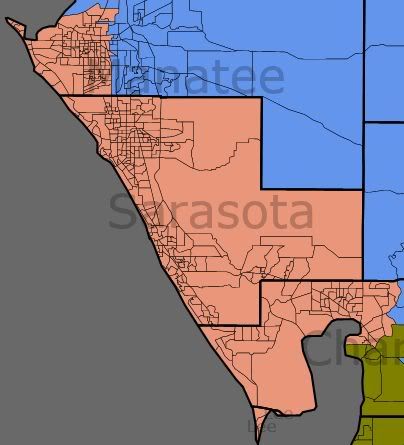
FL-13 (Incumbent Vern Buchanan [R], pop. 704933, 82% White, 9% Hispanic, 6% African-American): The district shrinks, and actually includes African-American majority areas in Bradenton.

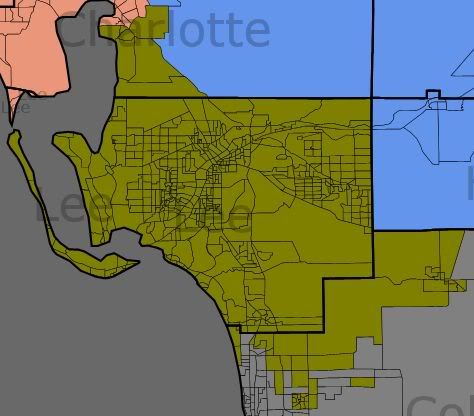
FL-14 (Incumbent Connie Mack [R], pop. 704899, 70% White, 21% Hispanic, 7% African-American): Adios Naples, Hola parts of Punta Gorda. Also, Hola giant surge in Hispanic percentage.

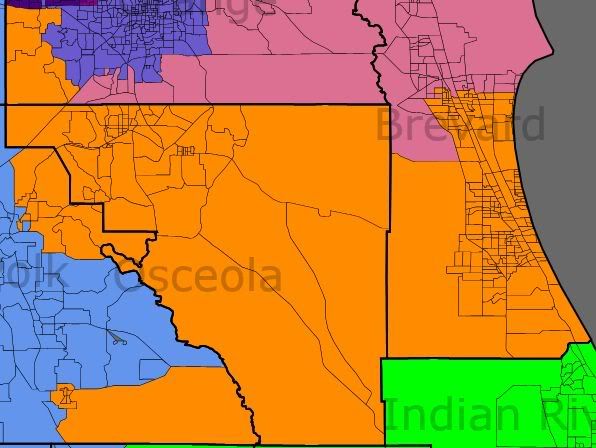
FL-15 (Incumbent Bill Posey [R], pop. 704991, 64% White, 23% Hispanic, 10% African-American): Well, hey… the minority population almost doubles. Posey loses Cape and gains Bay Lake/LBV.

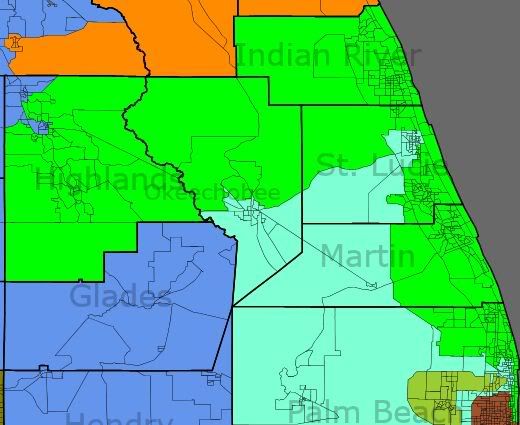
FL-16 (Incumbent Tom Rooney [R], pop. 704935, 80% White, 11% Hispanic, 6% African-American): This district is one of the few to not have a higher minority population. It also looks a bit more normal now. It loses anything south/southwest of Highlands County, it gains Jupiter going down the beach.

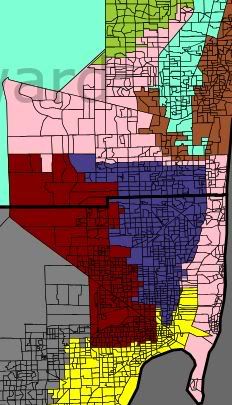
And let’s go out of sequence for a one moment.


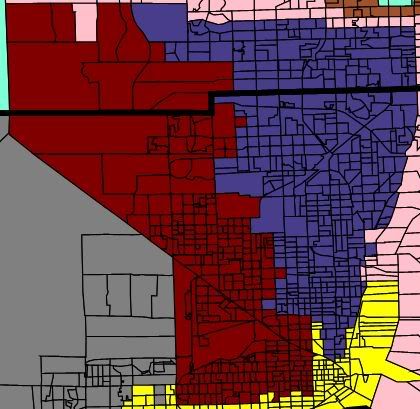
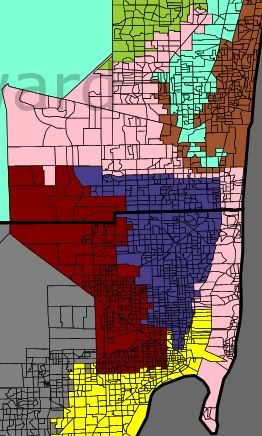
FL-21 is in red, FL-17 is in blue

FL-17 (Incumbent [fill in blank] Meek [D], pop. 704893, 52% African-American, 27% Hispanic, 17% White): The Hispanic population goes up, the African-American population goes down, and the representative is named Meek.

FL-21 (Incumbent Lincoln Diaz-Balart [R], pop. 704902, 82% Hispanic, 12% White, 5% African-American): Lawsuit bait, as serious packing is being undertaken here (from 69% to 82% Hispanic). If you don’t know your Miami-Dade, this district is now more compact around Hialeah.

And now back to sequence.


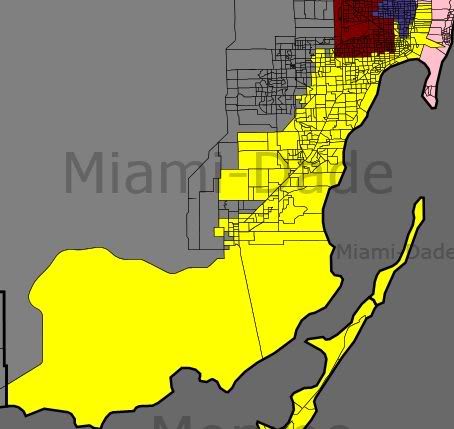
not pictured: Key West

FL-18 (Incumbent Ilena Ros-Lehtinen [R], pop. 704887, 55% Hispanic, 30% White, 13% African-American): Also a bit of lawsuit bait, as the Hispanic percentage goes down by 7 points.

FL-19 (Incumbent Robert Wexler [D], pop. 705015, 72% White, 16% Hispanic, 8% African-American): This district is being smoothed out a bit due to other changes around, and it keeps the same basic shape.

FL-20 (Incumbent Debbie Wasserman Schultz [D], pop. 704927, 53% White, 33% Hispanic, 10% African-American pop. 704872, 50% White, 32% Hispanic, 14% African-American): I probably drew this wrong (and it is a lot more Hispanic than the current district). It moves from Miami Beach up to Weston and Davie.

FL-22 (Incumbent Ron Klein [D], pop. 704918, 58% White, 24% Hispanic, 14% African-American, pop. 704996, 60% White, 24% Hispanic, 12% African-American): The district looks normal, the Hispanic percentage doubles, the African-American percentage triples.

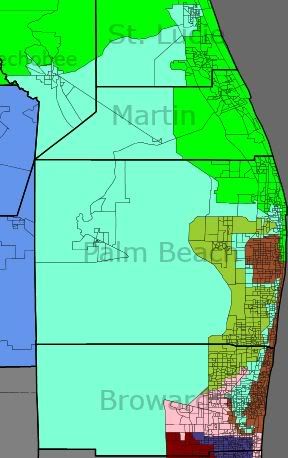
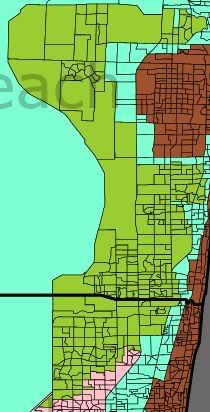
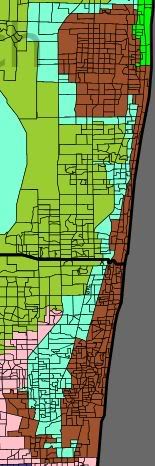
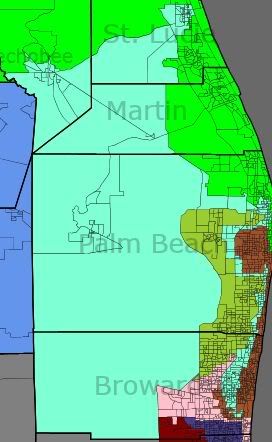
FL-23 (Incumbent Alcee Hastings [D], pop. 704982, 49% African-American, 32% White, 16% Hispanic pop. 704959, 47% African-American, 33% White, 17% Hispanic): Travelogue time. The district starts in Hollywood, goes north to Fort Lauderdale, Deerfield Beach, Delray Beach, Boynton Beach, then west, then north, then east, then there’s West Palm Beach, then a bunch of underpopulated large tracts are included, along with Fort Pierce and Okeechobee.

FL-24 (No Incumbent, maybe, Pop. 704976, 74% White, 12% Hispanic, 11% African-American): This was the northern part of the unallocated lands covered by FL-12. If Dennis Ross is the next Rep in FL-12, then this would be his district.

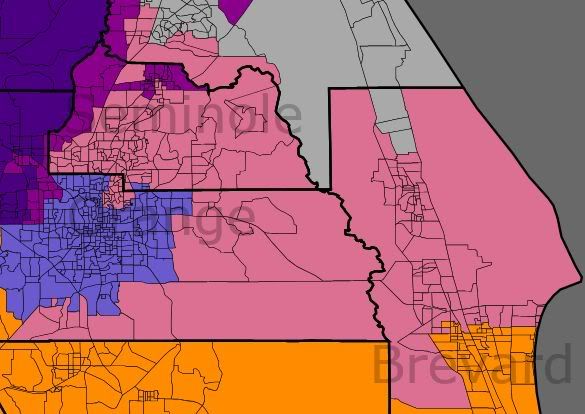
FL-25 (Incumbent John Mica [R], Pop. 704957, 70% White, 17% Hispanic, 8% African-American): This district is a lot more Hispanic than Mica’s current district, and I think it includes a lot of the current FL-24.

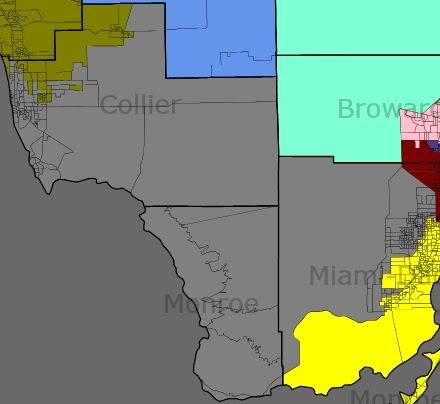
FL-26 (Incumbent Mario Diaz-Balart [R], Pop. 704957, 60% Hispanic, 35% White): The only huge difference is that the African-American population dropped from 10% to 3% as unincorporated Miami-Dade (West Perrine) was put in FL-18. The district gains Naples, drops Homestead, gains some areas that were in FL-21.

In this first attempt of a map, several things occur.

1) Alan Grayson’s electoral hopes are probably improved and he won’t run up as much mileage going from event to event.

2) FL-3 is the target of several lawsuits.

3) FL-21 is the target of several lawsuits.

4) FL-22 is made bluer, FL-10 is made bluer, and FL-6 is confused.

So. Any thoughts at this first attempt at a map?

Redistricting MO with Dave’s redistricting App

This time, we’ve got an internet application to play with.

The task of dividing Missouri into 8 districts with the population estimates is still a nightmare.

When it comes down to it, the best possible deal for an 8 district map is a 4/4 delegation split. Best possible, without a gerrymander. Currently the delegation is 5 Republicans/4 Democrats.

With all the momentum of under two hours of work, here’s an attempt to split the state into 8 districts with a 4/4 split.

First, the STL districts.

The 1st district (Blue): 738926 people, 45% white, 49% African-American

The 2nd district (Green): 738908 people

The 1st district walks a balance between helping the 2nd, and also keeping the legislators in that area happy enough to actually approve such a map. The 1st moves west into Maryland Heights and south in the city of St. Louis. Ideally, the district would still go 2 to 1 for Democrats, at the very least. A drop from 3 to 1, but still a good solid district. Here’s a before/after of the lines. Most of the tracts moving from the 1st to 2nd were coincidences from the tractpoking that was done to form the district.

The 2nd district includes the homes of Todd Akin and Russ Carnahan. The district also includes a chunk of Akin’s STL county district (except for Chesterfield). As well, a part of Jefferson County, and Russ’ South County district are in the district unsplit. Ideally the district would be 50/50.

As for the third district (pop. 738910)

Officially, this district is open. It combines Boone County, one of the emerging Democratic votegetting counties, with the rapidly blueing St. Charles county. Along with the I70 corridor and some other counties in the area.

Cole County is split with Jeff City in the 3rd and the rest of the county in the new 4th district. Franklin County’s split puts the northern part of the county in the 3rd and the southern in the 8th.

As for the 4th district.. it’s a sign of the ridiculous nature of the 4th that you can’t fit it into an image on the minimum zoom.

Yes, really. The realities of the corridor district kind of makes this district ridiculous. As well, Sam Graves and Blaine Luetkemeyer both live in this district. The population in the new 4th is 738858. The only split in it not already covered is two tracts in Camden County near Osage Beach (which are in the 9th district, instead of the 4th). Unfortunately for candidates, this district is huge, covers multiple TV markets. As well, we can only break it down by region. Buchanan and Platte should be Dem friendly, the Northwest Corner is more Republican, North Central Missouri is a fusion of co-ops and Republican voting, the Northeast corner of Missouri could be a good Dem area. The Northeast part of the district between Kirksville and Moberly could also produce a good showing for Dems. But a lot of this depends on who the candidates are, and if they’re great at exhaustive campaigning. 44 counties in one Congressional district might be a record for this state.

The 5th district (pop. 739048) is slightly more compact.

The temptation to put some of the Republican parts of Jackson County somewhere else is still there. But when the county is 60/40 blue, then it’s not a huge pain to have to put up with parts of EJC, or with Cass County. Cass County kind of got cut up in the quest to get within 100 of the ideal district population.

As for the 6th district (pop. 738852), it’ll be more competitive when it’s opened up by retirement. But it’s a challenge.

The district obviously adds Clay County. It loses a sliver of Jackson County, along with Webster County and parts of Cass County. The district also gains ground in Polk, Camden and Phelps Counties. Ideally, the combination of traditionally Democratic areas in West Central Missouri and Clay County could outmuscle the traditionally Republican lean of the rest of the district.

My apologies to Phelps Countians for the splitting of their county.

The 4th and 6th could switch numbers on this map so that Ike Skelton is the incumbent in the 4th, Sam Graves is the incumbent in the 6th, and they won’t have to order cards with new district numbers on them.

As for the 7th (pop. 738989).. it is what you think it is

It picks up the rest of Taney County, Webster County, a tract in Wright county, and Ozark County. It loses part of Polk County. It’s still very Republican.

How about the 8th district (pop. 739114)?

The eighth loses it’s portion of Taney County, loses part of Phelps and Wright counties, loses Ozark County. It picks up Southern Franklin and Southern Jefferson Counties, along with Crawford and Ste. Genevieve counties. As to how the 8th splits when a non-Emerson is on the ballot, i’m not particularly sure. But when the two biggest counties in the 8th are strong Republican (Cape and Butler), then that’s a lot of votes to start with.

When it comes to redistricting, barring a great compromise, the map will be drawn or approved by a panel of Federal Judges. But the Republican plan will be closer to 6/2 if they act as how they usually act. They’ll keep the 4th as is and wait. They’ll put Southern Clay County in the 5th. They’ll stack Democrats in the 1st. Russ Carnahan’s house will end up in a Republican 2nd or the 8th.

Basically.. redistricting will be very unpleasant this year unless something unexpected occurs.

But until we get the real numbers, we’re left to mess with an online application in an attempt to see how many counties can fit into one Congressional district. When the real numbers come out, then the computers hidden in the basement of the Capital will be put to work with all the electoral and socioeconomic stats to form the ‘perfect map’

Which will then be exposed within several cycles.

But it’s raining in the KC area. So why not have a diversion for a bit?

MO-Sen: Roy Blunt seriously considering running, seriously

The 2010 saga continues as Roy Blunt confirms what we have only suspected for 2 weeks or so. And he even has a reason to be running, to be an irrelevant roadblock.

Because Democrats are within two seats of holding a filibuster-proof majority in the Senate, “there’s more focus on the fight in the Senate because the minority in the Senate has a bigger voice in the Senate than the minority in the House.”

“That’s a reason to go,” Blunt said of running a campaign to keep Bond’s seat in Republican hands.

It’s a fitting reason, considering Roy Blunt’s main achievement as a Congressman was getting into the leadership and presiding over giving George W. Bush whatever he wanted on a variety of topics.

Many Missouri political observers believe if Roy Blunt were to run for the seat, he would clear the field of possible Republican candidates to avoid a contentious primary.

Out of the candidates mentioned (Blunt, Kinder, Talent, Steelman, and Sam Graves), Blunt is the most likely to successfully nudge others out of the race. Although what you believe may not come to be. Out of the five mentioned, I could see a Blunt/Graves or Blunt/Steelman primary. In both cases, Blunt is the early favorite. But then again, Graves and Steelman have shown their willingness to use large blunt objects on their opponents.

As for a race for the open 7th District. Term-limited Senator Gary Nodler is a reasonable pick to run for the seat since he lost primaries for the seat in 1988 and 1996. Several Southwest Missouri House members are also term limited (such as Jim Viebrock, Ron Richard, Jay Wasson, Bob Dixon). Also, the Springfield media market makes up 3/4ths to 4/5ths of the voters so the safe bet is to bet on Springfield holding the seat. But if a Joplin candidate is nominated, the odds of picking up Greene County would be slightly better (don’t laugh, we’ve won Greene County in MO-7 before).

So in conclusion, should be a heck of an election season.

MO-9 Primary Summary and Look Ahead

The TV market split for the MO-9 primaries

Democratic Primary

Columbia (25K): 54/26 Baker

Hannibal (11.8K): Bode 39, Gaw 32, Baker 26

St. Louis (11K): 44/37 Baker

Kirksville (3133): 49/36 Gaw

Overall, Columbia carried the day for Baker while the strong showing in St. Louis helped increase her margin to 44/31. Bode’s showing in his home market was his only highlight. 4583 of his 6565 votes came from the Hannibal market.

Now, to the Republican primary, under the fold

Columbia (26K): Luetkemeyer 47, Moore 29, Onder 14

St. Louis (21.58K): Onder 46, Luetkemeyer 30

Kirksville (3330): Luetkemeyer 38, Onder 35

Hannibal (3303): Luetkemeyer 46, Onder 32

Basically Luetkemeyer pulled in the Columbia market, and pulled in enough of the rest of the district to hold back Bob Onder’s giant burlap bags of money.

The Hulshof/Steelman primary helped to lead to a 52/48 split. A reverse of 2006 when more voters voted for Duane Burghard than Kenny Hulshof in the uncontested primaries.

The total votes for primary candidates by market

Columbia (51K): 51/49 Republican

St. Louis (32.7K): 66/34 Republican

Hannibal (15K): 78/22 Democratic

Kirksville (6478): 51/48 Republican

Total: 51/48 Republican

(A big thanks to the Hannibal market for keeping it close)

Back in 2006, Hannibal and STL had the exact same percentages. Kirksville voted 65/35 Democratic, and Columbia voted 55/45 Democratic. The shifts is due to people voting for Hulshof in the Republican primary.

So basically the two nominees (Baker and Luetkemeyer) have some things they need to do to win in November.

Baker needs to

a) win a convincing majority in Boone County (which makes up at least half the votes in the Columbia media market). Luetkemeyer would be a favorite for the Columbia market south of the Missouri.

b) make a strong showing in the Hannibal area (which she did well in back in August)

c) Do pretty well in a market that Luetkemeyer did not win: St. Louis. STL gave Burghard 37% in 2006, so Baker can concievably build on her August showing to deal with an opponent who didn’t win the STL market in the primary

Luetkemeyer needs to

a) Hold on to as much of Boone County and Northeast Missouri as possible. He will probably not come close to the 57% that Hulshof won in Boone back in 2006. But he’s from the South End of the district (Miller County)

b) Do well in the traditionally Republican areas of the STL market in MO-9 (Warren, The St. Charles sliver in the district).

The impact of television markets is a bit more obvious in primaries. But this race should be one to watch and it should be interesting to see if we start off even, or if one candidate has a slight lead in the first polls.

MO-9: Heavyweight Dems eyeing open seat?

In a district where the vast majority of local elected officials are Democrats, it appears that the prospect of the first open seat since 1976 isn’t going to be a wasted opportunity.

Roll Call reports (via the Columbia Tribune Politics Blog):

A Democratic source in that state said “credible Democrats will emerge” to run for Congress should Hulshof throw his hat into the wide-open gubernatorial race. Such a scenario may complicate state Rep. Judy Baker’s (D) already slim chances, while offering Democrats the best shot at winning with possible candidates such as former Lt. Gov. Joe Maxwell (D) and former state Speaker Steve Gaw (D).

“EMILY’s List would think [Baker’s] done a noble enough job that they’d stay with her, [but] local politicos would abandon her in droves if Maxwell got in,” the Democratic source said. “There’s s a general feeling, ‘God love her for trying to take on Kenny,’ but she’s probably not a great fit for that district.”

The source added: “Maxwell and Gaw are probably better for the cultural leanings of that district.”

So, the prospects?

I say that Maxwell would be a pretty strong favorite to win a primary. He carried the district easily in his last primary (Lt. Governors primary in 2000). He has a strong base in the northern part of the district, and enough prestige to do well in Columbia. Although Maxwell is someone who may still choose to stay out of this race due to his wife (he chose not to run for re-election in 2004 due to his wife’s health)

Steve Gaw would also be formidable to a degree. Gaw also ran statewide in 2000, and lost to Matt Blunt for Secretary of State.

The possibility of the first open seat primary in Northeast Missouri since 1976 is attracting quite a bit of attention.

In 1976, the Democratic primary had 11 candidates and was won by Harold Volkmer of Hannibal with 34.8% (Joe Frappier beat future state senator David Doctorian on the Republican side)

In 1964, the Democratic primary had 16 candidates and was won by William Hungate with 17.65% of the vote. The Republicans had four candidates that year.

But these were primaries back in the days that having an ultradivided August primary wasn’t considered a bad thing. And these were primaries when there was a strong Northeast Missouri base for Democrats in general elections.

How this all shapes out depends on the candidates. But, MO-09 might be on the board this fall.