This is the fourth in a series of diaries epicting the Democratic victory in this year’s midterm elections. Other diaries in this series can be seen here.
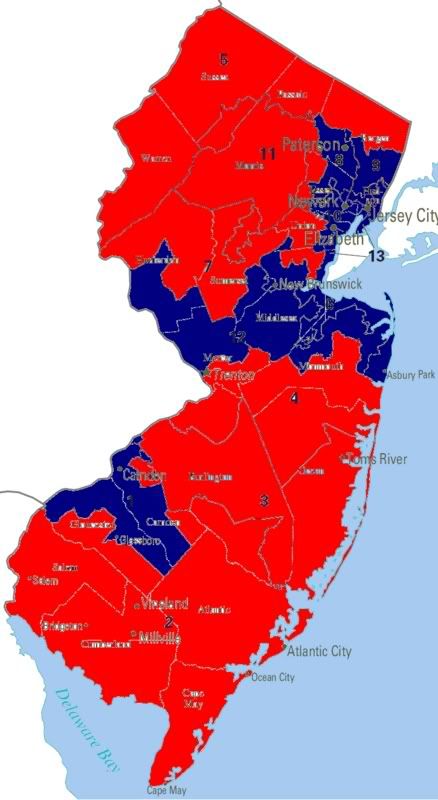
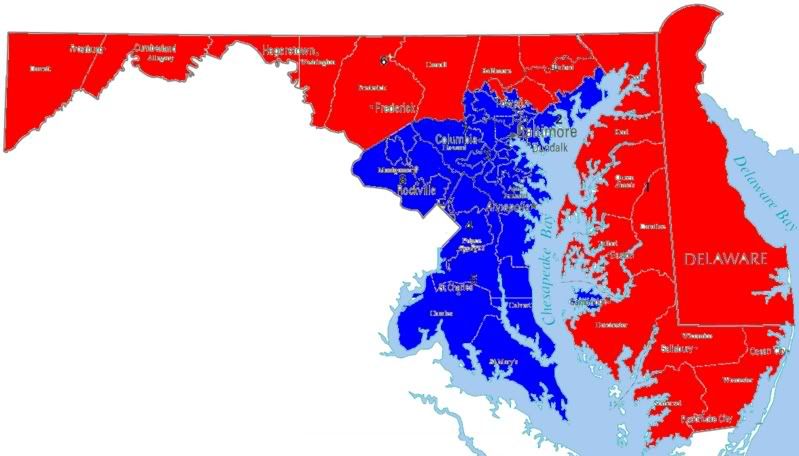
Already covered have been New England, NY, NJ, MD, and DE.
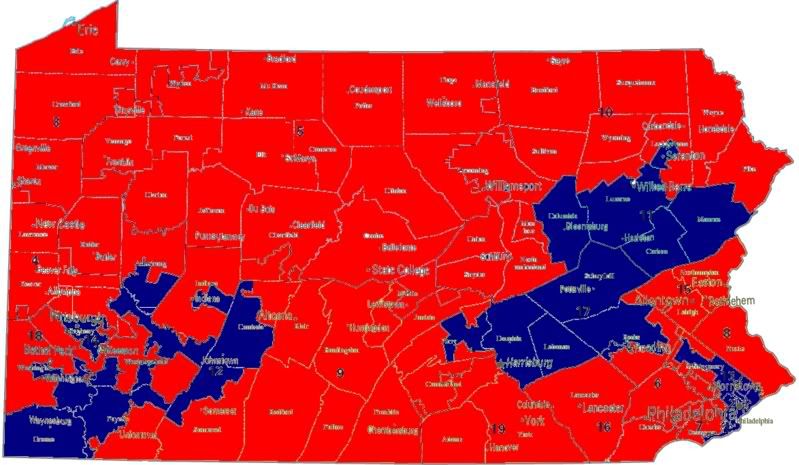
Today’s diary will focus on the Keystone state, the site of great hopes, and as today’s diary will demonstrate a great truth. Pennsylvania really is Philadelphia and Pittsburgh with Alabama in between. First up are the seat control charts.
2004
2006
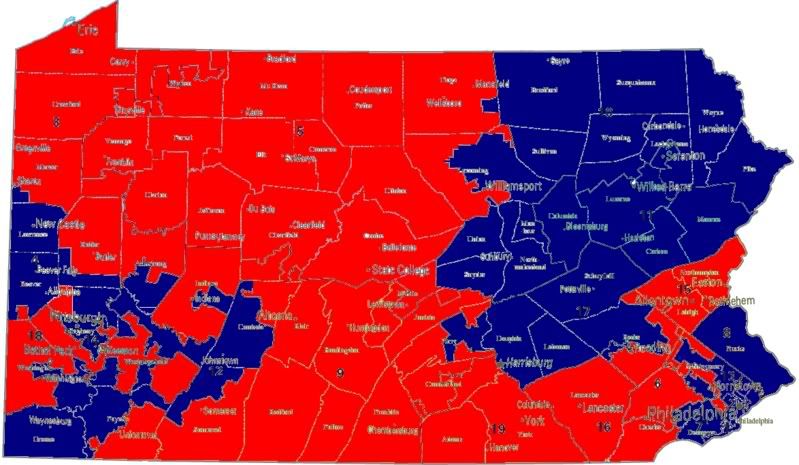
Of 3,938,341 votes cast in 2006 US House races in Pennsylvania, 2,190,947 (55.6%) were cast for Democrats, while 1,698,641
(43.1%) were cast for Republicans.
Democrats defeated Republican incumbents in the PA-04,PA-07, PA-08, and PA-10.
The race I enjoyed the most was the PA-10 (NE Pennsylvania), where poltical newcomer (and politcal scientist) Christopher Carney defeated incumbent Republican Don Sherwood by margin of 12,538 votes (6.1%). The reason I am so excited by this race is because the Democratic party didn’t even run a candidate against Republicans anywhere can be taken down, we just need someone there to push.
In the PA-07 (SW Philadelphia suburbs), Democrat Joes Sestak defeated ethically challenged Republican incumbent Curt Weldon by a margin of 33,291 votes (12.7%) after revelations of suspicious dealings with Russian “businessmen”. Coming in at 56.4%, this was a 16 point improvement of the 2004 Democratic performance at 40.3%.
In the PA-08 (Bucks County, NE of Philadelphia), Democrat Patrick Murphy defeated Republican incumbent Michael Fitzgerald by a narrow margin of 1521 votes (0.6%). Coming in at 50.3% this was a 7 point improvement over the 2004 performace at 43.3%.
In PA-04 (NW of Pittsburgh), Democrat Jason Altmire defated Republican incument Melissa Hart by a margin of 9,280 votes (3.9%). Coming in at 51.9% this was a 16 point improvement over the 2004 performace at 35.9%.
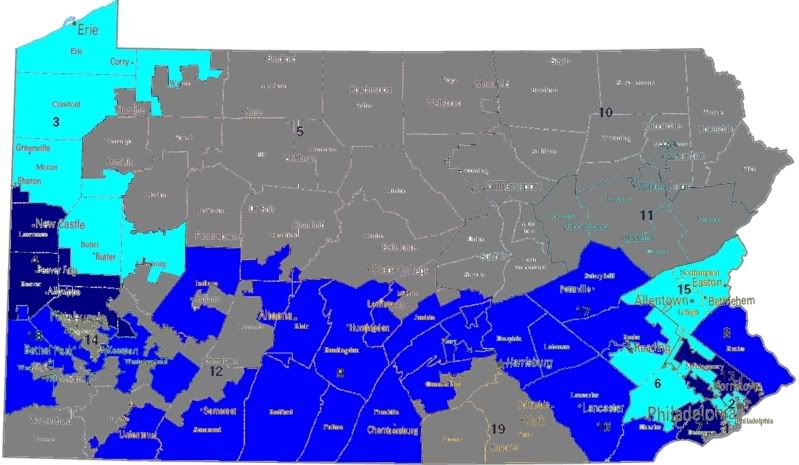
The following map shows Democratic gains over their 2004 Democratic performance in the district (in % terms), improvements of less than 5% will be displayed in light blue, under 10% in the darker blue, and over 10% in the darkest blue. Republican gains will be shown in the same manner, with the light red signifying a gain of less than 5% and so on. Races that were contested in eith of the years will be displayed in gray.
Looking more closely at the margin of victory in 2006 races, Democratic defends and pickup opportunities emerge, the following map displays the margin of victory in 2006 races. The deepest blue represents and Democratic margin of victory over 10%, the medium color represent more than 5%, while the lightest blue indicates that the Democratic candidate won by less than 5%. Corresponding measures of Republican victory margins display progressively darker shades of red at the same intervals.
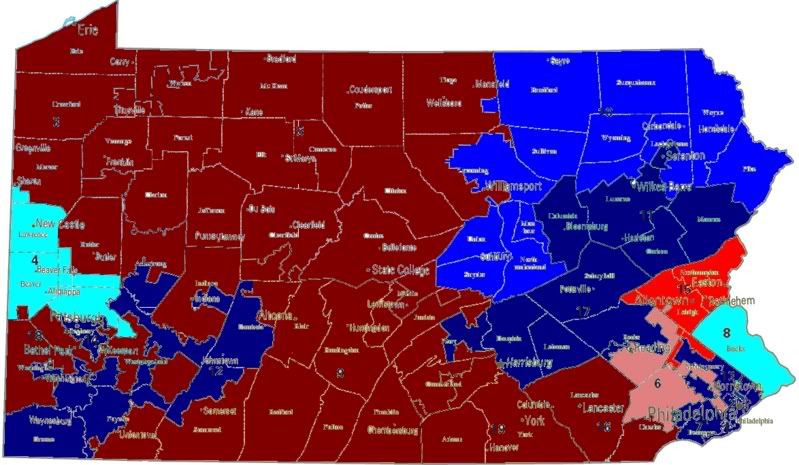
Wow. Pennsylvania really is Philadephia and Pittsburgh with Alabama in between. A really interesting take on this is would be to be to compare the margins from the US House races to the Senate race where Casey crushed Santorum. Nonetheless for House Democrats the situation in the interior of the state looks hopeless, though as the race in the PA-10 shows anything is possible. I’m still puzzled by that one, I hope one of you Philly folks can explain what the hell happened there to me.
What emerges is a map to guide our 2008 strategy. In this series I have created a race tier system that is I will explain in the next few sentences.Tier 0 races are those where the Democratic candidate won by a margin of less than 5%, the presumption being that incumbency grants an advantage of 5-10% that with the fundraising advantage that comes with holding office should be sufficient for these candidates to defend their seats without funding from the party. The assumption that incumbency gives a 5-10% advantage drives the classification of the pickup categories. Tier 1 races are those where the incumbent won by less than 5% in 2006, while tier 2 races are those where Republicans won by less than 10%. It’s really quite simple.
Tier 0
Race D% R% Margin 2006 D Cand.
PA-04 51.9 48.1 3.9 Jason Altmire
PA-08 50.3 49.7 0.6 Patrick Murphy
Tier 1
Race D% R% Margin 2006 D Cand.
PA-06 49.4 50.6 1.3 Jim Gerlach
Tier 2
Race D% R% Margin 2006 D Cand.
PA-15 44.1 52.8 8.7 Charles Dertinger
I’ve created chart below to keep a running total of races that I’ve classifed in each tier for 2008.
Tier 0
CT-02, NY-19, NH-1
Tier 1
CT-04, NJ-07, NY-25, NY-26, NY-29, PA-06,
Tier 2
No races meet the criteria for this tier.
States Covered
CT, MA, MD,ME, NH, NJ, NY, PA, RI, VT


