MD Redistricting D+2

So, I was sitting around thinking to myself that there’s no good reason why Maryland elects 2 Republicans to Congress, and then I remembered that there is: Because the 2001 focus was on ousting Connie Morrella and turning Ehrlich’s district blue. Well, Morrella is gone and Maryland has only trended Democratic over the past decade, so I don’t see any reason why a Massachusetts style delegation should be unreasonable.

Again, I don’t know whether this has been discussed at any great length here, but it took me about 15 minutes to throw together an 8-0 Dem map of Maryland that retains 2 majority-minority districts and actually features more compact districts than the current map.

The key, quite simply, is first splitting MD-06 (Bartlett-R) and joining each half with half of Montgomery County, and then splitting the Eastern Shore MD-01 (Harris) into three districts. The map and the Obama/McCain numbers are after the fold.

MD-01 (Harris-R)

Current: 40% Obama to 58% McCain

Projected: 54% Obama to 45% McCain

MD-02 (Ruppersberger-D)

Current: 59% Obama to 39% McCain

Projected: 56% Obama to 42% McCain

MD-03 (Sarbanes-D)

Current: 60% Obama to 38% McCain

Projected: 56% Obama to 43% McCain

MD-04 (Edwards-D)

Current: 85% Obama to 14% McCain (57% black)

Projected: 88% Obama to 11% McCain (62% black)

MD-05 (Hoyer-D)

Current: 68% Obama to 31% McCain

Projected: 55% Obama to 44% McCain

MD-06 (Bartlett-R)

Current: 39% Obama to 59% McCain

Projected: 62% Obama to 36% McCain

MD-07 (Cummings-D)

Current: 79% Obama to 19% McCain (59% black)

Projected: 70% Obama to 29% McCain (46% black)

MD-08 (Van Hollen-D)

Current: 74% Obama to 25% McCain

Projected: 62% Obama to 37% McCain

So, I’m just curious if anyone can think of a decent reason why the Maryland legislature won’t redistrict the state with 8 Democratic seats. I realize that the black percentage of MD-07 drops notably on my map, but there should be little problem pushing it back up while maintaining the basic partisan performance of the remaining districts.

If I can throw this together in 15 minutes I’m sure the Maryland legislature can figure it out well enough in six months.

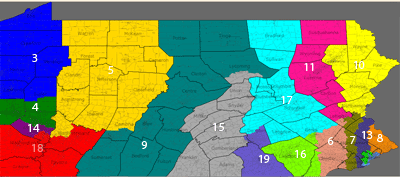
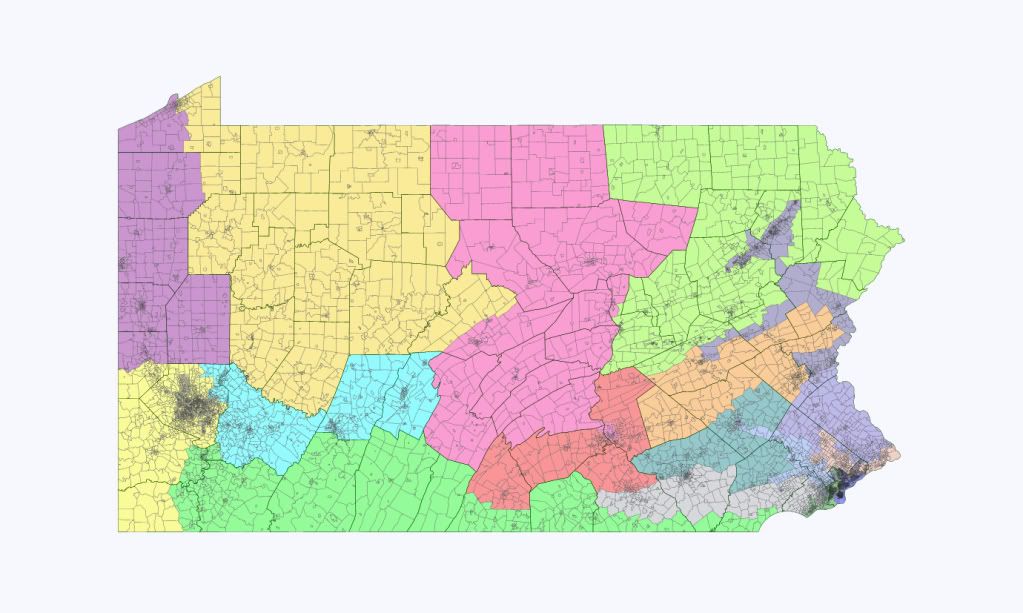
PA Vertica-Mander

Just for fun, I thought I would take one of the worst gerrymanders in the country — Pennsylvania — and see what happened if I vertica-mandered it.  That is, I would start in the northwest corner of the state, and start drawing the districts southward, then back up northward, etc.  I tried to keep counties intact until I got to Eastern PA, when I couldn’t keep counties together and started drawing bacon strips.

Oddly, I think the GOP comes out only a bit worse than under the current gerrymandered map, and if you consider that the GOP has shown an ability to win pretty handily in D+3 or so districts in SEPA, they might even be a touch better off.  

This leads me to believe that tweaking this a bit would lead to a better, much better-looking map.  IE the gross gerrymander was pretty unnecessary.  And honestly, it is unintentional, but a lot of the current Congressmen maintain their present districts.  I guess the population bases are what they are.  I also kept the two Philly districts roughly the same, since the 2d is VRA protected.  But they are kept within the confines of Philly.

Photobucket

1) 79%O 20%M (old 88O, 12M). To keep it within Philly, it gets a bit more of N. Philly.  The AA% drops substantially, but under Strickland that’s acceptable.

2) 91O, 9M (old 90O, 10M) Chk . . . Chk . . . Chaka Fattah (okay, you have to be over 30, or I guess a Ferris Bueller’s Day Off Fan, to get that one).

3) 50O, 48M (old 49O, 49M)

4) 47O, 52M (old 44O, 55M)

5) 42O, 57M (old 44O, 55M) I think Thompson and Shuster might be in the same district somewhere in here.

6) 54O, 45M (old 58O, 41M)

7) 57O, 42M (old 56O, 43M)

8) 55O, 44M (old 54O, 45M)

9) 42O, 57M (ol d 35O, 63M)

10) This actually puts Marino and Dent together. 56O, 43M (old 54O, 45M)

11) 54O, 44M (old 57O, 42M)

12) The old 19th.  48O, 51M (old 43O, 56M)

13) 57O, 42M (old 59O, 41M)

14) 63O, 36M (old 70O, 29M)

15) New District, 38O, 61M

16) 47O, 52M (old 48O, 51M)

17) 44O, 55M (old 48O, 51M)

18) Critz/Murphy together 47O, 52M (old 18th = 44O, 55M, old 12th = 49O, 49M)

TX Redistricting 20R-16D Map

Never done a map, so I thought why not.

First, I have no illusions that there is anyway a map that would have the chance to elect 16 Democrats would ever pass the current legislature, let alone survive a veto by Rick Perry.

I just wanted to see if i could a map that had districts that were a little more compact.

Let me just say that I threw out most of the current map and renumbered the districts and probably ended up redistricting a lot of current reps out of their districts.  

I also threw out the old numbers. I just have this pet peeve about numbering.  I hate to have district 1 and then district 2 on the other side of the state.  You can pretty much follow a trail from NE TX to SE TX, over to Houston, down the coast to the border, up to San Antonio, then Austin, then to El Paso, up to the Panhandle and south, then over and north into DFW.

Photobucket

TX-1, Safe Republican

Blue, NE corner of the state.

76% White, 16% Black, 7% Hispanic, 2% Asian

70% McCain/29% Obama

I think I redistricted Louie Gohmert out of this district and into the 2nd, which contains most of his old district.

TX-2, Safe Republican

Green, east Texas

73% White, 16% Black, 9% Hispanic, 1% Asian

70% McCain/29% Obama

TX-3, Safe Republican

Dark Magenta, SE corner of the state.

63% White, 21% Black, 13% Hispanic, 3% Asian

59% McCain/41% Obama

I gave the Golden Triangle (Beaumont, Port Arthur, & Orange) it’s own district.  I redistricted Ted Poe out of this district.  Although it’s a 60-40 district, I think someone like Nick Lampson could have a chance in it since it contains both Beaumont and Galveston.

Photobucket

TX-4, Safe Republican

Red, just north of Harris County (Houston)

77% White, 13% Hispanic, 8% Black, 2% Asian

73% McCain/26% Obama

Although it has less population than the other districts, it’s a fast growing area that will likely grow.  I also figured why not give the Houston suburbs their own district.

TX-5, Safe Republican

Gold

67% White, 15% Hispanic, 11% Black, 6% Asian

62% McCain/37% Obama

As Houston expands, this area may get more Democratic.  I don’t live in the Houston area, so I can’t say for certain.

TX-6, Safe Democratic

Teal

Majority-Minority

37% Hispanic, 33% White, 24% Black, 6% Asian

60% Obama/40% McCain

TX-7, Lean Democratic

Dark Gray

Majority-Minority

41% Hispanic, 40% White, 14% Black, 4% Asian

51% Obama/48% McCain

TX-8, Likely Republican

Slate Blue

Majority-Minority

47% White, 40% Hispanic, 9% Black, 4% Asian

56% McCain/43% Obama

TX-9, Safe Democratic

Cyan

Majority-Minority

33% White, 31% Hispanic, 29% Black, 6% Asian

67% Obama/32% McCain

TX-10, Likely Democratic

Deep Pink

Majority-Minority

34% White, 26% Hispanic, 26% Black, 14% Asian

55% Obama/45% McCain

TX-11, Likely Republican

Chartreuse

56% White, 22% Hispanic, 14% Black, 8% Asian

56% McCain/43% Obama

TX-12, Safe Republican

Cornflower Blue

59% White, 28% Hispanic, 9% Black, 3% Asian

65% McCain/34% Obama

Ron Paul gets to keep his seat.  This district combines most of the current 14th and 25th CDs.

TX-13, Lean Democratic

Dark Salmon

Majority-Minority

70% Hispanic, 26% White, 2% Black, 2% Asian

54% Obama/45% McCain

Although it’s a lean Democratic district, the right Democratic shouldn’t have trouble holding it.  This district takes in Corpus Christi and Brownsville.

TX-14, Safe Democratic

Olive

Majority-Minority

86% Hispanic, 13% White, 1% Asian

67% Obama/32% McCain

A border district, easy hold.

TX-15, Safe Democratic

Dark Orange

Majority-Minority

88% Hispanic, 10% White, 1% Asian

68% Obama/31% McCain

This district is anchored by Laredo.  Henry Cuellar gets to keep his job.

TX-16, Safe Democratic

Lime

Majority-Minority

71% Hispanic, 20% White, 7% Black, 2% Asian

66% Obama/33% McCain

Encompasses most of San Antonio.  Charlie Gonzalez gets to keep his job.

TX-17, Toss Up

Dark Slate Blue

Majority-Minority

50% Hispanic, 41% White, 5% Black, 3% Asian

50% Obama/49% McCain

This would be my new district.  I took in more of San Antonio and Bexar County and was able to cut down the size of this district.  Rather than stretching to El Paso, it now only goes to Del Rio.  In addition to cutting down the size, I also cut out a lot of the Republican areas in northern Bexar County that really came out in 2010 (such as Fair Oaks Ranch and Stone Oak).  Ciro Rodriguez could probably win this district.

TX-18, Safe Republican

Yellow

64% White, 26% Hispanic, 7% Black, 3% Asian

62% McCain/37% Obama

Democrats in the NE part of Bexar County won’t like it, but I made Lamar Smith’s district much more Republican.  I took those Republican areas from Ciro’s old district (haven’t gotten used to having Canseco yet) and gave them to Lamar Smith.  Austin Democrats should love this district because no longer do they have to deal with Lamar Smith.

TX-19, Safe Democratic

Lime Green

56% White, 30% Hispanic, 8% Black, 6% Asian

68% Obama/30% McCain

Here’s another reason Austin Democrats should love this map…Austin gets its own district.  Welcome back to a compact district Lloyd Doggett.

TX-20, Toss Up

Pink

65% White, 23% Hispanic, 8% Black, 4% Asian

50% Obama/49% McCain

Thanks to Travis, Bastrop, and Hays Counties, this district is a toss up and may continue in the Democratic direction.

TX-21, Safe Republican

Maroon, West Texas and Border

57% White, 38% Hispanic, 3% Black, 2% Asian

71% McCain/28% Obama

This district combines a lot of the current 23rd as well as the current 11th.  This district is dominated by San Angelo, Midland, & Odessa.

TX-22, Safe Democratic

Sienna

Majority-Minority

76% Hispanic, 18% White, 3% Black, 2% Asian

65% Obama/34% McCain

Silvestre Reyes gets to keep his El Paso district.

TX-23, Safe Republican

Aquamarine, Panhandle

66% White, 26% Hispanic, 6% Black, 2% Asian

74% McCain/25% Obama

Republicans keep breaking up Austin, so I thought I’d combine Amarillo and Lubbock and let them fight over one district.

TX-24, Safe Republican

Indigo, West Texas

70% White, 22% Hispanic, 6% Black, 2% Asian

74% McCain/25% Obama

Abilene is the biggest city here.  Charlie Stenholm might have been able to win this district.

TX-25, Likely Republican

Pale Violet Red

69% White, 16% Hispanic, 11% Black, 4% Asian

55% McCain/43% Obama

North of Austin it takes in Williamson County and Killeen.

Photobucket

TX-26, Safe Republican

Gray

67% White, 16% Black, 14% Hispanic, 2% Asian

66% McCain/33% Obama

Waco is the predominant city here.

TX-27, Safe Republican

Red

86% White, 9% Hispanic, 3% Black, 2% Asian

75% McCain/25% Obama

TX-28, Likely Republican

Dark Green

64% White, 24% Hispanic, 8% Black, 4% Asian

57% McCain/42% Obama

Western Tarrant County/Fort Worth.  Depending on where she resides, this district could be ripe in some years for a Congresswoman Wendy Davis.

TX-29, Lean Democratic

Dark Sea Green

54% White, 21% Black, 18% Hispanic, 6% Asian

53% Obama/47% McCain

SE Tarrant County/Fort Worth and Arlington.  If Wendy Davis wanted a better district right away, she could choose this one.

TX-30, Safe Republican

Yellow

80% White, 9% Hispanic, 5% Asian, 5% Black

65% McCain/34% Obama

TX-31, Safe Republican

Khaki

76% White, 11% Hispanic, 7% Asian, 6% Black

60% McCain/39% Obama

TX-32, Likely Republican

Cyan

67% White, 14% Hispanic, 11% Asian, 8% Black

57% McCain/42% Obama

TX-33, Safe Republican

Dark Goldenrod

78% White, 12% Hispanic, 7% Black, 2% Asian

69% McCain/30% Obama

TX-34, Toss Up

Lime Green

Majority-Minority

47% White, 35% Hispanic, 11% Black, 7% Asian

50% Obama/49% McCain

As Dallas goes more Democratic, so should this district.

TX-35, Toss Up

Dark Orchid

53% White, 27% Hispanic, 15% Black, 4% Asian

50% Obama/49% McCain

Second verse, same as the first.

TX-36, Safe Democratic

Orange

Majority-Minority

41% Black, 31% Hispanic, 26% Black, 2% Asian

80% Obama/20% McCain

SSP Daily Digest: 1/13

MA-Sen: No surprises are revealed in the Boston Globe’s post-Vicki-Kennedy-announcement state-of-the-Senate-field story (Mike Capuano, Stephen Lynch, Alan Khazei, and Robert Pozen are the Dems who get the ink). As far as Capuano goes, the story confirms that he’s taking a “hard look” at the race and will make a decision by late spring.

MI-Sen: Here’s some actual confirmation of what everyone assumed a few days ago, that ex-AG Mike Cox’s joining a Detroit law firm meant he wouldn’t be running for Senate in 2012. Cox himself says he’s out of contention, and he talked up his former gubernatorial primary rival, ex-Rep. Peter Hoekstra for the job.

ND-Sen: It’s been clear for a while now that Kent Conrad wasn’t going to be given a bye in his 2012 race, especially now that the GOP seems to be on an upswing in North Dakota. But now it’s looking clearer who the opponent will be: 44-year-old Public Service Commissioner Brian Kalk is forming an exploratory committee. (There are three PSC Commissioners, elected statewide to oversee stuff like utilities and grain elevators.)

NV-Sen: John Ensign seems undaunted by recent polling showing him in deep doo-doo in both the GOP primary and general election for 2012, and says he’s pushing ahead on ahead with his re-election plans, although also admitting that it’s going to be “very, very difficult.” He’s putting together a campaign team and “jump starting” his financial operations (which, considering they’re actually in pieces all over his garage floor, may require a little more than just jump starting). This was revealed yesterday at a rather awkward conference for human resources execs where both Ensign and Dean Heller were speakers; Heller told reporters afterwards that he “would be lying to you if I said I wasn’t thinking about it” and “don’t mind giving voters a choice if it winds up being a head-to-head,” although he also had no timetable for an announcement.

WV-Gov: Five different potential candidates appeared at a forum for the West Virginia gubernatorial race. Not all of them have announced, but this makes pretty clear who’s seriously in the hunt for this (despite the fact that nobody has any idea yet whether the race will be in Nov. 2011 or 2012). Among the Dems, SoS Natalie Tennant, state Treasurer John Perdue, and state Sen. Brooks McCabe were there; representing the GOP were ex-SoS Betty Ireland and state Sen. Clark Barnes. This still leaves out some of the likeliest other candidates, including Dem state House speaker Rick Thompson and acting Gov. Earl Ray Tomblin.

FL-23: Rep. Alcee Hastings, unbeknownst to many, is getting pretty long in the tooth, at 74. He says he has no intention of slowing down, though (not that he needs to work fast, to hold down his safe blue district); he just announced plans to run not only in 2012 again, but in 2014 as well, so long as he’s healthy. The article cites state Sen. Chris Smith as a likely replacement once Hastings does retire. (Which means the House would get two Chris Smiths, to go with its two Mike Rogers.)

MN-08: Here’s a minor bombshell for Minnesota Democrats, where outgoing House majority leader Tony Sertich had been widely expected to take on fluky new Rep. Chip Cravaack in 2012 in this D+3 district. Having just been appointed Iron Range Resources Commissioner, though, he now says that he won’t run. The Duluth-area portion of the district has a pretty thorough DFL bench, so they won’t lack for a credible challenger, but Sertich had been at the top of almost everyone’s list so this scrambles things a bit.

Redistricting: One thing that the Republicans have always been good at is making sure that stuff that can pay dividends down the line is well-funded, but this seems like an unusual case of ball-dropping: Making America’s Promise Secure (or MAPS), a 501(c)(4) oriented toward paying for the legal aspects of the 2012 redistricting battle, never really got off the ground and has almost no money, leaving the state parties to fend for themselves. There are also a number of interesting pieces today on the upcoming battles in individual states, including The Fix’s look at the impact of the citizen redistricting panel on California (where the switch away from incumbent protection has a lot of old-timers of both parties shaking in their boots). There’s also another look at Massachusetts, and also a nice piece about New Mexico that has lots of detail about previous decades’ battles. New Mexico is a state we haven’t thought about much in this context because its House boundaries aren’t likely to change much, but state legislative seats are likely to shift significantly from the state’s stagnant east into Albuquerque’s suburbs.

Voter suppression: Wisconsin’s newly-Republican-controlled legislature is already taking some pains to make sure that it stays that way, with one of their first legislative priorities imposing photo ID requirements for all voters at polling places (and to push for a constitutional amendment that would make that law more difficult to repeal later). They’d also like to move on ending Wisconsin’s well-known same-day-registration, although that may not be as likely a target seeing as how it’s not only popular but would also cost a lot of money (because federal law says that the state would then need to implement a motor-voter registration system instead).

Congress: This may be the single most useful thing you’ll read today: the Hill’s guide to pronunciation of all of the names of the Congress members with hard-to-pronounce names. I learned that I’ve been mentally mispronouncing at least a dozen names; I’m sure everyone will find at least a few surprises.

Meta: Curious how my own gifts for inspiring oratory would look in “word cloud” form, I ran SSP’s front page through Wordle.net, and the net result is, well, not very inspiring… it’s about as sober and nuts-and-bolts as it gets. None of our favorite neologisms made it on there (NWOTSOTB? Some Dude? Cat fud?)

PA – Why 12R, 6D will be the Republican’s choice

Over the past few weeks, I’ve seen numerous maps which have tried to draw Pennsylvania (where Republicans have total control) 13R-5D, or even 14R-4D.  After trying several maps out for myself, I’ve decided that aggressive action by the Republicans, while not impossible, will be foolhardy.

The 2000 Republican redistricting is remembered by some as a success, but in many ways, it was a failure.  PA-13 and PA-17 were both supposed to be Republican seats when drawn.  And as we all know, PA-3, PA-4, PA-8 and PA-7 ultimately were too Democratic to be held consistently through the decade.  

Republicans will surely wish to ensure that one Democratic incumbent loses their seat (most likely Mark Critz).  Knocking off Jason Altmire isn’t too difficult either – there are plenty of deep-red Republican areas to draw into his district, and western Pennsylvania outside of Pittsburgh is swinging to the right pretty rapidly.  However, eastern Pennsylvania has been trending towards the Democrats for just as long.  The Republicans now hold four Democratic-leaning districts in the east.  Not enough Democrats can be siphoned into PA-1, PA-2, and PA-13 to make the seats safe.  

Compounding the issue is Tim Holden.  He has been a formidable campaigner, repeatedly winning re-election in a Republican-leaning district.  Any attempt to trade his seat for a new safe D district scooping up Democrats the northeastern part of the state makes it uncomfortably possible the Republicans will hand the Democrats a free gimme and Holden will survive.

Therefore, I’ve decided a 12-6 breakdown is the best the Republicans can reasonably manage which protects almost all of their incumbents (barring a major scandal), for the remainder of the decade.  Really, a two-to-one margin for Republicans, given they have consistently lost the state on the presidential level since 1988, is pretty damn gerrymandered already – especially if they trade four somewhat unsafe seats for much safer ones.

In the end, I think the map will have these broad outlines:

1.  Eliminate Mark Critz’s seat.

2.  Move PA-12 to the Philly burbs.  It becomes a vote sink for Democratic areas which do not fit into the other three Philly-area districts.

3.  Make Tim Holden’s district as Democratic as possible, which will help shore up both PA-11 and PA-15 for incumbents.

4.  In order to ensure that no Republican incumbent loses a seat, Altmire has to go.  His seat gets dismembered, with his hometown in PA-14, but his base split between PA-18, PA-9, and PA-3.  Thus he’ll have to move, and face an uphill battle regardless.  PA-4 moves to Dutch Country and replaces PA-19.  

Here’s the statewide view.  All Republican incumbents keep their hometowns in their seats, from what information I could gather.  Some districts do change composition rather dramatically however, particularly in the east.  

Details by district:

PA-1

Minority-Majority (39% White, 34% Black, 19% Hispanic, 6% Asian)

82% Obama, 17% McCain (D+28)

I do not know Bob Brady’s exact address, so I am not sure if his home is in the district.  The district sheds its extension into Delaware county, and expands a bit into Northeast Philly.  Still highly safe of course.

PA-2

Majority Black (63% Black, 29% White, 4% Asian, 3% Hispanic)

90% Obama, 10% McCain (D+36)

Again, I am not sure of Chaka Fattah’s exact address, but the core of black west Philadelphia remains intact.  The district takes in predominantly black areas of Delaware county, and also a few heavily-Democratic white areas like Media and Glenolden which don’t fit well into PA-12.  

PA-3

53% McCain, 46% Obama (R+7)

The district sheds half of Erie, in order to become less Democratic, and picks up more Republican areas to the south which were formerly part of PA-4.  It does contain a fairly substantial part of Altmire’s old district, and is only marginally more Republican than his old district, but he would have to move to establish himself here.  

PA-4

56% McCain, 43% Obama (R+10)

This is really a replacement for the old PA-19.  It’s centered around Harrisburg, although Harrisburg itself is drawn into PA-10 in order to stop this district from being swingy.  Should remain a solid Republican seat.  

PA-5

53% McCain, 45% Obama (R+8)

This district migrates to the west, picking up half of Erie, along with some of the outer reaches of southwestern Pennsylvania.  It’s slightly more swingy than it was before with the inclusion of Erie, but should remain a solid Republican seat.  

PA-6

51% McCain, 48% Obama (R+5)

Marginal parts of Chester and Montgomery are shed, along with the city of Redding.  In exchange, it takes in more of rural Redding county, and the northern parts of Lancaster county.  Although the right Democrat could take this, it is a far safer district than it was.  

PA-7

52% McCain, 47% Obama (R+6)

Again, the district shifts west.  It takes on parts of Chester, Lancaster, and York counties, while shedding the most Democratic parts of Delaware, along with the salient into Montgomery.  This should be a fairly secure Republican seat.

PA-8

51% Obama, 48% McCain (R+3)

There were logical limits to how well this seat could be gerrymandered.  It has shed southern Bucks, and picked up in exchange the most Republican parts of Montgomery, along with a Republican-leaning strip of hills in the Lehigh.  However, this area is still very swingy and essentially surrounded by Democrats on all sides, making further improvement difficult.  Compounding issues, Mike Fitzpatrick is from Levittown, in the far south.  Levittown is not a real municipality, it is split across three different townships.  Given I didn’t know where precisely he lived, I decided to leave Middletown in PA-8, which is marginally less Democratic, while putting Bristol and Falls into PA-13.  Democrats will probably take this seat sometime during this decade if current trends continue, but it should be the Republicans’ only loss.  

PA-9

58% McCain, 42% Obama (R+11)

This district changes complexion dramatically, from being based in the Central PA mountains to being mainly based in the Pittsburgh exurbs, with a salient heading towards Johnstown and Altoona.  It is still heavily Republican.  Mark Critz finds himself in this district, and out of a job.  A small amount of Altmire’s old district is in PA-9 now, but I think it will be the least likely option for him to take.  

PA-10

53% McCain, 46% Obama (R+7)

The district moves to the west and south.  It is not an overwhelmingly Republican seat, due to the inclusion of State College and Harrisburg, but is still Republican enough to remain safe.  

PA-11

52% McCain, 46% Obama (R+7)

Much of the Wyoming valley has been shed, as it was too full of Democrats for Lou Barletta’s comfort.  In its place, much of the “Northeast woods” of the state have been added.  The district should be a pretty good fit for Lou Barletta’s moderate stances.  

PA-12

63% Obama, 36% McCain (D+10)

This entirely new district more or less follows the Schuykill River, picking up Democratic votes from Philly all the way to Redding.  It’s an interesting question who in the state house or senate will step forward to run for this seat.  

PA-13

63% Obama, 36% McCain (D+10)

The district retains a focus on Montgomery county, but sheds much of the northern parts of the county.  It also loses much of Northeast Philly, and gains lower Bucks.

PA-14

68% Obama, 31% McCain (D+14)

This district is not quite as Democratic as it could be, as it draws in a few Republican areas to ensure Jason Altmire will live in the district.  If the Republicans are lucky, he may try to primary Mike Doyle (although I think he would lose).  It is otherwise broadly similar to the old Pittsburgh-based district.  

PA-15

50% Obama, 49% McCain (R+4)

This is the other Republican district which could potentially be endangered.  The problem is incumbent Charlie Dent lives in heavily Democratic Allentown.  If I knew precisely where in Allentown he lived, I could shunt most of the city into PA-17, and probably improve the district to R+6 or R+7.

PA-16

57% McCain, 42% Obama (R+12)

This district, as odd as it seems looking at it, was not constructed mainly as a gerrymander.  The incumbent is unfortunately in Chester county, but the old base of Chester and Lancaster was needed in order to make PA-6 and PA-7 into solid Republican seats.  Thus the seat goes far, far to the west, traveling almost the entire length of the southern border of the state.  In southwestern Pennsylvania, it does helpfully sop up Democratic voters in the Mon valley who would otherwise cause issues for Tim Murphy.  

PA-17

61% Obama, 38% McCain (D+8)

Since it’s impossible to ensure Tim Holden is defeated, instead the new PA-17 packs in as many Democrats into his seat as possible.  The only old part of the seat is a small salient into Schuykill county to grab his hometown.  Indeed, it’s plausible he’d be vulnerable in a primary, but he’d have an easier time running as an unknown incumbent in an open seat primary than he would moving and picking more Republican PA-15 which has most of his old base.  My bet is he stays put.  

PA-18

53% McCain, 46% Obama (R+8)

The new PA-18 keeps most of Tim Murphy’s base in the South Hills of Pittsburgh intact.  It does shed Westmoreland county to PA-9, and takes in a good deal of the old PA-4.  The retention of Murphy’s base means Altmire would have trouble gaining traction here.  If the seat ended up open, he’d otherwise potentially be competitive.

Thoughts?

TX-Sen: Kay Bailey Hutchison Won’t Seek Re-election

Big news out of the Lone Star State:

Kay Bailey Hutchison  will not run for re-election to the U.S. Senate….

“I am announcing today that I will not be a candidate for re-election in 2012,” she wrote to supporters. “That should give the people of Texas ample time to consider who my successor will be.”

With a line of potential challengers revved up to take her on from the right, and so-so approvals (especially among the Republican side of the electorate), Hutchison probably didn’t have the stomach for another heated primary after losing the 2010 gubernatorial primary that was once thought to be hers for the taking. Look for the floodgates to open for Republican office seekers now, which will probably now include Dallas mayor Tom Leppert (whose apparent recent decision not to seek another term suggests he may have gotten a tip-off). Other likely entrants include Lt. Gov. David Dewhurst, while several less-prominent former or current statewide GOPers are already in the race.

Former comptroller John Sharp, who built up a big war chest in preparation for the special election to replace KBH that never happened, seems likely to be the Dem nominee… but is there any other Dem that any of you have on your wish list for the race?

MN Redistricting D+3?

So, I haven’t noticed any discussion about Minnesota redistricting, and it’s true that this probably isn’t the most exciting state when it comes to that, but I decided to make a map anyhow.

A couple of things are worth noting ahead of time:

1) Four of the last five redistricting cycles in Minnesota have resulted in court-drawn maps because of legislative deadlock.

2) The population growth in Minnesota has been almost entirely in the Twin Cities suburbs represented by Bachmann and Kline, so the main changes will involve those districts shedding voters.

In any case, I decided to take the new population estimates on Dave’s app and make a ‘least change’ map much as I would expect a court panel to implement. The results are after the fold.

Below I have posted a full-state map and a close-up of the Twin Cities. The changes are not particularly exciting, but what I want to highlight is that this suggests opportunity for up to three Democratic pick-ups in the 2012 election. I’ve used the precinct figures at the Minnesota SoS website to calculate the Obama/McCain numbers for the new districts that I project compared to the current districts. These are the Obama/McCain percentages with third party votes excluded.

MN-01 (Walz-D)

Current: 52.4% Obama to 47.6% McCain

Projected: 52.0%Obama to 48.0% McCain

There is no meaningful change here.

MN-02 (Kline-R)

Current: 49.3% Obama to 50.7% McCain

Projected: 50.0% Obama to 50.0% McCain

Obama would’ve won the projected district by a tiny margin of 268 votes. What is most worth noting is that the MN-02 district will surely need to shed territory, and that the more territory that it needs to shed the less Republican it will become, because the Republican votes are more concentrated along the southern and western parts of the district. The DCCC should seriously consider contesting this district in my view regardless.

MN-03 (Paulsen-R)

Current: 53.3% Obama to 46.7% McCain

Projected: 53.0% Obama to 47.0% McCain

This Obama district becomes slightly less so, but there’s also little doubt in my view that the Democrats need to recruit a strong candidate here. They should not have lost the district in the first place after Ramstad’s retirement.

MN-04 (McCollum-D)

Current: 65.7% Obama to 34.3% McCain

Projected: 65.1% Obama to 34.9% McCain

No excitement here.

MN-05 (Ellison-D)

Current: 75.7% Obama to 24.3% McCain

Projected: 75.6% Obama to 24.4% McCain

Even less here.

MN-06 (Bachmann-R)

Current: 45.5% Obama to 54.5% McCain

Projected 45.1% Obama to 54.9% McCain

Unfortunately, Bachmann gets a slight bump on my map. I would add, however, that this district (along with MN-03) ends up with a disproportionately high number of 2008 voters on my map (nearly 400,000 versus somewhat less than 350,000 voters for the others). That suggests to me that the population estimates on Dave’s app may be low for MN-06 and MN-03. If that’s the case, MN-03 will not expand as much and MN-06 will need to shed voters. If that’s true, this district will become more Democratic the more that it contracts toward the Twin Cities.

MN-07 (Peterson-D)

Current: 48.6% Obama to 51.4% McCain

Projected: 48.0% Obama to 52.0% McCain

There is no meaningful change here. Still a swing district.

MN-08 (Cravaack-R)

Current: 54.4% Obama to 45.6% McCain

Projected: 54.3% Obama to 45.7% McCain

This is obviously a prime target for a takeback bid – hopefully by someone younger than his mid-70s. There was no call for Oberstar losing this district, and there’s no good reason why Cravaack should still be representing it in 2013.

That said, if the MN-06 district needs to contract more than above, then this district is likely to pick up the greater part of the spillover, which will make it more GOP. How much is an open question.

Any thoughts?

The Worst Republican Senate Candidates of 2010, Part 2

This is the second part of two posts analyzing patterns in the 2010 Senate midterm elections. The previous part can be found here.

The previous post presented a table ranking the worst Republican candidates in the 2010 midterm elections. The model used to create the table is also explained in the previous post.

Let’s take a look at this table once again, below the fold.

State Republican Margin Cook PVI Republican Overperformance
South Dakota 100.00% 8.9% 91.10%
North Dakota 53.91% 10.4% 43.51%
Kansas 43.72% 11.5% 32.22%
Iowa 31.05% -1.0% 32.05%
Idaho 46.25% 17.4% 28.85%
Oklahoma 44.50% 16.9% 27.60%
Florida 28.69% 1.8% 26.89%
South Carolina 33.83% 7.8% 26.03%
New Hampshire 23.22% -1.6% 24.82%
Arizona 24.14% 6.1% 18.04%
Alabama 30.47% 13.2% 17.27%
Ohio 17.44% 0.7% 16.74%
Georgia 19.31% 6.8% 12.51%
Arkansas 20.96% 8.8% 12.16%
Missouri 13.60% 3.1% 10.50%
Illinois 1.60% -7.7% 9.30%
Louisiana 18.88% 9.7% 9.18%
Utah 28.79% 20.2% 8.59%
Indiana 14.58% 6.2% 8.38%
North Carolina 11.77% 4.3% 7.47%
Wisconsin 4.84% -2.4% 7.24%
Pennsylvania 2.02% -2.0% 4.02%
Kentucky 11.47% 10.4% 1.07%
Washington -4.73% -5.0% 0.27%
Alaska 11.94% 13.4% -1.46%
Colorado -1.63% 0.2% -1.83%
California -10.01% -7.4% -2.61%
Nevada -5.74% -1.3% -4.44%
Connecticut -11.94% -7.1% -4.84%
Delaware -16.58% -7.0% -9.58%
Oregon -17.98% -4.0% -13.98%
New York (S) -27.84% -10.2% -17.64%
Maryland -26.44% -8.5% -17.94%
West Virginia -10.07% 7.9% -17.97%
Vermont -33.41% -13.4% -20.01%
New York -34.10% -10.2% -23.90%
Hawaii -53.24% -12.5% -40.74%
Total/Average 5.54% 2.3% 8.08%

(Note: The data in Alaska and Florida refer to the official candidates nominated by the parties, not the independent candidates – Senator Lisa Murkowski and Governor Charlie Crist – who ran in the respective states).

There are six possible outcomes which are possible here. This post will look at each outcome.

Outcome #1: A Republican candidate, running in a red state, wins while overperforming.

This outcome was by far the most common in the November elections: indeed, 18 Senate races fit this category. In a way this is not too surprising: the definition of overperforming here is doing better than the state’s Cook PVI (how a state would be expected to vote in a presidential election in the event of an exact tie nationwide). The average Republican should have “overperformed” in this sense, given how Republican a year it was.

Another factor is incumbency. Red states generally had Republican incumbents. Facing little serious competition in a Republican year and benefiting from their incumbency status, these people were probably expected to overperform – and they did.

Outcome #2: A Republican candidate, running in a red state, wins while underperforming.

Technically this did not happen once in this election. The race that comes closest is Alaska , where Republican candidate Joe Miller did better than the Democratic candidate while doing worse than Alaska ‘s political lean (on the other hand, he still lost to Independent Lisa Murkowski).

This is actually quite surprising. There were twenty-one Senate contests in red states – and in just one (or zero, depending on how you count) did the Republican underperform while still winning.

In fact, this outcome is quite rare, for whatever reason, throughout American politics. If a Republican underperforms in a red state, he or she usually loses. Rarely does a Republican candidate underperform in a red state but still win (another variant along the same theme: out of the counties Senator John McCain won, he almost always improved on Republican performances in 1992 and 1996). Why this happens is something of a continuing mystery to this blogger.

Outcome #3: A Republican candidate, running in a red state, loses while underperforming.

This was another rare occurrence in the 2010 Senate elections. Only two states fit this category: West Virginia and Colorado . The performance of Democratic candidate Joe Manchin is especially remarkable. Mr. Manchin was the only Senate Democrat to win in a deep red state this year, and his name stands out as an outlier everywhere in the table.

Outcome #4: A Republican candidate, running in a blue state, wins while overperforming.

There are five states that fit this category: Illinois , Iowa , New Hampshire , Pennsylvania , and Wisconsin . These account for three of the Republican pick-ups this cycle. Interestingly, four of these states are in the Midwest , where Democrats were pummeled this year.

Among these states, Illinois stands out the most. It is the only deep blue state that a Republican candidate overperformed in. Although much of this is due to other factors – the continuing Blagojevich scandal, the weakness of the Democratic candidate – credit goes to Republican Mark Kirk for an outstanding overperformance.

Outcome #5: A Republican candidate, running in a blue state, loses while overperforming.

This is another outcome that, for whatever reason, rarely seems to happen in American politics; if Republicans overperform in blue states, they generally tend to win.

In 2010 this happened in exactly one state: Washington , where Republican candidate Dino Rossi did 0.27% better than the Cook PVI, but still lost.

Outcome #6: A Republican candidate, running in a blue state, loses while underperforming.

This was the second-most common outcome in 2010; ten states fit this category. These states tended to be the bluest states in America . The fact that Republicans tended to underperform a state’s political lean in the deepest-blue states is another strange pattern in American politics. This is something that the previous post analyzes extensively.

All in all, the table reveals a lot of surprising patterns – things which were not expected when this blogger initially made it. And as for the worst Republican candidate in 2010? That was Campbell Cavasso of Hawaii, who won a mere fifth of the vote against the Democratic institution Daniel Inouye.

–Inoljt, http://mypolitikal.com/

Arkansas and West Virginia Re-Maps

I have combined the two states in this diary as they both only have a few Congressional seats, and, if I understand correctly, both have a rule whereby counties should not be split when doing redistricting.  Both Arkansas and West Virginia are also states which historically have been very Democratic — but in the recent past, both are trending Republican (though both are still controlled by Democrats when it comes to remapping).  Each state currently has only one Democratic House member left.  Via these maps, the goal is to have two Democrats in both Arkansas and West Virginia.

Arkansas:

Photobucket

All the districts conform to the “no-county splitting” rule with population deviations ranging from 266 to 2902 persons using Dave’s Application.  Under demographics, ethnic/racial groups are provided if 5% or more of a district’s population.

District 1 (Green)

Proposed District Demographics: 90% white; 5% black

Current District: Obama 38; McCain 59

Proposed District: Obama 33; McCain 64

This new district includes the most Republican counties of northern Arkansas, combining parts of the current AR-1, AR-2 and AR-3.

District  2 (Blue)

Proposed District Demographics: 62% white; 31% black

Current District: Obama 44; McCain 54

Proposed District: Obama 50+; McCain 48

Population-wise, almost 60% of this new district comes out of the existing AR-2, while the rest comes out of AR-1.  I was surprised, but it’s apparently possible to create an Obama-majority district in Arkansas even when all districts have to correspond to the county lines rule (while also not messing with Mike Ross’ district).  This new district combines the most Democratic parts of AR-1 and AR-2.  11 out of 15 counties in the new district were carried by the Democratic candidate in last November’s House elections (the exceptions being Conway, Lonoke, Perry and Van Buren Counties).  Likewise, Blanche Lincoln carried the same 11 out of 15 counties.

District 3 (Purple)

Proposed District Demographics: 80% white; 12% hispanic

Current District: Obama 34; McCain 64

Proposed District: Obama 33; McCain 64

The new AR-3 in the northwestern part of the state maintains its hyper-GOP nature under this map.

District  4 (Red)

Proposed District Demographics: 71% white; 23% black

Current District: Obama 39; McCain 58

Proposed District: Obama 38; McCain 59

Arkansas’ only House Democrat, Mike Ross, gets to keep about 90% of his current territory, as the district becomes only a sliver more Republican.

West Virginia:

Photobucket

All the districts conform to the “no-county splitting” rule with population deviations ranging from 3026 to 7993 persons using Dave’s Application.  

District  1 (Blue)

Proposed District Demographics: 93% white

Current District: Obama 42; McCain 57

Proposed District: Obama 45; McCain 53

The new WV-1 combines some of the most Democratic parts of the current WV-1 and WV-2 into one district.  However, both GOP incumbents from those districts would now be in WV-1 under the new lines.  The goal is to have the two Republicans fight it out in the primary, while a Democrat ultimately emerges on top in November.

District 2 (Green)

Proposed District Demographics: 93% white

Current District: Obama 44; McCain 55

Proposed District: Obama 39; McCain 59

The new WV-2 becomes sort of a “sink” for GOP votes under this map.  However, it would have no incumbent under the new lines.

District 3 (Purple)

Proposed District Demographics: 94% white

Current District: Obama 42; McCain 56

Proposed District: Obama 43; McCain 55

West Virginia’s only House Democrat, Nick Rahall, gets to keep about 75% of his current territory, as the district becomes slightly more Democratic.

2011 Elections

We don’t take off odd-numbered years here at SSP, because we know that you don’t, either. There are a handful of bigger races taking place in 2011, but we want to hear about the elections happening in your neck of the woods that most folks aren’t really paying attention to. The Houston Chronicle has a look at a handful of interesting races going on this year, but we know this community can go much further into the weeds. So talk to us, people!