Another way to Use Dave’s Redistricting: Partisan Data for Maryland

Photobucket

So, hi, I’m Josh, this is my first diary.  I’m 17, and I got bored one day, so I decided, why not redistrict Maryland solely by 08 Vote.  In simpler terms, let’s use Dave’s, but instead, color-code into Very Dem (>70%), Dem (60-69%), Mod (49-59%), Rep (39-48%), and Very Rep (< 39% using Dark Blue, Light Blue, Purple, Light Red, and Red.  I have done that here, and I will do a county-by-county description of Maryland (I will post New York soon as well).  This will also help those who plan on trying redistricting with these states.  I will talk about each county, sorted by population

Montgomery-DC Suburbs

 One of the most liberal counties in the state.  The area bordering DC (Takoma Park, Chevy Chase, etc) is very, very liberal.  However, as one moves outward, the area gets more swingy, particularly along the Virginia border, such as in Poolesville.  However, further into the state, a line of dark blue runs through Gaithersburg and Rockville.The very North of the County, areas like Laytonville, are even somewhat conservative

Prince George’s-DC Suburbs

 A highly Black liberal area near DC, containing Univ. of Maryland and Bowie, it is almost entirely Very Dem, with exceptions in some of Bowie and Berwyn Heights.

Baltimore County-Baltimore Suburbs

 A county with extreme variance and quite a bit of polarization.  The area southwest of Baltimore is mainly Rep, and the area North of that (West of Baltimore) is much larger and Very Dem.  North of Baltimore is more Mod and Rep areas, while more North of that, near Pennsylvania, is a Very Rep area.  To the Northeast of Baltimore is a mixture of Rep and Very Rep areas, and to the East of Baltimore, along the Bay, is some highly conservative areas.  However, overall, this county is Moderate.

Baltimore, the City

 Enough said.  Highly liberal, sparsely populated southeast is Moderate. rest is very dem.

Anne Arundel-Annapolis

 Relatively Republican suburbs of Baltimore. The parts closer to the bay are more conservative than the inland areas, with Annapolis being an exception.  Some highly Republican areas in central county.

Howard-In between DC,Baltimore

A Democratic area, not as much as DC Suburbs or Baltimore, however.  The Eastern half ranges from moderate to Very Dem, while the Western half is more similar to the Panhandle.

Frederick-Frederick

 Except Brunswick (Moderate) and Frederick (Dem), this county is conservative near Virginia and very conservative further in-state.

Harford-Balt. Suburbs

 Our most Republican turf yet, very, very conservative.  More moderate along the water.  Contains conservative Bel Air Area.

Carroll-Balt. Suburbs

 Harford’s twin county.  Same comments, no areas along water, Westminster is less conservative, but still much more conservative than the state itself.

Washington-Hagerstown

 Frederick’s Western twin.  Conservative near Virginia, moderate to liberal in Hagerstown, very conservative in panhandle.

Charles

 From the looks of it, it wouldn’t appear to be a Democratic county, but it has been for the past few elections. One of few counties Gore won while Clinton didn’t.  Northern half is very liberal, 1/3 Black.  Southern part, more conservative.  La Plata in middle is moderate.

Cecil

 Balt. Exurbs and some of the E. Shore.  Elkton is moderate, the rest is Rep or Very Rep.

Calvert

Mainly Moderate Republican.  I don’t know enough about it to say any more.

St. Mary’s

 Southwest Peninsula.  Republican, nothing too much of interest.

Wicomico

 An awesome name, contains Democratic Salisbury, moderate Fruitland.  Rest is very Republican.

Panhandle (Allegany, Garrett)

 You didn’t think I would list every county individuall, did you?  These two are identical, except population and the fact that Allegany has some Republican territory in Cumberland rather than solely Very Republican.

E. Shore (Worcester, Queen Anne’s, Talbot, Dorchester, Garrett, Caroline, Somerset, Kent)

 Almost all Rep or Very Rep, no clear trends.  Some of Southern end more Dem, probably due to Black vote?

Please comment if you find this interesting so I know if I can continue this.  

Maryland population and demographic changes, 1990-2010

About a week ago, I was talking with someone about how the governor’s legislative redistricting plan was rejected in 2002. I began to wonder how different that plan was from that of the 1990s and before, so I did a search. I could not find legislative districts from before the 1990s, but I did find this: http://planning.maryland.gov/M… which shows what the 1990s era districts looked like. The idea then dawned upon me to try to recreate that map using Dave’s redistricting app and then examine how the state has changed since then. First, the map:


Then, here’s the data, which shows whether the 1990 configuration of the district is overpopulated or underpopulated, the %Obama received, the %white in 1990 and 2010, and the %black in 1990 and 2010. Dark blue districts had the white percentage decrease by over 20% or more, while light blue had the white percentage decrease by 10-20%.

http://spreadsheets.google.com…

Conclusions: The past 20 years has brought some sizable population changes to Maryland. Montgomery, Frederick, Charles, St. Marys, Howard, Harford, and Cecil Counties, have all increased relatively in population. Almost all of that has come from the demise of Baltimore City, which has seen uniform decline. Other areas which have seen declines are the Essex/Dundalk area of Eastern Baltimore County, Western Maryland west of Hagerstown, and inner Prince George’s County.

With the notable exception of the lower Eastern Shore, the vast majority of Maryland has been getting more diverse. Large swaths of Baltimore City, Baltimore County, Howard County, Montgomery County, PG County, and Charles County have all seen their white percentage decrease by over 20% in 20 years. The area with the greatest change may have been the Bowie-centered 23rd district, which was majority-white in 1990, but has since seen its white percentage cut in half.

In the traditional white-flight paradigm, areas that became more diverse also decreased in population. This is still visible in Maryland in parts of Baltimore City and PG County. However, recent trends show many areas with strong minority growth also growing rapidly. Areas like this in Maryland include most of Montgomery County, southern Frederick County, Howard County, outer PG County, Charles County, and the Owings Mills area of Baltimore County. While heavily-white and Republican St. Mary’s County and Bel Air (Harford County) did post some of the largest gains statewide, these changes are really offset by the gains elsewhere, and will not likely have much of an effect on Maryland politics.

These changes matter greatly when you consider how much more Republican Maryland was in 1990. Though hard to believe, Maryland did vote for Bush in 1988, with areas like Montgomery County only barely voting for Dukakis. In addition, Prince George’s County was only about 50% black in 1990, versus the 66% that it is now, so Dukakis surely did much worse than Obama did there. Bush even got 57% in Baltimore County, where areas like Randallstown were only about 55% black versus the upwards of 90% that they are now (look at the old 10 stats on that Maryland General Assembly website). Under the old demographics, it would’ve been impossible to draw District 1 so that it voted for Obama, something demonstrated multiple times here on Swing State Project.

Thus, while the Democratic Party’s fortunes nationwide may ebb and sway, there’s very little room for the Republican Party to grow in Maryland. Demographic changes have put Maryland out of reach for the Republicans in the past 20 years, and will likely continue to do so.

Maryland, my way for redistricting (updated)

First thank to Dave by his very good application for redistricting and thanks to the people what help me for save and up here the maps. This is my first diary here.

Well, im not expert in laws for redistricting but i hope to respect all. I try let all incumbents their own district, let all democrats safe, and make so compact districts respecting the county borders.

These are the results:

CD1: (Blue) Frank Kratovil (D)

– D+8 Obama 61% McCain 37%

– Include all of Kent, Queen Anne’s, Caroline and Talbot counties.

– Include part of Baltimore county and part of Baltimore city.

– White 57% Black 36%

– Deviation of population: -1673

CD2: (Green) Dutch Ruppersberger (D)

– D+8 Obama 61% McCain 37%

– Include all of Carroll county.

– Include part of Baltimore, Howard and Prince George’s counties.

– White 50% Black 29% Hisp 14%

– Deviation of population: -3402

CD3: (Purple) John Sarbanes (D)

– D+11 Obama 64% McCain 34%

– Include part of Baltimore, Howard and Anne Arundel counties.

– White 56% Black 30%

– Deviation of population: -2964

CD4: (Red) Donna Edwards (D)

– D+10 Obama 63% McCain 36%

– Include part of Prince George’s and Anne Arundel counties.

– White 54% Black 38%

– Deviation of population: -557

CD5: (Yellow) Steny Hoyer (D)

– D+10 Obama 63% McCain 36%

– Include all of Charles, Calvert, St-Mary’s, Dorchester, Wicomico, Somerset and Worcester counties.

– Include part Prince George’s county.

– White 56% Black 36%

– Deviation of population: -3580

CD6: (Greenish blue) Roscoe Bartlett (R)

– D+10 Obama 63% McCain 36%

– Include part of Frederick and Montgomery counties.

– White 58% Black 16% Hisp 13% Asian 11%

– Deviation of population: +8208

CD7: (Gray) Elijah Cummings (D)

– D+8 Obama 61% McCain 37%

– Include all of Cecil and Hartford counties.

– Include part of Baltimore county and part of Baltimore city.

– White 60% Black 34%

– Deviation of population: -3148

CD8: (Lilac) Chris Van Hollen (D)

– D+8 Obama 61% McCain 37%

– Include all of Garrett, Allegany and Washington counties.

– Include part of Frederick and Montgomery counties.

– White 70% Black 10% Hisp 10% Asian 8%

– Deviation of population: +7113

These results are using new population estimations. CD6 and CD8 have few more population because i try to respect county borders.

Im not sure if E Cummings get inside his new 7th district but i think he have a good part of Baltimore in the new district.

In images:

Maryland 8-0

Maryland 8-0 A

Maryland 8-0 B

UPDATE FOR INCLUDE BLACK MAJORITIES IN CD4 AND CD7:

Giving black majorities of 50% to 4th and 7th district these are the results:

CD1: (Blue) Frank Kratovil (D)

– D+6 Obama 59% McCain 39%

– Include all of Kent, Queen Anne’s, Caroline and Talbot counties.

– Include part of Baltimore, Anne Arundel and Prince George’s counties and part of Baltimore city.

– White 65% Black 26%

– Deviation of population: +6012

CD2: (Green) Dutch Ruppersberger (D)

– D+7 Obama 60% McCain 39%

– Include part of Harford, Baltimore, Carrol, Howard, Montgomery and Prince George’s counties.

– White 50% Black 26% Hisp 15%

– Deviation of population: -4800

CD3: (Purple) John Sarbanes (D)

– D+7 Obama 60% McCain 39%

– Include part of Harford, Baltimore, Howard counties and part of Baltimore city.

– White 64% Black 25% Asian 6%

– Deviation of population: -2980

CD4: (Red) Donna Edwards (D)

– D+17 Obama 70% McCain 29%

– Include part of Prince George’s and Anne Arundel counties.

– Black 50% White 42%

– Deviation of population: +3968

CD5: (Yellow) Steny Hoyer (D)

– D+6 Obama 59% McCain 40%

– Include all of Charles, Calvert, St-Mary’s, Dorchester, Wicomico, Somerset and Worcester counties.

– Include part Prince George’s and Anne Arundel counties.

– White 63% Black 30%

– Deviation of population: +3283

CD6: (Greenish blue) Roscoe Bartlett (R)

– D+7 Obama 60% McCain 39%

– Include part of Carroll, Frederick and Montgomery counties.

– White 61% Black 14% Hisp 13% Asian 10%

– Deviation of population: -1859

CD7: (Gray) Elijah Cummings (D)

– D+16 Obama 69% McCain 30%

– Include all of Cecil county.

– Include part of Harford and Baltimore counties and part of Baltimore city.

– Black 50% White 44%

– Deviation of population: +1739

CD8: (Lilac) Chris Van Hollen (D)

– D+7 Obama 60% McCain 38%

– Include all of Garrett, Allegany and Washington counties.

– Include part of Frederick and Montgomery counties.

– White 73% Black 9% Hisp 8% Asian 8%

– Deviation of population: -5366

These results are using new population estimations.

In images:

Maryland 8-0 II

Maryland 8-0 II A

Maryland 8-0 II B

Maryland 8-0 II C

Maryland 8-0 II D

By what margin will Bob Shamansky win?

View Results

Loading ... Loading ...

Redistricting Maryland

 I already did a map with Maryland redistricting in September but now that Obama/McCain election results are incorporated into maps of Maryland, I decided to create a new map this time knowing how each congressional district I made voted for Obama. I decided to do an 8-0 Democratic map without creating a convoluted gerrymander. I also wanted to make sure none of the district violated the Voting Rights Act. If you are confused with the district labeling, CD4 is for the red district while CD8 is for the light purple district. CD3 is for the purple district and CD6 represents the teal district. I think I gerrymandered a bit with the 1st and 3rd Congressional districts but on the most part, I probably avoided a large gerrymander. My main goals here were to shore up Frank Kratovli (D) who barely won in the heavily Republican 1st Congressional district last year. I also wanted to make Roscoe Bartlett’s 6th district too Democratic so he would retire. Here is a link to the current map of Maryland’s Congressional districts: http://http//www.mdp.state.md….

Here is a link for Maryland’s demographic data: http://http//quickfacts.census…

Here is yet another link, this time for 2008 election results in Maryland: http://http//uselectionatlas.o…

Here is the link for the first Maryland map

http://swingstateproject.com/d…

Here are the maps:

West Maryland

East Maryland

Central Maryland

1st District Frank Kratovli (D)

I could not split the eastern shore because the Maryland State Legislature would probably not back that kind of plan. The old district went onto the western shore taking in heavily Republican parts of Anne Arundel, Baltimore and Harford counties. For this plan, I sent the 1st into Democratic Annapolis and up north towards Prince Georges County. Along the way, I slipped in some Democratic parts of Anne Arundel County besides Annapolis and put about 130,000 people in Prince George’s County into the 1st. This raises Obama’s percentage of the vote to 54% which is about the same as my old map. Prince Georges County had high turnout in 2008 because of Obama but the turnout may drop in an off year election, causing trouble for Kratovli. He should still win because the Republican base in the 1st district is in the Eastern Shore which is Kratovli’s base. In 2008, the Republican challenger did well on the western shore. Demographics are 25% African American and 66% White. Status is Likely Democrat.

2nd district Dutch Ruppersberger (D)

By creating a more compact district, I included more Republican areas in the district. Giving the 2nd district more of Baltimore compensates a bit but I still decreased the African American population from 27% to 23%. The 2nd district represents many working class neighborhoods in Baltimore City and Baltimore County and most of those votes should support Democrats except they might lean towards former Governor Bob Ehlrich (R). Unless a candidate like Ehlrich runs, Ruppersberger should have no trouble winning. Obama won 56% of the vote here. Demographics are 23% African American and 68% White. Status is Safe/Likely Democrat.

3rd district John Sarbanes (D)

I removed all of Anne Arundel County and parts of Baltimore County. I replaced those areas with Carroll County, more of Howard County and a bit more of Baltimore City. Even though Carroll County is heavily Republican, the Democratic areas in Howard County, Baltimore City and County make the 3rd district heavily Democratic. Also, I increased the African American percentage from 16% to 23%. In my last map, the 3rd district voted 55% for Obama because I did not have enough of Howard County and too much of Carroll County. Now with these changes, Obama won a solid 60% of the vote. Demographics are 23% African American, 6% Asian and 64% White. Status is Safe Democrat.

4th district Donna Edwards (D)

Originally, this district contained heavily Democratic areas in Prince Georges and Montgomery Counties. In my old map I gave the district some Republican parts of Frederick County. Now this version of the 4th district has part of Carroll County too. The district also does not violate the Voting Rights Act because 50% of the population in my 4th district is African American. Donna Edwards should have no trouble winning here against a Republican. Obama won 75% of the vote here. Demographics are 50% African American, 9% Hispanic and 33% White. Status is Safe Democrat.

5th District Steny Hoyer (D)

Steny Hoyer is the House Majority Leader so he should get whatever kind of district he wants. By removing parts of Prince Georges County and adding Republican parts of Anne Arundel County, the district grows less Democratic. Even though he should win in this district, he may not view it as safe enough for him. Still, the 27% African American population should be enough to protect him. Obama won 57% of the vote here. Demographics are 27% African American and 64% White. Status is Safe Democrat.

6th District Vacant

This district formerly belonged to octogenarian Roscoe Bartlett (R) but since I moved his home out of the 6th, the district is currently vacant. Since I put the majority of the district in Montgomery County, the district turns from heavily Republican to heavily Democratic. I also slipped in a small piece of Prince George’s County which was in the old 8th district and basically caused Chris Van Hollen (D) to win there in 2002. The Republican areas in the west should not be enough to offset Democratic margins here. Obama won 61% of the vote in the new 6th. Demographics are 14% African American, 7% Asian, 12% Hispanic and 64% White. Status is Safe Democrat.

7th District Elijah Cummings (D)

This district also barely meets the VRA standards but it does. It also includes heavily African American and Democratic parts of Baltimore City and County (Obama won 98% of the vote in many of the precincts) but also goes to the Pennsylvania border and includes heavily Republican exurban areas in Baltimore and Harford Counties. Even though the suburban areas are extremely Republican, the district still remains heavily Democratic and Cummings should not have much trouble with reelection. Obama won 66% of the vote here. Demographics are 50% African American and 42% White. Status is Safe Democrat.

8th District Chris Van Hollen (D) v. Roscoe Bartlett (R)

Since Bartlett is very old and this district is anchored in Montgomery County, he should just retire instead of facing a hard race. Van Hollen is a strong candidate with deep pockets. Anyway, Van Hollen’s new district contains most of Frederick County which leans Republican and retains part of Montgomery County which leans Democratic. Obama won 64% of the vote here. Demographics are 14% African American, 11% Asian, 13% Hispanic and 58% White. Status is Safe Democrat

By what margin will Bob Shamansky win?

View Results

Loading ... Loading ...

Bold Maryland Gerrymanders

I was playing around with the newly-updated Dave’s Application that has partisan numbers and was inspired to draw a few new maps for fun !  (I think I like doing this just a little too much …)

MattTX2 inspired me in this post when he said: “One other thing I recently noticed is that in the southern half of the Eastern Shore there are some strong GOP areas have high relatively high African American populations but are still pretty strongly GOP (Talbot, Dorchester, and everything to the South). Those could theoretically be given to Donna Edwards MD-04, bringing it down to the mid/high 60s Obama% while following the voting rights act. That frees up some more heavily Democratic areas in Prince George’s County for other districts. Then MD-01 can stretch around most of the rest of the northern part of the Chesapeake Bay, and into Baltimore to make that seat Democratic.”

At first glance, I thought the same thing as others (and what I’ve always though too) that the Eastern Shore shouldn’t be split and that it would be a very tough sell for the Legislature to do during redistricting – and probably this conventional wisdom is still correct … BUT, what if the Shore can be split ?  the way to do it would be to neatly split the Upper Shore from the Lower Shore … if the Legislature went for any splitting of the Shore, it might be when done in such a manner, as the two parts of the Shore are somewhat distinct when split along this line.  

MattTX2 is correct that drawing the lines this way would be the most economical way for Democrats to free up more Democratic areas in PG Co. to be used for other districts on the western shore.  The plan here keeps both MD-4 and MD-7 majority African-American (50%+) while making every other district either 59% Obama (MD-1, MD-3, and MD-6) or 60% Obama (MD-2, MD-5 and MD-8).  This is marginally even better than the plan I originally drew in September, where I had Obama with at least 58% in each district:  http://www.swingstateproject.c…  It appears that the only way to get to at least 59%-60% Obama for each Maryland district, WHILE keeping the two majority black districts intact, is to use the Lower Eastern Shore in this manner.  

Here’s the map:

MAP 1: At least 59% Obama in each district; both black-majority districts preserved

Photobucket

This is advantageous in that all districts now will be solidly Democratic.  MD- 3 currently is itself 59% Obama, so it will be just as Democratic under the new lines as it currently is. MD-1 and MD-6 will, ofcourse, be a lot more Democratic than they currently are — at 59% Obama under the new lines.  MD-2 is now at 60% Obama, and that will not change.  In MD-5 and MD-8 the Democratic percentage will go down ofcourse, but at 60% Obama, they will still be very safe districts for us.  Interestingly, both Hoyer and Van Hollen are near the top of the Democratic power hierarchy, so they should have the resources to win in 60% Obama districts.  Hoyer might even like this less-Democratic district better, as it’s also less African-American and thus the lesser likelihood of a Democratic primary challenge for Hoyer in the future.  Van Hollen’s new district is one, btw, where the John Kerry percentage would be around 55% even under the new lines, as Obama’s improvement on Kerry was not as great in Montg. Co. and western MD as in other parts of the state (in all other districts drawn here, Kerry would have received at least approx. 53% of the vote).

While the black percentage in the new MD-4 and MD-7 will only be 50%+ black (which will satisfy the VRA), these districts will also be guaranteed to have continued black representation because in both districts, blacks as a percentage of the Democratic primary will still be at around 70%, and when it comes to the general election, the new MD-4 and MD-7 voted 70% Obama and 67% Obama, respectively.  

I have also kept the home of each incumbent in the district in which they currently are under the new lines.  Although my “TTP” scores are lower than in an ideal situation, each district manages to preserve at least 30% of the territory of the current district (but in most cases here, hovers around 40%, with the new MD-8 being an exception in that a full 56% of the population is preserved – although, ironically, the new MD-8 “looks” quite different on a map).

The second map I drew for fun is an EVIL 5-3 Republican gerrymander !  It’s possible to redraw Maryland in a manner where McCain wins 5 districts (albeit all 5 by the slightest margin) while Obama wins MD-4 and MD-7 by 92% and 90%, respectively, while MD-8 is 75% Obama.  Here it is:

MAP 2: Evil 5-3 GOP gerrymander

Photobucket

Under the map above, MD-4 and MD-7 are 68% and 69% black, respectively, while the new MD-8 is only at 49% white (blacks and Hispanics both at 17% and Asians at 13%).  This would be a GOP dream come true.  Perhaps Kratovil or Hoyer could still win the new MD-1 but it wouldn’t be guaranteed.  The GOP could draft Ehrlich to run for his old MD-2 again, or perhaps the new MD-3, as Ehrlich grew up in Arbutus.  Bartlett could still face a strong Democratic challenge in his new MD-6, but another GOPer could be a lot stronger there.  The new MD-5 could easily go Republican if they ran an Anne Arundel-based moderate to conservative candidate.  It’s interesting to note that under the EVIL GOP plan, the districts appear fairly compact and overall seem to respect county lines and “communities of interest” (!) a lot more than the first map I drew.

Redistricting Maryland (the avalanche begins)

Hey everyone,

So yeah, I’ve made a few maps in my spare time since yesterday (more than I probably should have). The first is a PERFECT 8-0 map of Maryland that takes into account a number of good things I’ve seen in other Maryland maps on this site.

District 1 – blue – basically silver spring’s construction of MD-01, the best one I’ve seen. 57-40 Obama

District 2 – green – Similar to the current 2, but better. More democratic and a little less crazy-looking (in my opinion) 62-35 Obama

District 3 – purple – the only district that I’ve moved substantially. Sorry Sarbanes, but taking 3 through Baltimore just makes everything else too crazy. Though originally a Baltimore City district, the real base for this district today should be Howard County, which is already 60-40 Obama and should not be split. Eventually population loss will move this one out of Baltimore anyway, so Sarbanes can move. 60-37 Obama.

District 4 – red – did not want to move it into Baltimore County, but if I didn’t it would’ve been overpacked with Dems more than it already is. 50% black. 69-28 Obama

District 5 – yellow – more Anne Arundel-based, but also less gerrymandered-looking. 60-38 Obama.

District 6 – bluish-purple – Maryland redistricting fans know the drill here. Split MontCo, 60-37 Obama.

District 7 – grey – takes in more Republican territory. 50% black. 64-34 Obama (this is some really Republican territory we’re talking about here for a majority-black district in MD to only vote 64% for Obama)

District 8 – teal – CVH should be fine. 60-37 Obama.

Here are some other ones I made. First a 4-4 Rep gerrymander:


All 4 Rep districts are about R+4 or R+5, so they should hold.

Next, a “fair” 7-1 Dem map. I define a fair map as only splitting the counties that need to be split (unless necessary), making each county that needs to be split have at least one exclusive congressional district, and making the districts that go into multiple counties have at least one large unified geographical base (like a large county or accepted cultural region).


The teal, purple, yellow, and green distrits are all around D+1 to D+3.

Here’s a “fair” 6-2 map.


Every district is at least 58% Obama (D+5). How crazy is that?

Here’s an attempt at a “fair” rep map.


The green and yellow districts actually voted for Obama (D+0 to D+1). The teal and blue districts voted for McCain slightly (R+3)

Well, that’s it; let me know what you think.

Redistricting Maryland Legislature

Using Dave’s Application, I have drawn a redistricting plan for the Maryland legislature.  The legislature is overwhelmingly Democratic (33 out of 47 Senators and 104 out of 141 Delegates), but because of population shifts since the last census, several Democratic seats may be at risk in the next round of redistricting.  

Under the plan drawn in this diary, all Democratic seats are preserved and/or strengthened.  Different things can happen in elections, but, in the most likely scenario, the new lines will add 3 or 4 Democratic Senators (Districts 9, 31, 37, and perhaps District 3 – if Alex Mooney survives the 2010 election) and between 11 and 14 Democratic Delegates (discussed later in the diary).   (Yes, at that point the Democratic presence in the Maryland Legislature would approach that found today in the Massachusetts Legislature ! … well, maybe not quite that high, but in reality within 10 points of Massachusetts.)  The new plan is also likely to add several African-American representatives, and possibly a new Hispanic member.

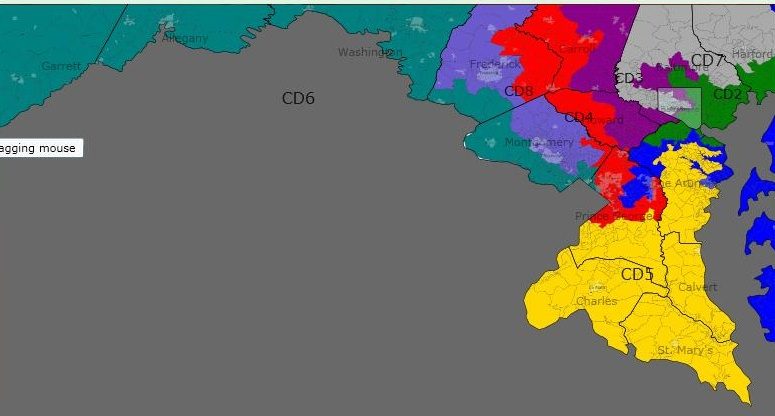
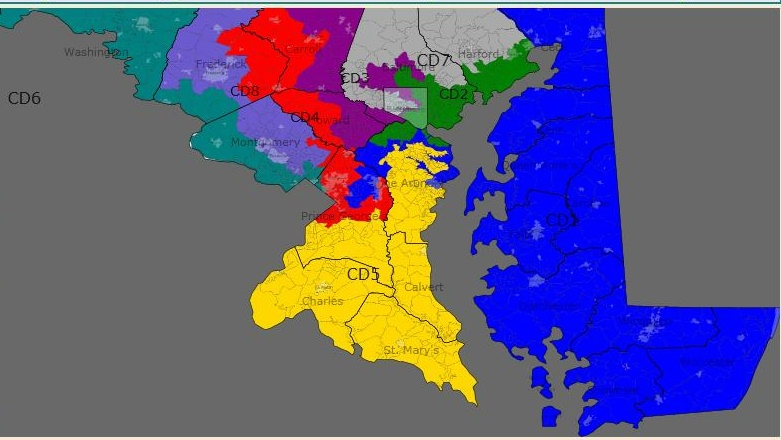
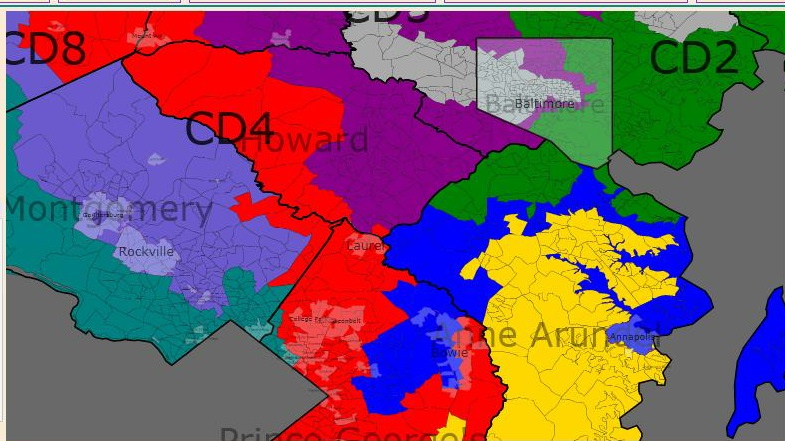
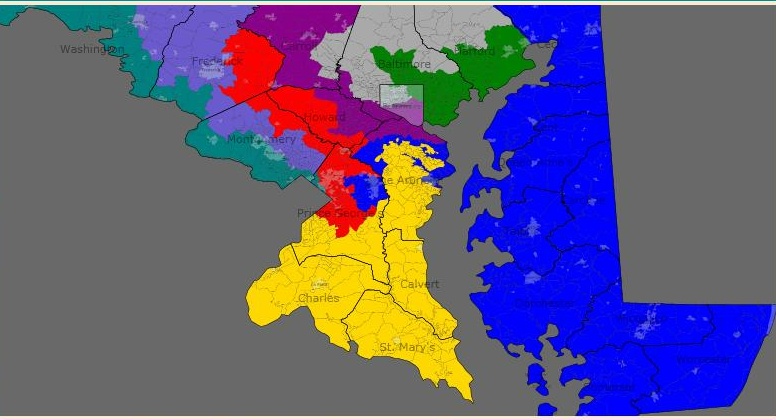
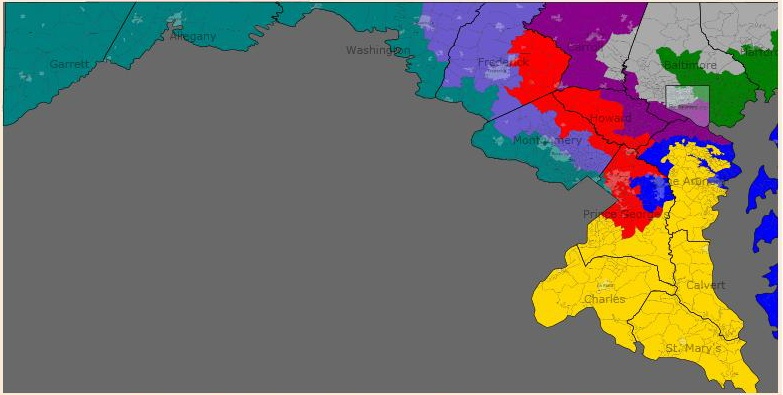
The new districts are also very compact and correspond to county lines and communities — even more so than the current map !  The links below are maps of the current districts to compare:

http://en.wikipedia.org/wiki/C…

http://en.wikipedia.org/wiki/L…

Under this proposed map, districts will cross county lines only when it’s necessary to preserve equal population and/or when necessary to preserve or strengthen minority-majority districts or minority-influenced districts.  Even though Courts gave great leeway to the Governor in drawing Congressional seats last time, they were much more strict when it came to drawing state legislative seats.  In effect, Gov. Glendening’s plan was ripped up and the Courts drew the existing plan.  

The new plan I drew allows for population deviations of only 1,000 persons or less (much stricter than the existing map which I believe allowed for up to around plus/minus 5,000 persons).  Most new districts are made where there’s one Senator and three Delegates; the only exceptions are more rural, multi-county districts as well as break-ups of districts into Delegate sub-districts in order to preserve or encourage minority-population representation.  

Each district will contain approximately 120,000 persons.  Sub-districts will contain 40,000 persons if designed for one Delegate, and 80,000 if designed for two Delegates.  The only major instance of a district completely “re-locating” from one part of the state to another is District 46.  Relative population decline/lack of growth in the city of Baltimore will necessitate the loss of one district there.  No. 46 is the perfect candidate, as the other five districts are all minority-majority and have to be preserved under the VRA.  The new District 46 will straddle the Baltimore Co./Harford Co. line (Harford Co. has been one of the fastest growing parts of the state) but has been designed to be a Democratic district.  

MAPS:

Photobucket

Photobucket

Photobucket

Photobucket

Photobucket

Photobucket

DISCUSSION OF DISTRICTS:

District 1 – Western Maryland

New district: 93% white; 32% Obama (Obama percentage is same as in current district)

The only real change here is to divide into sub-districts a little differently from the current map:

1A – Garrett County, part of Allegany; 27% Obama (same as current district)

1B – Frostburg and Cumberland; 41% Obama (current district 34% Obama)

1C – parts of Allegany and Washington Counties; 31% Obama (current district 36% Obama)

I am really not sure why the sub-districts are currently drawn as they are.  This re-drawing should shore up the one Democratic representative in this whole district, Kevin Kelly of 1B; his redrawn district will now include most of Cumberland.  It is interesting to note that 1B is one of only two districts/sub-districts in the state where John Kerry performed better than Obama (the other is District 6).

District 2 – Washington County

New district: 82% white; 11% black; 45% Obama (Obama percentage is same as in current district)

No major changes here except to reconfigure the sub-districts.  Instead of three sub-districts, the new plan has only two:

2A – Hagerstown and surrounding precincts; two Delegates; 49% Obama

2B – more rural remainder of District 2; one Delegate; 36% Obama

OK … this may be a slightly risky move (actually, the only really risky thing I do in this entire re-map).  2A will now combine the more Democratic Hagerstown with the more Republican precincts that immediately surround it.  The wager is that two Democrats can be elected in a 49% Obama district; the risk is that two Republicans can as well, causing the loss of one Democratic Delegate.  Perhaps the current plan can be basically preserved instead — where the sub-district corresponding almost exactly to the City of Hagerstown (55% Obama) is designed to elect the one Democrat, while the other two sub-districts continue to elect the GOP ?

Bottom line for District 2: Possible addition of one Democratic Delegate.

District 3 – City of Frederick and southern Frederick County

New district: 70% white; 13% black; 56% Obama (current district 54% Obama)

The major change here is to get rid of the sub-districts.  A district that is 56% Obama (and becoming more Democratic as time goes on as more people from outside Frederick Co. stream in) should be able to elect three Democratic Delegates, instead of the current two in 3A (City of Frederick) and the Republican-turned-Independent in 3B (southern Frederick Co.).  Right-wing GOP Senator Alex Mooney should probably be on the way out in elections next year (he won in 2006 with only 51.9% of the vote, and this district has experienced an influx of less conservative people moving in since then); the increase in the Democratic percentage (from 54% to 56% Obama) should help also once the new lines are in place in 2012.

Bottom line for District 3: Probable addition of Democratic Senator (if the incumbent survives 2010) and one Democratic Delegate.

District 4 – Frederick County, parts of Washington and Carroll Counties

New district: 90% white; 38% Obama (current district 37% Obama)

The sub-districts are eliminated and the new District 4 will now be confined mostly to Frederick County (previously about one-third of the district was in Carroll Co.)   The only areas outside the county (necessary to preserve equal population of each district) will be Smithsburg in Washington Co. and Mt. Airy which straddles the Carroll Co./Frederick Co. line.  The GOP is expected to dominate here.

District 5 – Carroll County

New district: 92% white; 32% Obama (current district 33% Obama)

Like with District 4, the sub-districts are eliminated and the district will now be completely confined to Carroll County, instead of stretching out into northern Baltimore County.  GOP stronghold.

District 6 – Dundalk, Sparrows Point, east Baltimore

New district: 72% white; 21% black; 54% Obama (current district 45% Obama)

This area is a traditional blue-collar Democratic stronghold that has shifted to the right over the decades (your quintessential Reagan Democrat country).  The current District 6 is the only full district in the state of Maryland (out of 47) where John Kerry performed better than Obama.  Democrats still win here locally, but in order to make the district safer for the future, the Democratic percentage is increased substantially.  This is done in tandem with combining parts of east Baltimore City with the Baltimore County portion of the district.  

It should be noted that the break-down here is almost exactly such that the Baltimore City portion could be made into a sub-district electing one Delegate, while the Baltimore Co. part could be a two-Delegate sub-district.  However, such a move might be politically risky.  The Baltimore Co. part voted only 42% Obama and could realistically elect two Republicans at some point in the future if made into a sub-district.  The Baltimore City part is plurality African-American (47% black; 44% white) and voted 83% Obama, but it probably contains almost as many registered white Democrats as black Democrats due to historical factors, so an African-American Delegate would not by any means be assured.  Therefore, two good reasons to keep the new District 6 without sub-districts.

District 7 – northern Baltimore County, part of Harford County

New district: 88% white; 35% Obama (current district 39% Obama)

The new district combines most current areas of the district in Baltimore and Harford Counties with territory in northern-most Baltimore Co. which was previously part of District 5.  The district becomes even more Republican than the current form.

District 8 – Parkville, Carney, Overlea, Rosedale, White Marsh

New district: 72% white; 16% black; 52% Obama (current district 48% Obama)

The current district is represented by a Democratic Senator, two Democratic Delegates and one Republican Delegate.  The Republican won by a smidge last time, and the increase in the Democratic percentage (48% Obama to 52% Obama) should help.

Bottom line for District 8: Probable addition of one Democratic Delegate.

District 9 – Howard County (Ellicott City, west Columbia)

New district: 65% white; 15% black; 13% Asian; 58% Obama (current district 43% Obama)

The new District 9 is another good example of how we can make a district more compact, yet more Democratic at the same time.  The current district stretches across Howard and Carroll Counties and is quite Republican.  The new district is confined entirely to Howard Co. and is a lot more Democratic.  (It should be noted that the detachment of the western part of Columbia from District 12 does not hurt that district at all, as explained

later).

Bottom line for District 9: Probable addition of Democratic Senator and three Democratic Delegates.

District 10 – parts of Baltimore Co. (Milford Mill, Lochearn, Randallstown) and Carroll Co. (Sykesville, Eldersburg)

New district: 51% black; 41% white; 67% Obama (current district 87% Obama)

The new district stretches along the Liberty Road corridor from just outside the Baltimore City line into Carroll County.  The district is assured of continuing to elect an all African-American Democratic delegation as approximately 70-75% of the Democratic primary vote here is black, and the district overall is about two-thirds Democratic.

District 11 – northwestern Baltimore County

New district: 59% white; 30% black; 65% Obama (current district 66% Obama)

Remains solidly Democratic.  I have divided the new district into two sub-districts:

11A – two-Delegate district; Reisterstown, Owings Mills, Mays Chapel; 72% white; 15% black; 56% Obama

11B – one-Delegate district; parts of Randallstown and Pikesville; 58% black; 33% white; 84% Obama

The creation of sub-district 11B should add one African-American to the state’s delegation.  In the meantime, because of the way the lines are drawn, one of the current three Delegates here could run in the new District 42 which now will include a substantial part of Pikesville.  The 56% Obama percentage in 11A should not be a concern, as this is a safe Democratic district, particularly on the local level.  (John Kerry actually did better than Obama in several precincts of the new 11A, so Obama’s 56% percentage is not some sort of Democratic “ceiling” for the area, as it would be in other districts.)

Bottom line for District 11: Probable addition of African-American Delegate.

District 12 – southwestern Baltimore County; eastern Howard County

New district: 63% white; 24% black; 59% Obama (current district 58% Obama)

The new district covers much of the same area as the current district.  The major exception is that a part of Columbia (sub-district 12B) is taken out.  However, a new sub-district 12B (also with one Delegate) is created.  The new 12B encompasses most of Woodlawn and is majority black, and its creation is likely to add another African-American to the state’s delegation.  Here’s more numbers:

12A – two-Delegates; Catonsville, Elkridge; 77% white; 10% black; 50% Obama (current 12A is also 50% Obama)

12B – one-Delegate; Woodlawn; 53% black; 35% white; 81% Obama

Bottom line for District 12: Probable addition of African-American Delegate.

District 13 – Howard County (east Columbia, Savage, North Laurel)

New district: 60% white; 20% black; 10% Asian; 63% Obama (current district 65% Obama)

This district stays very similar to the current configuration.  District 13 was represented in the state Senate by a Republican, Sandy Schrader, prior to the 2006 election (even when the three Delegates were all Democrats).  Schrader won in 2002 with 50.95% of the vote, but received only 43.8% in her re-election attempt in 2006. This district has definitely moved in the Democratic direction over the years, and the slight decline in Democratic performance here under the proposed lines (from 65% Obama to 63% Obama) will still leave this a safe Democratic seat.

Districts 14, 15, 16, 17, 18, 19, 20 and 39 – Montgomery County

We next move to Montgomery County, where the district lines change very, very little under my map. The all-Democratic delegation here (8 Senators and 24 Delegates) is something I am very proud of (I live in Silver Spring).  I attempted to create sub-districts here which could be designed to elect minority representatives, but my efforts were futile, as the minority population is very diverse and scattered throughout the county.  But no tears lost … Even under the current lines, Montgomery is likely to elect a very multi-ethnic delegation — in fact, it already does so, with black, Hispanic, and Asian (east Asian, south Asian, as well as Middle Eastern-origin) representatives … and several openly gay representatives also.

New District 14: Burtonsville, Olney, Brookeville, Laytonsville, Damascus

59% white; 20% black; 12% Asian; 65% Obama (Obama percentage is same as in current district)

New District 15: Potomac, Poolesville, Clarksburg

67% white; 14% Asian; 65% Obama (Obama percentage is same as in current district)

New District 16: Bethesda, Garrett Park

70% white; 11% Asian; 11% Hispanic; 73% Obama (current district 74% Obama)

New District 17: Rockville, Gaithersburg

48% white; 20% Hispanic; 16% Asian; 12% black (quite diverse !); 71% Obama (Obama percentage is same as in current district)

New District 18: Wheaton, Kensington, Chevy Chase

51% white; 19% Hispanic; 18% black; 76% Obama (Obama percentage is same as in current district)

New District 19: Aspen Hill, Leisure World, Derwood

49% white; 18% black; 16% Hispanic; 13% Asian (another very diverse district); 68% Obama (Obama percentage is same as in current district)

New District 20: Silver Spring, Takoma Park, White Oak

31% white; 31% black; 23% Hispanic; 12% Asian (by far, the most ethnically diverse district in Maryland); what’s not diverse is political preference: 85% Obama (Obama percentage is same as in current district); this district is where I live, btw !

It should be noted that under this map, District 20 extends into two precincts in Prince George’s County, in order to meet equal population standards; however, the new districts may be designed in such a way where all eight Montgomery County seats are confined exclusively to the county (I’m using a deviation of under 1,000 persons, while Courts in the past have used a considerably higher number; bottom line: those two PG Co. precincts may not need to be a part of District 20).

New District 39: Germantown, Montgomery Village, North Potomac

50% white; 18% Asian; 15% black; 12% Hispanic; 71% Obama (Obama percentage is same as in current district)

District 21 – northern Prince George’s County

New district: 47% white; 31% black; 10% Hispanic; 78% Obama (current district 75% Obama)

The new district is now completely contained within PG Co.  I just didn’t think that it made sense to have a district stretch from College Park all the way to Odenton in Anne Arundel County (as does the current District 21).  I also divided the new district into sub-districts in order to create a minority-opportunity seat centered on Laurel, which is relatively more African-American than other parts of District 21 (it should be noted, though, that the current district already elects a minority representative who lives in College Park, so perhaps a sub-district is unnecessary here ?).  The new numbers are:

21A – two Delegates; College Park, University Park, Beltsville, part of Bowie; 54% white; 24% black; Obama 76%

21B – one Delegate; Laurel; 46% black, 33% white; 11% Hispanic; Obama 83%

District 22 – northern Prince George’s County

New district: 50% black; 25% Hispanic; 16% white; 85% Obama (Obama percentage is same as in current district)

The new district is quite similar to the existing one.  Senator Paul Pinsky should have no trouble getting re-elected here.  Once he retires, however, this district is likely to elect an African-American Senator.  I have also divided this district into sub-districts.  Currently, two of the three Delegates here are white, even though the current district’s ethnic composition is similar to the proposed district.  Creating sub-districts here may screw up that dynamic; however, I do so anyways in order to create a Hispanic-opportunity sub-district (Hispanics seem to be vastly under-represented in the state legislature):

22A – two Delegates; Greenbelt, New Carrolton, Landover Hills; 57% black; 18% Hispanic; 16% white

22B – one Delegate; Hyattsville; Riverdale; 39% Hispanic; 38% black; 16% white; the new 22B is barely Hispanic plurality; however, the Hispanic population is still growing here, so this district may become an opportunity district for the population.

Bottom line for District 22: Possible addition of a Hispanic Delegate.

District 23 – parts of Prince George’s Co. (Largo/Kettering, Mitchelville, Bowie) and Anne Arundel Co. (Crofton, Gambrills, Fort Meade)

New district: 45% black; 44% white; 74% Obama (current district 81% Obama)

Since this re-map made District 21 confined to PG Co., the new District 23 has to play the opposite role and reach outside PG, into Anne Arundel County.  I think this proposed map is more logical — it makes much more sense to have Bowie and Crofton in the same district than to have College Park and Odenton in the same district.  

The new district becomes plurality black, and most registered Democrats here are black (as a good part of the white population in Anne Arundel is Republican).  Nevertheless, the numbers are not overwhelming either way, and should not hurt the currently racially-diverse delegation.  I decided to drop the sub-districts however, as they seem unnecessary under the circumstances, and could only hurt Democratic chances if, for instance, a part of the Anne Arundel Co. portion of the district was made into a sub-district.

Districts 24, 25, 26 – central and southern Prince George’s Co.

These three districts remain largely very similar to the current districts.

New District 24: Capitol Heights, Seat Pleasant, Suitland, Glenarden; 86% black; 98% Obama (Obama percentage is same as in current district)

New District 25: District Heights, Forestville, parts of Upper Marlboro; 78% black; 14% white; 95% Obama (current district 96% Obama)

New District 26: Oxon Hill, Temple Hills, Fort Washington; 80% black; 93% Obama (current district 94% Obama)

District 27 – Calvert County and southern Prince George’s Co.

New district: 67% white; 26% black; 57% Obama (current district 71% Obama)

The new district is more compact than the current District 27, now taking in all of Calvert County (Calvert has experienced some of the highest population growth in the state, and will now account for two-thirds of the new district).  The rest of the new district will be a Prince George’s Co.-based minority-majority sub-district.  Thus, the major change here is that sub-district 27A will now have one Delegate, instead of two, and 27B will have two instead of one.  

Senate Leader Mike Miller should be quite happy with the new lines, as his seat becomes more Calvert-based (his home) and it is less likely that he will be challenged in the Democratic primary by an African-American in the future.  

27A – one Delegate; southern Prince George’s County and several precincts in Calvert and Charles to preserve equal population; 52% black; 40% white; 81% Obama (Obama percentage is same as in current sub-district)

27B – two Delegates; all of Calvert Co. except for northern-most area around Dunkirk; 79% white; 14% black; 47% Obama (Obama percentage is same as in current sub-district)

Even though sub-district 27B remains at only 47% Obama, it should be noted that the current Delegate, Democrat Sue Kullen, won with 57% of the vote in 2006.  Anthony O’Donnell (from southern Calvert, currently in sub-district 29C) could also run here, but even if he were to win, his gain here would be effectively offset by his disappearance from District 29.

District 28 – Charles County

New district: 50% white; 39% black; 64% Obama (current district 63% Obama)

The lines here change only insofar that several precincts in the eastern part of the county are taken out to preserve equal population.  There’s a good chance that this district will become majority black over the next decade.

District 29 – St. Mary’s County, part of Charles Co.

New district: 75% white; 17% black; 45% Obama (current district 44% Obama)

The new district is more compact than the current one, and all of St. Mary’s County will now be in one district.  The sub-districts are eliminated, and I’m hopefully optimistic  that all three Delegates will be Democrats (currently both Delegates in 29A and 29B, which are areas almost entirely in St. Mary’s County, are Democrats elected with 65 and 64 percent of the vote; Republican Anthony O’Donnell won 29C — which straddles both St. Mary’s and Calvert Counties — with 60% but his sub-district becomes split in half between the new District 27 and the new District 29.)

District 30 – Annapolis and environs in Anne Arundel Co.

New district: 73% white; 16% black; 53% Obama (current district 52% Obama)

The lines here are tweaked just a bit in order to make the district more Democratic.  The current district is represented by a Democratic Senator and two out of three Delegates are also Democrats.  The lone Republican, Delegate Ron George, won by 53 votes last time (or one-tenth of a percentage point), and so the change from 52% Obama to 53% Obama may be helpful in the future — assuming George even makes it through 2010 under the current lines, which is less than assured.

Bottom line for District 30: Probable addition of one Democratic Delegate (if the sole Republican is not defeated by the time the new lines come into being).

District 31 – Glen Burnie, Brooklyn Park, Riviera Beach

New district: 75% white; 14% black; 48% Obama (current district 40% Obama)

The political composition of this Anne Arundel district changes significantly under this re-map.  Parts of Glen Burnie currently in District 32 are added (except for the homes of several District 32 incumbents which remain in the 32nd) while most of hyper-Republican Pasadena is detached.  (Under the new lines, most of Glen Burnie is now part of one district, instead of being split in half between Districts 31 and 32.)  The result is a district that goes from 40% Obama to 48% Obama.  

It is quite likely that all four Republican representatives will disappear under the new lines, and will be replaced by four Democrats.  The GOP Senator here, Bob Jones University graduate Bryan Simonaire, won last time with only 50.8% of the vote, and he lives in Pasadena, now outside the district.  The three GOP Delegates all won by relatively small margins also, and two of the three also live in Pasadena.  

The one Delegate whose home remains in the new 31st is Don Dwyer, a rabidly right-wing homophobe who makes Simonaire appear like a moderate in comparison (Dwyer is so right-wing that he has effectively taken himself out of the Republican caucus, as they are apparently not conservative enough for him, though he remains a Republican.)  Dwyer won re-election by 25 votes last time (even the current 58% McCain district had barely the stomach for him), and it’s far from assured that he will win in 2010.  If for some reason he makes it next year, the new lines and district composition will pose a very formidable obstacle for him in 2014.  

This area, btw, is traditionally quite Democratic, but parts contain many conservative Reagan Democrats.  In that light, the 48% Obama of the proposed District 31 should not be seen as a Democratic ceiling for the district; in a number of precincts in the area, including ones in Brooklyn Park and Riviera Beach, John Kerry performed better than Obama.  (Disclosure: I grew up in Brooklyn Park, and my mom still lives there, hence this long entry re. District 31 … that, and the fact that the odious Don Dwyer is still a representative there.)

(It should be noted that in drawing this district, I used new precinct lines for the map in the very southern end of this district, where it dips into a sliver of Severna Park — precincts no. 5-10 and 5-12 on Dave’s Application — which are now really four separate precincts, not just two.  The lines the Application uses are based on precincts as they existed in 2002 but in this particular area it made more sense to use the new lines to include a new African-American majority precinct into District 31 and exclude a very GOP new precinct nearby.  Incidentally, the current border between Congressional Districts 1 and 3 in that area makes use of the same new lines).

Bottom line for District 31: Probable addition of Democratic Senator and three Democratic Delegates.

District 32 – Linthicum, Severn, Odenton, Arbutus/Lansdowne

New district: 61% white; 25% black; 54% Obama (Obama percentage is same as in current district)

Like the current incarnation, the new district encompasses much of northwestern Anne Arundel County.  The district also crosses over into a part of Baltimore County, in order to maintain equal population.  The current all-Democratic delegation looks to be in good shape under the new lines.

District 33 – Pasadena/Lake Shore, Severna Park, Crownsville, Davidsonville

New district: 89% white; 37% Obama (current district 43% Obama)

The new District 33 combines the most Republican communities of Anne Arundel County into one district.  Geographically, it pretty much resembles the current district with Pasadena added.  The two current sub-districts are eliminated.  

I thought about having three separate sub-districts here – 1.) Pasadena, 2.) Severna Park/Crownsville, and 3.) southern remainder of the district.  Such an arrangement might perhaps lead to a local Democrat capturing one of the districts at some point (although it hasn’t happened in any of the current GOP districts which Democrats sub-divided last time in order to enhance the possibility of a Democrat capturing one of the sub-districts).  However, my original goal was to create sub-districts only for large, rural, multi-county districts (so that each county could have a voice in the Assembly) and/or for minority-majority or minority-opportunity districts.  Besides those exceptions, it wouldn’t be fair to have only Republican districts sub-divided and not the Democratic ones.

District 34 – parts of Harford and Cecil Counties

New district: 80% white; 12% black; 46% Obama (current district 48% Obama)

This district largely resembles the current 34th, except that the Edgewood and Joppatowne areas in southern Harford have been taken out in order to preserve equal population (this area has experienced a lot of population growth).  The new district becomes a little less Democratic, but the current political balance here should remain (GOP Senator, and three Democratic Delegates). Although the Harford Co. part would correspond almost perfectly to a one-Delegate sub-district, it is politically better to eliminate sub-districts here, as the more Democratic area in Harford will balance the more Republican two-thirds of the new district in Cecil County.

District 35 – Harford County

New district: 91% white; 30% Obama (current district 31% Obama)

Remains very similar to the current district which is a GOP stronghold.

District 36 – Eastern Shore

New district: 86% white; 40% Obama (current district 41% Obama)

The current district expands south and is sub-divided into three sub-districts — each corresponding closely to a county or set of counties:

36A – Cecil and Kent Counties (also includes one precinct in Queen Anne’s directly across from Chestertown in order to maintain equal population); 46% Obama; this sub-district could perhaps elect a Democrat, breaking the GOP stranglehold on District 36.

36B – most of Queen Anne’s County; 36% Obama

36C – Talbot and Dorchester Counties; 39% Obama

District 37 – Eastern Shore

New District: 61% white; 32% black; 52% Obama (current district 46% Obama)

Currently, three out of four representatives here are Republicans.  The re-map expands the current district northward and the sub-districts remain.  However, sub-district 37A will now have two Delegates, instead of one, and 37B will have one instead of two.  The lines forming the border between the new 36th and 37th don’t line up perfectly with county boundaries.  However, the goal here was to create a minority-influence district on the Shore.  Even though only about a third of the population of the new 37th is black, that population might have an effective voice in how the district is represented in Annapolis, through an alignment with white Democrats in the area — the borders intentionally include more “liberal” (relatively) white-majority  areas like Chestertown and Easton.

Here’s a break-down of the sub-districts:

37A – two Delegates; lower Eastern Shore: Salisbury, Princess Anne, Cambridge, Easton; 51% white; 41% black; 58% Obama; although on paper this district is majority white (barely), blacks constitute a majority of the Democratic primary vote here.  Thus, there’s a good chance the district can elect two African-American Delegates (increasing their representation on the Shore by one).

37B – one Delegate; most of Caroline County, part of Queen Anne’s and Chestertown (Kent Co.); 79% white; 13% black; 41% Obama; likely to elect a GOP Delegate.

Bottom line for District 37: Probable addition of Democratic Senator and one Democratic Delegate (there’s a good chance the Delegate will be African-American).

District 38 – lower Eastern Shore

New District: 81% white; 13% black; 40% Obama (current district 41% Obama)

The new 38th is quite similar to the current district.  The district here currently elects a GOP Senator and GOP Delegate in sub-district 38A, while 38B elects two Democrats, even though that area is even more Republican than 38A.  The two Democrats include one legislator from Salisbury and a former mayor of Ocean City, so personal popularity likely plays a part, especially in the case of the latter.

38A – includes parts of Somerset and Wicomico Counties (as does the current sub-district) but also expands east into Worcester Co.

38B – includes much of Worcester Co. and part of Wicomico around Salisbury.

District 39 – see earlier entry under Districts 14, 15, etc. (Montgomery County)

Districts 40, 41, 43, 44, 45 – Baltimore City

As I already discussed, due to stagnant population growth, Baltimore City has to lose one of its current districts, and the 46th is the only logical candidate.  (Also, as already discussed, the eastern-most part of the city will be combined with adjoining parts of Baltimore County into a new 6th District.)  The other five districts are reconfigured but still keep the basic shape and identity of their current incarnations:

New District 40: west-central Baltimore

64% black; 28% white; 89% Obama (current district 93% Obama)

New District 41: northwest Baltimore

64% black; 30% white; 84% Obama (current district 87% Obama)

New District 43: northeast Baltimore

63% black; 30% white; 90% Obama (current district 91% Obama)

New District 44: southwest and south Baltimore

63% black; 31% white; 86% Obama (current district 92% Obama)

New District 45: east-central Baltimore

63% black; 28% white; 86% Obama (current district 90% Obama)

District 42 – Towson, Timonium, Cockeysville, Pikesville

New District: 71% white; 18% black; 58% Obama (current district 53% Obama)

The current district is represented in the Senate by a Democrat.  However, two out of three Delegates are Republicans.  The new district expands into more Democratic areas, including Pikesville, and the Democratic percentage goes up, from 53% Obama to 58% Obama.  The increase should be enough to produce an all-Democratic delegation here (both Republican delegates won by small margins last time).  

Bottom line for District 42: Probable addition of two Democratic Delegates.

District 46 – parts of Baltimore Co. (Essex, Middle River) and Harford Co. (Edgewood, Joppatowne)

New District: 69% white; 22% black; 51% Obama

This district is a newly-created one to account for population growth in the area (and it replaces the old 46th which was based in Baltimore City).  It was initially surprising to me that you could create a new, compact district here that is at the same time quite Democratic.  I was afraid that the new district would have to be a GOP stronghold, thus causing an automatic loss of a Democratic Senator and three Democratic Delegates.  But there is apparently a robust Democratic presence in this area; in fact, both the Baltimore Co. and Harford Co. parts of the new district voted for Obama ! (the Harford part by a larger margin though).  There are actually some very GOP precincts in the Baltimore Co. part of the district, but they seem to be outweighed by other very Democratic areas.

District 47 – northern Prince George’s County

New District: 52% black; 36% Hispanic; 93% Obama (current district 92% Obama)

The new 47th keeps mostly within the lines of the current district.  I have sub-divided the new District 47 into two sub-districts in order to provide the Hispanic community with a sub-district.  Perhaps this is completely unnecessary, as the district has already elected a Delegate who is Hispanic, even without a sub-district …  Nevertheless:

47A – two Delegates; Chillum; Mount Rainier, Brentwood, Bladensburg, Cheverly, Landover; 66% black; 22% Hispanic

47B – one Delegate; Langley Park; 63% Hispanic; 24% black; it’s interesting to note that this Hispanic-majority area voted over 90% for Obama.

So this is my plan for redistricting the Maryland Legislature.  I welcome your thoughts and comments.

Maryland Redistricting, 8-0 Democrats

Recently, I saw quite a few redistricting maps, especially on Maryland. Here is my perspective. Instead of playing it safe, I went all out for an 8-0 map. The Democrats are in control and may try for a map like this. I know what you are thinking; it will be too difficult for Democrats to hold. I feel that I definitely made each Democrat’s district safe enough for them without throwing the VRA down the drain. The Democrats have large majorities in the State Legislature and if they retain the Governorship, this map is realistic. Enough chatter, here are the maps.

Central/eastern Maryland

West Maryland

Balitmore Area

District 1 Frank Kratovli (D) Blue

This district did go to the western shore to pick up population. Yet it picked up heavily Republican areas to keep out of the 2nd and 3rd districts. Now that Maryland is trending Democratic, adding Republican areas to other districts will be offset by Democratic margins. This left me free to slip in Democratic Annapolis into Kratovli’s district as well as a hunk of Prince George’s County. These changes raised the Black percentage from 11% to 24%. If a Republican could not win in a district that is 11% Black, watch him or her try to win in a district with Prince George’s County. Obama probably won 54% of the vote here. Demographics are 24% Black and 67% White. Status is Likely Democrat.

District 2 Dutch Ruppersburger (D) Green

His district is less gerrymandered but should be safe. I added some Republican areas of Baltimore and Harford Counties but I slipped in more of Baltimore City. These changes should make the district a little more Republican. Ruppersburger is a popular representative and should handle himself. Obama probably won 53%-54% of the vote here. Demographics are 22% Black and 69% White. Status is Safe/Likely Democrat.

District 3 John Sarbanes (D) Reddish Purple

Okay, I see the flaws. Yes, I know I took Sarbanes’s home out of the district. I had to because the district would be too convoluted if I kept it. I also know that Carroll County is heavily Republican. I included Democratic territory in Howard County which should offset Republican margins in Carroll County and more. For any more Republican areas, Baltimore City should offset their margins. Bartlett is Sarbanes is the son of longtime former Senator Paul Sarbanes (D). I do not see Sarbanes losing here anytime soon. Obama probably won 56% of the vote here. Demographics are 23% Black, 5% Asian and 65% White. Status is Safe/Likely Democrat.

District 4 Donna Edwards (D) Red

Her district extends into Republican Frederick County but Edwards should be content. The 4th district is VRA protected. Obama probably won 73% of the vote here. Demographics are 50% Black, 5% Asian, 9% Hispanic and 33% White. Status is Safe Democrat.

District 5 Steny Hoyer (D) Yellow

I took out northeastern Prince George’s County and pushed the district into Republican parts of Anne Arundel County. I only reduced the Black percentage by 1% and should probably get higher in the mid 2010’s because of Blacks moving into Prince George and Charles counties. Hoyer and is successor are safe. Obama probably won 60% of the vote here. Demographics are 29% Black and 62% White. Status is Safe Democrat.

District 6 Vacant Teal

No current representative lives here. Even though I put in some heavily Republican counties in western Maryland, I more than erased that margin by 60% of this district in heavily Democratic Montgomery County. I slipped in about 84,000 people in Prince George’s County just to ensure Democratic votes. That area gave Chris Van Hollen (D) his winning margin against Connie Morella (R) so it had to be in this district to ensure it will vote Democratic. Mark Shriver (D) might want to run in this district. It would be nice to have another Kennedy in Congress. Obama probably won 62% of the vote here. Demographics are 13% Black, 8% Asian, 14% Hispanic and 61% White. Status is Safe Democrat.

District 7 Elijah Cummings (D)

This district is BARELY protected the VRA. I tried to squeeze in as many Republican precincts as I could while keeping the Black percentage at 50% or above. This district used to go into Howard County but now takes in Republican suburbs in Baltimore, Carroll and Harford Counties. Since almost all the Baltimore precincts in the 7th voted around 90% for Obama, Cummings should be very safe. Obama probably won 67% of the vote here. Demographics are 50% Black and 43% White. Status is Safe Democrat.

District 8 Chris Van Hollen (D) vs. Roscoe Bartlett (R) Purple

Bartlett is 83 years old and about 63% of the 8th district is in Montgomery County, Van Hollen’s home base. Bartlett can campaign as a moderate but I see Montgomery County voters sticking with Van Hollen. With Bartlett out of the picture, Van Hollen should have an easy ride to reelection. Obama probably won 63% of the vote here. Demographics are 16% Black, 10% Asian, 13% Hispanic and 58% White. Status is Safe/Likely Democrat if Bartlett decides to run, Safe Democrat without Bartlett.

By what margin will Bob Shamansky win?

View Results

Loading ... Loading ...

Redistricting Maryland: 8 Democrats Guaranteed

This is my third (and hopefully final) version of a redistricting plan for Maryland.  Thanks to Dave’s Redistricting application, the process was much easier this time for me, and I got a plan that virtually guarantees that 8 Democrats will be elected starting in 2012.  In each district, Obama received at least 58% of the vote (and McCain received under 40%; MD-1 is rounded off to 40.0, but it’s technically 39.98%).  The plan keeps the two majority African-American districts, and is also very incumbent-friendly (except for Bartlett ofcourse).  I normally make these diaries super long, but not this time.  Here’s the plan:

Photobucket

Photobucket

Photobucket

District 1

Dark Blue

Obama 58.1%; McCain 40.0%

Combines Eastern Shore (57% of new district) with areas on the western shore in Harford and Baltimore Counties and Baltimore City.  The new district is 33% African-American. Interestingly, the Baltimore County part is 62% African-American, but the Baltimore City part is only plurality African-American (not majority); I intentionally took out white-majority, yet very Democratic areas out of MD-7 (Charles Village, Mt. Vernon, Bolton Hill, etc.) so as not to do too much damage to Cummings’ district, while at the same time making MD-1 much more Democratic.

District 2

Green

Obama 58.5%; McCain 39.5%

The new district largely mirrors the current district in Baltimore and Harford Counties; a good part of Anne Arundel is also the same.  African-American areas in Baltimore City are taken out, but African-American areas in Prince George’s County are added, and the district remains politically almost exactly the same as before.

District 3

Magenta

Obama 58.8%; McCain 39.3%

Like MD-2, the new MD-3 largely mirrors the current district.  In some ways, it actually is kind of similar to what MD-3 looked like prior to 2002 (especially in Baltimore City). It’s a very Baltimore-oriented district, except for the 18% of the district that’s now in Montgomery County.

District 4

Red

Obama 73.6%; McCain 25.6%

Majority African-American (50%+); 6% Hispanic; 38% white.  Combines much of Prince George’s County (60% of new district) with mostly Republican areas in Anne Arundel County.

District 5

Aqua Blue

Obama 61.5%; McCain 37.2%

New district is very, very similar to the current one.

District 6

Gray

Obama 58.7%; McCain 39.4%

Combines parts of Montgomery County (57% of new district) with most of Frederick and Carroll Counties.  Good luck to Bartlett if he runs here.

District 7

Yellow

Obama 66.1%; McCain 32.3%

Majority African-American (50%+); 44% white; African-Americans are around 70-75% of the Democratic primary vote.  Combines most of Baltimore City (56% of new district) with more Republican areas in Baltimore, Harford and Cecil Counties.  African-American areas which were put in MD-2 as part of the 2002 redistricting are now returned to MD-7.

District 8

Violet

Obama 59.1%; McCain 39.1%

Combines parts of Montgomery County (60% of new district) with a part of Frederick County and all of western Maryland.

I should add that the new plan is indeed gerrymandered, but not any more so than the current plan.  Counties are split among districts, but again, it’s not any worse than currently.  I can likewise envision the plan being implemented from a legal point of view.  OK … that’s it; I said I would make it short.  Your thoughts ….

Redistricting Maryland (7-1 split)

I was so excited when I got online today and saw Dave had uploaded a map for Maryland (I was also pleasantly surprised to see he used voting districts instead of census tracts, since I think Maryland lawmakers use those when making maps). I just had to take the time to redistrict my home state today; I’ve always wanted to since I hate the current map with a passion – it’s gerrymandered beyond what’s necessary and it wastes a lot of Democratic voters in Montgomery County, Howard County, and Western Maryland.

My goal in this was to create a 7-1 split. I know people have drawn maps that are 8-0, but I really didn’t want this to be too gerrymandered (and I didn’t want to endanger any incumbents in the event of a “wave” year. Plus, I know this probably doesn’t matter to anyone else, but I like being able to look at a congressional map from a distance and easily see what is where, which is something you can’t do at all with current districts 2 and 3. So without further ado here’s what I came up with:

District 1 – Frank Kratovil (D) (blue)

This district keeps the Eastern Shore (minus part of Cecil County, which isn’t really on the Eastern Shore). The district also loses Bel Air and all the crazy conservative parts of Anne Arundel County. In their place, the district gets the most Democratic parts of Harford County from District 2, Annapolis and it’s suburbs from District 3, and parts of Prince George’s County from District 5. Only 55% of the district is actually on the shore, the other 45% is heavily-Democratic central MD, so should be safe for Kratovil (Obama probably won 53-47 here). District is 69% White, 23% black, 3% hispanic.

District 2 – John Sarbanes (I guess) (D) (green)

One of my goals was to untangle 2 and 3, since they were just too crazy. I knew someone would end up not living in their district, and it ended up being Sarbanes. This district uses Howard County as a base, and takes in the most Democratic parts of West and North Anne Arundel County along with parts of Montgomery County. This district probably will have an identity crisis since it is located kinda equidistant from Baltimore and DC. Obama probably got 65%-70% here, so it should be safe for any Democrat. Stats: Only 56% white!, 20% black, 11% Asian, 9% Hispanic.

District 3 – Elijah Cummings (D) (purple)

Baltimore gets a nice, compact district (yay!). I took out Howard County and gave Cummings Republican areas in North Anne Arundel and East Baltimore County (Idk if I’d call the Baltimore County parts Republican, they’re mostly just blue-collar racists, but regardless, nobody has to deal with them now). Obama probably got about 65-75% here. Stats: 43% white, 50% black, 2% hispanic, 2% Asian.

District 4 – Donna Edwards (D) (red)

Straightens up it’s Prince George’s County portion, and adds heavily Republican areas of Anne Arundel County so that nobody has to deal with them. Obama probably got 65-75% here. 31% white, 50% black, 4% Asian, 12% hispanic.

District 5 – Steny Hoyer (D) (yellow)

Keeps all of Southern Maryland and South Anne Arundel, changes course through PG to take in part of Montgomery so that Kratovil can have part of PG. Hoyer might not live in here, but we can redraw the lines if he has a fit. Obama probably got 65-75% here. Stats: only 47% white!, 36% black, 4% Asian, 9% hispanic.

District 6 – Roscoe Bartlett (R) (teal)

Takes away Democratic parts of Frederick and Hagerstown, adds Bel Air and north Cecil County. McCain probably got about 75% here (I wouldn’t be surprised). Stats: 91% white, 3% black, 1% Asian, 1% hispanic.

District 7 – Dutch Ruppersberger (D) (gray)

This district is kinda cool because it sorta follows the Beltway around Baltimore while taking in the Northwest part of the City. Much less gerrymandered than before. Obama got 57% in Baltimore county, and this district excludes the most Republican parts while taking in part of the City, so Obama probably got 65% here. Stats: 56% white, 34% black, 4% Asian, 3% Hispanic.

District 8 – Chris Van Hollen (D) (purplish-blue)

Most of Montgomery County, with the most Democratic parts of Frederick and Washington Counties, not much needs to be said. Obama probably got 75% here. Stats: 66% white, 10% black, 11% Asian, 9% Hispanic.

So there you have it. I’m thinking I’ll do a state legislature map for Maryland next. Let me know what you all think.