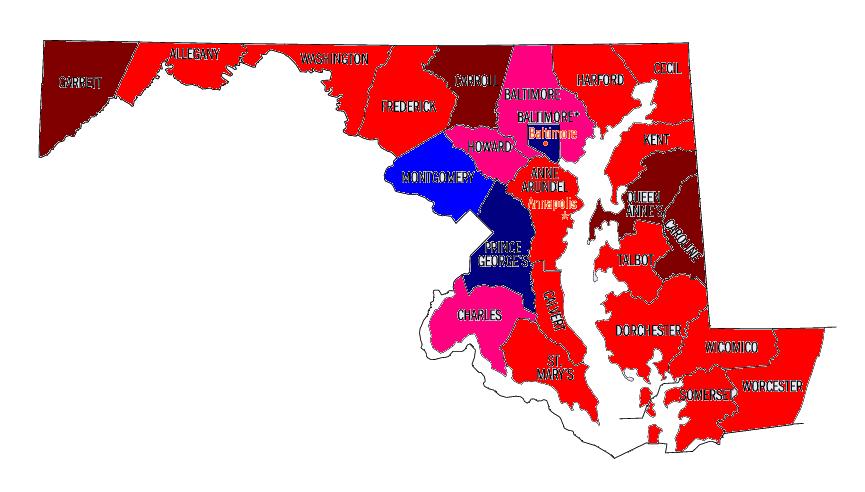
The following is my latest attempt to draw new district lines for Maryland. Lately, I have thought about this and have tried to find a way to reconcile my desire for more Democrats with the idea that districts should nevertheless adhere to some form of geographic “coherence”. The goal of this diary is therefore to create cleaner lines for both Congressional and Legislative Districts in Maryland, while at the same time, increasing the number of Democratic representatives.
I am also working on yet another plan for California, using the same goals as for Maryland above. Due to work and family responsibilities, it may be a while though before it’s ready … so for now, here’s my home state Maryland:
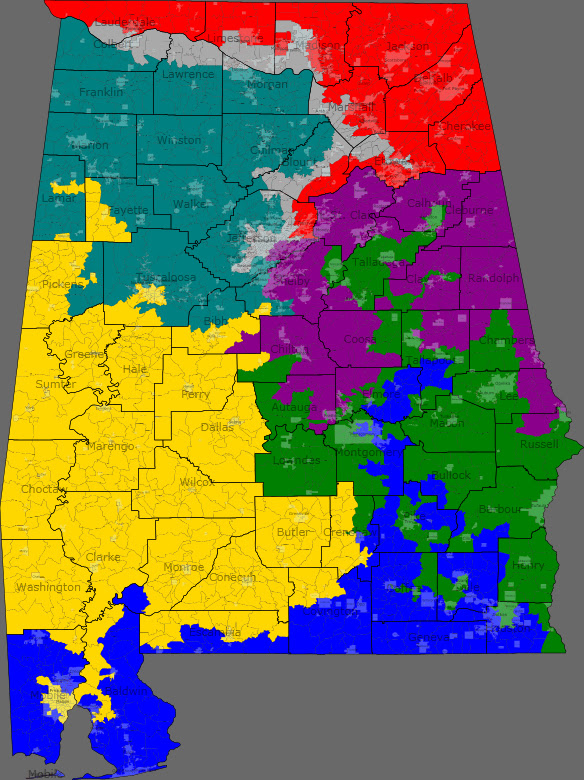
Congressional Districts
I have previously worked with the idea of eight Democratic seats for Maryland:
http://www.swingstateproject.c…
and … http://www.swingstateproject.c…
Although, you can indeed create plans for the state where each of the eight districts is at least 58-59% Obama (while preserving the two black-majority districts), the resulting maps seem just way too convoluted to me in retrospect …
In my new plan here, I create seven solid Democratic districts (60% or more Obama each) while trying to preserve relatively neat lines. I tried to break up as few counties as possible, and, as you can see, the resulting lines certainly look cleaner than the current map. Under the current map, there are 40 “county-fragments” in the Maryland congressional map (for example, Anne Arundel Co. has 4 “county-fragments”: parts of Districts 1, 2, 3 and 5), while under the proposed plan here that number declines to 36 “county-fragments.” More importantly, the new districts overall look a lot less gerrymandered and a lot more compact than the current map.
I also tried to ensure that MD-7 is at least 55% black (not just 50%+) to ensure continued African-American representation. MD-4, on the other hand, is made to be only 50%+ black; that district is much more diverse (only 23% white under the new lines, compared to 39% for the new MD-7), and more Democratic (85% Obama under the new lines, compared to 72% Obama for the new MD-7), so 50%+ black is really all that’s needed for MD-4.
For the two most “high-profile” Maryland Congressmen, Hoyer and Van Hollen, I drew the districts to be 65% Obama, while for Ruppersberger and Sarbanes, they will be 61% Obama (this is still higher than the current Obama percentages for both MD-2 and MD-3). I also have a hunch that Hoyer may like his new district more than his current one; the new district is just as Democratic as the current one, but the black percentage goes down from 34% to 29% thereby lessening a serious Democratic primary challenge to Hoyer in the future.
I tried to ensure that at least 50% of each new district’s population is made up out of current constituents in that district. Indeed, in 4 of the 8 districts (MD-2, MD-5, MD-6 and MD-8) at least 68% of the new population is the same as in the current district. In MD-1 and MD-4, around 60% are transferred. In MD-3, Sarbanes gets to keep 55% of his constituents. In MD-7 Cummings gets to keep a bit over 50% of his constituents, although this percentage does not include large swaths of the city that are African-American, but which are part of MD-2 under the current lines (all in all, the lines in Baltimore City looks very compact compared to the current plan).
The new MD-1 includes all of the Eastern Shore, but the Democratic percentage still shoots up to 60% Obama, with the addition of hyper-Democratic areas on the western shore. MD-6 preserves the three Western Maryland Counties (though Bartlett’s home area in Frederick is no longer in the district), and becomes a 63% McCain district.
The plan preserves the hometowns of each of Maryland’s seven Democratic incumbents in their respective districts. The population deviation for my map ranges from +/- 224 to 859 persons per district.


District 1
60% Obama, 38% McCain (currently 40% Obama, 58% McCain)
60% white, 33% black
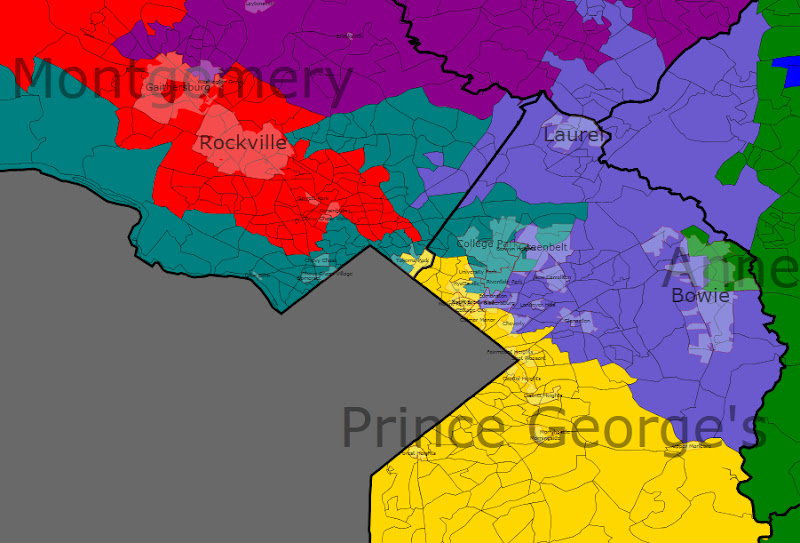
All of Eastern Shore; southern part of Anne Arundel Co. including part of Annapolis; central and eastern parts of Prince George’s Co. including Upper Marlboro, Largo/Kettering, Mitchellville, Lanham/Seabrook, New Carrollton, Glenarden, Landover Hills and part of Bowie.
The Democratic percentage here surges under this remap. At one moment, I looked at the new district and thought “Michael Steele”. However, the district is 60% Obama, and as demonstrated by Davis v. Sparks in the recent Alabama Governor’s primary, African-Americans vote based on the issues and not race. (Btw, Steele only managed to get 15-17% of the black vote in Maryland in 2006 — and not 25% as some exit polls indicated — and his “reputation” with black and Democratic voters has since then deteriorated; I honestly think he’d be lucky if he got 10% of the Maryland black vote these days.) And besides, in a Kratovil vs. Steele matchup (if Kratovil survives 2010), Kratovil would still have the home-turf advantage of representing the Shore (59% of the district). So, bottom line, I’m not too worried about Steele.
District 2
61% Obama, 37% McCain (currently 60% Obama, 38% McCain)
64% white, 26% black
Parts of Baltimore City; part of Baltimore Co. including Cockeysville, Timonium/Lutherville, Carney, Rosedale, Dundalk, Essex, Middle River, Catonsville, Randallstown, Reisterstown, Owings Mills; southern part of Harford Co. including Edgewood, Joppatowne, Aberdeen and Havre de Grace.
The new district is now confined to only three counties, as the Anne Arundel Co. part is taken out, and the lines look a lot cleaner. Many black precincts in Baltimore City are taken out and attached to the new MD-7, but to compensate, progressive white areas (Charles Village, for ex.) in the city are added, as well as some very Democratic areas in the western part of Baltimore County — the end result is that the Democratic percentage actually goes up slightly. 69% of the new district’s residents are current Ruppersberger constituents.
District 3
61% Obama, 37% McCain (currently 59% Obama, 39% McCain)
65% white, 21% black, 7% asian, 5% hispanic
All of Howard Co.; part of Baltimore City.; part of Baltimore Co. including Towson, Pikesville, Woodlawn/Lochearn, Arbutus and Halethorpe; part of Anne Arundel Co. including Glen Burnie, Brooklyn Park, Linthicum, Severn, Fort Meade, Odenton and Crofton.
The new district is a lot more compact than the current one, and the Democratic percentage goes up a few points.
District 4
85% Obama, 14% McCain (currently 85% Obama, 14% McCain)
50%+ black, 23% white, 17% hispanic, 8% asian
Parts of inner Prince George’s Co. including Fort Washington, Oxon Hill, Forest Heights, Temple Hills, District Heights, Forestville, Suitland, Seat Pleasant, Capitol Heights, Cheverly, Brentwood, Mount Rainier, Hyattsville/Chillum, Adelphi, Langley Park, parts of central and eastern Montgomery Co. (including the greater Silver Spring area, Derwood and Washington Grove).
The lines are changed somewhat, but Donna Edwards still gets to keep 61% of her current constituents and the hyper-Democratic nature of the district does not change at all (this is my home district, btw !).
District 5
65% Obama, 34% McCain (currently 65% Obama, 33% McCain)
55% white, 29% black, 8% hispanic, 5% asian
All of Southern Maryland (Calvert, St. Mary’s and Charles Counties); parts of Prince George’s Co. including Bladensburg, Riverdale, University Park, College Park, Berwyn Heights, Greenbelt, Beltsville, Laurel and part of Bowie; part of northern Montgomery Co.
Hoyer gets to keep 68% of his current constituents. Like I already mentioned, Hoyer may like this district more than his current one because of the decreased likelihood of a Democratic primary challenge — the current MD-5 is 34% black while the new one is 29% black (blacks as a percentage of the Democratic primary vote probably approach 50% under the current lines).
District 6
35% Obama, 63% McCain (currently 40% Obama, 58% McCain)
90% white, 5% black
All of Western Maryland (Garrett, Allegany and Washington Counties); all of Carroll Co.; northern part of Baltimore Co.; central and northern parts of Harford Co. including Bel Air area; northernmost sliver of Frederick Co. around Emmitsburg.
District 7
72% Obama, 27% McCain (currently 79% Obama, 20% McCain)
55% black, 39% white
Most of Baltimore City, part of Anne Arundel Co. including Pasadena, Severna Park, Arnold, Millersville, Davidsonville and the Annapolis area.
The new MD-7 combines the most Democratic and African-American parts of Baltimore City with some of the most Republican parts of Anne Arundel County. Blacks comprise 55% of the electorate here, but likely a much higher percentage (about 70-75%) of the Democratic primary electorate.
District 8
65% Obama, 34% McCain (currently 74% Obama, 25% McCain)
65% white, 12% hispanic, 11% asian, 10% black
Parts of central and southern Montgomery Co. including Rockville, Gaithersburg, Wheaton, Takoma Park, Chevy Chase, Kensington, Bethesda and Potomac; most of Frederick Co.
Van Hollen gets to keep 69% of his current constituents. The Democratic percentage declines from 74% Obama to 65% Obama, but Van Hollen or any other competent Democrat should win easily here. If Connie Morella ran under these lines in 2002, she might have won, but a lot has changed over the last eight years in terms of political preferences and voting patterns in this area.
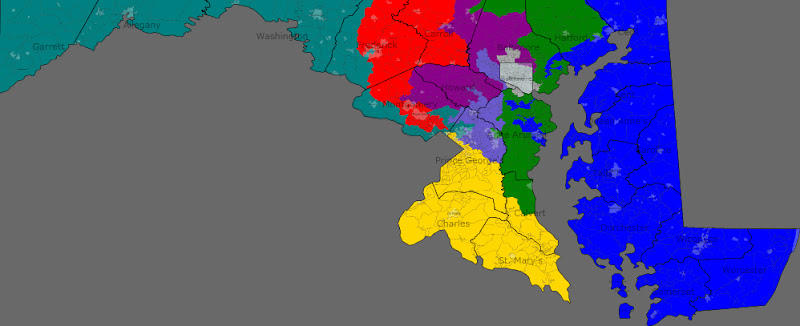
Legislative Districts
Now, on to the Legislative Districts map.
Each legislative district in Maryland elects one Senator and three Delegates. In most districts, the three Delegates are elected at large from the whole district, while in some areas the districts are divided into sub-districts (generally in more sparsely populated areas of the state, or when a sub-district is created to provide a better opportunity for minority population representation). The sub-districts can be of two types: 1) three one-Delegate sub-districts — like District 1 in the plan below, or 2.) one two-Delegate sub-district combined with one one-Delegate sub-district — like District 11 in the plan below.
A while back, I took a whack at this:
http://www.swingstateproject.c…
However, I still feel that the lines can be more refined. My goal here was to create more Democratic seats, while at the same time making the lines cleaner. Under the current map, there are 85 “county-fragments” in the Maryland legislative map (for example, Anne Arundel Co. has 6 “county-fragments”: Districts 30, 31, 32, 33-A, 33-B, and part of District 21), while under the proposed plan here that number declines to 73 “county-fragments.”
The population deviation for my map ranges from +/- 1,900 persons per district. Sorry if some of the information here is a rehash from my earlier diary on redrawing Maryland’s legislative lines, but there are also some significant changes here from that earlier attempt.
The bottom line for this plan is that two Democratic Senators and six Democratic Delegates (in Districts 9 and 31) are likely to be added to the Maryland Legislature under the new lines, while an additional two Democratic Senators and six Democratic Delegates (in various districts — discussed below) may possibly be added (those numbers factor in the possible loss of several Democratic Delegates in District 34). Also, up to eighteen current Democratic representatives in marginal seats are given stronger Democratic districts.
So, all in all, a potential gain of sixteen Democratic representatives for the next decade, as well as eighteen current Democrats made stronger.
Also, up to six black representatives and three Hispanic representatives may be added to the state’s delegation under the plan. Overall, eight new minority-majority districts are created (even though a number of those in Montgomery Co. have no single dominant ethnic/racial minority group).


District 1 – Western Maryland
New district: 93% white; 33% Obama (current district 32% Obama)
The only real change here is to divide into sub-districts a little differently from the current map:
1A – Garrett County, part of Allegany; 98% white; 28% Obama (current district 27% Obama)
1B – Frostburg and Cumberland; 89% white; 7% black; 40% Obama (current district 34% Obama)
1C – parts of Allegany and Washington Counties; 93% white; 31% Obama (current district 36% Obama)
I am not sure why the sub-districts are currently drawn as they are. This re-drawing should shore up the one Democratic representative in this whole district, Kevin Kelly of 1B; his redrawn district will now include most of Cumberland and will be about 6 percentage points more Democratic than before.
District 2 – Washington County
New district: 83% white; 12% black; 45% Obama (Obama percentage is same as in current district)
No major changes here except to reconfigure the sub-districts. Instead of three sub-districts, the new plan has only two:
2A – Hagerstown; 79% white; 13% black; one Delegate; 57% Obama
2B – more rural remainder of District 2; 84% white; 11% black (about 45% of the black population in this district is in the state prison located here); two Delegates; 40% Obama
District 3 – City of Frederick and southern Frederick County
New district: 71% white; 14% black; 8% hispanic; 5% asian; 56% Obama (current district 54% Obama)
The major change here is to get rid of the sub-districts. A district that is 56% Obama (and becoming more Democratic as time goes on as more people from outside Frederick Co. stream in) should be able to elect three Democratic Delegates, instead of the current two in 3A (City of Frederick) and the Republican-turned-Independent in 3B (southern Frederick Co.). Right-wing GOP Senator Alex Mooney may be on the way out in the November election (he won in 2006 with only 52% of the vote, and this district has experienced an influx of less conservative people moving in since then); the increase in the Democratic percentage (from 54% to 56% Obama) should help also once the new lines are in place in 2012.
Bottom line for District 3: Possible addition of Democratic Senator (if the incumbent survives 2010) and one Democratic Delegate.
District 4 – Frederick County, parts of Washington and Carroll Counties
New district: 91% white; 38% Obama (current district 37% Obama)
The sub-districts are eliminated and the new District 4 is now confined mostly to Frederick County (previously about one-third of the district was in Carroll Co.) The only areas outside the county (necessary to preserve equal population of the district) will be Smithsburg in Washington Co. and Mt. Airy which straddles the Carroll Co./Frederick Co. line. The GOP is expected to dominate here.
District 5 – Carroll County
New district: 92% white; 32% Obama (current district 33% Obama)
Like with District 4, the sub-districts are eliminated and the district will now be completely confined to Carroll County, instead of stretching out into northern Baltimore County. GOP stronghold.
District 6 – Dundalk, Sparrows Point, parts of eastern Baltimore City
New district: 68% white; 27% black; 55% Obama (current district 45% Obama)
This area is a traditional blue-collar Democratic stronghold that has shifted to the right over the decades (your quintessential Reagan Democrat country). The current District 6 is the only district in the state of Maryland (out of 47) where John Kerry performed better than Obama. Democrats still win here locally, but in order to make the district safer for the future, the Democratic percentage is increased by 10 percentage points. This is done in tandem with combining parts of eastern Baltimore City with the Baltimore County portion of the district.
It should be noted that the break-down here is almost exactly such that the Baltimore City portion could be made into a sub-district electing one Delegate (the new Delegate would likely be an African-American Democrat, as that part is 61% black and voted 90% for Obama) while the Baltimore Co. part could be a two-Delegate sub-district. However, such a move might be politically risky. The Baltimore Co. part voted only 41% Obama and could realistically elect two Republicans at some point in the future if made into a sub-district. Therefore, I am keeping the new District 6 without sub-districts.
District 7 – northern Baltimore County
New district: 88% white; 5% black; 36% Obama (current district 39% Obama)
The new district combines most current areas of the district with territory in northern-most Baltimore Co. which was previously part of District 5. The new district will now be confined entirely within Baltimore Co. (it currently stretches into Harford) and it becomes even more Republican than the current form.
District 8 – Parkville, Overlea, Rosedale, White Marsh
New district: 71% white; 19% black; 5% asian; 52% Obama (current district 48% Obama)
The current district is represented by a Democratic Senator, two Democratic Delegates and one Republican Delegate. The Republican won by a smidge last time, and the increase in the Democratic percentage (48% Obama to 52% Obama) should help here.
Bottom line for District 8: Possible addition of one Democratic Delegate, and the existing Democratic representatives are made stronger.
District 9 – Howard County (Ellicott City, most of Columbia)
New district: 62% white; 16% black; 14% Asian; 5% hispanic; 61% Obama (current district 43% Obama)
The new District 9 is a really good example of how you can make a district more compact, yet more Democratic at the same time. The current district stretches across Howard and Carroll Counties and is quite Republican. The new district is confined entirely to Howard Co. and is a lot more Democratic.
Bottom line for District 9: Very probable addition of Democratic Senator and three Democratic Delegates (the current Senator is Allan Kittleman, minority (GOP) leader).
District 10 – parts of Baltimore Co. (Milford Mill, Lochearn, Randallstown) and Carroll Co. (Eldersburg)
New district: 52% black; 41% white; 66% Obama (current district 87% Obama)
The new district stretches along the Liberty Road corridor from just outside the Baltimore City line into Carroll County. The district is assured of continuing to elect an all African-American Democratic delegation as approximately 70-75% of the Democratic primary vote here is black, and the district overall is about two-thirds Democratic.
District 11 – northwestern Baltimore County
New district: 54% white; 37% black; 70% Obama (current district 66% Obama)
Remains solidly Democratic. I have divided the new district into two sub-districts:
11A – one-Delegate district; area between Pikesville, Reisterstown and Mays Chapel; 80% white; 11% black; 5% asian; 55% Obama
11B – two-Delegate district; parts of Randallstown, Reisterstown and Owings Mills; 50%+ black; 40% white; 80% Obama
The creation of sub-district 11B will likely add two African-American legislators to the state’s delegation. In the meantime, because of the way the lines are drawn, one or two of the current three Delegates here could run in the new District 42 which now will include a substantial part of Pikesville. The 55% Obama percentage in 11A should not be a concern, as this is a safe Democratic district, particularly on the local level. (John Kerry actually did better than Obama in several precincts of the new 11A, so Obama’s 55% percentage is not some sort of Democratic “ceiling” for the area, as it would be in other districts.)
Bottom line for District 11: Probable addition of two African-American Delegates.
District 12 – southwestern Baltimore County (Arbutus, Halethorpe, Catonsville, Woodlawn); part of eastern Howard County
New district: 65% white; 24% black; 6% asian; 58% Obama (same as current district)
The new district covers much of the same area as the current configuration. The major difference is that a progressive part of Columbia (what’s now sub-district 12B) is taken out. To compensate, most of majority black Woodlawn is added and the district’s partisan make-up remains unchanged.
District 13 – Howard County (Savage, North Laurel, part of Columbia)
New district: 63% white; 19% black; 10% asian; 5% hispanic; 62% Obama (current district 65% Obama)
This district stays quite similar to the current configuration. District 13 was represented in the state Senate by a Republican, Sandy Schrader, prior to the 2006 election (even when the three Delegates were all Democrats). Schrader won in 2002 with 51% of the vote, but received only 44% in her re-election attempt in 2006. This district has definitely moved in the Democratic direction over the years, and the slight decline in Democratic performance here under the proposed lines (from 65% Obama to 62% Obama) will still leave this a safe Democratic seat.
Districts 14, 15, 16, 17, 18, 19, 20 and 39 – Montgomery County
We next move to Montgomery County, where the district lines change relatively little under my map. The all-Democratic delegation here (8 Senators and 24 Delegates) is something I am very proud of (I live in Silver Spring). I attempted to create sub-districts here which could be designed to elect minority representatives, but my efforts were futile, as the minority population is very diverse and scattered throughout the county. Nevertheless, five of my new districts here become “minority-majority” (four are about 49% white, while District 14 is 49.6% white); District 20 is already “minority-majority”, so under this plan 6 out of 8 Montgomery Co. districts will be “minority-majority”. This is all probably a moot issue in Montgomery, as even under the current lines, the county already has a very multi-ethnic delegation, with black, Hispanic, and Asian (east Asian, south Asian, as well as Middle Eastern-origin) representatives … and several openly gay representatives also.
New District 14: Burtonsville, Damascus, White Oak
50% white; 27% black; 13% asian; 9% hispanic; 67% Obama (current district 65% Obama)
New District 15: Potomac, Poolesville, Clarksburg
67% white; 18% asian; 7% hispanic; 7% black; 66% Obama (current district 65% Obama)
New District 16: Bethesda, Chevy Chase, Garrett Park
77% white; 10% asian; 8% hispanic; 73% Obama (current district 74% Obama)
New District 17: Rockville, Gaithersburg
49% white; 20% hispanic; 17% asian; 12% black; 71% Obama (Obama percentage is same as in current district)
New District 18: Wheaton, Derwood, Kensington, part of Silver Spring
49% white; 21% hispanic; 17% black; 11% asian; 73% Obama (current district 76% Obama)
New District 19: Aspen Hill, Leisure World, Olney, Brookeville
49% white; 19% black; 18% hispanic; 12% asian; 70% Obama (current district 68% Obama)
New District 20: Silver Spring, Takoma Park
41% white; 24% black; 22% hispanic; 11% asian; 81% Obama (current district 85% Obama)
New District 39: Germantown, Montgomery Village
49% white; 19% black; 15% asian; 15% hispanic; 71% Obama (Obama percentage is same as in current district)
The lines in Prince George’s County are reconfigured somewhat to provide more opportunities for African-American and Hispanic representatives to be elected there:
District 21 – northern Prince George’s County (Laurel, Greenbelt, Berwyn Heights, Glenarden)
New district: 53% black; 28% white; 9% hispanic; 7% asian; 84% Obama (current district 75% Obama)
The new district is now completely contained within PG Co. I just don’t think that it makes sense to have a district stretch from College Park all the way to Odenton in Anne Arundel County (as does the current District 21). The new district becomes majority black, and is likely to elect several African-American representatives in the future.
District 22 – northern Prince George’s County (College Park, Beltsville, New Carrollton, Landover Hills, Cheverly, Brentwood, Mount Rainier)
New district: 53% black; 23% white; 16% hispanic; 6% asian; 85% Obama (Obama percentage is same as in current district)
Senator Paul Pinsky may have no trouble getting re-elected here, but if he retires, this district is likely to elect an African-American Senator. The new district becomes majority black, and is likely to elect several more African-American representatives in the future (currently, two of the three Delegates here are white).
District 23 – parts of Prince George’s Co. (Seat Pleasant, Capitol Heights, Upper Marlboro) and Anne Arundel Co. (Crofton, southern part of county)
New district: 51% black; 44% white; 69% Obama (current district 81% Obama)
Since this re-map made District 21 confined to PG Co., the new District 23 has to play the opposite role and reach outside PG, into Anne Arundel County. The new district becomes majority black, and most registered Democrats here are black (as a good part of the white population in Anne Arundel is Republican). Therefore, the district is likely to add African-Americans to its legislative delegation in the future.
Districts 24, 25, 26 – eastern, central and southern Prince George’s Co.
New District 24: Bowie; Mitchellville; Largo/Kettering; 65% black; 26% white; 85% Obama (current district 98% Obama)
New District 25: District Heights, Forestville, Suitland; 82% black; 11% white; 95% Obama (current district 96% Obama)
New District 26: Oxon Hill, Temple Hills, Fort Washington; 79% black; 11% white; 5% asian; 93% Obama (current district 94% Obama)
District 27 – Calvert County and southern Prince George’s Co.
New district: 65% white; 28% black; 61% Obama (current district 71% Obama)
The new district is more in line with using county boundaries as district boundaries than the current District 27, now taking in all of Calvert County (Calvert has experienced some of the highest population growth in the state, and will now account for about two-thirds of the new district). The rest of the new district will be a Prince George’s Co.-based minority-majority sub-district. Thus, the major change here is that sub-district 27A will now have one Delegate, instead of two, and 27B will have two instead of one.
Senate Leader Mike Miller should be quite happy with the new lines, as his seat becomes more Calvert-based (his home) and it is less likely that he will be challenged in the Democratic primary by an African-American in the future.
27A – one Delegate; southern Prince George’s County and several precincts in Calvert to preserve equal population; 55% black; 38% white; 76% Obama (current sub-district is 81% Obama)
27B – two Delegates; most of Calvert Co.; 80% white; 14% black; 49% Obama (current sub-district is 47% Obama)
Even though sub-district 27B voted 49% Obama and 50% McCain, it should be noted that the current Delegate, Democrat Sue Kullen, won with 57% of the vote in 2006. Republican Anthony O’Donnell (the House minority leader from southern Calvert, currently in sub-district 29C) could also run here, but even if he were to win, his gain here would be effectively offset by his disappearance from District 29.
District 28 – Charles County
New district: 53% white; 38% black; 63% Obama (same as in current district)
The lines here change only insofar that several precincts in the eastern part of the county are taken out to preserve equal population.
District 29 – St. Mary’s County, part of Charles Co.
New district: 73% white; 20% black; 47% Obama (current district 44% Obama)
The new district is more compact than the current one. The sub-districts are eliminated, and I’m hopefully optimistic that all three Delegates will be Democrats despite the 47% Obama – 51% McCain breakdown of the new district (currently both Delegates in 29A and 29B, which are areas almost entirely in St. Mary’s County, are Democrats elected with 65 and 64 percent of the vote; Anthony O’Donnell (GOP) won 29C — which straddles both St. Mary’s and Calvert Counties — with 60% but his sub-district becomes split in half between the new District 27 and the new District 29.)
District 30 – greater Annapolis area in Anne Arundel Co.
New district: 74% white; 16% black; 6% hispanic; 54% Obama (current district 52% Obama)
The lines here are tweaked somewhat in order to make the district a bit more Democratic. The current district is represented by a Democratic Senator and two out of three Delegates are also Democrats (including House Speaker Michael Busch). The lone Republican, Delegate Ron George, won by 53 votes last time (or one-tenth of a percentage point), and so the change from 52% Obama to 54% Obama may be helpful in the future — assuming George makes it through 2010 under the current lines, which is not guaranteed.
Bottom line for District 30: Possible addition of one Democratic Delegate (if the sole Republican is not defeated by the time the new lines come into being).
District 31 – parts of Anne Arundel Co. (Glen Burnie, Brooklyn Park, Severn)
New district: 67% white; 21% black; 5% hispanic; 5% asian; 53% Obama (current district 40% Obama)
The political composition of this Anne Arundel district changes significantly under this re-map. Most of the Glen Burnie parts currently in District 32 are added — so that Glen Burnie will now be basically all in one district instead of being split in half between Districts 31 and 32 — while most of hyper-Republican Pasadena is detached. The result is a district that goes from 40% Obama to 53% Obama.
It is quite likely that all four Republican representatives will disappear under the new lines, and will be replaced by four Democrats. The GOP Senator here, Bob Jones University graduate Bryan Simonaire, won last time with only 51% of the vote, and he lives in Pasadena, now outside the district. The three GOP Delegates all won by relatively small margins also, and two of the three also live in Pasadena.
The one Delegate whose home remains in the new 31st is Don Dwyer, a rabidly right-wing homophobe who makes Simonaire appear like a moderate in comparison (Dwyer is so right-wing that he has effectively taken himself out of the Republican caucus, as they are apparently not conservative enough for him, though he remains a Republican.) Dwyer won re-election by 25 votes last time (even the current 58% McCain district had barely the stomach for him), and it’s far from assured that he will win in 2010. If he does make it this coming November, the new lines and district composition will pose a very formidable obstacle for him in 2014.
This area is traditionally quite Democratic, but parts contain many conservative Reagan Democrats. In that light, the 53% Obama of the proposed District 31 should not be seen as a Democratic ceiling for the district. (Disclosure: I grew up in Brooklyn Park, and my mom still lives there, hence this long entry re. District 31 … that, and the fact that the odious Don Dwyer is still a representative there.)
Bottom line for District 31: Probable addition of Democratic Senator and three Democratic Delegates. Several of the current District 32 Democratic representatives live in what under this remap becomes part of District 31, so they can run here, while new Democrats can be elected in the new 32nd.
District 32 – parts of Anne Arundel Co. (Linthicum, Ferndale, Odenton, Fort Meade, Maryland City), part of Howard Co. (Elkridge)
New district: 64% white; 22% black; 6% hispanic; 6% asian; 54% Obama (Obama percentage is same as in current district)
Like the current incarnation, the new district encompasses much of northwestern Anne Arundel County. The district also crosses over into a part of Howard County, in order to maintain equal population.
District 33 – parts of Anne Arundel Co. (Pasadena/Lake Shore, Severna Park, Millersville, Gambrills, Davidsonville)
New district: 88% white; 5% black; 36% Obama (current district 43% Obama)
The new District 33 combines the most Republican communities of Anne Arundel County into one district. The two current sub-districts are eliminated. GOP representatives from both the current 33rd and the current 31st are all put together into this district.
District 34 – parts of Harford and Cecil Counties
New district: 88% white; 7% black; 39% Obama (current district 48% Obama)
The new district becomes considerably less Democratic. This is the only such occurrence under this plan where existing Democrats may be endangered because of the remap, but it is the price to pay for relatively high growth in this part of the state. There’s not much that can be done geographically to shore up Democrats here, as the district is “tucked” into a corner of the state; nevertheless, I did manage to create a new Democratic-leaning District 46 — discussed later — out of the southern portion of the current District 34; the downside is that what remains in District 34 is less Democratic. The current political balance here is a GOP Senator, and three Democratic Delegates. I have redrawn the sub-districts so that they correspond to county lines (a two-delegate sub-district for Cecil, and a one-delegate sub-district for Harford):
34A – one-Delegate district; Harford Co.; 86% white; 8% black; 37% Obama
34B – two-Delegate district; Cecil Co.; 89% white; 6% black; 41% Obama
District 35 – Harford County, including Bel Air area
New district: 92% white; 31% Obama (same as in current district)
Remains somewhat similar to the current district which is a GOP stronghold; the sub-districts are eliminated.
District 36 – Upper Eastern Shore (all of Kent, Queen Anne’s and Caroline Counties and part of Cecil Co.)
New district: 85% white; 10% black; 39% Obama (current district 41% Obama)
District 37 – Lower Eastern Shore (all of Talbot, Dorchester and Somerset Counties and part of Wicomico Co.)
New District: 64% white; 31% black; 48% Obama (current district 46% Obama)
Currently, three out of four representatives here are Republicans. Under the new lines, the district becomes 48% Obama – 51% McCain.
37A – one Delegate; Salisbury and Princess Anne areas; 54% black; 40% white; 59% Obama; the sub-district remains black-majority, but the lines look cleaner than under the current map; the sub-district should continue to elect an African-American Democrat.
37B – two Delegates; all of Talbot and Dorchester, and part of Somerset; 75% white; 20% black; 43% Obama.
District 38 – Lower Eastern Shore (all of Worcester Co., and part of Wicomico Co.)
New District: 81% white; 14% black; 43% Obama (current district 41% Obama)
The new 38th is quite similar to the current district (but without the sub-districts). The district here currently elects a GOP Senator and GOP Delegate in sub-district 38A, while 38B elects two Democrats, even though that area is even more Republican than 38A. The two Democrats include one legislator from Salisbury and a former mayor of Ocean City, so personal popularity likely plays a part, especially in the case of the latter. The remap eliminates the sub-districts, while the Democratic percentage goes up a bit overall, but the political consequences remain anyone’s guess.
District 39 – see earlier entry under Districts 14, 15, etc. (Montgomery County)
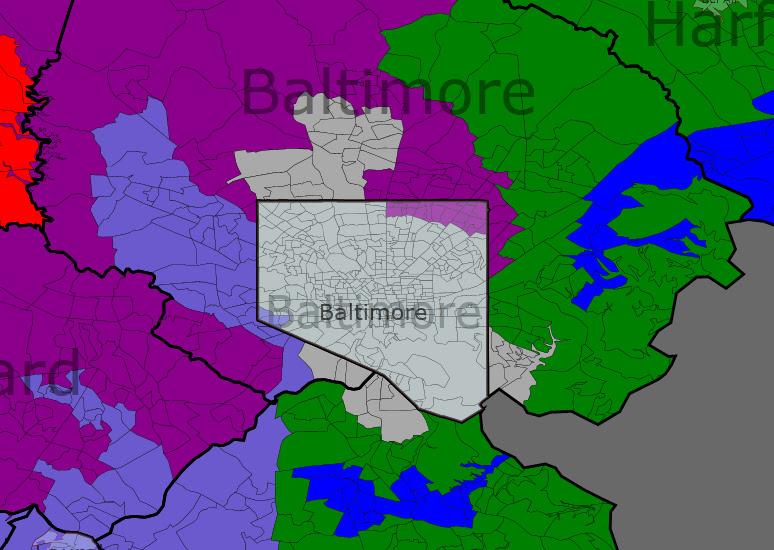
Districts 40, 41, 43, 44, 45 – Baltimore City
Due to stagnant population growth, Baltimore City has to lose one of its current districts, and the 46th is the only logical candidate. (Also, as already discussed, the eastern-most part of the city will be combined with adjoining parts of Baltimore County into a new 6th District.) The other five districts are reconfigured but still keep the basic shape and identity of their current incarnations (I intentionally keep each district at 63-64% African-American):
New District 40: west-central Baltimore
64% black; 29% white; 90% Obama (current district 93% Obama)
New District 41: northwest Baltimore
63% black; 33% white; 86% Obama (current district 87% Obama)
New District 43: northeast Baltimore
63% black; 31% white; 89% Obama (current district 91% Obama)
New District 44: southwest and south Baltimore
63% black; 33% white; 86% Obama (current district 92% Obama)
New District 45: east-central Baltimore
63% black; 28% white; 84% Obama (current district 90% Obama)
District 42 – Towson, Timonium, Cockeysville, Pikesville, Carney
New District: 77% white; 11% black; 7% asian; 54% Obama (current district 53% Obama)
The current district is represented in the Senate by a Democrat. However, two out of three Delegates are Republicans. The trick in this part of central Baltimore Co. was to make District 8 somewhat more Democratic, without making District 42 less Democratic. Therefore, the new District 42 was expanded into more Democratic areas around Pikesville. Both Republican delegates won here by small margins last time, and the 54% Obama percentage should not necessarily be seen as a Democratic ceiling (in a couple of precincts in Pikesville Kerry actually performed better than Obama), so this district may provide good Democratic pick-up opportunities in the future.
District 46 – parts of Baltimore Co. (Middle River, part of Essex) and southern part of Harford Co. (Edgewood, Joppatowne, Aberdeen, Havre de Grace)
New District: 64% white; 27% black; 54% Obama
This district is a newly-created one to account for population growth in the area (and it replaces the old 46th which was based in Baltimore City). It was initially surprising to me that you could create a new, compact district here that is at the same time quite Democratic. I was afraid that the new district would have to be a GOP stronghold, thus causing an automatic loss of a Democratic Senator and three Democratic Delegates. But there is apparently a robust Democratic presence in this area. Interestingly, the Harford Co. part of the district voted 56% Obama – 42% McCain, while the Baltimore Co. part split 49% – 49%.
District 47 – parts of northern Prince George’s County (Hyattsville/Chillum, Adelphi, Langley Park, Riverdale, Edmonston, Bladensburg, University Park)
New District: 47% hispanic; 36% black, 11% white; 87% Obama (current district 92% Obama)
I tried to create a Hispanic-majority district here, but that is basically not possible unless you cross county lines to encompass a couple precincts in Montgomery Co. (you can thus create a 51% Hispanic district in Maryland). Since my goal was to split as few counties as possible, I instead created an all-Prince George’s Co. seat that has a 47% Hispanic plurality and may become hispanic-majority over the next decade. The current District 47 has already elected a Delegate who is Hispanic, and this new district may help to increase Hispanic representation (Hispanics seem to be largely under-represented in the state legislature).