By: Inoljt, http://mypolitikal.com/
A few maps of Ohio’s presidential elections are posted below, for your enjoyment. Each map comes with some brief analysis.
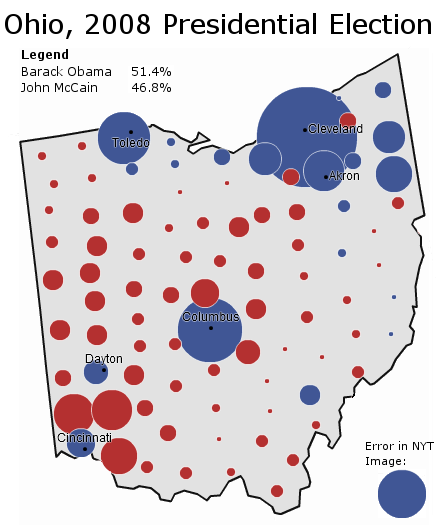
(Note: Because the Times stopped updating before all absentee/provisional ballots were counted, this map does not fully reflect the actual results. I have corrected the discrepancy.)
Senator Barack Obama wins Ohio by 4.6%, a solid but unimpressive victory. Mr. Obama performs poorly in traditional Democratic areas – the northeast and even Cleveland – but offsets this with unique strength in Columbus and Cincinnati. Senator McCain runs strongly in the Republican base.
More below.
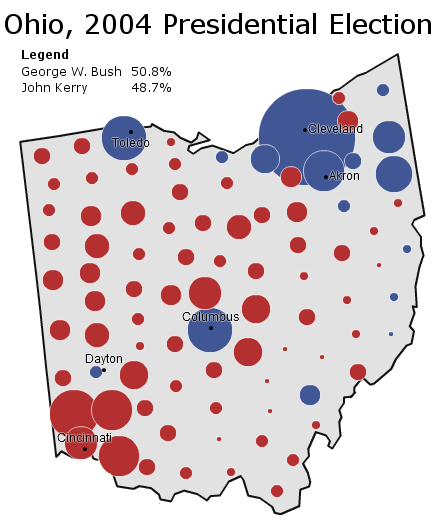
President George W. Bush wins Ohio by a close but decisive margin. Senator John Kerry does extremely well – winning Columbus and Cleveland by what his campaign wants – but Mr. Bush’s exurban strength famously overwhelms this strength. Nevertheless, Ohio votes more Democratic than the nation, the first time since 1972.
______________________________________________________
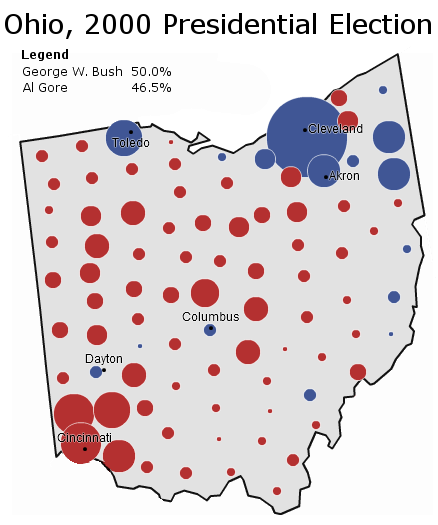
Vice President Al Gore gives up Ohio before election-day; Governor George W. Bush wins the state by 3.5%. Perhaps, campaign strategists later muse, they should not have abandoned the state.
______________________________________________________
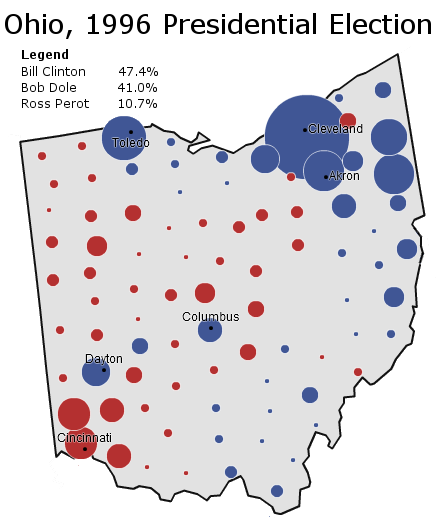
Incumbent Bill Clinton cruises to a comfortable victory – the best Democratic performance since LBJ (and before that, FDR). The former Arkansas governor runs strong in the industrial northeast and the Appalachian southwest, while severely undercutting Senator Bob Dole’s margins in Republican territory. It’s a classic Democratic victory.
______________________________________________________
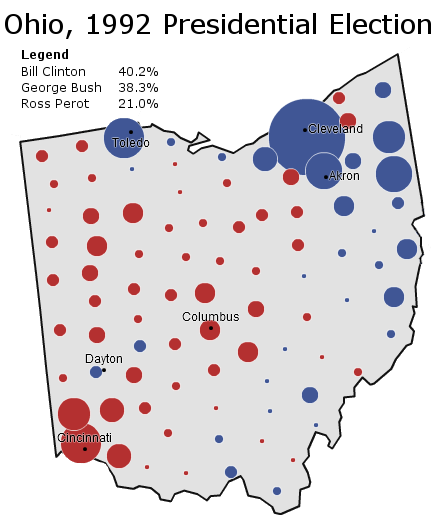
It’s an exact replica of the 1996 map – except this time the Democratic strongholds are a bit less blue, the Republican strongholds a bit more red, and Ross Perot is running strong. Governor Clinton wins by a mere 1.8%.
