NY-23: Scozzafava running out of money

“Dede Scozzafava, the GOP nominee in a key upcoming House special election, is running dangerously low on campaign cash, according to several GOP sources familiar with her spending and fundraising.”

Interestingly the article goes on to say that the RNC has sent only two staffers and hasn’t contributed a cent to the race. Owens is outspending her 12-1. Even Hoffman has spent more. The NRCC is trying to make up the difference but even they have been overtaken by the DCCC.

“Despite a recent poll showing the GOP nominee with a 7-point lead over Owens, the spending disparity has many Republicans downbeat about her prospects.”

I have to say I’m surprised at this. You would think the RNC would be flooding cash into the district to try and get a clean sweep of all the big races on November 3. Politico suggests they are concentrating on the gubernatorial races but that seems dubious at best. Maybe they just don’t want her to win. I know I don’t.

http://www.politico.com/news/s…

UPDATE

The Rothenberg Political Report moves the race from Pure Toss-Up to Toss-Up/Tilt Democratic.

http://rothenbergpoliticalrepo…

Redistricting Kentucky and Utah

Two states that are not kind to Democrats. My intentions here were to shore up Chandler and Matheson’s seats. The tradeoff for Kentucky is essentially ceding the rest of the seats, but as we’ve seen in the past few cycles, those seats are well-nigh unwinnable, even in a great Dem year like 2006.

Kentucky

Click for big version.

KY-01 (blue, Ed Whitfield – R) – Removed the stupid little tail coming off the southeast end of the district. May have moved a couple of points toward the Dems, but still solidly Republican.

KY-02 (green, Brett Guthrie – R) – Not much changed here, aside from taking in part of the aforementioned stupid tail. Safe Republican.

KY-03 (purple, John Yarmuth – D) – Almost completely unchanged; all but a couple precincts of Louisville. Fairly safe for the Dems.

KY-04 (red, Geoff Davis – R) – Stretch of Republican territory along the Indiana, Ohio, and West Virginia borders. Should be pretty safe for the Republicans.

KY-05 (yellow, Hal Rogers – R) – Takes in all the Republican areas of SE Kentucky. Safe Republican.

KY-06 (teal, Ben Chandler – D) – Reconfigured this district to take in all of the most Democratic areas of eastern Kentucky. It’s gone from a 12-point McCain margin to about a 3-point McCain margin.

Utah

Click for giant version.

UT-01 (blue, Rob Bishop – R) – Ridiculous population growth causes this one to shrink to the counties north of Salt Lake City. Probably voted around 68-69% McCain.

UT-02 (green, Jim Matheson – D) – Perhaps the Republicans can dispense with the ridiculous attempts at getting rid of Matheson and resign themselves to the fact that, yes, there’s going to be one seat in the state that the Democrats can hold. Consists of Summit County, Salt Lake City proper, and some of the surrounding suburbs. Almost undoubtedly voted for Obama.

UT-03 (red, Jason Chaffetz – R) – Made this the “rural district”, but the part of Utah County that is in the district is still a large chunk of the population. Really shows you how few people live outside of the SLC/Provo area of the state. Went 70+% for McCain easily.

UT-04 (purple, open) – New suburban district, gonna go out on a limb and guess it’s safe Republican. Probably mid-60s for McCain.

FL-19: Wexler to Step Down

Here’s a surprise:

U.S. Rep. Robert Wexler, who represents Broward and Palm Beach counties, plans to resign from Congress.

He plans to announce his plans at a news conference Wednesday at 10 a.m. in Boca Raton.,

A Democratic source with knowledge of Wexler’s plans said he is likely to take a public policy job that deals with the Middle East.

Democrats shouldn’t have to worry about holding Wexler’s seat — Obama won Wexler’s CD by a 65-34 margin in 2008, and John Kerry earned a similar margin four years earlier, so the real race to watch will be the Democratic primary. The St. Pete Times has identified a few potential Wexler successors:

You can bet every state lawmaker and city/county commission in spitting distance would consider jumping in since in a special election, anything can happen. Plus, local officials can run for a federal office without having to resign their current job. The names already being dropped are state Sen. Jeremy Ring, State Sen. Ted Deutch, West Palm Beach Mayor Lois Frankel and former Broward County Commissioner Ben Graber.

RaceTracker Wiki: FL-19

SSP Daily Digest: 10/13

AZ-Sen: Does the persistent rumor of a J.D. Hayworth primary challenge to John McCain boil down to nothing more than a Hayworth grudge against former key McCain aide Mark Salter (and thus a way for Hayworth to keep yanking McCain’s chain)? That’s what the Arizona Republic is proposing, pointing to a 2005 dust-up between Hayworth and Salter over immigration reform. Hayworth, for his part, says that “spite” would never fuel a primary bid.

IL-Sen: GOP Rep. Mark Kirk is touting an internal poll taken for him by Magellan Data and Mapping Strategies that has him beating Democratic state Treasurer Alexi Giannoulias in a Senate head-to-head, 42-35. It also shows Kirk in strong shape in the primary, leading developer Patrick Hughes (who seems to be cornering the wingnut vote) 61-3.

KY-Sen: The allegedly third tape (although nobody seems to remember what the second one was) involving Lt. Gov. and Senate candidate Dan Mongiardo trashing his boss (and one of his few endorsers), Gov. Steve Beshear, has surfaced. This time, Mongiardo says people he talks to want to “yell” about Beshear and says, “It’s like being married to a whore.” This time it popped up directly on YouTube instead of on a Rand Paul fan blog.

NV-Sen: Markos has an interesting observation, that may give some comfort to the Reid boys as they face an onslaught of bad polls. Democrats now have a registration edge of nearly 100,000 in Nevada, and it’s growing: since February, Dems have added 4,860 while the GOP has added 1,549. In fact, this sad performance puts the GOP fourth, as both nonpartisan registration and the right-wing Independent American Party gained more new registrants.

PA-Sen (pdf): One more poll from Dane & Associates via GrassrootsPA, and it gives narrow edges to both Arlen Specter and Joe Sestak over Republican ex-Rep. Pat Toomey in the 2010 Senate race (46-43 for Specter and 43-38 for Sestak). Worth noting: this is only the second poll (after that freaky Rasmussen poll in August) that shows Sestak performing better against Toomey than does Specter.

TX-Sen, Gov: Kay Bailey Hutchison may be getting some cold feet about committing to a resignation date from the Senate. In response to questions on a conservative radio talk show, it’s sounding like she’s unlikely to resign her seat by year’s end. However, she also doesn’t sound like she’ll stay in her seat all the way through to the gubernatorial primary election in March, saying “that’s not what [she wants] to do.” (Although it’s understandable she may want to keep her day job if the whole being-governor thing doesn’t work out.)

NJ-Gov: PPP has its poll of the New Jersey gubernatorial race out, and like everyone else these days, they’re seeing it as pure tossup. Chris Christie leads Jon Corzine 40-39, with 13 for independent Chris Daggett. (It’s right in line with today’s Pollster.com average of 41-40 for Christie.)That’s tremendous progress for Corzine, who was down 44-35-13 last month. Also, it’s worth noting that not only is Corzine dragging Christie down to his level but he’s actually starting to improve his own favorables; he’s up to 37/55, still terrible but better than last month’s 32/60. The race will still depend on getting unlikely Dem voters to turn out; the likely voter pool went for Obama by only 4% last year, way off from the actual 15% margin. One last tidbit: the poll asks Daggett voters their second choice, and Christie wins that one 48-34 (suggesting that Daggett does more damage to Christie, but that Christie’s best hope is to peel off some of the vacillating Daggett supporters).

VA-Gov: Not much change in Virginia, where Rasmussen finds a 50-43 lead for Republican Bob McDonnell in that gubernatorial race. (This is right in line with today’s Pollster.com average of 51-43.) Two weeks ago, Rasmussen found that McD led Creigh Deeds 51-42.

FL-08: This seems kind of surprising, given freshman Rep. Alan Grayson’s over-the-top invitations to rumble (or who knows… maybe being aggressive actually works to cow Republicans?). After a lot of public vacillating, it turns out that Republican former state Sen. Daniel Webster, considered the strongest contender to go up against Grayson, won’t run. Rich guys Jerry Pierce and Armando Gutierrez Jr. are in the race, but the establishmenet Plan D (with Webster, state House speaker Larry Cretul, and Orange Co. Mayor Rich Crotty out) seems likely to fall to state Rep. Stephen Precourt, who expressed interest but said he’d defer to Webster.

NC-11: Looks like businessman Jeff Miller declined for a good reason yesterday, as the GOP nailed down a stronger-sounding competitor to go up against Rep. Heath Shuler in the R+6 11th. Greg Newman, the mayor of Hendersonville (pop. 10,000 in 2000) since 2005, says he’ll take on Shuler.

SC-05: State Sen. Mick Mulvaney looks ready to launch his candidacy, most likely on the 17th at a GOP gathering in the district. He’ll take on 27-year incumbent and House Budget chair John Spratt.

TN-St. House: There’s a small House special election in Tennessee tonight, with big stakes. HD 62, located in rural south central Tennessee (its major town is Shelbyville) was vacated by a Democrat, Curt Cobb, who resigned to take a better-paying job; Cobb’s brother Ty is facing off against Republican Pat Marsh. It’s GOP leaning territory, though (this is part of the 6th CD, which had a very sharp Democratic falloff in 2008). The stakes are high because the Democrats hold the chamber by a 1-vote margin, 50-49, thanks only to a power-sharing arrangement with renegade Republican Kent Williams who serves as the Speaker elected with Democratic votes. A Republican victory here could give control of the House back to the GOP, if they’re able to reorganize in midterm. If the Republicans can control the state House and pick up the governor’s office in 2010, they’ll control the resdistricting trifecta.

Mayors: One other election on the docket in Tennessee tonight Thursday: Shelby Co. Mayor A.C. Wharton is looking likely to become the new mayor in Memphis. Polling has him leading Mayor Pro Tem Myron Lowery by a wide margin. (There are 25 candidates in the race, including professional wrestler Jerry Lawler.) The mayoral job was vacated, of course, by long-time mayor Willie Herenton, who after several abortive attempts to resign in the past is leaving to challenge Rep. Steve Cohen in a primary.

Redistricting Virginia 7-4 Democrats

I know this is not very realistic but I decided to go for a 7-4 Democratic plan. Democrats should control at least the State House but it would unlikely if they had total control of everything. Most Republicans would probably like most of the plan except that I weaken Frank Wolf from the 10th district. He claims to be a moderate but he is actually a Conservative. My other main priority was to strengthen all the Democratic incumbents. On a different note, this is the first time in awhile I have asked you which state I should do next. Here are the maps:

Virginia State Map

Western (not west) Virginia

Northern Virginia

Hampton Roads

Here is a link to the current Congressional map of Virginia: http://www.nationalatlas.gov/a…

1st District (Blue) Robert Whitman (R)

Even if Republicans do not like the plan, they should be happy about this district. I removed all of Prince William County which is trending Democratic quickly. I also removed the slivers of Hampton and Newport News because Obama easily won those two areas. I also removed Caroline, Essex and King and Queen Counties because Obama barely won those counties and I wanted to put them in the 5th district. The new counties in the district were Hanover (which McCain won by 19,000 votes,) Orange and New Kent. The latter two are Republican. Even though the district looks rural, it is mostly concentrated on fast growing Republican suburbs. Stafford and Spotsylvania counties might be marginal in the 2012 presidential election as minorities and voters from D.C move there. Whitman should be safe here in a district where McCain probably won 56% of the vote, up from 51% under the old plan. The demographics are 15% Black (down from 18%) and 76% White. Status is Safe Republican.

2nd District Glenn Nye (D) Green

Nye barely won and Obama barely won the old district too. Even though Nye is a blue dog, a strong Republican could easily unseat him, especially in a year like 2010. So I added all of Hampton and Newport News to the district. Those two cities voted for Obama by a combined 51,000 votes. I may have overprotected Nye by creating a grotesque gerrymander including Black neighborhoods in Virginia Beach and White neighborhoods in Norfolk. The parts of Norfolk I included may not be heavily Democratic. I did at least remove Republican parts of Virginia Beach. Anyway, the district becomes heavily Democratic while the 3rd district is still majority Black. The only problem is that 3rd district Congressman Bobby Scott’s home is in the district. Since the 3rd contains most of his old territory, he could just run there and be safe. Obama probably won 61% of the vote here. The demographics are 34% Black, 5% Hispanic and 54% White. Status is Safe Democrat.

3rd District Bobby Scott (D) Purple

The district changes a bit and no longer jumps over the river. It loses all of Hampton and Newport News while scooping up every Black precinct on the southern bank of the James River. Most of the new precincts are from the current 4th district. Also, the 3rd drops Republican New Kent County while extending an arm into Hopewell which leans Democratic and Petersburg where Obama won 89% of the vote. Besides these changes, I added a few more precincts in Richmond City and Henrico County. I also added some in Chesterfield County which had high Black turnout but McCain still won it. Basically, all the new additions came in here so I could strengthen the 4th district. With these small changes, Scott should be safe. Obama probably won 75% of the vote here. Demographics are 55% Black and 36% White. Status is Safe Democrat.

4th District Randy Forbes (R) Red

I mentioned this map would be a gerrymander. I definitely made this district convoluted even though it is nothing compared to (you can probably figure that out.) Still, I kept in most of Chesapeake where Forbes lives. Since the 3rd district and the 5th took away all the heavily Black precincts, I sent this district west to take away Republican areas in the 5th and 9th districts. The district has a long string along the Virginia/North Carolina border to a clump of Republican counties formerly in the 5th and 9th districts. I see no reason for Forbes to complain unless he wanted a more compact district. Since I reduced the Black population from 33% to 20%, Forbes should be safe. McCain probably won 59% of the vote here. Demographics are 20% Black and 72% White. Status is Safe Republican.

5th District Tom Perrillio (D) Yellow

First, I am sorry about this extremely convoluted gerrymander that should not be on this map. I do not see Republicans objecting to it because it helps shore up possibly endangered incumbents such as Whitman, Forbes and Cantor. The district’s new changes include a finger into the old 1st district to take some Democratic areas. The district then goes toward Richmond. The last major change was extending the district up to Rappahannock County which is 83% White but Democratic Senator Jim Webb still carried it in 2006. What is amazing is that Black percentage remains stagnant. The areas the district picks up such as Harrisonburg in the Shenandoah Valley are filled with white Democrats. Perrillio should face a major challenge in 2010 but if he survives, this plan will protect him. Obama probably won 54% of the vote here. Demographics are 23% Black and 69% White. Status is Likely Democrat.

6th District Bob Goodlatte (R) Teal

This district stays mostly the same in area. Goodlatte keeps the Shenandoah Valley and loses Democratic areas in it such as Harrisonburg and part of Roanoke. Just to shake him up, I took his home out but since this district contains most of his old territory, he would probably pick it. I gave him some Republican counties in the current 9th district. The biggest change I made was moving this district closer to D.C. I gave him most of Fauquier County which used to be in the 1st district. I even gave him a slice of Prince William County. D.C politicians might complain but Goodlatte will not. The area I gave him is pretty Republican. The only problem I see for him is that Deeds might take a run at this district if he loses the gubernatorial election. The 6th district contains most of his old State Senate district. He could run it close but would probably lose by about ten points because I do not see Republicans in the northern part of the district backing Deeds. I will give Deeds a better chance if he performs extremely well in rural areas during the gubernatorial election. In other cases, Goodlatte should be safe. McCain probably won 62% of the vote here. Demographics are 5% Black and 89% White, the whitest district in Virginia. Status is Likely Republican if Deeds runs, Safe Republican if Deeds does not.

7th district Eric Cantor (R) Gray

Unlike Goodlatte, Cantor keeps his home in his district but the rest of his territory is switched. I split his old territory with the 1st and 5th districts. Most of his new territory was Republican parts of the 4th and the 5th. The reason I took Republican areas away from the 4th was for population purposes. I know this is gerrymandered but as long as he has a safe district, Republicans and Cantor should not complain. McCain probably won 55% of the vote here. Demographics are 17% Black and 74% White. Status is Safe Republican.

8th District Jim Moran (D) Purple (in the north)

I kept most of Arlington and all of Alexandria in the district. The main changes I made were taking out the thin corridor that heads to Reston in northwestern Fairfax County. I sent Moran’s district to western Fairfax County to take in some territory that is mixed. Obama probably pulled even in the western part but Arlington and Alexandria should save Moran from any trouble. The close in suburbs should help make this district heavily Democratic. Obama probably won 65% of the vote here. Demographics are 10% Black, 16% Hispanic, 14% Asian and 55% White. Status is Safe Democrat.

9th District Rick Boucher (D) Light Blue

This district mostly remained unchanged after most redistricting. I decided to change that. I put some heavily Republican counties into the 6th district. The only spot of worry is that I slipped in Roanoke which votes Democratic but Goodlatte lives there. Again, I am assuming Goodlatte would not want to risk a run against Boucher when Goodlatte could easily win the 6th. The Republicans may field someone else but that candidate would have a poor chance of beating Boucher. McCain probably won 56% of the vote here, down from 59% in the old district. Demographics are 8% Black and 86% White. Status is Safe/Likely Democrat.

10th District Frank Wolf (R) Pink

His district is 69% White so it appears unchanged at a first glance from its current form. Wolf’s problem is that many of those white voters are Liberals. His old district contained many white voters from the Conservative Shenandoah Valley. I will admit I did not give him much new territory. I did, however take out all of the Shenandoah Valley. The only Conservative areas are Clarke County and part of Fauquier County. I kept most of his old territory in the district with all of Loudon County and northern Fairfax County. He is probably entrenched there. Still, he should lose because I added Vienna, Reston, Falls Church and about half of Arlington. Those areas combined probably gave Obama a combined 40,000 vote margin. Also knowing that Wolf’s old territory he keeps voted for Obama, Wolf is in trouble. Brian Moran, Jim Moran’s brother might run here as a comeback after his failed Gubernatorial primary run earlier this year. With his brother’s support, Brian Moran would crush Wolf in Fairfax County and that should offset anything from Loudon County. Obama probably won 58% of the vote here. Demographics are 6% Black, 10% Hispanic, 12% Asian and 69% White. Status is Likely/Lean Democrat, depending on the challengers.

11th District Gerry Connelly (D) Light Green

This district shrank in size like the 10th due to large population gains. I sent this district to the Alexandria border and kept it out of the Republican western Prince William County. I also added Manassas and the surrounding area which Obama won. I cut out central Fairfax County due to population constraints. Another change was adding Democratic parts of Stafford County which Obama may turn blue in 2012. Overall, this district now easily protects Connelly. Obama probably won 60% of the vote here. Demographics are 17% Black, 17% Hispanic, 9% Asian and 52% White. Status is Safe Democrat.  

By what margin will Bob Shamansky win?

View Results

Loading ... Loading ...

Racial Composition Change by Congressional District

With the 2008 American Community Survey data finally available broken down by congressional district, last week I started out by looking at how districts’ population had changed between the 2000 census and the 2008 estimate. Today, I’m delving a little deeper, looking at how the racial composition of the districts has changed.

Let’s start with the districts where the change in non-Hispanic whites has been the greatest. I’m starting with the greatest percentage loss in white population — and unlike the other charts I’m creating today, I’m extending this one to 25 spots and including presidential election data, because, for our purposes, this may be the most interesting and important chart. Not coincidentally, the districts that had the biggest percentage drops in non-Hispanic white population from 2000-2008 also had some of the most profound electoral shifts from 2000-2008.

District Rep. 2000 white 2000 total 2000 % 2008 white 2008 total 2008 % % Change 2000 election 2008 election
GA-07 Linder (R) 476,346 630,511 75.5 529,284 901,363 58.7 -16.8 31/69 39/60
GA-13 D. Scott (D) 295,107 629,403 46.9 236,807 785,643 30.1 -16.7 57/43 71/28
TX-22 Olson (R) 394,651 651,657 60.6 416,608 873,878 47.7 -12.9 33/67 41/58
CA-25 McKeon (R) 363,792 638,768 57.0 362,083 819,973 44.2 -12.8 42/56 49/48
CA-11 McNerney (D) 408,785 639,625 63.9 412,398 802,588 51.4 -12.5 45/53 54/44
FL-19 Wexler (D) 494,890 638,503 77.5 479,411 733,322 65.4 -12.1 73/27 65/34
IL-03 Lipinski (D) 445,179 653,292 68.1 384,898 684,703 56.2 -11.9 58/40 64/35
TX-24 Marchand (R) 415,842 651,137 63.9 402,111 772,580 52.0 -11.8 32/68 44/55
TX-10 McCaul (R) 431,992 651,523 66.3 522,558 955,363 54.7 -11.6 34/67 44/55
FL-20 Wasserman-Schultz (D) 426,891 639,795 66.7 376,936 672,717 56.0 -10.7 69/31 63/36
NV-03 Titus (D) 459,756 665,345 69.1 566,630 966,577 58.6 -10.5 49/48 55/43
TX-05 Hensarling (R) 466,321 651,919 71.5 449,229 733,117 61.3 -10.3 34/66 36/63
TX-07 Culberson (R) 439,217 651,682 67.4 429,249 751,034 57.2 -10.2 31/69 41/58
VA-11 Connolly (D) 430,091 643,582 66.8 432,337 758,422 57.0 -9.8 45/52 57/42
CA-10 vacant 417,008 638,238 65.3 386,575 696,175 55.5 -9.8 55/41 65/33
FL-12 Putnam (R) 461,239 640,096 72.1 488,712 782,178 62.5 -9.6 45/55 49/50
CA-22 McCarthy (R) 426,192 638,514 66.7 440,149 768,635 57.3 -9.5 33/64 38/60
AZ-03 Shadegg (R) 503,584 640,898 78.6 508,259 734,739 69.2 -9.4 43/55 42/57
CA-03 Lungren (R) 474,940 639,374 74.3 508,886 784,306 64.9 -9.4 41/55 49/49
TX-06 Barton (R) 430,223 651,691 66.0 443,892 783,790 56.6 -9.4 34/66 40/60
FL-15 Posey (R) 497,676 639,133 77.9 541,878 790,487 68.5 -9.3 46/54 48/51
TX-03 S. Johnson (R) 412,291 651,782 63.3 456,634 845,481 54.0 -9.2 30/70 42/57
MD-05 Hoyer (D) 400,668 662,203 60.5 380,676 741,163 51.4 -9.1 57/41 65/33
NJ-07 Lance (R) 511,737 647,269 79.1 477,114 682,187 69.9 -9.1 48/49 51/48
CA-13 Stark (D) 244,693 638,708 38.3 189,167 647,397 29.2 -9.1 67/30 74/24

Almost all of these districts moved sharply in the Democrats’ direction. The only exceptions are AZ-03, explainable by the McCain favorite son effect in 2008, and FL-19 and FL-20, where the largely elderly and Jewish populations were more amenable to Gore/Lieberman than they were to Obama. (Also worth noting; there has been a lot of middle-class Cuban movement to the suburban parts of the 20th.)

Much more over the flip…

If you were to look at the drop in white population in terms of raw numbers, though, you’d get a very different impression. The 10 districts that had the biggest drops are predominantly the Rust Belt white-majority urban districts that were on the list of overall biggest population losses, starting with MI-12 (from 540,548 whites to 458,036), followed by PA-14, OH-10, NJ-09, IN-07, IL-03, GA-13, TN-09, PA-01, and CA-13. GA-13 is the exception here, where there’s some outright white flight going on in a fast-growing district, as Atlanta’s southern exurbs turn into black-majority terrain.

Now let’s take a look at the districts with the biggest white gain, in percentage terms (this time in more abbreviated form):

District Rep. 2000 white 2000 total 2000 % 2008 white 2008 total 2008 % % Change
NY-15 Rangel (D) 106,664 654,355 16.3 147,570 671,752 22.0 5.7
NY-11 Clarke (D) 140,595 654,134 21.5 175,014 663,042 26.4 4.9
IL-07 D. Davis (D) 178,144 653,521 27.3 195,024 629,923 31.0 3.7
GA-05 Lewis (D) 216,674 629,438 34.4 257,072 676,513 38.0 3.6
NY-12 Velazquez (D) 150,673 653,346 23.1 180,824 681,862 26.5 3.5
HI-02 Hirono (D) 168,999 640,927 27.9 202,657 647,661 31.3 3.4
NY-10 Towns (D) 106,746 655,668 16.3 135,213 697,685 19.4 3.1
NY-14 Maloney (D) 432,312 654,165 66.1 451,277 654,566 68.9 2.9
CA-29 Schiff (D) 248,857 638,899 39.0 273,625 655,941 41.7 2.8
MI-14 Conyers (D) 213,120 662,468 32.2 206,024 591,652 34.8 2.7

While you might initially expect to see exurbs on this list, they aren’t, by percentage terms, getting whiter (quite the contrary, in most places). Instead, this list mostly shows the effects of regentrification in already-expensive cities, especially in the close-in parts of New York’s outer boroughs. The only exceptions here are HI-02, which seems to be seeing more white retirees, and MI-14, which no one would accuse of regentrifying right now, but where apparently the white suburban portions aren’t depopulating as fast as Detroit proper. (Wondering who’s #11? The district I would have expected to be at #1: LA-02, which experienced some rather abrupt regentrification of its own.)

Also worth noting: contrary to what one might expect, these whitening districts aren’t become less liberal. They all saw an improvement from Gore’s 2000 numbers to Obama’s 2008 numbers (despite the fact that their 2000 numbers, in most districts, were already up in the 80s), mostly because of increased minority turnout in 2008, but also because the early waves of gentrifiers are people who are already quite disposed toward voting Democratic.

Instead, you see the fast-growing exurbs if you look at the districts with the largest white population gain by raw numbers. Not coincidentally, this list heavily overlaps with the list of the biggest overall gainers we looked at in my previous post: AZ-02 (which went from 502,961 whites to 692,633), AZ-06, FL-05, UT-03, ID-01, CO-06, NC-09, NV-03, GA-09, and TX-26. The biggest overall gainers that aren’t on this list are TX-10, which has seen mostly Hispanic growth, and GA-07, which is seeing a lot of African-American growth.

In fact, that’s a good transition point to the districts that had the largest African-American growth, in percentage terms:

District Rep. 2000 black 2000 total 2000 % 2008 black 2008 total 2008 % % Change
GA-13 D. Scott (D) 255,455 629,403 40.6 419,235 785,643 53.4 12.8
GA-07 Linder (R) 72,962 630,511 11.6 188,302 901,363 20.9 9.3
MI-12 Levin (D) 77,403 662,559 11.7 117,172 621,619 18.8 7.2
IL-02 J. Jackson (D) 403,522 654,078 61.7 427,990 630,933 67.8 6.1
MD-02 Ruppersberger (D) 178,860 661,945 27.0 228,632 699,352 32.7 5.7
MD-05 Hoyer (D) 198,420 662,203 30.0 263,487 741,163 35.6 5.6
FL-19 Wexler (D) 37,821 638,503 5.9 81,258 733,322 11.1 5.2
MI-11 McCotter (R) 23,456 662,505 3.5 63,666 737,189 8.6 5.1
MO-01 Clay (D) 307,715 621,497 49.5 323,769 594,535 54.5 4.9
GA-03 Westmoreland (R) 119,766 630,052 19.0 189,706 795,402 23.9 4.8

The main story here seems to be African-Americans moving out of the cities and into the suburbs. It’s most pronounced in the Atlanta area, where, interestingly, Atlanta itself is becoming whiter (see GA-05 above), while much of the suburban growth is driven by African-Americans. It’s also quite noticeable in the Detroit area, where there’s a lot of fleeing Detroit’s economic ruins across the city lines into the adjacent 11th and 12th.

The list isn’t much different if you go purely by African-American numeric gains. The big gainers are: GA-13, GA-07, GA-03, MD-05, NC-09, MD-02, TX-22, TX-10, GA-11, and FL-19. The exceptions tend to be growth engines like NC-09 and TX-10 where a lot of everybody is moving there.

Now let’s look at the districts with the largest decrease in African-American population, percentagewise:

District Rep. 2000 black 2000 total 2000 % 2008 black 2008 total 2008 % % Change
IL-07 D. Davis (D) 402,714 653,521 61.6 334,138 629,923 53.0 -8.6
CA-09 Lee (D) 164,903 639,426 25.8 125,043 623,814 20.0 -5.7
CA-35 Waters (D) 216,467 638,851 33.9 187,110 664,849 28.1 -5.7
LA-02 Cao (R) 407,138 639,048 63.7 273,006 469,262 58.2 -5.5
GA-05 Lewis (D) 350,940 629,438 55.8 342,289 676,513 50.6 -5.2
NY-11 Clarke (D) 379,017 654,134 57.9 358,753 663,042 54.1 -3.8
NY-15 Rangel (D) 198,915 654,355 30.4 183,251 671,752 27.3 -3.1
IL-01 Rush (D) 424,430 654,203 64.9 383,734 620,843 61.8 -3.1
MD-04 Edwards (D) 374,755 661,651 56.6 364,985 679,854 53.7 -3.0
CA-33 Watson (D) 189,855 638,655 29.7 175,150 651,169 26.9 -2.8

This list, not so different from the list of white-gaining regentrifiying districts. There are also some districts where Hispanics are replacing blacks (CA-09, CA-35, and maybe counterintuitively, MD-04).

In terms of raw numbers, the biggest African-American drop in population is, no surprise, LA-02 (from 407,138 to 273,006), followed by IL-07, MI-13, MI-14, PA-02, IL-01, CA-09, CA-35, OH-11, and NY-11. (This includes districts like MI-13 and OH-11 where everyone of all races is leaving, at an equal rate.)

Now let’s turn to the largest percentage increases in Asian populations:

District Rep. 2000 white 2000 total 2000 % 2008 white 2008 total 2008 % % Change
CA-15 Honda (D) 187,198 639,090 29.3 244,744 671,729 36.4 7.1
CA-13 Stark (D) 179,681 638,708 28.1 226,018 647,397 34.9 6.8
NY-06 Meeks (D) 60,954 654,946 9.3 101,454 686,631 14.8 5.5
NY-05 Ackerman (D) 159,491 654,253 24.4 198,345 669,591 29.6 5.2
CA-14 Eshoo (D) 102,430 639,953 16.0 138,389 653,246 21.2 5.2
CA-11 McNerney (D) 55,895 639,625 8.7 109,743 802,588 13.7 4.9
CA-48 Campbell (R) 80,095 638,848 12.5 121,002 721,557 16.8 4.2
VA-10 Wolf (R) 41,846 643,714 6.5 85,787 805,507 10.7 4.1
NJ-07 Lance (R) 52,965 647,269 8.2 83,234 682,187 12.2 4.0
TX-22 Olson (R) 50,459 651,657 7.7 102,261 873,878 11.7 4.0

There are two separate categories here: Democratic areas in the Bay Area (including CA-13, which between 2000 and 2008 moved from a white plurality to an Asian plurality) and Queens, and traditionally Republican districts in affluent suburbs — all of which, except for NJ-07, experienced a significant fall-off in Republican numbers in 2008.

In terms of biggest gains by the raw numbers, the biggest Asian gains were in CA-15 (a gain of 57,000), CA-11, TX-22, CA-13, VA-10, TX-03, WA-08, NV-03, CA-48, and GA-07. TX-03, NV-03, and GA-07 are all high on the list of districts with the greatest white losses by percentage, and while WA-08 is still pretty white, it’s a district that’s nevertheless trending in our direction as well.

There are very few districts that are losing Asian populations, either in percentage or raw numbers, so it doesn’t really merit another table. The biggest losers by percentage are HI-01 (-3.7%, from 53.5 to 49.8 — with the replacements pretty evenly distributed among whites, Hispanics, and “two or more races,” which is a huge category in Hawaii compared with the rest of the nation), HI-02, MN-05, TX-09, GA-04, WA-07, CA-18, TX-29, and LA-03. The biggest losers by raw numbers are MN-05 (31,780 to 23,662, presumably indicating Minneapolis’s large Hmong population moving out to the suburbs), HI-01, HI-02, GA-04, TX-09, WA-07, LA-03, TX-29, TX-11, and MI-13.

Finally, let’s look at the districts with the biggest percentage-wise gains among Hispanics:

District Rep. 2000 white 2000 total 2000 % 2008 white 2008 total 2008 % % Change
IL-03 Lipinski (D) 139,268 653,292 21.3 228,215 684,703 33.3 12.0
CA-25 McKeon (R) 174,193 638,768 27.3 308,659 819,973 37.6 10.4
TX-32 Sessions (R) 235,626 650,555 36.2 306,290 669,328 45.8 9.5
CA-41 Lewis (R) 150,076 639,935 23.5 250,428 760,575 32.9 9.5
TX-29 G. Green (D) 430,890 651,405 66.2 518,208 686,198 75.5 9.4
CA-22 McCarthy (R) 133,571 638,514 20.9 231,717 768,635 30.1 9.2
TX-05 Hensarling (R) 83,113 651,919 12.7 157,312 733,117 21.5 8.7
AZ-04 Pastor (D) 372,365 641,430 58.1 502,458 753,506 66.7 8.6
FL-20 Wasserman-Schultz (D) 132,575 639,795 20.7 196,465 672,717 29.2 8.5
CA-52 Hunter (R) 88,273 639,329 13.8 144,579 663,810 21.8 8.0

As you can see, there are some solidly Democratic districts on this list — although some of them have Anglo Representatives who may have to be on their toes for a primary (though IL-03’s Dan Lipinski, targeted by the netroots in 2008, is pretty well machine-protected, and Gene Green sits in TX-29, the district with the lowest turnout in the nation). The rest are Republican-held, and while some have moved sharply in the Democratic direction in the most recent cycle (CA-25, TX-32), others have had only lackluster movement (TX-05 and CA-41). My best guess as to this disparity is that in CA-25 and TX-32, white people seem to be actively leaving, draining the pool of Republican voters, while CA-41 is seeing growth across the boards. Also, bear in mind that Hispanic growth is a slow-moving tidal wave, one that will take a long time to bear fruit (as many are either too young to vote or on the path to citizenship), so it seems likely that, say, Pete Sessions will survive till the next round of redistricting, when he can probably get his hands on a nice safer district with a center of gravity outside of Dallas proper, up in Collin County.

The biggest districts for Hispanic growth in raw numbers tend to be the big, fast-growing suburban/exurban districts with the biggest overall growth, starting with the Cuban-majority FL-25 (398,986 to 565,866). It’s followed by CA-45, AZ-07, CA-25, TX-10, AZ-04, TX-28, CA-44, AZ-02, and NV-03.

Even more so than with Asians, very few districts have experienced any Hispanic losses, either in terms of population or raw numbers. 11 districts had a loss in percentage, and 11 had a loss in actual population (although, interestingly, they aren’t entirely the same 11, as, for instance, in shrinking districts, Hispanics may have lost population at a slower rate than the population at large). The losers in terms of percentage are NY-12 (-3.5%, from 48.7 to 45.2, thanks largely to white regentrification of areas like Williamsburg), NY-15, IL-04, CA-31, CA-08, NY-14, CA-29, NY-08, NY-10, OH-06, and GA-02. The losers in terms of raw numbers are IL-04 (486,839 to 442,423, again indicative of regentrification, as well as a lot of moves either to IL-03 or to DuPage and Kane Counties), CA-31, NY-15, NY-12, NY-14, CA-53, OH-11, OH-06, CA-08, MI-05, and GA-02.

Whew! That’s a lot of data to digest, of course. But the takeaway is clear across the boards: districts where white populations are shrinking and/or minority populations are growing, are mostly seeing Democratic gains. Districts where white populations are growing and/or minority populations are shrinking, on the other hand, still managed to see Democratic gains in 2008. The districts where Republicans actually gained ground in 2008 are mostly in areas where there isn’t much population growth and isn’t much change in the racial composition (mostly rural areas, especially following the line of the Appalachians and Ozarks, but you could also say that same thing about, say, western Pennsylvania or Long Island).

Redistricting California 2010

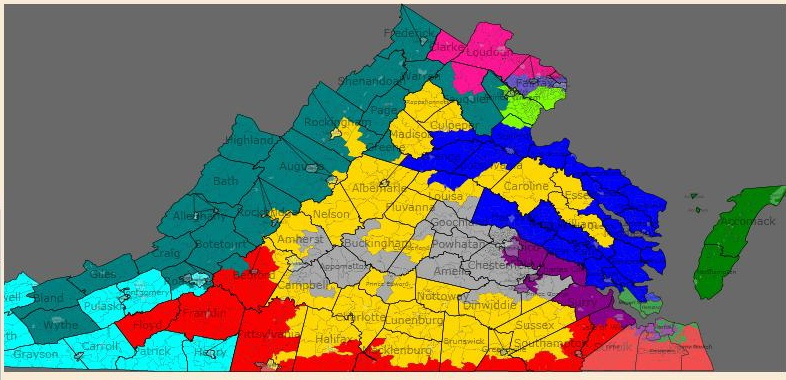
Here is my first attempt at redistricting California for 2010. I gave myself an extra challenge of keeping the representatives’ residences in their respective districts save of course McClintock, and assuming Garamendi wins CA-10.

For the demographics, I noticed that even in obviously heavy Hispanic areas, the “Hispanic” percentage was ridiculously low, while the “Other” category was more representative of the Hispanic population, so for “Hispanic” I will use the “Hispanic” and “other” numbers.

Later on I will attempt redistricting the State Senate and Assembly. I know there is a panel that will draw the state legislative districts, but I still intend to give a shot at these maps.

Cross-posted at Calitics.

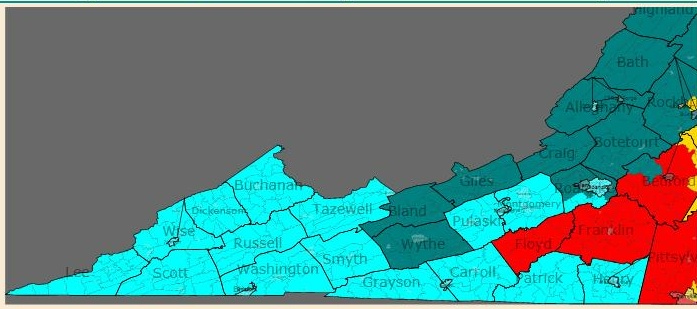
OUTER NORTHERN CALIFORNIA

Image and video hosting by TinyPic

CA-01: Shifted parts of Sonoma out into the 6th, and added all of Trinity and Yolo, and northern Solano. (70% White, 21% Hispanic)

CA-02: Shifted in all of Butte and the most heavily Republican counties Modoc and Lassen, and removed Yuba. (76% White, 16% Hispanic)

CA-03: Made the district more compact and possibly more Democratic by putting it entirely within Sacramento. (71% White, 15% Hispanic, 6% Asian, 5% Black)

CA-04: Shifted out the parts of Butte in the current district, as well as Modoc and Lassen, to the 2nd, and gave part of western Placer to the 5th. (83% White, 11% Hispanic)

CA-05: Expanded northward to include all of northwestern Sacto County as well as part of western Placer County. Should be slightly less Democratic but no problem for Matsui. (43% White, 25% Hispanic, 16% Asian, 13% Black)

CA-06: Shifted in more of Sonoma County to keep a North Bay-centric district. (76% White, 17% Hispanic)

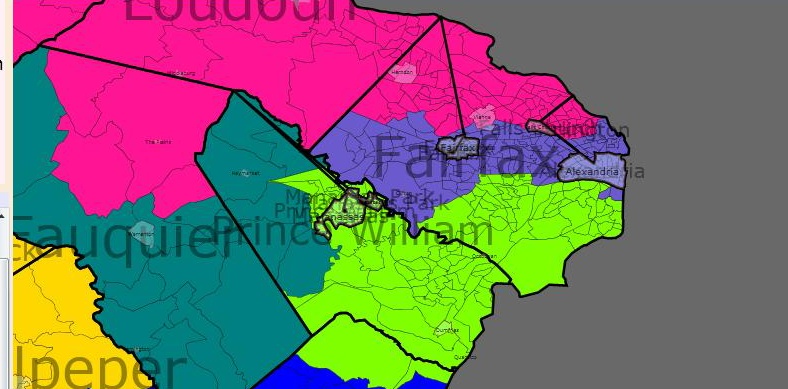
SAN FRANCISCO BAY AREA

Image and video hosting by TinyPic

CA-07: Pretty much the same as the old district, except I shifted Pittsburg out to the 10th. (45% White, 23% Hispanic, 14% Black, 14% Asian)

CA-08: Not much change here. Still San Francisco-centric. (44% White, 28% Asian, 18% Hispanic, 7% Black)

CA-09: Same as previous district, in northeastern Alameda County, only including the city of Alameda. (34% White, 25% Black, 20% Hispanic, 17% Asian)

CA-10: Here I had to do a little shifting, to shore up McNerney and include Garamendi’s residence in Sacramento County. I removed the Alameda portion, since Tauscher had wanted to keep Lawrence Livermore National Laboratories in her district, and since she is no longer in Congress, I decided to remove it so I could add some more of Alameda to shore up McNerney. I also excised some of Contra Costa, which also went to the 11th. (63% White, 19% Hispanic, 9% Asian, 7% Black)

CA-11: Does look similar to old CA-11, only with more of Contra Costa and Alameda to strengthen McNerney. Dublin, Livermore, and San Ramon should help. (59% White, 24% Hispanic, 10% Asian, 4% Black)

CA-12: Same as before, northern San Mateo County and the southwest corner of San Francisco. (47% White, 28% Asian, 20% Hispanic)

CA-13: Same as before, western Alameda County only without Alameda, which I shifted to the 9th. (38% White, 27% Asian, 26% Hispanic, 6% Black)

CA-14: Same as before, with parts of Silicon Valley and southern San Mateo and northern Santa Cruz. (60% White, 18% Hispanic, 16% Asian)

CA-15: Same as before, Silicon Valley-centric. (52% White, 24% Asian, 20% Hispanic)

CA-16: Same as before, San Jose-centric. (39% Hispanic, 28% White, 28% Asian)

CENTRAL CALIFORNIA

Image and video hosting by TinyPic

CA-17: Little change. (45% White, 43% Hispanc, 5% Asian)

CA-18: Still Central Valley-centric, only with the Fresno part removed for some simplification. (44% White, 42% Hispanic, 7% Asian)

CA-19: Maintained most of the Central Valley parts of the district, and since I couldn’t find any other place to put Alpine, Amador, Calaveras, and Mono, I just threw them in here. (I moved the first 3 to make CA-03 more compact, and also shifted Mono and Inyo (which went to CA-21) to cut down on CA-25’s ridiculous geographic size. (61% White, 29% Hispanic)

CA-20: Shifted a bit more of Fresno into this one. (53% Hispanic, 31% White, 6% Asian, 6% Black)

CA-21: Shifted part of Fresno out into the 20th to make room for Inyo. (47% White, 45% Hispanic/Portuguese)

CA-22: Little change. Still Bakersfield-centric with inland San Luis Obispo and Lancaster from L.A. County. (58% White, 30% Hispanic, 7% Black)

CA-23: Did a little shifting between this and CA-24 to make the former a little less Democratic and the latter a little less Republican. I kept coastal SLO, but shifted uber-Republican inland Santa Barbara in and shifted heavily Democratic Oxnard out. (62% White, 30% Hispanic)

CA-24: Reduced Republican strength with heavily Republican inland Santa Barbara out and heavily Democratic Oxnard in. I also shifted a part of southeastern Ventura out, which I presume is Republican-leaning. This should be enough to give Gallegly a big run for his money. (54% White, 35% Hispanic, 5% Asian)

CA-25: Greatly reduced the land area by lopping off Inyo and Mono. Put in a little more of the San Fernando Valley to make up. (54% White, 29% Hispanic, 7% Black, 5% Asian)

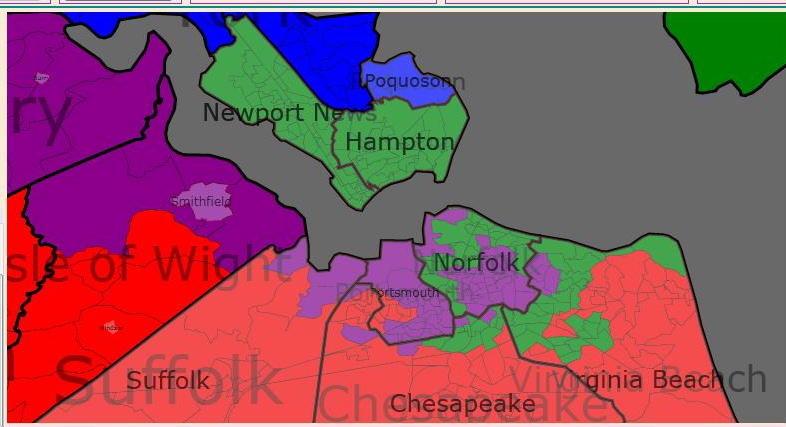
LOS ANGELES AND ORANGE COUNTY

Image and video hosting by TinyPic

CA-27: I had to stretch this district a little to take in Pasadena while also maintaining the San Fernando Valley part of the district. (45% White, 30% Hispanic, 13% Asian, 7% Black)

CA-28: I was able to maintain most of this district. It was much less Hispanic in 1982 when Berman was first elected, though when he retires a Hispanic is very likely to replace him. (61% Hispanic, 25% White, 7% Asian)

CA-29: Excised Pasadena and was able to maintain everything else including Schiff’s home in Burbank, and the Armenians in Glendale, since Schiff has been advocating for Armenians in Congress. (41% White, 30% Hispanic, 25% Asian)

CA-30: Maintained this district as West Side-centric, only removing Santa Monica and adding in part of southeast Ventura County. Should still be heavily Democratic. (74% White, 14% Hispanic, 7% Asian)

CA-31: Kept this district as the only L.A. County district completely within the city of L.A. (59% Hispanic, 19% White, 16% Asian)

CA-32: Added in the northern L.A. suburbs removed from CA-26; should still be very Democratic. (59% Hispanic, 18% Asian, 17% White)

CA-33: Kept as much of Culver City and some heavily black portions of L.A. in this district as I could. It’s plurality-Hispanic demographically, but black-plurality in voting. (42% Hispanic, 26% Black, 18% White, 11% Asian)

CA-34: Still Downtown L.A.-centric and the most Hispanic district in the state. (84% Hispanic, 8% Black)

CA-35: Made this district majority-Hispanic. A Hispanic will likely replace Waters when she retires. (54% Hispanic, 37% Black)

CA-36: Removed the Palos Verdes portion of the district and added Santa Monica to make this district more Democratic so Harman will either become less of a Blue Dog or be primaried out. (56% White, 23% Hispanic, 15% Asian)

CA-37: Shifted half of Palos Verdes into this district while removing parts of Long Beach. (41% Hispanic, 26% White, 18% Black, 12% Asian)

CA-38: With Pomona out, I was able to shorten this district considerably, though I still had to keep in stretchy to keep in Napolitano’s residence in Norwalk while keeping most of east L.A. (63% Hispanic, 16% Asian, 16% White)

CA-39: Still U-shaped, only I extended the district into Whittier. (56% Hispanic, 26% White, 11% Asian)

CA-40: Not much change. (46% White, 35% Hispanic, 14% Asian)

CA-42: Removed Chino and Diamond Bar while adding conservative parts of southern OC. (57% White, 26% Hispanic, 12% Asian)

CA-46: Removed half of Palos Verdes and added in a little more of Garden Grove. (48% White, 30% Hispanic, 15% Asian)

CA-47: Replaced the removed parts of Garden Grove with some areas to the east. (61% Hispanic, 21% White, 15% Asian)

CA-48: I shifted some of the conservative southern regions of this district into CA-42. (65% White, 19% Hispanic, 13% Asian)

OUTER SOUTHLAND AND SAN DIEGO

Image and video hosting by TinyPic

CA-26: I wanted to maintain my hometown of Rancho Cucamonga in this district while making it more Democratic, so I excised some of the further west portions of this district, and added Pomona and Ontario while keeping neighboring CA-43 majority-Hispanic. (45% White, 41% Hispanic, 6% Asian, 6% Black)

CA-41: Added in some rural northern parts of CA-26. (64% White, 25% Hispanic)

CA-43: I had to do some reshuffling to make CA-26 more Democratic while maintaining this district as majority-Hispanic by removing Ontario, adding Chino and a small portion of Riverside. (53% Hispanic, 26% White, 12% Black)

CA-44: Moved this district entirely into Riverside so Calvert will have an even tougher reelection if he is not wiped out in 2010. 44% White, 40% Hispanic, 8% Black, 5% Asian)

CA-45: Made this district more Democratic by attaching Imperial County. (49% Hispanic, 43% White)

CA-49: Did some reshuffling and removed parts of Riverside, added the most conservative southernmost portion of Orange County including San Clemente, and moved some of the San Diego parts to CA-52. (60% White, 29% Hispanic)

CA-50: Shifted some conservative inland parts out to CA-52 while adding some liberal parts in from CA-53. (66% White, 15% Hispanic, 14% Asian)

CA-51: Removed Imperial County and made this district entirely within San Diego County. Filner has won here without Imperial County in the 90s so he should still continue to win easily. (44% Hispanic, 32% White, 13% Asian, 9% Black)

CA-52: Added in conservative areas from CA-49 and CA-50. (69% White, 22% Hispanic)

CA-53: Shifted a few liberal portions out and a few conservative portions in, but should still be a cakewalk for Davis. (50% White, 33% Hispanic, 7% Asian, 7% Black)

The Shocking Secret of the 3Q Fundraising Reports

We’ve cracked open our lead strongbox once again…

AR-Sen:

     Blanche Lincoln (D-inc): $1.2M raised; $4.13M CoH

DE-Sen:

     Mike Castle (R): <$58K raised; $853K CoH

FL-Sen:

     Kendrick Meek (D): $800K raised

LA-Sen:

     Charlie Melancon (D): $750K raised

NV-Sen:

     John Chachas (R): $1.4M raised (“more than” $1M of which came from Chachas’ own pockets)

CA-03:

     Ami Bera (D): >$288K raised

MN-06:

     Taryl Clark (D): $308K raised; $270K CoH

     Maureen Reed (D): $130K raised; >$300K CoH

OH-12:

     Pat Tiberi (R): >$300K raised; >$900K CoH

PA-03:

     Paul Huber (R): $100K raised; $100K CoH

PA-06:

     Steven Welch (R): $500K CoH

SC-02:

     Joe Wilson (R-inc): $2.7M

FL-Gov:

     Bill McCollum (R): $853K raised

SSP Daily Digest: 10/12

CO-Sen: Here’s an amateur-level mistake from the Bennet campaign: electioneering in the Denver public schools (where Michael Bennet used to be Supernintendo before being appointed Senator). The campaign sent mailings to a school asking for the principal’s support and fliers were given to principals at a district workshop.

FL-Sen: The Kendrick Meek campaign is touting its own fishy poll that says that Meek leads Charlie Crist… among voters who know both of them. The lead is 45-43 for Meek among those 25% of the sample who know who the heck Meek is. In the larger sample, Crist is up 47-31.

KS-Sen: Kansas Senate news three digests in a row? I’m as surprised as you are. Anyway, retired advertising executive and journalist Charles Schollenberger confirmed that he will run for the Senate. With seemingly no Dems higher up the totem pole interested in the race, Schollenberger may wind up carrying the flag.

NC-Sen: It’s not quite confirmed, but the rumor mill is churning up stories that youthful former state Senator and Iraq vet Cal Cunningham is moving to formally jump into the North Carolina Senate race. SoS Elaine Marshall is already in the Democratic primary field.

PA-Sen: There’s an unexpected fourth Democratic participant in the Senate primary all of a sudden: Doris Smith-Ribner, a recently retired Commonwealth Court (which apparently is one of two intermediate appellate courts in Pennsylvania; don’t ask me why there are two) judge for two decades. Her presence could prove nettlesome to Rep. Joe Sestak, by eating a bit into his share of liberal anti-Arlen Specter votes in what’s likely to be a close primary. (“Fourth,” you say? State Rep. Bill Kortz is running too, and has been for many months.)

AZ-Gov: He was probably seeing the same terrible polls that everyone else was, and ex-Governor Fife Symington decided to put the kibbosh on a gubernatorial comeback. Instead, Symington endorsed not the current Governor, Jan Brewer, but one of her minor opponents, former state GOP chair John Munger.

CA-Gov: Meg Whitman scored a victory of sorts with the publication of a story titled “Meg Whitman’s voting record not as bad as originally portrayed.” It turns out she was registered at several points in California in the 1980s and 1990s, but there’s still no indication that she actually voted during this period.

Meanwhile, Whitman’s primary rival ex-Rep. Tom Campbell may get a big leg up: rumors persist that he may get picked as California’s new Lt. Governor (once John Garamendi gets elected to CA-10). I’d initially thought that was a way of scraping him out of the gubernatorial primary and giving him a door prize, but it could give him a higher profile and bully pulpit to compensate for his vast financial disadvantage as he stays in the race. Campbell was Arnold Schwarzenegger’s Finance Director for a while, and they operate in the same centrist space, so maybe Ahnold would do him the favor? (Of course, he’d still have to survive confirmation by the Dem-controlled legislature, who might be reluctant to promote Campbell, who they rightly see as the most dangerous general election opponent.)

FL-Gov: It had seemed like state Sen. Paula Dockery, who threatened repeatedly during the spring to run in the GOP gubernatorial primary, had faded back into the woodwork. However, she’s front and center again today, saying that she’s “leaning toward” running and giving herself a three-week timeline (she put off the decision because of her husband’s surgery this summer). Another minor embarrassment for her primary opponent, AG Bill McCollum: the co-chair of his campaign, former state GOP chair Alex Cardenas, had to explain that, no, he didn’t actually host a fundraiser for Democratic rival Alex Sink. (It was hosted by Democratic partners in Cardenas’s lobbying firm.)

NJ-Gov: Jon Corzine and Chris Christie have sufficiently reduced each other’s statures that the state’s largest newspaper, the Newark Star-Ledger, took what may be an unprecedented step, and endorsed the independent candidate in the race: Chris Daggett. I still can’t see this giving Daggett the momentum to break 20%, but more Daggett votes are good, as they seem to come mostly out of the Christie column. Meanwhile, Chris Christie got an endorsement he may not especially want in the blue state of New Jersey — from the Family Research Council (who also just endorsed Conservative Doug Hoffman over Republican Dede Scozzafava in the NY-23 special election). Also, Christie is living large after getting an endorsement that may carry more weight, from the New Jersey Restaurant Association.

VA-Gov (pdf): There’s one new poll of VA-Gov to report today: Mason-Dixon, and they come in with a 48-40 edge for Bob McDonnell over Creigh Deeds, closely tracking today’s Pollster.com average of 51-43. The poll finds Deeds getting only 81% of the African-American vote (with 9% to McD), far too little, especially in combination with what PPP‘s Tom Jensen is seeing, as he teases that he’s projecting abysmal black turnout of 12% in the coming election. At any rate, Deeds is now touting his underdog status in fundraising e-mails, and is alluding to more possible visits from Barack Obama in the stretch run.

FL-20: Here’s an understatement: Republican candidate Robert Lowry, hoping to defeat Rep. Debbie Wasserman Schultz in this D+13 district, conceded it was a “mistake” to shoot at a target labeled “DWS” while at a Southeast Republican Club gathering at a gun range.

MN-06: As state Sen. Tarryl Clark seems to be building a fundraising and labor endorsement edge, her primary opponent for the Democratic nomination, Maureen Reed, says she won’t follow traditional decorum and abide by the DFL endorsement. Reed (a former member of the Independence Party) says she’ll keep open the option of taking the fight all the way to the primary, a reversal of her position from months earlier (although from before Clark got into the race and Elwyn Tinklenberg left). (UPDATE: The Reed campaign writes in to say that the Minnesota Public Radio story that underpins this story is incorrect and that Reed never stated whether or not she would abide by the DFL endorsement.)

NC-11: One reddish southern district where the Republicans are still at square one on recruitment is the 11th. Businessman Jeff Miller said that he won’t challenge sophomore Dem Heath Shuler.

NY-15: As ethics allegations take a toll against long-time Rep. Charlie Rangel, he’s getting a primary challenge… from his former campaign director. Vince Morgan, now a banker, says “it’s time for a change.”

OH-17: Republicans may have found someone to run in the 17th against Rep. Tim Ryan: businessman and Air Force vet Bill Johnson, who’s now exploring the race and will decide in December. Ryan probably isn’t too worried, as he’s won most of his races with over 75%, in this D+12 district.

PA-04: Pennsylvania Western District US Attorney Mary Buchanan is reportedly considering running as a Republican against Dem sophomore Jason Altmire. (Hopefully she isn’t violating the Hatch Act too much while she considers it.) Buchanan was one of the USAs who weren’t fired in the Bush-era purge (in fact, she allegedly helped consult on the list of those who were fired). State House minority whip Mike Turzai has been reputed to be the GOP’s desired recruit here, but Buchanan’s flack says that Turzai is focused on winning back GOP control of the state House in 2010 instead.

PA-11: Attorney and hedge fund manager Chris Paige is the first Republican to take on Paul Kanjorski (or Corey O’Brien, if Kanjorski goes down in the Dem primary). Still no word on whether Hazleton mayor Lou Barletta is interested in yet another whack at the race.

Supreme Courts (pdf): News from two different state supreme court races? Sure, why not. In Pennyslvania, there’s another Dane & Associates poll out, of a hotly contested 2010 race for a state supreme court seat; Democrat Jack Panella leads Republican Joan Orie Melvin 38-35. Also, in Texas, Democrat Bill Moody, who came close to winning a seat in 2006 (better than any other Dem statewide candidate that year), will try again in 2010, and he has an interesting new campaign gimmick: he’s going to tour the state in a big orange blimp.

IA-05, IA-01: King and Braley draw challengers

For those keeping track of House incumbents without declared challengers, it’s time to cross IA-01 and IA-05 off your list.

I learned from Sioux City Journal columnist Bret Hayworth that a Democrat has already filed Federal Election Commission paperwork to run against Representative Steve King in Iowa’s fifth Congressional district:

Mike Denklau has eyed the possibility of running in the strong Republican district since early 2009, and after traveling western Iowa recently he decided to go all-in.

On Oct. 15, Denklau will announce his candidacy 55 weeks out from the election in stops here in Sioux City, Council Bluffs and Des Moines. Denklau will turn 27 next month – he was raised in Blue Grass near Davenport and graduated from the University of Iowa with majors in political science and finance. He worked in New York for two banking firms through June 2009, including Lehman Brothers, until moving to Council Bluffs recently.

Hayworth notes that it’s not clear whether Rob Hubler, King’s 2008 opponent, will run again. Although Democrats cannot realistically hope to defeat King in a district with a partisan voter index of R+9, an energetic challenger may help drive up Democratic turnout across the district. There will be several competitive state legislative races in the 32 counties that make up IA-05.

Meanwhile, Craig Robinson reports at The Iowa Republican that Rod Blum of Dubuque is ready to challenge Representative Bruce Braley in the first Congressional district.

Blum has strong eastern Iowa roots. He graduated from Dubuque Senior High School in 1973, earned a bachelor’s degree from Loras College (Finance) in 1977, and received a Masters in Business Administration from Dubuque University in 1989. In 1989, Blum was one of the initial employees of Dubuque-based Eagle Point Software. In just five years, Eagle Point Software went public on NASDAQ and had 325 employees. In 2000, Digital Canal was created as a result of a leveraged buyout of Eagle Point Software. Digital Canal is a leading provider of home building and structural engineering software. Blum was also named the Iowa Entrepreneur of the Year in 1994.

While Blum has never run for elected office before, he has been making his political views known in eastern Iowa since 2001 as the Dubuque Telegraph Herald’s conservative columnist. Blum’s writings for the Telegraph Herald will be helpful for a couple of reasons. First, having a regular column in the local newspaper helps build credibility and name ID. Secondly, writing a political column means that he has well thought out positions on many of the issues facing our country today, something many first time candidates lack.

He’ll need more than conservative ideology and name ID in the Dubuque area to unseat Braley. Robinson notes that Republican Jim Nussle represented IA-01 before the 2006 election, but Nussle’s position as chairman of a House budget subcommittee helped him hang on in a Democratic-leaning district. That’s different from a Republican challenger trying to swim against the tide in a district with a partisan voting index of D+5. Republicans currently hold only two House disticts with that much of a Democratic lean: Delaware’s at-large seat, which the GOP will lose when Mike Castle runs for U.S. Senate next year, and Louisiana’s second district, which was a fluke in 2008 because of the Democratic incumbent’s apparent corruption.

Braley is a rising star and effective legislator with a spot on the House Energy and Commerce Committee. He won re-election with more than 64 percent of the vote in 2008. Even if 2010 turns out to be a Republican year, Braley’s not losing in a district with 35,000 more registered Democrats than Republicans.

To my knowledge, Republican Tom Latham (IA-04) is Iowa’s only incumbent in Congress with no likely challenger yet. Steve Rathje and probably Mariannette Miller-Meeks will run against Dave Loebsack in IA-02, while Dave Funk and Pat Bertroche are challenging Leonard Boswell in IA-03. I don’t expect either of those districts to be competitive in 2010.