Examining Turn-Out by Race in California

California constitutes one of the most diverse states in the United States. Here is how the Census estimates its population composition:

California’s   Ethnic Composition
Asian 12.7%
Black 6.6%
Hispanic 37.0%
Mixed 2.6%
Native   American 1.2%
Pacific   Islander 0.4%
White 41.7%

(Note that the numbers do not add up to 100, due to the way the Census tracks ethnicity.)

The people who actually vote in California, however, do not reflect this composition.

More below.

California’s electorate in the 2008 presidential election is quite different from its actual ethnic composition:

2008   Electorate: Exit Polls
Asian 6%
Black 10%
Hispanic 18%
Other 3%
White 63%

These numbers were taken from exit polls – and one should be warned that exit polls are very, very inaccurate. The numbers above should not be taken for the truth, but rather as a rough approximation of it.

Nevertheless, one can take something out of the exit polls: blacks and whites punched far above their demographic weight, while Asians and Hispanics punched far below theirs. This pattern isn’t so much a racial one as much as an immigrant versus non-immigrant one.

Since blacks and whites are mainly non-immigrant communities, they vote more often than immigrant communities. Blacks and whites thus are overrepresented in the electorate. There was little racial divide between black and white turn-out, which is quite remarkable, given the lower socioeconomic status of blacks. All in all the percentage of California’s 2008 electorate was about 50% more black and white than California’s overall population.

Hispanics are the ones hurt most by this. The difference between the Hispanic portion of the electorate and the Hispanic portion of the overall population is quite striking: the electorate is just half as Hispanic as the population. Most of this is attributable to the legal status of many Hispanic immigrants, the relative youth of the Hispanic population, the lower socioeconomic status of Hispanics, and the immigrant-heavy nature Hispanic community (this is different from the first factor in that immigrants are inherently less likely to vote even if they are citizens).

It is not Hispanics, however, who are least likely to vote: it is Asians. There are several similarities and differences between the two groups. Unlike Hispanics, the Asian population is not skewed downwards, and Asians generally have a high socioeconomic status. On the other hand, Asians are much more of an immigrant community than Hispanics: a remarkable four out of five adult Asians in California constituted immigrants, according to a 2002 study. Only 59% of adult Asians were citizens (who can vote), according to the study.

The low voting rates of Hispanics and Asians naturally reduce their political power. Hispanics, at around one-fifth of the California electorate, are influential – but imagine how much more influential the Hispanic vote would be if they voted their numbers. As for Asians, their low turn-out makes their community almost a non-factor in California politics.

This will probably change, of course. A century ago one could have written the exact same words about another immigrant-heavy group that did not vote: Irish-Americans.

–Inoljt, http://mypolitikal.com/
The White Vote in Washington D.C.

By: Inoljt, http://mypolitikal.com/

When Republicans attack American liberalism, they prefer to use San Francisco as a punch bag. Indeed, San Francisco does constitute quite a liberal city; in the 2008 presidential election, 84.0% of the good folk of San Francisco preferred Democratic candidate Barack Obama over Senator John McCain.

San Francisco was far from the most Democratic-voting city in 2008, however. Mr. Obama’s percentage total was greater in several places; Washington D.C., for instance, pummeled San Francisco in the contest of who votes more loyally Democratic. In the capital of America, an astonishing 92.5% of voters supported the Illinois senator.

Most people who will hear this will probably start thinking something quite politically incorrect. The line of thought goes that “Washington is full of black people, all the blacks voted for Obama, so of course it voted that way.”

This is half true and half false.

More below.

It is true that the capital’s black population voted uniformly for the president – something that occurs with almost all Democratic candidates. The census, however, estimates that blacks compose only 54.4% of Washington’s overall population. This may surprise a lot of Americans who think the city is all-black. Even if every single black person in Washington voted Democratic, Mr. Obama still is quite a ways off from 92.5%.

Let’s look at another place with similar demographics to Washington D.C. – Montgomery County, Alabama where the Civil Rights movement started. Like Washington, Montgomery’s population is 52.9% black. Unlike Washington (where Mr. Obama won 92.5% of the vote), however, Montgomery only gave Mr. Obama 59.3% of the vote. Blacks are not responsible for this 33% difference; there is not much variation in how African-Americans voted in both cities.

The trick is with the white population. According to exit polls, Mr. Obama won 10% of whites in the state of Alabama. The results from Montgomery County reflect this low level of support.

In Washington, however, Mr. Obama won an astounding 86% of the white vote, according to exit polls. This is how the Illinois senator was able to get up to 92.5% of the vote in Washington, which is about one-third white. If white people alone had voted in Washington, Mr. Obama would still have done better than he did in San Francisco.

It would be quite interesting to explore why whites in the capital vote so loyally Democratic. Washington, of course, constitutes the center of the federal government; it would not be unusual for much of the white population to work for the government and thus vote more Democratic. But what type of work do they do – do they deliver the mail for the Post Office, or do they run the Post Office? Is Washington’s white population composed of  mostly working-class, union-type Democrats? Or is it composed mostly of  “wine-track” liberals, the type that populate cities like San  Francisco and Seattle?

Whatever the answer, this statistic remains one of the most curious and interesting ones to come out of the 2008 presidential election. Indeed, until now this blogger  was unaware that such one-sided Democratic voting patterns existed among  whites anywhere in the nation. To get 86% of the vote anywhere is a burdensome feat. For a Democrat to get that support from whites is something that one does not see often in the United States.

Comparing the White Vote and the General Vote

By: Inoljt, http://mypolitikal.com/

On November 4, 2008 Senator Barack Obama was elected president, winning a substantial margin over Republican candidate John McCain. In the popular vote, Mr. Obama won 52.9% of the electorate to Mr. McCain’s 45.7%; he thus took a 7.2% margin.

Mr. Obama, however, did not do so well with white, non-Hispanic voters. According to exit polls, the newly elected president lost whites by double-digits; taking 43% of the white vote to Mr. McCain’s 55% support.

This is not anything new; for decades now, the Democratic Party has been losing the white vote. Indeed, the last time a Democratic presidential candidate actually won whites was in 1964, when Texan Lyndon Johnson delivered a landslide pummeling to Senator Barry Goldwater.

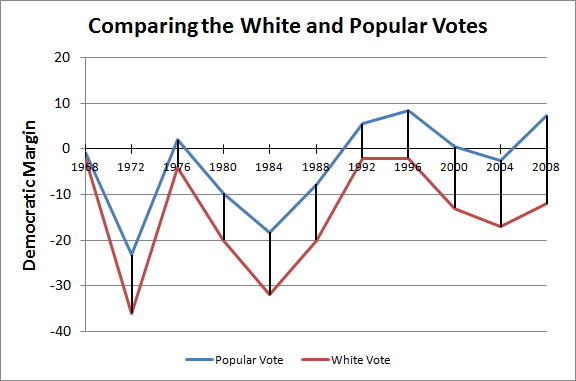
Ever since then Democrats have been in a bad way with whites:

Comparing the White Vote and the General Vote

More below.

This graph compares the Democratic share of the white vote (as found by exit polls) to their share of the total vote. The top line indicates the former; the bottom indicates the latter. The three Democrats who did relatively well with whites were Democratic  candidates Hubert Humphrey, Jimmy Carter, and Bill Clinton.

As the graph shows, the white vote generally follows the popular vote (not a surprise, given that it composes the majority of the popular vote). Nevertheless the gap between the two has been steadily widening; in the past three elections, Democrats lost whites by double-digits yet still remained competitive in the general election.

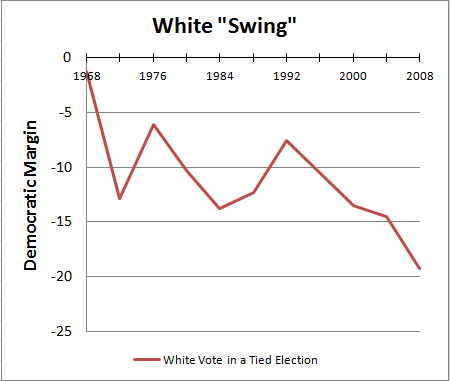
This trend can be more accurately pictured by graphing the relative “swing” of the white vote compared to the overall election:

Comparing the White Vote and the General Vote

This measurement indicates how the white electorate would have voted if an election had been tied; it is more useful than looking at the absolute vote. A candidate who lost the white vote by 40%, for instance, would generally be said to have done poorly with whites. If, however, we found out that the candidate had done even worse with the general electorate – say, losing by 45% – one could very well say that he or she did relatively well with whites.

In the last presidential election, for instance, Mr. Obama lost whites by twelve points, according to exit polls. However, Mr. Obama also won the overall electorate by seven points. Whites were therefore nineteen points more Republican than the average voter – as the graph indicates. In a hypothetically tied election, they would have voted Republican by nineteen percentage points (or a Democratic margin of negative nineteen points, according to the graph.)

This graph paints a slightly different picture of Democratic performances amongst whites. The adjustment makes Mr. Clinton and Mr. Obama look less impressive (Mr. Obama, especially), while making Mr. Humphrey look really good. To be fair, the 2008 election probably constitutes more of an outlier than the start of a trend for Democrats, given Mr. Obama’s unique strength amongst minorities. Expect the white “swing” to return to a more Kerryesque point in 2016.

Finally, one must note the degree to which the white vote is influenced by patterns in the South. Mr. Obama took less than 30% of the white vote in seven states: Alabama, Georgia, Louisiana, Mississippi, Oklahoma, South Carolina, and Texas. This low degree of white support is not unusual for Democrats. One-sided, racialized voting patterns in this region undoubtedly skew the overall white vote to be more Republican than would otherwise be the case.

P.S. For those interested, here is a table of the white vote over time, according to exit polls.