Macro vs. Micro – 10 “weak” candidates that won in wave elections

One of the things that has come up in this election is whether the macro vs. micro climate, and which is better in terms of determining the outcome of this year’s election. Simply put, Republicans have nominated some pretty bad candidates (Angle, Paul, and possibly Buck, although I think the verdict might still be out on the latter) who would be unelectable in a different year.

Anyway, I thought it would be a fun exercise to put together a list of 10 candidates who were preceived as weak choices for their respective parties at the time, but went on to win in “wave” elections. Feel free to disagree or nominate your own choices below.

Gary Hart (D) vs. Peter Dominick (R), CO-SE, 1974

Peter Dominick was a two term Senator who had served only two years before as the chairman of the NRSC. His opponent was the upstart campaign manager of George McGovern’s disasterous bid for the presidency, which lost the state of Colorado by a substantial margin. But Hart took advantage of the post-Watergate environment to crush Dominick 57.2%-39.5%, beginning a political career that would end in Monkey Business thirteen years later

Alfonse D’Amato (R) vs. Elizabeth Holtzman (D) and Jacob Javitz (I), NY-SE, 1980

D’Amato, the presiding supervisor of the town of Hempstead was given little chance against longtime New York Senator Jacob Javitz, but taking advantage of Javitz’s illness and the conservative tide in 1980, he upset Javitz in the primary. Javitz decided to run as an independent in the general election, but instead of taking moderate Republican votes away from D’Amato he split the liberal and moderate base with Elizabeth Holtzman, who was vying to be the first woman Senator from NY, and in the year of Reagan’s first landslide D’Amato won a close race.

John LeBoutillier (R) vs. Lester Wolff (D), NY-6th District, 1980

Another New York race. LeBoutillier was the original wingnut, a 27-year old rabidly conservative Republican who beat a 16-year incumbent to win election to this Long Island district in this very Republican year. He only lasted one term before being ousted. He’s currently a columnist for NewsMax.com

Jesse Helms (R) vs. Jim Hunt (D), NC-SE, 1984

The always very controversial Helms was considered dead meat against North Carolina’s very popular Democratic governor Jim Hunt. Up until the last couple weeks of the campaign, Hunt was still the favorite in what was then considered one of the nastiest campaigns ever run in American history. But Helms rode the Reagan landslide win that year to hang on to his Senate seat.

Kent Conrad (D) vs. Mark Andrews (R), ND-SE, 1986

Andrews was a longtime North Dakota congressman who joined the Senate in 1980, receiving 70 percent of the vote. He looked so unbeatable for reelection that the state’s Democratic congressman, Byron Dorgan, took a pass. But North Dakota tax commissioner Kent Conrad stepped up to the race, and in a bad year for farm-state Republicans, beat Andrews in a suprise upset

Steve Stockman (R) vs. Jack Brooks (D), TX-9th District, 1994

Jack Brooks had been a congressman for 40 years and was chairman of the powerful House Judiciary Committee. Stockman was pretty much of a nobody who held no political office, although he had run against Brooks once before, in 1992, losing pretty badly. However, Brooks sponsorship of a crime bill opposed by the NRA along with being in the Republican wave year of 1994 doomed Brooks. Stockman, who was dogged by controversy throughout his term, lost to Nick Lampson in 1996.

Rod Grams (R) vs. Anne Wynia (D), MN-SE, 1994.

Grams was a one term congressman and former broadcaster who is likely the most conservative senator ever to be elected from Minnesota. Wynia was a well respected state legislator who was the benificiary of a campiagn by prominent Minnesota DFLers to elect a woman to the Senate. But, in the year of Republican sweep, Grams beat her in a very close race. He lost to Mark Dayton six years later.

Bill Frist (R) vs Jim Sasser (D), TN-SE, 1994

One more from the 1994 election debacle. Bill Frist was a prominent Tennessee physician and major stockholder in his family’s health care company. Jim Sasser was on the short list to succeed George Mitchell as Senate Majority Leader, and he was from a state the Clinton-Gore ticket had won two years before. But Tennessee took on a decidedly conservative bent in 1994, and Sasser lost by 13 points

George Allen (R) v. Jim Webb (D), VA-SE, 2006

In this case, it may not be that Jim Webb was neccesarily a weak candidate, but George Allen was perceived as so strong. A popular former Virgina governor and future Presidential candidate, Allen was viewed as the prohibitive favorite to win reelection, but in an upset prompted by his own stumbles and a good campaign run by Webb, he lost in a very close race.

Kay Hagan (D) vs. Elizabeth Dole (R), NC-SE, 2008

We all are familiar with this recent one, so no need to rehash it. Suffice it to say that no one would have predicted two years before an obscure state legislator would beat the head of the NRSC so badly.  
From 2004 to 2008: The impact on the House and Senate

A lot has been made about the increase in electoral votes earned by Barack Obama from John Kerry’s totals.  Obama’s number while a significant increase is slightly lower than what Bill Clinton won in both 1992 (370 EV) and 1996 (379 EV).  Clinton started from a far lower base (Michael Dukakis’ losing total in 1988).  The real improvement for the Democratic Party came in the House and Senate results.  In 1992, Clinton may have won big but Democrats won 9 fewer House seats than in 1990 and 2 fewer than in 1988; Senate seats increased by 1 over the few year time slot.

By contrast, the final number of Democratic House seats is likely to be 258 or 259 (per Chris Bowers).  The Senate total ios likely to be 58 or 59.  That’s a gain of 56 or 57 House seats and 14 or 15 Senate seats from 2004 totals.

Regional and statewide totals tell the story best.

The Northeast is the most Democratic part of the country.  Both John Kerry and Barack Obama won all 117 electoral votes from this region.  In the interim, however, the Republicans moved from an important minority at the federal level to an insignificant one.  In 2004, House seats ran 56 D,35R, and 1 Democratic leaning indy (Bernie Sanders).  Republicans lost nearly a third of their seats in 2006 falling to 24 and repeated the feat by falling to 17 in 2008.  Over the two cycles, they lost more than half of their House seats in the region (18 seats).  Or if you prefer percentages, the GOP dropped from 38% to 18.5% of Northeast House seats. That included a loss of 6 seats in NY, 5 in PA, all 3 GOP in CT and all 2 GOP in NH.  At leasat half of the remaining GOP seat are still vulnerable.  Senate seats fell from 7 of 22 to 4 of 22 (also 18%).  Two of the four are up in 2010 and one will be represented by an 80 year old probably facing a stiff primary challenge.  The other (Judd Gregg, NH) is also on the chopping block.

The Great Lakes states are six industrial (and to a lesser extent farm) states that all touch on the Great Lakes.  Four of the six went to both Kerry and Gore.  Obama added IN and OH to win all 89 electoral votes.  Over the four years, the region became substantially more Democratic at the House level going from a 32-45 Republican edge to a 45-32 Democratic edge (if MaryJo Kilroy wins OH-15).  Democrats picked up one Senate seat in MO on 2006 and may pick up another in MN in 2008.

Gerrrymanders in Il, OH, and MI were overcome to and Democrats now lead IL 12-7, OH 10-8 (or 9-9) and MI 8-7.  Both WI and MN went from 4-4 splits to a 5-3 D lead and IN zoomed from 2-7 to 5-4.

The Mountain region went from a Republican 20-8 lead in 2004 to a solid 17-11 D edge.  Democrats picked up 2 seats in CO, 3 in AZ, 2 in NMand single seats in Nevada and Idaho.  They also gained Senate seats in MT (2006) and CO aand NM (2008).

The south didn’t turn blue but it did become considerably less red.  Here three seats are still listed as unsettled but VA-5 seems clearly ours and LA-2 (New Orleans, Dollar Bill Jefferson) is also pretty clear.  LA-4 (Carmouche) is an open seat where two conflicting polls would seem to indicate that (overall we have a single digit lead.  If it’s ours, the 52-88 chasm of 2004 is down to 65-75 with the bulk of the problem being Texas (20-12 in favor of the GOP).  VA and NC not only voted for Obama but elected majority D House delegations (6-5 in VA; 8-5 in NC).  FL went from an awful 18-7 GOP edge to a respectable 15-10.  Remember when we used to wish for a delegation that reflected the state (13-12 or 14-11 at worst).  Well, barring Mahoney’s stupidity we would have had 14-11.  Democrats also picked up 3 Senate seats here with two in VA and one in NC.  At the least, three GOPers look endangered as the Senate cycle ends in 2010: Jim Bunning in KY, Richard Burr in NC, and Mel Martinez in FL.

Obama won 3 southern states compared to 6 for Clinton in both 1992 and 1996 and none for Gore and Kerry.

That leaves two regions that went pretty much unchanged.  Democrats picked up only one seat in 2006 and probably none in 2008 in the Pacific (CA, OR, WA, AK, HI)Pretty bad  They did add 2 Senate seats this year (OR, AK).  CA Republicans scored under 60% in 11 of 19 wins in 2008 (I’m giving them CA-4).

The Plains remains a Republican stronghold but it;s tiny and not gtowing.  Democrats gained two House seats in Iowa and one in Kansas in 2006 but gave back the Kansas seat this year and fell by 8,000 votes in MO-9 and 12,000 in NE-2 (carried by Obama by 3,000 votes so there must be at least 15,000 Obama-Terry voters).  They gained only one Senate seat in MO in 2006.

The edge in the House is still a hefty 11-17 rather than the 9-19 margin of 2004.

Do Primaries Help or Hurt in the General? : A Look at 51 House races from 2006

The general belief seems to be that it is important to “clear the field” in primaries to get a winning hand in the fall general election.  The belief is founded on a number of factors.  Many interest groups will not back a candidate with a primary election opponent.  Primary election campaigns can be costly and challengers generally have less money to spend than incumbents.  Anecdotal evidence points to a number of campaigns easch cycle where a strong primary is followed by disappointing results in the fall.

I decided to test this thesis by looking at election results for all 31 Democratic pickups in the House during the 2006 cycle (including Peter Welch as a pickup in Vermont) and comparing the results to close losses.  The close losses were not systenmatic but I looked at 20 races that fit the bill.

Overall, 14 of the 31 pickups (45%) were preceded by primary elections, a higher than expected number.  Although some of these were blowouts, a surprising number were close and in many cases surprise winners emerged despite less money.  As a comparison, among the 20 close but losing elections only seven (35%) were preceded by primaries and only one of those was close: the Tammy Duckworth-Christine Cegelis- Scott duel in IL-6.

Adding fuel to the fire, IIRC, all 3 of our special election vitories were preceded by primaries.  Bill Foster’s win in IL-14 (at least for November) against John Laesch, was a much tougher battle than his win against Jim Oberweis.

A listing and some commentary follow with emphasis on upsets and close races.

The only primary that mattered in the New England House races mattered a good deal.  Carol Shea-Porter surprised Jim Craig in a multi-candidate field and then won a close election to the House with just $290,000 in campaign expenditures (being outspent nearly 4:1). Nobody knows if the better known, more establishment Craig would have pulled it off.  Shea-Porter depended mostly on volunteers and a lot of shoe leather, particularly her own.  Her personal efforts in Manchester vs. Craig going door to door and bar to bar certainly paid off in both the general election and in the primary, itself.

NH-2 (Hodes) and the CT races (Joe Courtney, CT-2; Chris Murphy, CT-5, and Diane Farrell, CT-4 were all uncontested.

New York had six major races with three pickups and three close loses.  Only one had a primary and that produced what was seeen on the blogs as an upset.  In NY-19, John Hall won rather easily in a multi-candidate field converting his years as a local official and rock star status (singer with the band Orleans famous for “You’re the One”) into a comfortable victory over the much better funded Judy Aydelott and others (I remember Ben Shuldiner).  NY-20(Kirsten Gillibrand),24 (Michael Arcuri), 25 (Dan Maffei),26 (Jack Davis), and 29 (Eric Massa) were uncontested.  Gillibrand and Arcuri won in the fall.

PA produced four wins and one close loss.  Two of the four winners (Jason Altmire and Patrick Murphy) faced primary challengers.  Altmire got a fairly sturdy challenge besting Georgia Berner 55% to 45% en route to dethroning Melissa Hart in PA-4.  Murphy had an easier time over Andrew Warren 65% to 35%.  Lois Murphy had a token challenge against Anrew Leibowitz (76% to 24%)  prior to losing versus Jim Gerlach in PA-6.

Elsewhere in the Northeast, Linda Stender had no primary but lost closely to Mikrke Ferguson in NJ-7.  Peter Welch, a general election winner in VT also faced no primary.

Lest we forget, in OH-18 Zach Space coasted to an easy win in November but many thought Joe Sulzer would be the likely nominee.  Space won in a multi candidate field.  Only one of three close losers in OH faced a primary (Vic Wulsin who won in a multi candidate field including Thor Jacobs and Jim Parker).  John Cranley and Mary Jo Kilroy had an open path to the general election.

Both Joe Donnelly and Baron Hill faced easy primaries and Brad Ellsworth went unopposed among three Indiana pickups.  Tim Walz in Minnesota was also unopposed but Steve Kagen had to claw his way through a multi-candidate field  including Wall and Nussbaum.  I remember a lot of people touting Nussbaum.

Tammy Duckworth spent a bundle to secure the Democratic nomination by just 1,000 votes over Christine Cegelis.  And provided a disappointing loss in November.  Tim Walz in MN-1 had a clear field but Steve Kagen had to beat a multi-candidate field before he clould allegedly tell Karl Rove he was Dr. Multi-Millionaire.

John Yarmuth got 53% in a primary vs. Andrew Horne and others before taking on Anne Northrup in KY-3.  Heath Shuler coasted through his primary but Tim Mahoney and Ron Klein in Florida got free rides.  Close losers in the south also had to earn their way in with larry Kissell having an easy time but Christine Jennings (61%) drawing 2004 nominee Jan Schneider (39%) in FL-13.

In the Plains, Bruce Braley had a brutal three way battle against Dickinson and Gluba but Dave Loebsack had no opponent.  Nancy Boyda wa unopposed. Nick Lampson and Ciro Rodriguez were OK (although this was Ciro’s second go around in the cycle).

Out west, winner Harry Mitchell was unopposed butGabrielle Giffords won 54% in a multi-candidate fieldand Jerry McNerney had to upset the establishment fave, Steve Flson, befoe taking down Richard Pombo in the general.  Ed Perlmutter also triumphed against two other strong candidates particularly Peggy Lamm in CO.

Western close losers Gary Trauner, Darcy Burner and Angie Pacccione were unopposed and Tessa Hafen won easily in NV with 58% in a multi-candidate field.

In short, the winners in pickup races were more likely to face a challenge, more likely to face a serious challenge and were forced to pull upsets against better funded opponents in a number of races.  You would be hard pessed to make an argument for clearing the field based on these results.

Nasty blood fueds like Cegelis vs. Duckworth however were damaging and they should be avoided.

In the South, John Yarmuth (KY-3)


A Graphic Anatomy of Victory: Ohio (w/maps)

This is the fifth in a series of diaries depicting the Democratic victory in this year’s midterm elections.

Already covered have been New England, NY, NJ/MD/DE, and Pennsylvania.

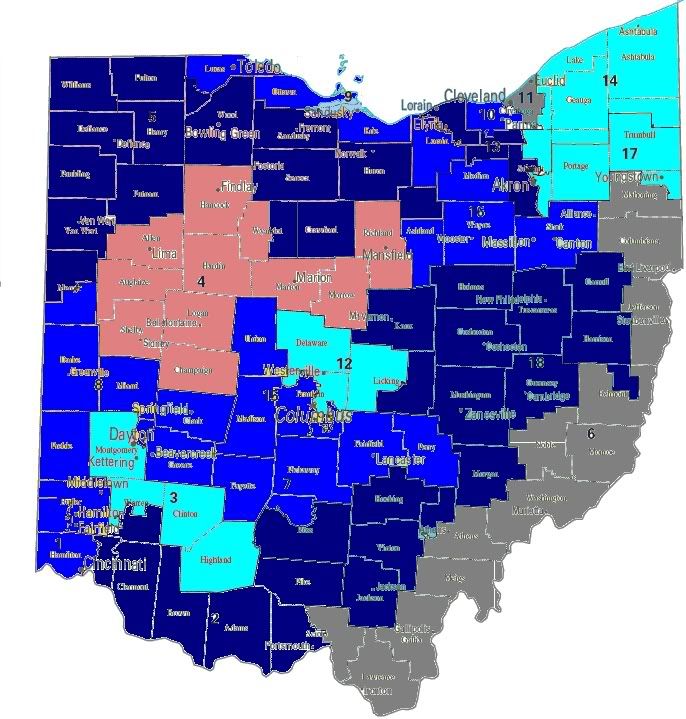
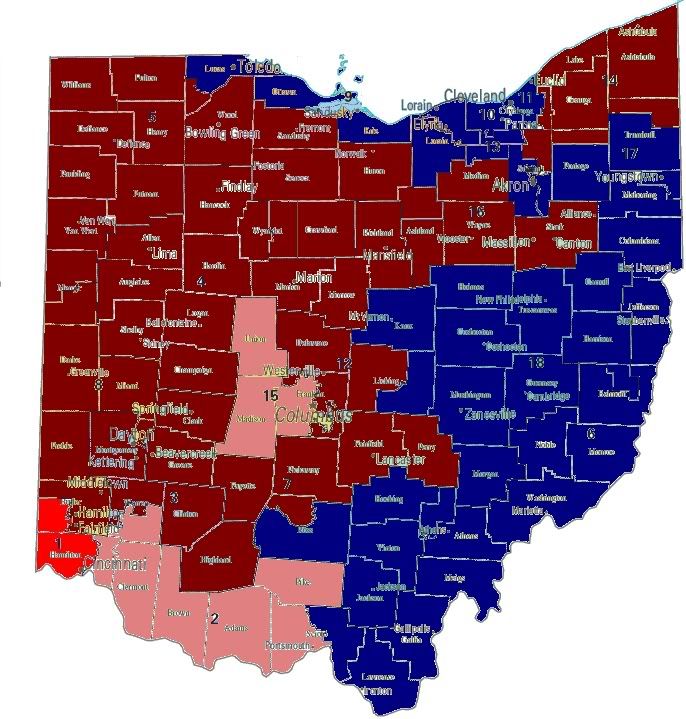
Today’s diary will focus on the Buckeye state, where we find that there must be something in the water, any water.  We know that the coasts lean blue, but this is also increasingly true of Ohio River Valley.First up are the seat control charts, and yes grey means that the race is still in dispute not that some third party won.

Of   3,757,640  votes cast in 2006 US House races in Ohio,    1,970,127 (52.4%) were cast for Democrats, while 1,779,461 (47.4%) were cast for Republicans. While the only  certified Democratic pickup is in the OH-18, two other races the OH-15 and OH-02 are both still in dispute, Democrats now hold 7 (38.9%) of Ohio’s 18 Congressional districts.  

While it is neccessary to remember that seats are apportioned according to population not voter registration, and that differing turnouts mean that state totals weigh some districts more heavily than others because of these differences the degree of gerrymandering is apparent in the disparity between vote totals and the party control of seats.  The problem is that the composition of Ohio’s House of Representatives delegation isn’t very representative of the voting intentions.  

If Ohio’s House delegation were apportioned by proportional representation, Democrats would control 9 of Ohio’s 18 House seats.  Dependent on the outcome of recounts in the OH-15 and OH-02, this may still come to pass.  I’d like to point out something I found highly disturbing when researching this diary.  On the election results page of the Ohio Secretary of State page, provisional ballot totals and percentages of provisional counted as valid are given for 2004, while the 2006 results give an aggregate figure for provisionals and absentee ballots.  

I find this highly suspicous, and this technicality has the stink of bullshit upon it, because it could serve to obscure the true quantity of provisionals ballots in the two contested districts.  And this could serve to obscure evidence of voter suppression in  the application of Ohio’s new voter ID law.  The Secretary of State’s office needs to release disaggregated figures listing the number of provisional ballots seperate from absentee ballots.

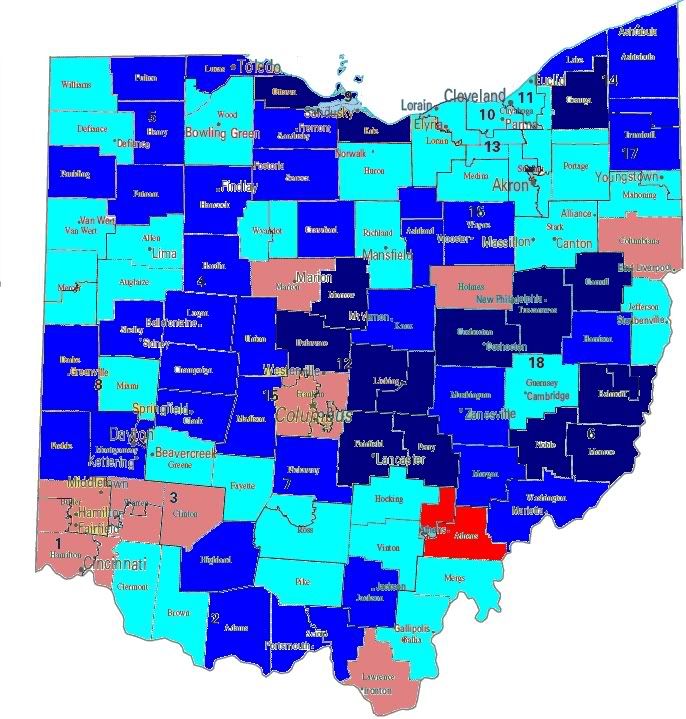
Voter Turnout by County, Ohio 2006 General

The darkest shade of red indicates a turnout of less than 40%, medium red 40-45%, pink 45-50%, light blue 50-55%, medium blue 55-60%, dark blue more than 60%.

Looking at our only confirmed victory, the OH-18, we can see  a general trend, areas with the highest turnout (the Toledo area and SE Ohio) tend to be the areas where Democrats won, while lowest turnout was reported in the Cincinnati area where Republicans narrowly won.  The Democratic victory in the OH-18 by Democrat Zack Space represents a real blow to Republicans.  In 2006, Space took 62% of the district vote for a 23.9% margin over Republican Joy Padgett.  This represents a 28.1% improvement the 33.9% 2004 Democratic vote share. This is Bob Ney’s old seat, this is what happens when the incumbent congressman is serving prison time. This is what a wave looks like. Bye-bye Republicans.

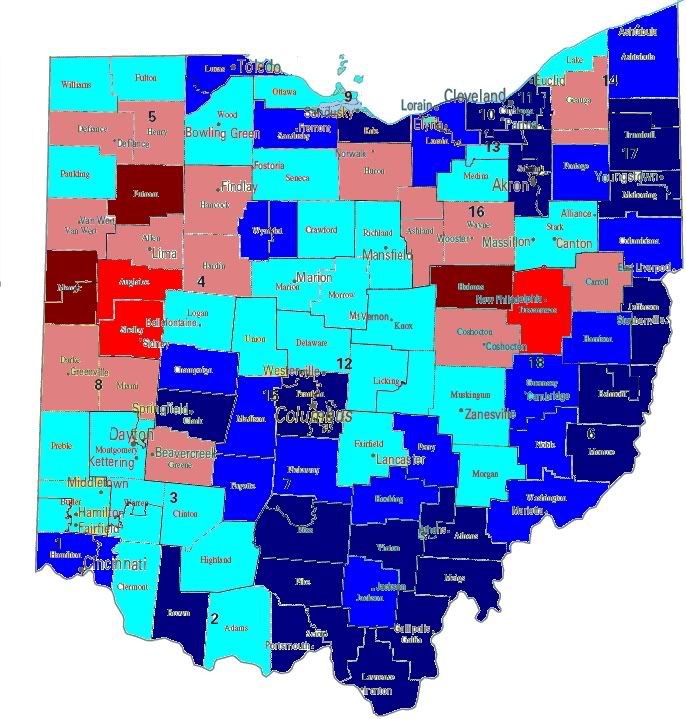
The following map shows Democratic 2006 gains over their 2004 Democratic performance in the district (in % terms), improvements of less than 5% will be displayed in light blue, under 10% in the darker blue, and over 10% in the darkest blue.  Republican gains will be shown in the same manner, with the light red signifying a gain of less than 5% and so on. Races that were not contested in either of the years will be displayed in gray.

Looking more closely at the margin of victory in 2006 races,      Democratic defends and pickup opportunities emerge, the following map displays the margin of victory in 2006 races.  The deepest blue represents and Democratic margin of victory over 10%, the medium color represent more than 5%, while the lightest blue indicates that the Democratic candidate won by less than 5%.  Corresponding measures of Republican victory margins display progressively darker shades of red at the same intervals.

What emerges is a map to guide our 2008 strategy. In this series I have created a race tier system that is I will explain in the next few sentences.Tier 0 races are those where the Democratic candidate won by a margin of less than 5%, the presumption being that incumbency grants an advantage of 5-10% that with the fundraising advantage that comes with holding office should be sufficient for these candidates to defend their seats without funding from the party.  The assumption that incumbency gives a 5-10% advantage drives the classification of the pickup categories.  Tier 1 races are those where the incumbent won by less than 5% in 2006, while tier 2 races are those where Republicans won by less than 10%.  It’s really quite simple.

Tier 0

Race      D%      R%     Margin    2006 D Cand.

No races meet the criteria for this tier.

Tier 1

Race    D%    R%    Margin    2006 D Cand.

OH-2    49.4  50.6  1.3       Victoria Wulsin

OH-15   49.1  50.9  1.8       Mary Jo Kilroy

Tier 2

Race    D%    R%    Margin    2006 D Cand.

OH-01   47.2  52.8  5.6       John Cranley

One final thing that I’d like to point out before we head to the running totals for 2008 tiers is the result of Ohio’s minimum wage ballot measure. Of 3,607,184 votes cast, 2,025,997 (56.2%) voted for the measure, while 1,581,187 (43.8%) voted against the measure.  Overall, support was strongest where Democrats won in the Ohio River Valley and on the Lake Erie coast. The yes vote was the highest in Lawrence county in SE Ohio where 71.2% voted yes, and lowest in central Ohio’s Holmes county where only 31.2% voted for the minimum wage measure.

I’ve created chart below to keep a running total of races that I’ve classifed in each tier for 2008.

Tier 0

CT-02, NY-19, NH-1

Tier 1

CT-04, NJ-07, NY-25, NY-26, NY-29, OH-2, OH-15, PA-06,

Tier 2

OH-01, PA-15

States Covered

CT, MA, MD,ME, NH, NJ, NY, OH,PA, RI, VT

A Graphic Anatomy of Victory: Pennsylvania (w/maps)

This is the fourth in a series of diaries epicting the Democratic victory in this year’s midterm elections. Other diaries in this series can be seen here.

Already covered have been New England, NY, NJ, MD, and DE.

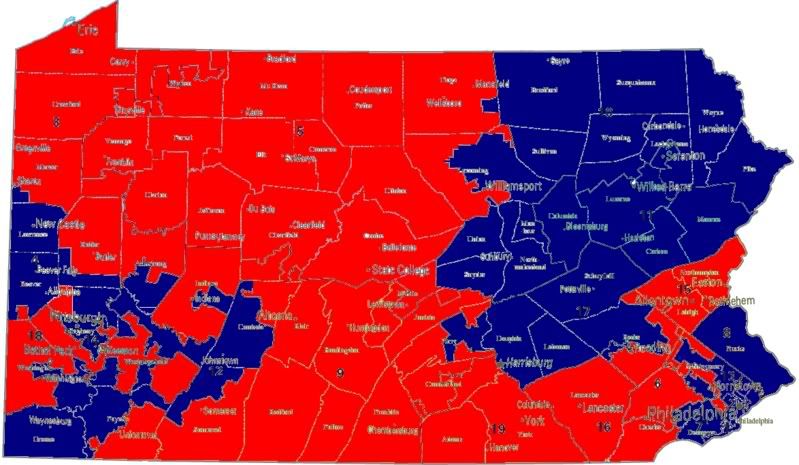
Today’s diary will focus on the Keystone state, the site of great hopes, and as today’s diary will demonstrate a great truth.  Pennsylvania really is Philadelphia and Pittsburgh with Alabama in between.  First up are the seat control charts.

2004

2006

Of  3,938,341  votes cast in 2006 US House races in Pennsylvania,   2,190,947 (55.6%) were cast for Democrats, while  1,698,641
(43.1%) were cast for Republicans.

Democrats defeated Republican incumbents in the PA-04,PA-07, PA-08, and PA-10.  

The race I enjoyed the most was the PA-10 (NE Pennsylvania), where poltical newcomer (and politcal scientist) Christopher Carney defeated incumbent Republican Don Sherwood by margin of 12,538 votes (6.1%).  The reason I am so excited by this race is because the Democratic party didn’t even run a candidate against Republicans anywhere can be taken down, we just need someone there to push.

In the PA-07 (SW Philadelphia suburbs), Democrat Joes Sestak defeated ethically challenged Republican incumbent Curt Weldon by a margin of 33,291 votes (12.7%) after revelations of suspicious dealings with Russian “businessmen”. Coming in at 56.4%, this was a 16 point improvement of the 2004 Democratic performance at 40.3%.

In the PA-08 (Bucks County, NE of Philadelphia), Democrat Patrick Murphy defeated Republican incumbent Michael Fitzgerald by a narrow margin of 1521 votes (0.6%).  Coming in at 50.3% this was a 7 point improvement over the 2004 performace at 43.3%.

In PA-04 (NW of Pittsburgh), Democrat Jason Altmire defated Republican incument Melissa Hart by a margin of 9,280 votes (3.9%).  Coming in at 51.9% this was a 16 point improvement over the 2004 performace at 35.9%.

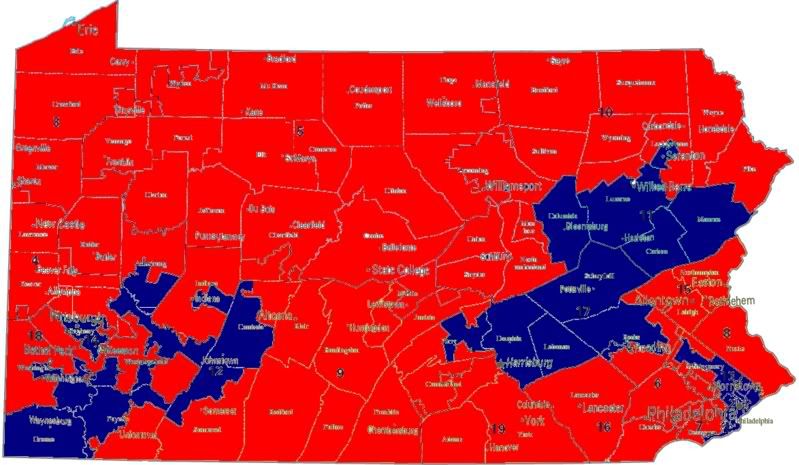
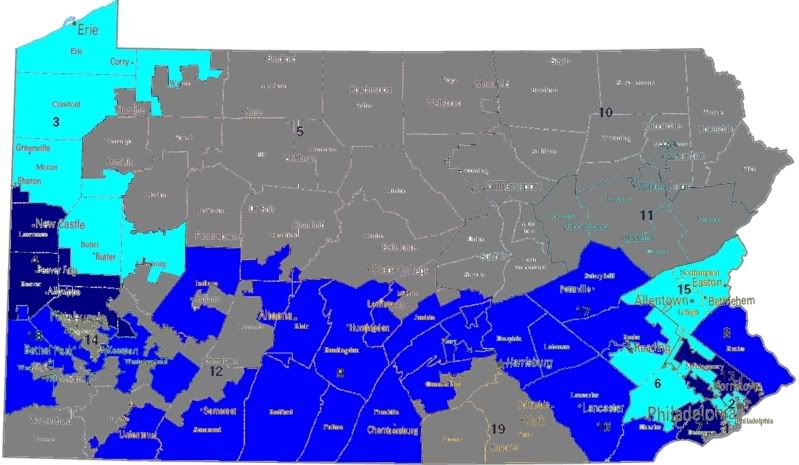
The following map shows Democratic gains over their 2004 Democratic performance in the district (in % terms), improvements of less than 5% will be displayed in light blue, under 10% in the darker blue, and over 10% in the darkest blue.  Republican gains will be shown in the same manner, with the light red signifying a gain of less than 5% and so on. Races that were contested in eith of the years will be displayed in gray.

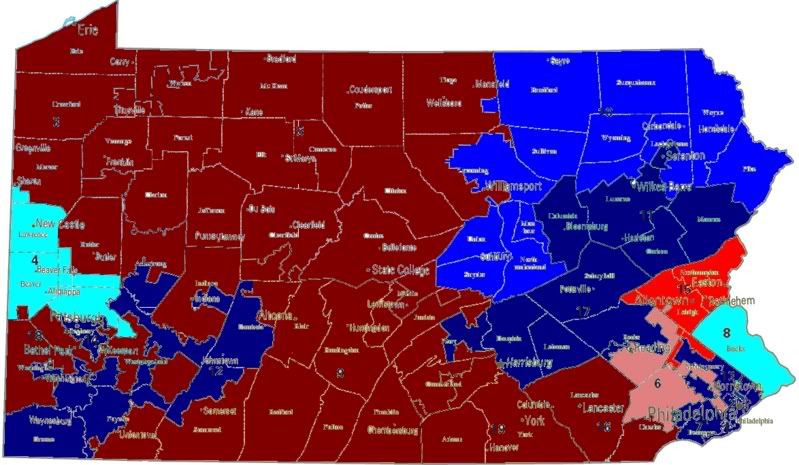
Looking more closely at the margin of victory in 2006 races,      Democratic defends and pickup opportunities emerge, the following map displays the margin of victory in 2006 races.  The deepest blue represents and Democratic margin of victory over 10%, the medium color represent more than 5%, while the lightest blue indicates that the Democratic candidate won by less than 5%.  Corresponding measures of Republican victory margins display progressively darker shades of red at the same intervals.

Wow.  Pennsylvania really is Philadephia and Pittsburgh with Alabama in between.  A really interesting take on this is would be to be to compare the margins from the US House races to the Senate race where Casey crushed Santorum. Nonetheless for House Democrats the situation in the interior of the state looks hopeless, though as the race in the PA-10 shows anything is possible.  I’m still puzzled by that one, I hope one of you Philly folks can explain what the hell happened there to me.

What emerges is a map to guide our 2008 strategy. In this series I have created a race tier system that is I will explain in the next few sentences.Tier 0 races are those where the Democratic candidate won by a margin of less than 5%, the presumption being that incumbency grants an advantage of 5-10% that with the fundraising advantage that comes with holding office should be sufficient for these candidates to defend their seats without funding from the party.  The assumption that incumbency gives a 5-10% advantage drives the classification of the pickup categories.  Tier 1 races are those where the incumbent won by less than 5% in 2006, while tier 2 races are those where Republicans won by less than 10%.  It’s really quite simple.

Tier 0

Race      D%      R%     Margin    2006 D Cand.

PA-04     51.9    48.1   3.9       Jason Altmire        
PA-08     50.3    49.7   0.6       Patrick Murphy

Tier 1

Race      D%      R%     Margin    2006 D Cand.

PA-06     49.4    50.6   1.3       Jim Gerlach

Tier 2

Race      D%      R%     Margin    2006 D Cand.

PA-15     44.1    52.8   8.7        Charles Dertinger

I’ve created chart below to keep a running total of races that I’ve classifed in each tier for 2008.

Tier 0

CT-02, NY-19, NH-1

Tier 1

CT-04, NJ-07, NY-25, NY-26, NY-29, PA-06,

Tier 2

No races meet the criteria for this tier.

States Covered

CT, MA, MD,ME, NH, NJ, NY, PA, RI, VT

SUSA: Bonilla leading Ciro 53-46 in TX-23

SurveyUSA has poll numbers out for the runoff election in TX-23. GOP rep. Henry Bonilla leads former Democratic rep. Ciro Rodriguez by a 7 point margin, 53-46.

The district as it was sampled is 59% white, and 36% hispanic. Bonilla takes 70% of the white vote and Ciro gets 72% of the Hispanic vote. You can look at the rest of the crosstabs in the link above, but I think that one says it. The majority is composed of white rural Texans who vote mostly for the GOP, and a Hispanic GOP incumbent captures a significant portion of the Hispanic minority. As for what would change this result, the crosstab to look at is party ID. The GOP has a small advantage here (43-39), but the incumbent captures 10% of Democrats and the challenger only 5% of Republicans and wins indepents (18%) by only 3%. A competent incumbent untainted by a major scandal is likely to produce similar numbers among partisan voters, so Ciro most likely will need to close the gap by appealing to independents. In the current electoral climate, a good Democratic candidate should be able to win the independent vote by more than 3%.

By what margin will Bob Shamansky win?

View Results

Loading ... Loading ...

A Graphic Anatomy of Victory: NJ, DE, MD (w/maps)

This is the third in a series of diaries graphically depicting the Democratic victory in this year’s midterm elections.

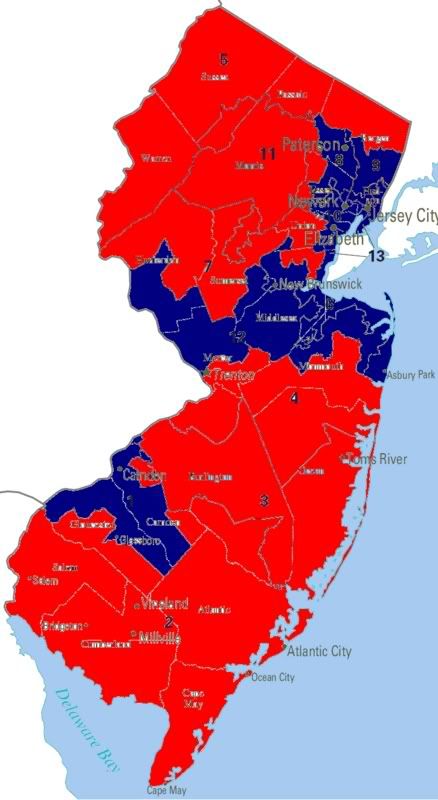
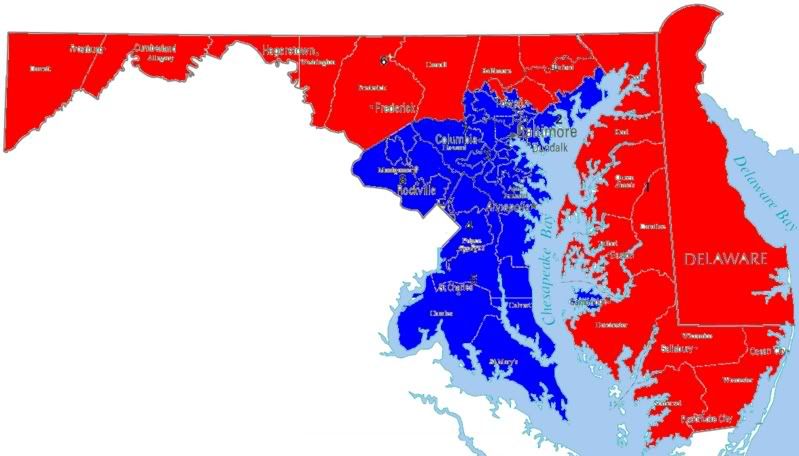
Today we will be looking at how the election went in New Jersey, Delaware, and Maryland.  No seats changed hands in these states, below are maps of the the current state of party control.

Of 1,822,786 votes cast in the 2006 New Jersey House races 983,747 votes (54%) were cast for Democrats while 815,871 votes (45%) were cast for Republican candidates.

In Maryland, 1,581,195 votes were cast with 1,017,276 (64.3%)for Democrats, while 544,508 votes (34.4%) were cast for Republicans.

In Delaware, the Republican candidate won with 57.2% of the vote.

Looking at vote margins, the only close race in these states was in the NJ-07 where the Republican candidate won by a margin of 3,259 votes (1.9%), with the Democratic candidate garnering 47.8% to the Republican’s 49.5%.   The Democratic 2006 performance is a 6.2% improvement over the 2004 Democratic vote share.  This should be a target for 2008.

Tier 0

Race      D%      R%     Margin    2006 D Cand.

No races meet the criteria for this tier.

Tier 1

Race      D%      R%     Margin    2006 D Cand.

NJ-07     47.8    49.5   1.7       Linda Stender

Tier 2

Race      D%      R%     Margin    2006 D Cand.

No races meet the criteria for this tier.