IL-Sen: Giannoulias Nosedives

Public Policy Polling (4/1-5, Illinois voters, 1/22-25 in parens):

Alexi Giannoulias (D): 33 (42)

Mark Kirk (R): 37 (34)

Undecided: 30 (24)

(MoE: ±4%)

It remains to be seen whether or not this mark represents something of a low ebb for Giannoulias in the wake of a recent flare-up of the cloud of bad press related to his family’s bank that continues to dog him — or whether we can take this as a warning sign of an extremely difficult campaign to come. At the very least, the biggest chunk of undecideds are Democrats:

The main reason Giannoulias is behind is that he’s getting only 54% of the Democratic vote while Kirk is winning 77% of the Republican vote. It’s not that a lot of Democrats are planning to cross over and vote for Kirk, but 36% of them are undecided right now compared to just 16% of Republicans. That suggests Democratic voters don’t really know what to make of Giannoulias’ problems right now so they’re just taking a wait and see approach to the race.

However, Jensen also adds: “There may not be a state in the country where Democrats have a weaker top of the ticket at this point than Quinn and Giannoulas.”

That doesn’t bode well for the gubernatorial portion of this poll, which will be released later this week.

HI-01: DCCC Reportedly Giving Soft Support to Case, Won’t Rule Out an Endorsement

This is shaping up to get very, very ugly:

More important, two Democratic sources told POLITICO that the DCCC is working feverishly to prevent a very real scenario in which the two top Democrats split the party vote and enable Republican Charles Djou to capture the heavily Democratic seat in Hawaii’s May 22 all-party special election. […]

Determined to avert that result, the two sources said the DCCC is providing under-the-radar organizational support to former Rep. Ed Case against Democratic state Sen. Colleen Hanabusa, including assistance from DCCC Western Regional Political Director Adam Sullivan.

Those efforts have coincided with the circulation of opposition research within Washington advancing the notion that Hanabusa is a longtime insider who received significant legislative pay raises at a time when the state has suffered through economic hard times – an emerging storyline that led Hanabusa to pull down her first campaign ad touting a vote to cut state legislative salaries and concede that the spot was misleading.

Here’s the problem: While the DCCC seems to want to throw all their resources to the odious Ed Case, the local party establishment — including veteran Democratic Sens. Inouye and Akaka — is firmly behind Colleen Hanabusa. The Politico cites two unnamed sources who inform them that the DCCC is letting Inouye and Akaka know that they’re preparing to back Case, and that “senior Democratic officials” have met with the top brass at AFSCME to convince the union to drop their opposition to Case and ditch Hanabusa.

Worse, the official word from the DCCC isn’t doing anything to dispel these reports:

Democratic Congressional Campaign Committee Chairman Chris Van Hollen said Tuesday he wouldn’t rule out making an endorsement in the May special election in Hawaii’s 1st Congressional District.

As two Democrats – former Rep. Ed Case and state Senate President Colleen Hanabusa – compete against a single GOP candidate in the three-way election, Van Hollen didn’t reject reports that the DCCC may swing behind Case’s campaign.

“Our biggest focus is trying to expose [Republican Honolulu City Councilman Charles] Djou’s Republican record,” Van Hollen said after an event hosted by the Washington think tank Third Way. “I’m not saying we won’t [endorse], but our focus is on exposing the Republican’s record.”

For his part, Inouye is holding firm that the DCCC won’t pick a favorite in the race, and that he’ll fight to make sure they don’t make that mistake:

“They’re not working for case or for Hanabusa. They’re working against Djou,” Inouye said. […]

Inouye told KITV4 that he talked to House Speaker Nancy Pelosi by phone, to ensure the committee is not leaning toward supporting Case. “I said, you better look at the facts and she said she will. So I’m going to talk to her when I get back to Washington,” Inouye promised.

However, local ABC affiliate KITV has their own sources suggesting that the DCCC will ditch its neutral approach and formally back a candidate in the “next couple of weeks”.

With the local party establishment so thoroughly revolted by the prospect of an Ed Case return to the House, I think the DCCC is on the verge of making a potentially disastrous decision here that will bitterly divide the party with only weeks to go until the special election. If the DCCC really wanted to get involved, they should have done so earlier by convincing Abercrombie not to resign his seat and let this battle instead play out in the Democratic primary. As it is right now, we’re looking at the prospect of a very real — and very fierce — backlash to ham-fisted efforts from the mainland to anoint a favorite here.

Learning from 1994 (Part I)

The ghost of 1994 has kept hanging over the House Democrats’ heads almost this entire Congress. That’s more the product of conventional wisdom feeding upon itself and turning into a self-fulfilling prophecy than anything else, but there are legitimate warning signs on the road ahead: not just the natural pendulum-swinging that occurs during almost every midterm against the party that controls all levels of power, but also clues like the Republicans moving into the lead in many generic congressional ballots and polls showing Republicans competitive in individual House races (although many of those polls are either internals or from dubious pollsters).

On the other hand, there are plenty of reasons to expect that, while the Democrats may lose seats, there won’t be a 1994-level wipeout. There aren’t as many retirements as in 1994 (where the Dems had 28 open seats), and certainly not as many retirements in unpleasantly red seats (17 of those 1994 retirements were in GOP-leaning seats according to the Cook Political Report’s Partisan Voting Index – compared with only 8 facing us in 2010). There are still lots of polls, of the non-Rasmussen variety, giving the Dems an edge in the generic ballot. The DCCC has a sizable financial advantage, and maybe most importantly, the DCCC and its individual members appear acutely aware of the potential danger, unlike in ’94, when they seemed to blithely sail into disaster.

This week we’re going to be doing a multi-part series looking at the House in 1994, trying to draw some parallels and applying those lessons to today. To make this investigation as accessible as possible, we’re going to frame it in terms of a number of myths about 1994, and see how much reality there is to them. For instance, were the members who lost done in by their “yes” votes on tough bills? And was the impact of the post-1992, post-Voting Rights Act redistricting a killer for moderate southern Dems suddenly cast into more difficult districts? Those are problems we’ll look at in the next few days. For today, we’ll start with:

Myth #1: Losses in 1994 were full of surprises: the old and the new, the vulnerable and the safe were swept away together by the tide.

No, not especially true. According to standard diagnostic tools (such as Cook PVI or the 1992 victory margins of individual House members), the vulnerable seats were lost; the not-so-vulnerable seats were retained. The House Vulnerability Index that I’ve applied in several posts to today’s electoral cycle, in fact, does a pretty remarkable job of predicting who would have lost in 1994. If you aren’t familiar with it, it simply combines PVI and previous victory margin into one handy value that rates a particular member’s vulnerability relative to other members of the same party. (For open seats, the HVI uses a victory margin of zero.) It doesn’t predict how likely a person is to lose – that depends heavily on the nature of the year – but it does predict likelihood of losing relative to other members of the party. (Cook hasn’t officially released PVIs for this era as far as I know, but I calculated them based on the 1988 and 1992 presidential election data for each district, according to post-1992 district lines.)

As it turns out, the HVI shows that, of the 25 most vulnerable seats in 1994, 23 were lost to the Republicans. Of seats 26 through 50, another 13 were lost. And of pre-1994 Democratic House members outside the top 100 in terms of vulnerability, there were only seven losses. In other words, the wave in 1994 was high enough that it claimed not only the open seats in red districts, but sloshed upward to claim a herd of freshmen in difficult districts and also veterans who’d had troubles in recent re-elections. (But what it didn’t do was claim more than a handful of those who seemed “invulnerable” either because of district lean or 1992 margin or both.)


District Rep. 1992
Margin
Margin
Rating
PVI PVI
Rating
Total
FL-01 Open (Hutto) 0 0 R+20 1 1
FL-15 Open (Bacchus) 0 0 R+14 5 5
SC-03 Open (Derrick) 0 0 R+13 8 8
AZ-01 Open (Coppersmith) 0 0 R+9 13 13
GA-08 Open (Rowland) 0 0 R+8 16 16
IN-02 Open (Sharp) 0 0 R+8 19 19
MS-01 Open (Whitten) 0 0 R+7 23 23
NC-02 Open (Valentine) 0 0 R+7 24 24
OK-04 Open (McCurdy) 0 0 R+7 28 28
NE-02 Hoagland 2.4% 15 R+8 15 30
TN-03 Open (Lloyd) 0 0 R+5 36 36
UT-02 Shepherd 3.7% 20 R+8 17 37
WA-04 Inslee 1.7% 12 R+7 30 42
PA-06 Holden 4.1% 23 R+7 22 45
GA-10 Johnson 7.6% 37 R+10 12 49
CA-19 Lehman 0.5% 2 R+4 48 50
NC-05 Open (Neal) 0 0 R+4 50 50
NY-01 Hochbrueckner 3.1% 17 R+6 34 51
NJ-02 Open (Hughes) 0 0 R+4 52 52
PA-13 Margolies-Mezvinsky 0.5% 3 R+4 51 54
OH-06 Strickland 1.4% 9 R+4 46 55
VA-11 Byrne 4.8% 24 R+5 38 62
MI-10 Bonior 8.9% 44 R+7 21 65
KS-02 Open (Slattery) 0 0 R+2 68 68
TN-04 Open (Cooper) 0 0 R+2 70 70
MI-08 Open (Carr) 0 0 R+1 74 74
VA-02 Pickett 12.1% 66 R+11 9 75
OH-02 Mann 2.5% 16 * R+2 61 77
IL-11 Open (Sangmeister) 0 0 R+1 78 78
KS-04 Glickman 9.6% 49 R+6 31 80
NC-03 Lancaster 11.2% 60 R+8 20 80
GA-07 Darden 14.6% 76 R+11 10 86
ME-01 Open (Andrews) 0 0 R+0 86 86
MN-07 Peterson 1.3% 6 R+1 80 86
MN-02 Minge 0.2% 1 R+0 87 88
CA-36 Harman 6.2% 31 R+3 59 90
MI-12 Levin 6.9% 34 R+3 57 91
MN-01 Open (Penny) 0 0 D+1 94 94
GA-09 Deal 18.4% 89 R+14 6 95
IN-08 McCloskey 7.2% 36 R+2 63 99
NJ-08 Klein 5.9% 29 R+1 72 101
OR-05 Open (Kopetski) 0 0 D+2 101 101
MT-AL Williams 3.5% 19 R+0 83 102
OH-18 Open (Applegate) 0 0 D+2 104 104
PA-15 McHale 5.6% 27 R+1 77 104
MO-09 Volkmer 2.3% 14 D+1 93 107
OH-19 Fingerhut 5.3% 25 R+0 82 107
TX-04 Hall 20.0% 96 R+11 11 107
AZ-06 English 11.6% 64 R+4 45 109
FL-05 Thurman 5.8% 28 R+1 81 109
ND-AL Pomeroy 17.4% 84 R+7 25 109
MD-05 Hoyer 9.1% 45 R+2 65 110
WA-02 Open (Swift) 0 0 D+2 110 110
UT-03 Orton 22.3% 109 R+18 2 111
ID-01 LaRocco 20.6% 98 R+9 14 112
NJ-06 Pallone 7.7% 38 R+1 73 111
OK-02 Open (Synar) 0 0 D+3 117 117
IN-03 Roemer 14.9% 78 R+5 40 118
IN-04 Long 24.1% 114 R+13 7 121
WI-01 Barca 0.6% * 4 D+3 118 122
NY-26 Hinchey 3.3% 18 D+2 105 123
TX-25 Open (Andrews) 0 0 D+3 126 126
KY-03 Open (Mazzoli) 0 0 D+3 127 127
FL-11 Gibbons 12.2% 67 R+2 62 129
MS-05 Taylor 27.8% 127 R+16 3 130
CA-03 Fazio 10.9% 59 R+1 75 134
CA-49 Schenk 8.5% 41 D+1 95 136
TN-06 Gordon 16.0% 81 R+3 56 137
NC-07 Rose 15.9% 80 R+3 58 138
TX-13 Sarpalius 20.7% 99 R+5 39 138
MI-13 Open (Ford) 0 0 D+4 139 139
AL-03 Browder 22.7% 113 R+7 27 140
CA-42 Brown 6.7% 32 D+2 108 140
SC-05 Spratt 22.5% 111 R+6 32 143
MI-01 Stupak 10.3% 55 D+0 89 144
NC-08 Hefner 21.1% 102 R+5 44 146
NY-18 Lowey 9.5% 48 D+1 99 147
OH-03 Hall 19.3% 92 R+3 55 147
WA-05 Foley 10.4% 56 D+1 92 148
CT-02 Gejdenson 1.6% 11 D+4 138 149
KY-06 Baesler 21.4% 105 R+4 47 152
MI-09 Kildee 8.9% 42 D+3 113 155
NH-02 Swett 26.0% 119 R+5 43 162
OR-01 Furse 4.1% 22 D+4 140 162
IL-03 Lipinski 27.0% 122 R+5 42 164
WA-09 Kreidler 8.9% 43 D+3 122 165
OH-13 Brown 18.1% 87 R+1 79 166
MO-06 Danner 10.9% 58 D+3 111 169
NY-05 Ackerman 6.1% 30 D+5 143 173
NY-28 Slaughter 10.4% 57 D+3 116 173
WA-01 Cantwell 12.9% 70 D+2 103 173
TX-16 Coleman 3.8% 21 D+6 155 176
CA-01 Hamburg 2.6% 16 D+7 164 180
TX-17 Stenholm 32.1% 147 R+6 33 180
NY-29 LaFalce 11.4% 62 D+3 123 185
TX-12 Geren 25.5% 118 R+2 67 185
MA-05 Meehan 14.7% 77 D+2 109 186
AL-05 Cramer 33.6% 152 R+6 35 187
PA-20 Open (Murphy) 0 0 D+11 192 192
VA-09 Boucher 26.2% 121 R+2 71 192

The two survivors in 1994 from the top 25 are David Bonior, a member of leadership, and Tim Holden, then a freshman. Both, however, are guys who fit their blue-collar districts well (with a mix of pro-labor and socially conservative stances), and who have since proved their campaign mettle repeatedly (with Bonior holding down his difficult district for many years, and with Holden surprising everyone by surviving the 2002 gerrymander that targeted him for extinction). Among the most predictable losses in 1994, open seats led the way. However, losses among the most vulnerable incumbents included both frosh in red districts (Karen Shepherd and Jay Inslee were the most vulnerable) and veterans with tenuous holds on difficult districts (starting with Peter Hoagland and George Hochbrueckner, who both narrowly escaped 1992).

(The two italicized races above required some manual adjustment. OH-01 initially seems safe because David Mann technically had no Republican opponent in 1992. However, he defeated Stephen Grote, a Republican who ran as an independent due to problems with his GOP nominating papers, by just 2.5%, so it seems appropriate to use that number instead. In WI-01, Peter Barca needs to be evaluated by his narrow 1993 special election victory, rather than Les Aspin’s convincing ’92 general election victory.)

The seven who lost despite being outside of the top 100 most vulnerable are an interesting mixed bag. The popular perception (perhaps helped along by the mainstream media, shocked to see their frequent cocktail party compatriots swept away) of the 1994 election is that many “old bulls” were swept out of power. In reality, only a few were: depending on who you count as an “old bull,” it’s more or less 4. They mostly fall in this 100+ area; in fact, the only legendary figure to lose who wasn’t in this range was then-Speaker of the House Tom Foley, who clocked in at #79. Most of the other vulnerable incumbents who lost weren’t legends but are little remembered today, perhaps except for for Dan Glickman (who went on to run the MPAA), Marjorie Margolies-Mezvinsky (famous mostly for being 94’s iconic loser), and Dick Swett (who just has a hilarious name).

Another perception is that there was a major house-cleaning of Reps caught up in the House banking scandal or sundry other corruption, but only one falls in this category: Dan Rostenkowski. “Old bulls” Judiciary chair Jack Brooks and Appropriations cardinal Neal Smith weren’t implicated in anything, but rather just seem to have been caught napping — as was the less-senior David Price, who returned to the House in 1996, where he remains today. (Most of the House banking scandal-related house-cleaning occurred in 1992, often in Democratic primaries rather than the general.)


Rank District Rep. 1992
Margin
Margin
Rating
PVI PVI
Rating
Total
102 KY-01 Barlow 21.3% 104 D+0 90 194
104 TX-09 Brooks 10.1% 52 D+5 142 194
107 NV-01 Bilbray 19.9% 95 D+1 100 195
113 WA-03 Unsoeld 11.9% 65 D+4 136 201
124 IL-05 Rostenkowski 18.2% 88 D+5 146 234
129 NC-04 Price 30.9% 142 D+1 96 238
135 IA-04 Smith 25.1% 115 D+4 135 250

The Vulnerability Index was even highly predictive of losses of Republican seats (and yes, there were some: a total of four, all open seats in Dem-leaning districts). Of the top 6 most vulnerable Republican-held seats, 4 were Democratic pickups. In any other year, several of these incumbents probably would have also been taken out.


District Rep. 1992
Margin
Margin
Rating
PVI PVI
Rating
Total
PA-18 Open (Santorum) 0 0 D+11 2 2
RI-01 Open (Machtley) 0 0 D+11 3 3
IA-02 Nussle 1.1% 3 D+6 8 11
IA-03 Lightfoot 1.9% 5 D+6 6 11
MN-06 Open (Grams) 0 0 D+2 14 14
ME-02 Open (Snowe) 0 0 D+1 15 15
NY-30 Quinn 5.4% 21 D+12 1 22
AR-04 Dickey 4.7% 19 D+6 7 26
MA-03 Blute 6.1% 25 D+5 9 34
CA-38 Horn 5.2% 20 D+1 18 38

So, what lessons might we infer from all this? First, we should probably expect to kiss a number of our open seats, especially ones in red districts, goodbye, as open seats are the first to fall. (In 1994, the GOP ran the table on all Dem-held open seats in GOP-leaning districts and even into most of swing territory; the reddest open seat Dems held in ’94 was the D+3 TX-25, retained by Ken Bentsen.) We shouldn’t be surprised to see some losses among the freshmen either, as they tend to wind up high up the Vulnerability Index (because freshmen usually win their prior elections – i.e., their first – by narrower margins than veterans win theirs). And finally, we can still hope to pick up a handful of the most vulnerable GOP-held seats regardless of the size of the GOP wave (you can probably name the same ones I’m thinking of: DE-AL, LA-02, and IL-10).

IA-Sen: Grassley Embarrasses Majority of Iowans; Less Than Half Would Re-Elect

{Originally posted at my blog Senate Guru.}

New polling by Research 2000 finds that Republican Chuck Grassley is far more vulnerable than the conventional wisdom gives him (dis)credit for.

When asked if Grassley should be re-elected, only 42% said re-elect, while 31% said it was time for someone new, and 27% were not sure.  (Remember, being unsure about an incumbent of twenty-nine years bodes poorly for the incumbent.)  Among independents, only 39% said re-elect.  Not too hot.

The money question of the poll was:

When Senator Chuck Grassley says President Obama and Democrats would QUOTE “pull the plug on grandma” UNQUOTE do you think that does Iowa proud in Congress or embarrasses Iowa?

By more than a 2-to-1 margin (53% to 26%), Iowans responded that Grassley’s comments embarrassed them rather than made them proud.  Among independents, the embarrass-proud ratio was an overwhelming 61-21.  Research 2000 broke down the responses by Congressional district.  Outside of right-wing radical Steve King’s 5th Congressional district (which saw a 30-51 embarrass-proud ratio), every other district was overwhelmingly embarrassed by Grassley’s remarks.  The other four Congressional districts ranged from 53-64% embarrassed while only 19-24% proud.

Very interestingly, while only 35% of respondents favored the Senate version of the health care reform bill, while 56% opposed it, 62% of respondents favored a public option (a 2-to-1 margin over the 31% of respondents that opposed a public option); and, moreover, by more than a 3-to-1 margin, Iowans want Democratic Senator Tom Harkin to fight harder for a public option and would respect him more if he did.

The message from these numbers is clear: Iowans are open to voting for an alternative to Republican Chuck Grassley, would support a public option (and many who opposed health care reform in Iowa simply feel that it didn’t go far enough), and were embarrassed by Grassley’s dishonest kowtowing to the teabaggers with his “pull the plug on grandma” routine.

The Iowa Independent reminds us:

The “pull the plug on grandma” statement, which was part of the death panel meme Pulitzer Prize winning Web site PolitiFact named its “Lie of the Year,” dogged Grassley throughout the last few months of 2009 and was cited by at least one of the three Democrats vying to unseat him as the reason for entering the race.

Grassley’s own numbers must be telling him that his lies could constitute a politically fatal flub given how freaked out he got over the discussion of his comments and how he tripped over himself backpedaling:

By the end of the year, though, Grassley was blaming media reports for his association with the death panels meme. In a letter to a constituent forwarded to The Iowa Independent, Grassley said some “commentators” took his comments and twisted them as saying that health care reform would establish death panels.

“I said no such thing,” Grassley said. “As I said then, putting end-of-life consultations alongside cost containment and government-run health care causes legitimate concern.”

Who was that Democrat who cited Grassley’s comments as a reason for entering the race?  Attorney and Democratic former gubernatorial nominee Roxanne Conlin.  She got into the race in late 2009, so this past quarter’s fundraising report will be the first test of her campaign’s financial viability.  Word is, she’s a fairly prodigious fundraiser.

On top of that, Grassley has handed her the issue and according message frames on which to run.  Notably to me, Conlin has five grandchildren.  In other words, she is a grandma.  I think it would be powerfully resonant for Conlin to put out an ad highlighting Grassley’s “pull the plug on grandma” comments that embarrassed a majority of Iowans and to close the ad (while talking to the camera, surrounded by her five grandchildren) with the line, “I’m Roxanne Conlin, and I approved this message because I’m a grandma and I’m embarrassed that Chuck Grassley is talking about pulling the plug on me.”

Keep a close eye on IA-Sen; I’m expecting a competitive race that will surprise the traditional media.

SSP Daily Digest: 4/6 (Morning Edition)

  • AR-Sen: The Communications Workers of America, a union supporting Bill Halter, is firing back with an ad on black radio to combat Blanche Lincoln’s bullshit spot claiming she “stood with our president to pass healthcare reform.” CWA’s ad is in heavy rotation around the state, running “50 times a day” around Little Rock. They also have a new TV ad out, but no word on the size of the buy.
  • AZ-Sen: The U.S. Chamber of Commerce has given its first endorsement of the 2010 cycle to Sen. John McCain – but apparently cash ain’t attached. I guess the CoC, the grand doyenne of “cheap labor conservatives,” doesn’t believe Johnny Mac’s nativist turn is for real. Given what a fraud McCain has shown himself to be from top to bottom, I guess this makes sense.
  • CA-Sen: No, the reason John McCain can’t be found in Arizona isn’t because they took him “to a farm upstate.” He’s out in California, campaigning with Carly Fiorina.
  • IN-Sen: It’s not just that Dan Coats has an unsavory record as a lobbyist – his voting record seems pretty out-of-step with the crazies who make up the modern GOP base. John Hostettler is hitting Coats (albeit in the form of a web video) for things like his votes in favor of the assault weapons ban, the Brady Bill, and the Clinton crime bill – a set of votes tradmed analysts usually like to ascribe many 1994 Dem losses to.
  • UT-Sen: While they haven’t picked a specific horse to back yet, the Club for Growth has nonetheless spent $133K against Sen. Bob Bennett.
  • AZ-Gov: Democrat Terry Goddard has finally made his gubernatorial bid official.
  • AL-02, AL-05: GOP State Sen. Harri Anne Smith, who endorsed Dem Bobby Bright for re-election, has been kicked off her own re-election ballot by the Alabama Republican Party in retaliation. Smith lost the GOP primary in 2008 to Jay Love and apparently is still smarting over that – but this has to sting quite a bit more. Smith hasn’t decided if she’ll run as an independent instead. (Switch! Switch!) Meanwhile, the AL GOP said that turncoat Parker Griffith could stay on the Republican ballot, despite a challenge thanks to his party-switching ways.
  • FL-08: I’ve totally lost track of how many Republicans are trying to challenge Rep. Alan Grayson, so what’s one more? Wealthy businessman Ross Beiling, owner of a medical parts supplier, is throwing his shrimp on the barbie.
  • MI-07: While two Michigan Republicans have endorsed ex-Rep. Tim Walberg in his comeback bid, five others are staying neutral in the primary, which also includes Brian Rooney, younger brother of Rep. Tom Rooney (FL-16).
  • NY-05: Dan Halloran, a Republican who won a Dem-held seat on the NYC City Council last year, is weighing a challenge to Rep. Gary Ackerman. Halloran, a practicing Theodist, thinks he can make Ackerman pay a price for voting in favor of healthcare reform. Ackerman, for his part, has $1.1 million on hand and the support of the Queens Independence Party. This district also went 63-36 for Obama (but notably, that’s the same percentage that Kerry got, suggesting there was something of a “conservative white ethnic New Yorkers for McCain” effect here).
  • NY-13: The United Food and Commercial Workers Local 1500 is backing Rep. Mike McMahon, in spite of his vote against healthcare reform, citing his support of the Employee Free Choice Act. Speaking of the CWA again, though, a day ago, its local vice president, Chris Shelton, called McMahon “the Judas from Staten Island.” Personally, I think that phrase is overused, and I’m going to start calling traitors “Brutuses.”
  • Across the Pond: Our friends in the U.K. have scheduled their elections for May 6th. Imagine if we only had one-month campaigns here!
  • High-minority areas: Small States 5 CD or less

    Dave’s lets you see population by race.  Therefore, every voting district with less than 60% Whites is now colored based on which minority there are the most of.  I do not include the heavily minority Southwestern States (Nevada, Arizona and New Mexico), the heavily minority Mississippi, as there is no general trend other than Blacks along the Mississippi river, nor Hawaii; New Hampshire and Maine are also excluded because no voting district fits the requirements.  So, here we go.

    GREEN=African-American

    YELLOW=Hispanic

    GRAY=Asian

    BLUEISH=Native American

    PERIWINKLE=Other

    And…voila:

    4 EVs: Rhode Island

    Photobucket

    In Rhode Island, there are many Hispanics (Puerto Ricans, mostly, I believe, along with some Dominicans).  Part of Woonsocket contains a sizeable Hispanic population, although it considers itself the most French city in America due to the number of French Canadians residing there.  Much of Pawtucket is also Hispanic.  In Providence, especially the West Side, there are large amounts of both Blacks and Hispanics.  Providence is actually a majority-minority city.  Hispanics represent a majority of the public school system in the city and completely outnumber the Blacks.  Further South, in Newport, there are small neighborhoods of both Blacks and Hispanics.  

    Idaho: Photobucket

    There is not much of a trend here, with pockets of Native Americans and Hispanics in an otherwise overwhelmingly white state.

    5 EVs:

    Photobucket

    Not too much to see here, but there are pockets of Black voters.  In the Panhandle/Rust Belt, not shown on the map, pockets of both Weirton and Wheeling have Black populations of a sizeable amount.  Further South, there are pockets in Fairmont, a city with a 23 year old mayor.  Portions of Charleston have Blacks as well, although the city is still very White.  The same goes for Huntington, home of Marshall University and the least healthy city in the US.  In the Coal Mining South, Beckley and the tiny towns of Alderson, Keystone (which is majority-Black), Gary, and Northfork also have large minority populations.  I will continue this later.

    Nebraska:

    Photobucket

    Yeah, I know it’s a very White state, but there are a few minority parts.  In Knox and particularly Thurston counties, there are many, particularly Winnebago and Omaha tribe members.  Rural Dakota Co. has Hispanics (I have no clue why).  The town of Schuyler, which is only about 50% White, is nearly majority Hispanic (maybe at the local beef processing plant?).  Lexington is actually majority Hispanic, again for reasons unknown.  In the larger towns/cities, Grand Island has some Hispanic neighborhoods and also has a meat-packing plant, which I’m assuming is related to the minority populations in both Grand Island and Schuyler.  Finally, in Omaha, the Northeast is highly Black, while the Southeast is highly Hispanic, again near a meat processing plant.

    Utah:

    Photobucket

    Utah is also a very White state, like Idaho.  However, there are large Native American populations in the East, in Uintah and San Juan Counties.  Hispanics do exist as well, although not in the South, as I personally would have expected.  Ogden is one of those cities that has some; the other is Salt Lake City.  

    6 EVs:

    Arkansas:

    Photobucket

    Arkansas is generally though of as one of the White Southern states, along with West Virginia, to some extent, Kentucky, and Oklahoma.  These states have no African-Americans in the U.S. House.  Neither does Tennessee, but that is not for lack of VRA trying.  However, Arkansas has a larger Black population, and a Black-majority district would be possible through extreme gerrymandering.  Arkansas’ minority population would be on the right side of a triangle cut down the middle from northeast to southwest.  I will go by CD.

    CD 1 (Marion Berry for now, hopefully a Democrat after)

    Newport, childhood home of Gov. Mike Beebe, has a large Black population, as do parts of nearby Jonesboro, home of Arkansas State. Further East, much of Blytheville, which according to Wikipedia is a steel town (did not know that) is majority Black.  The rural areas along the Mississippi in Crittenden, St. Francis, Lee, and Phillips Counties are highly Black.  The only real towns in these areas are West Memphis, Forrest City, home of singer (not Rep.) Al Green, and West Helena.  Further inland, tiny Marked Tree, extremely poor Cotton Plant and somewhat larger Brinkley have high Black populations as well.

    CD 2 (Most likely Tim Griffin, sadly, currently Vic Snyder)

    Tiny Danville, Northwest of Little Rock, is near-majority Hispanic.  Neighborhoods of North Little Rock are part Black, as is much of state capital and liberal haven (as if that’s saying much in Arkansas) Little Rock, a majority-minority city.  

    CD 3 (Some Wingnut, currently future AR Sen. John Boozman)

    Actually, the only minority areas in this district are Hispanic.  These include the towns of Green Forest and Little Flock and the cities of Rogers, home of the first Wal-Mart, and Springdale, home to a chicken processing plant.  The Northern half of Ft. Smith is very Hispanic, with some Blacks as well.  

    CD 4 (Mike Ross-“D”)

    This district has the highest minority population.  From West to East:

    DeQueen: A small town, it is very Hispanic

    SW Little Rock Co.: Large Native American population, borders Oklahoma (probably Cherokee?)

    Ashdown, Mineral Springs, birthplace of MLB star Willie Davis, Lewisville, Stamps, childhood home of Maya Angelou, much of Texarkana, and Hope, home of both Bill Clinton and Mike Huckabee, along with Rep. and Blue Dog Chair Mike Ross: high Black populations

    Moving further East, the lower echelon of counties, more or less those within two counties of the Louisiana border, have high Black populations.  Towns here include industrial Magnolia, Camden, home of Fmr Sen. David Pryor, and oil town El Dorado, home of MLB player Lou Brock.

    In the Southeastern portion of Arkansas, Pine Bluff is a heavily Black city.  Containing historically Black college AR-Pine Bluff, there’s no wonder why the city is nearly 2/3 Black.  Warren and Monticello are other small towns.  There are some Hispanic pockets in this area as well.

    Kansas:

    Photobucket

    Kansas is more diverse but less liberal than Nebraska.  The Southwest has large Hispanic populations.  Small somewhat Hispanic towns in this area include Syracuse, Deerfield (majority),and Ulysses.  Large towns/small cities with high populations in this area are Liberal, with a huge beef plant, Garden City, and Dodge City, a former Wild West town. Nicodemus, a tiny town in the Northwest, was founded by Blacks and the reconstruction era and remains heavily Black.

    Topeka (Google), further East, has many Hispanics and Blacks, although it is majority White. The same goes for the larger Wichita.   Fort Riley has many Blacks, due to their overrepresentation relative to population in the Armed Forces (at least I think they’re overrepresented).  Brown and Jackson counties have many Native Americans, as does, for some reason, a tiny part of Lawrence.  In Kansas City, the Southeast is Hispanic and the North is Black, leading to a majority-minority city.  

    7EVs:

    Connecticut:

    Photobucket

    Connecticut is similar to Rhode Island, but with a larger Black population.  However, near Rhode Island it is basically all white, with only a somewhat large Hispanic community in New London.  The Black community is about as large as the Hispanic one, but none of the voting districts have a Black plurality while being under 60% White, so it appears there are none.  Such is the problem with simple color-coding like this, but it gets the general point across of where there are and are not Whites.  

    Further West, we get to Hartford and the surrounding area.  Hartford has very large minority populations, including a huge number of Puerto Ricans and Blacks.  It is only 18% White.  Hartford also has extreme poverty, in contrast to the rest of the state, which is considered the richest in the nation.  Blacks are concentrated in the Northern half of the city and inner suburbs, while Hispanics are in the Southern half.  Speaking of these inner, suburbs, here they are:

    Bloomfield: Majority Black, home of NFL star Dwight Freeney.  It appears to me to be middle-class Black, a relatively rare phenomenon for an entire town (list other towns like this in the comments if you know of them).  

    Windsor: Majority White, but many Blacks.  The median Black income exceeds the median White income.

    E. Hartford: Also majority White, mainly lower middle class.

    W. Hartford: A few Hispanic neighborhoods on the Hartford border.

    Near Hartford, we encounter New Britain, which is very Hispanic in many parts of the city, and the home of the invention of dribbling in basketball.  

    In New Haven County, Meriden has Hispanic neighborhoods as well.  Waterbury has some Black neighborhoods and many Hispanic ones.  In this city, 4 mayors since 1940 have been indicted while in office (this could be the Chicago of the Northeast).  New Haven actually has more Blacks than Hispanics, although there are many of each.  It is the birthplace of Bush 43 and the home of Yale.  Suburb West Haven is mostly White, but with some Black and Hispanic areas.  

    Fairfield County, near New York, has some minority areas as well, although more rural Litchfield does not.  Danbury is very White for a Connecticut city, but has a few Hispanic areas.  A small part of Stratford is majority Black, and Bridgeport is nearly all minority, split between the two major minorities.  Central Norwalk is the same as Bridgeport, as is Coastal Stamford.  

    Iowa:

    Photobucket

    In 2007 and 2008, we heard about how Iowa was nearly all White.  How true is this? I’d say it’s nearly true, but Iowa isn’t the 1950’s Alabama Democratic Party.  Parts of Sioux City, on the Western border, have many Hispanics.  Am I correct in assuming that there is a meat plant in the city?  It seems to be the trend for Hispanics on the Great Plains.  It’s true for much smaller Storm Lake, in Central Iowa.  

    Central Des Moines is like many other cities in that it has Black and Hispanic areas, despite it being in Iowa.  However, it’s still 3/4 White.  Tama Co. contains some Native American voting districts.  Northeast Waterloo has a large Black population, due to their being recruited from Mississippi to work in the early 1900’s.  What Black man or woman wouldn’t want to leave early 1900’s Mississippi?

    Tiny Conesville is majority Hispanic for reasons I cannot understand.  Nearby West Liberty has a meat plant, and many Hispanics as a result.  

    Finally, there is one Asian voting district in University Heights, near the U. of Iowa, and one precinct of Davenport is majority Black.  That’s it for Iowa.

    Oklahoma:

    Photobucket

    Oklahoma is unique because it’s the only state with large Native American, Hispanic, and Black populations.  

    Hispanic Areas:

    Guymon Area including Texhoma: Panhandle area, is home to pork processing plant

    Clinton: birthplace of Toby Keith..is there an animal plant here as well?

    Altus and nearby Olustee: Altus is home to W. OK St. Univ and an AFB.

    Oakland: Tiny S. OK town

    Heavener: in E. OK, home of poultry plant.  

    Black Areas:

    Sayre: Small SW OK town

    Granite: Home to prison

    Lawton: Large Black population in a city

    Tatums: Nearly all Black village

    Watonga: Small town

    El Reno: home to the Fried Onion Burger Festival

    Langston: home to the only historically Black college in the state

    Forest Park and Spencer: surrounded by OKC

    In the Eastern Half, nearly every relatively large town has Black areas:

    Ardmore, Boley (home of a prison), Wynona, Nowata, Muskogee, a town with a 21-year old mayor and home of Sen. Tom Coburn, AG Drew Edmondson, McAlester, home of former House Speaker Carl Albert, Atoka, Hugo, Idabel, and Fort Coffee

    Native Areas:

    Very scattered, particularly along AR Border.  Some towns include:

    Tahlequah, the Cherokee capital, and Stilwell

    Black/Hispanic:

    Tulsa and Oklahoma City: the state’s two largest cities are its most diverse.  Both contain large amounts of both ethnicities.


    Redrawing California: More Democratic and Hispanic Representatives

    (I have cross-posted this diary on Calitics)

    This is my first attempt at California since the partisan data by precinct became available in Dave’s Application.  

    My diaries are often long, and it takes me a while to get to the point.  So, I will summarize the bottom line here:

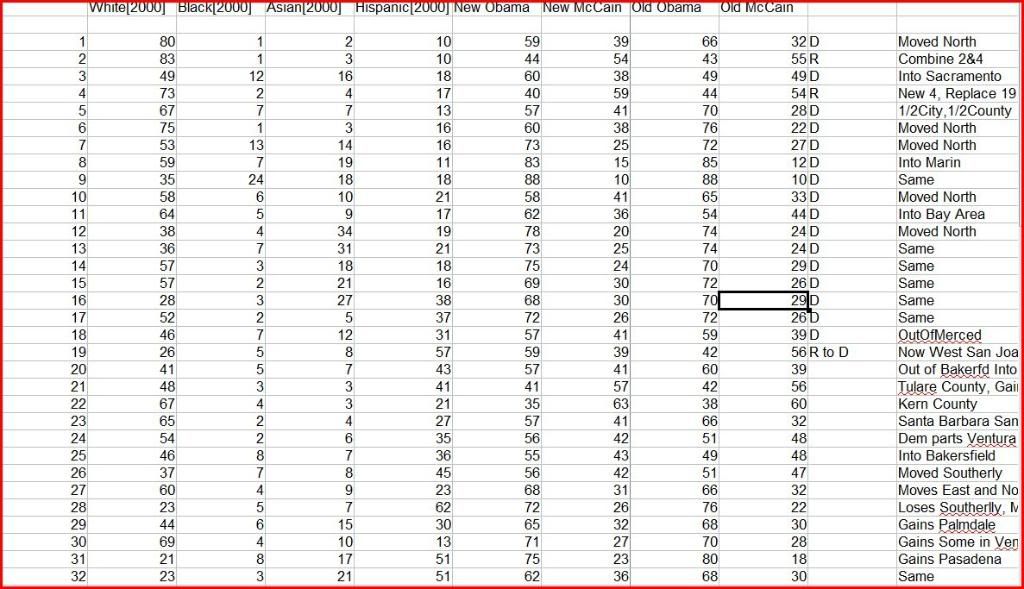
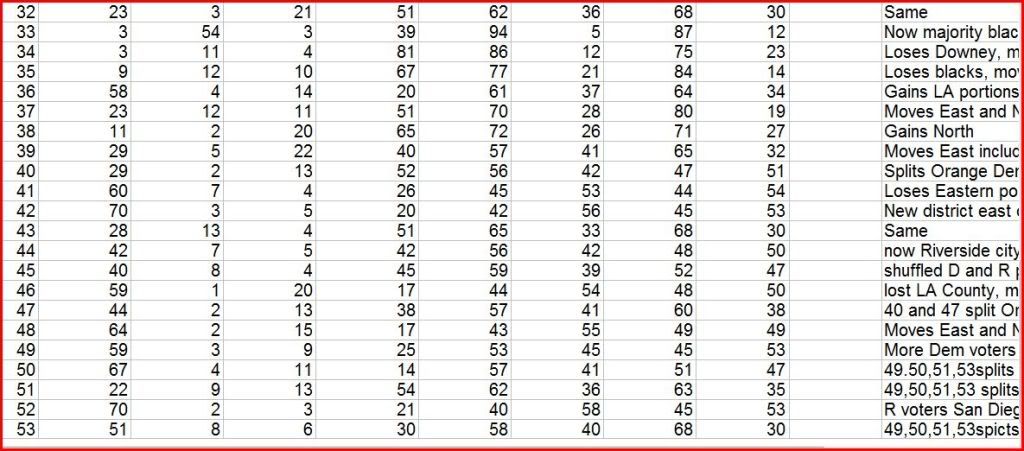
    * 43 solidly Democratic districts created; in each McCain gets 37% of vote or less (currently there are 34 Democratic representatives from California, and 1 of the 34 holds a swingy seat)

    * Remaining 10 districts to GOP, with possibility that 2 of the 10 go our way at some point in the next decade

    * 19 Hispanic majority districts created; 18 of the 19 are at least 55% Hispanic, so that a Hispanic representative has a real chance of being elected (currently, there are only 8 Hispanic representatives from California).   An additional 13 seats are minority-majority (with either an Asian or African-American plurality or no particular racial/ethnic minority dominant).

    Now, back to the more lengthy explanation …

    I wanted to create as many minority-majority or minority-plurality districts as possible.  Although in most states an increase in the number of minority-majority districts would have an inverse relationship with an increase in the number of Democratic districts, in California that relationship appears complimentary: an increase in Democratic districts goes hand-in-hand with an increase in Hispanic and other minority-majority or minority-plurality districts.

    There’s one issue here that is a bit tricky.  The dataset with the Obama/McCain partisan numbers also uses 2000 census demographics.  Under the 2000 census, California was 47% white and 32% Hispanic.  However, more recent data, from the 2006-2008 American Community Survey indicates that the state was approximately 42% white and 37% Hispanic.  The ACS data does not go down to the census block level, and therefore Dave’s Application relied on Census 2000 data, to the block level, to generate racial/ethnic composition data for each precinct for the partisan data model.  On the other hand, the original dataset without partisan numbers does appear to use the more recent numbers — down to the county level (I am not sure if the ACS 2006-2008 data was used, but the resulting percentages correspond almost exactly to what the ACS numbers look like — 42% white; 37% Hispanic).

    Therefore, for the purpose of this diary, I will list the demographic data for each district using the exact (yet older) demographic data, but will also provide estimated numbers using the newer (though more geographically inexact) data.  I was able to do this by “redrawing” my map from the partisan model into the original matrix without the partisan data.  So, please keep in mind that the 2006-2008 demographic numbers are just estimates, though they are closer to the current demographic situation than the 2000 data.  

    To make sure that a Hispanic-majority district has enough of a minority population to provide an opportunity to elect a minority-representative, I set a benchmark for myself of at least 55% Hispanic (under the more recent estimated data) AND the Hispanic population should be at least 2 times as large as the next largest ethnic/racial group (so a district that is 55% Hispanic and 27% white would work, but 55% Hispanic and 30% white would not work).   All my Hispanic-majority districts fit the criteria except for two which are both 55% Hispanic and 28% white and one that is 50+% Hispanic and 25% white.

    There are currently only eight Hispanic representatives from California.  Under this plan, that number is likely to be at least doubled.  10 new Hispanic-majority districts are created.  In addition, two other districts have enough of a Hispanic population to elect a Hispanic representative at some point in the near future.  The plan also creates three new Asian-plurality districts, three minority-majority districts (with no particular minority group that’s dominant) and strengthens CA-35 as an African-American-plurality district.

    Another goal I had in mind when drawing this plan, was to keep as many counties intact as possible.  The current (2002) plan has a total of 120 “county-fragments” in the plan.  For example, the current CA-1 has 7 fragments: the whole counties of Del Norte, Humboldt, Mendocino, Lake, and Napa (that’s 5), as well as parts of Sonoma and Yolo (2 more).  Under the proposed plan here, I have 121 “county-fragments” (and that includes one tiny sliver of Sacramento Co. that’s in my CA-4, and is therefore a “fragment” only because I tried to use a small population deviation (+/- 500 persons) for each of my districts.)  Therefore, my plan is technically not any more gerrymandered than the existing plan if looking at gerrymandering through the prism of how counties are split among districts.

    Last, but not least … the partisan numbers for my map …

    The current map of California is, for all practical purposes, a Republican gerrymander.  It was designed in 2002 as a “bipartisan compromise” between the two parties (even though Democrats were in charge), but today the faulty map is the only thing keeping so many Republican Congressmen in office from a state that is as Democratic as California.  To demonstrate — in 2008, 31 out of 34 Democratic Representatives won by at least 68% of the vote, while 13 out of 19 Republicans won with a winning percentage of 58% or less (including four GOPers who won with 51% or less).

    One of the arguments the Democrats who designed the current map made was that it was “impossible” to create any additional Democratic seats without endangering the Democratic seats that were created.  This argument is basically bs.  As you can see from this proposal and the map below, the CA-45 that I create is made up entirely out of territory currently in GOP districts.  

    Photobucket

    The proposed CA-45 encompasses parts of the current CA-45, CA-44, CA-41 and CA-49, and the resulting district is 65 Obama – 34 McCain.  The district is also quite compact and confined entirely to one county – Riverside.  Thus, it was very possible to create at least one more Democratic seat in 2002, since the creation of such a district would have had no effect on any Democratic seats that were created, as all the territory comes only out of GOP areas.  (Btw, if you are a little more creative with the lines, a district entirely within Riverside Co. that takes territory only out of currently GOP-held districts can be created that is 68 Obama – 30 McCain.  The theoretical district would extend a bit more into the city of Riverside, and lose territory elsewhere; however, in my proposed map here I wanted to put most of those Democratic Riverside areas into a new CA-48 that is also designed to be a new Democratic district.)

    Another example of how California Democrats could have drawn a better map in 2002 is below.  The Democrats could have created a district in San Diego Co. that is 55 Obama – 44 McCain using only territory that comes out of the current CA-50, CA-52 and CA-49, all Republican districts.  What’s more, is that the theoretical district would arguably do a better job of keeping communities together, as the northern third of the city of San Diego would now be in only one district instead of being split between CA-50 and CA-52, and much of the northern and eastern boundaries of the district would correspond almost exactly to the northern and eastern boundaries of the city.

    Photobucket

    Although the theoretical district would be politically competitive, and not as much of a slam-dunk Democratic district as the proposed CA-45 above, it would have likely been Democratic-held today (with all other things being equal) since it would be approximately 7 points more Democratic than the current CA-50 (Francine Busby lost the special 2006 election by only 4 points and Nick Liebham lost his 2008 race by 5 points).  (Btw, in this proposed plan I decided to draw somewhat different lines in San Diego Co. and came up with three San Diego-based districts that are all 62 Obama – 37 McCain).

    The examples above are not the only ones, but are just an illustration of the existing plan’s gutlessness.  The Democrats in 2002 apparently spent millions to create such a plan; it’s really a travesty that it wound up being a gerrymander that over-represents GOP strength in the state.

    The proposed plan in this diary creates 10 new solidly Democratic districts.  All existing and new Democratic seats now become ones where McCain had at most 37% of the vote in 2008.  I feel that is enough of a cushion (basically 24-25 points Obama over McCain) to ensure Democratic representation.  Btw, the numbers for California as a whole were almost exactly 62% Obama; 37% McCain. (I’m classifying McNerney’s seat as currently “Republican” since it was designed that way in 2002, and could still go GOP depending on the political climate, currently being only a 54% Obama district).  I also tried to keep the geographic/political base of each Democratic incumbent intact while designing this plan.

    If this plan was implemented, Democrats would be basically assured of 43 House of Representatives seats from California, with the possibility of picking up another two at some point over the next decade.  Of course, all now depends on whether Jerry Brown can win in November, and even if he wins — how bold are California Democrats willing to be.

    For those arguing that Republicans should somehow have more than 10 seats from California, I reference you to three points:  1). the current plan is tilted towards the GOP and is not representative of the partisan nature of California; likewise, there are not enough Hispanic and other minority-majority districts in the state, and in order to create a map that better represents minority populations, more Democratic districts need to be created;  2). until both parties stop using gerrymandering as a political tool, there is no reason why Democrats should disarm unilaterally; and  3.) look at the recent health care debate and see just how EVERY little seat mattered !  With nine or ten more California Democrats in the House helping Pelosi, the process would have likely gone a whole lot smoother, and we would have never been even close to that precipice of defeat …

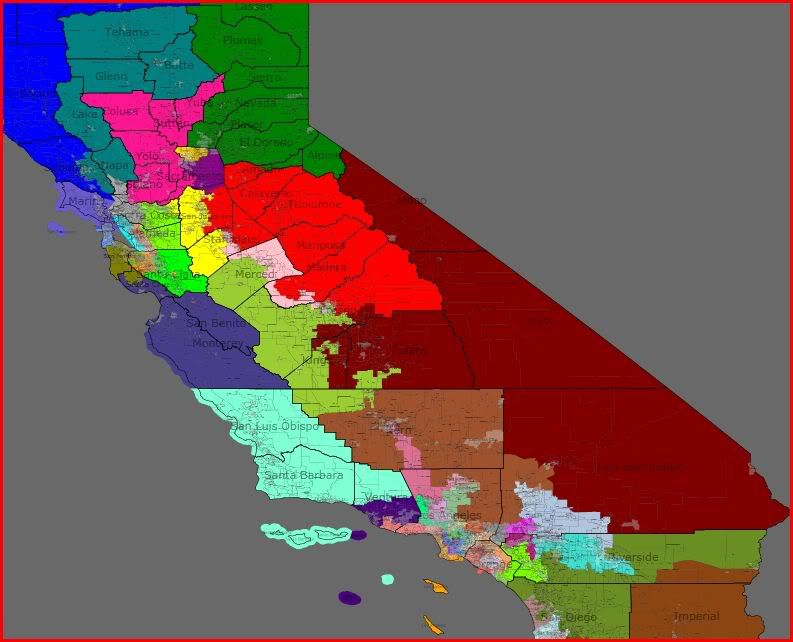
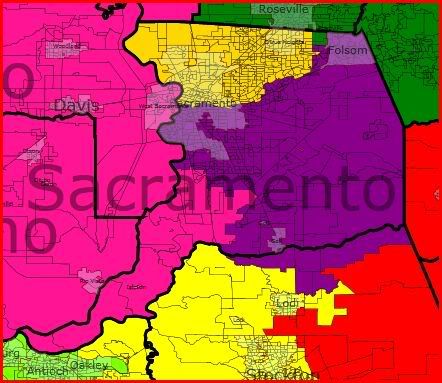
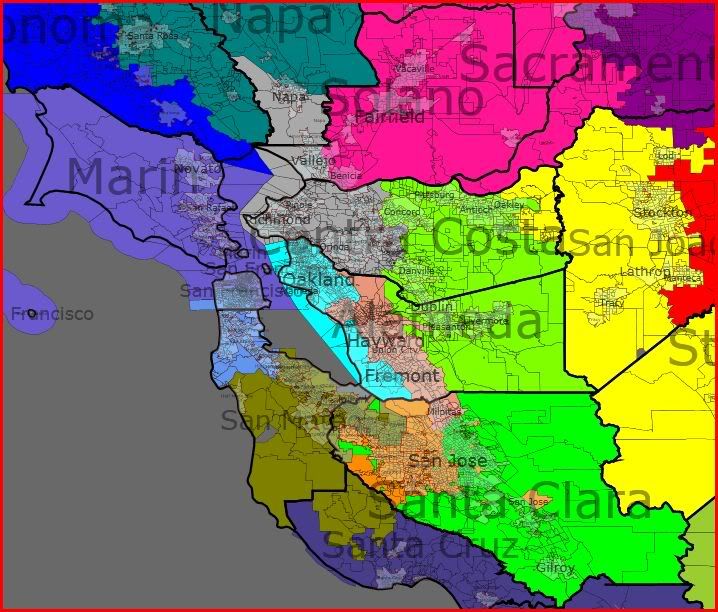
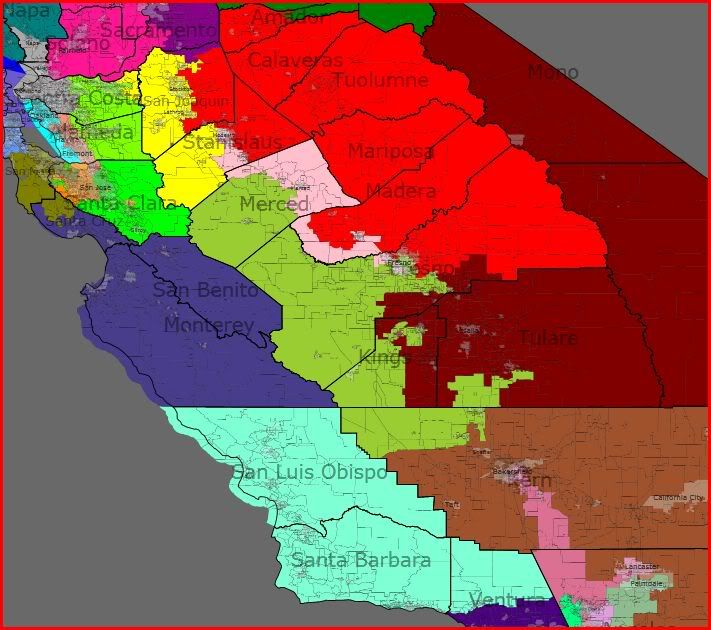
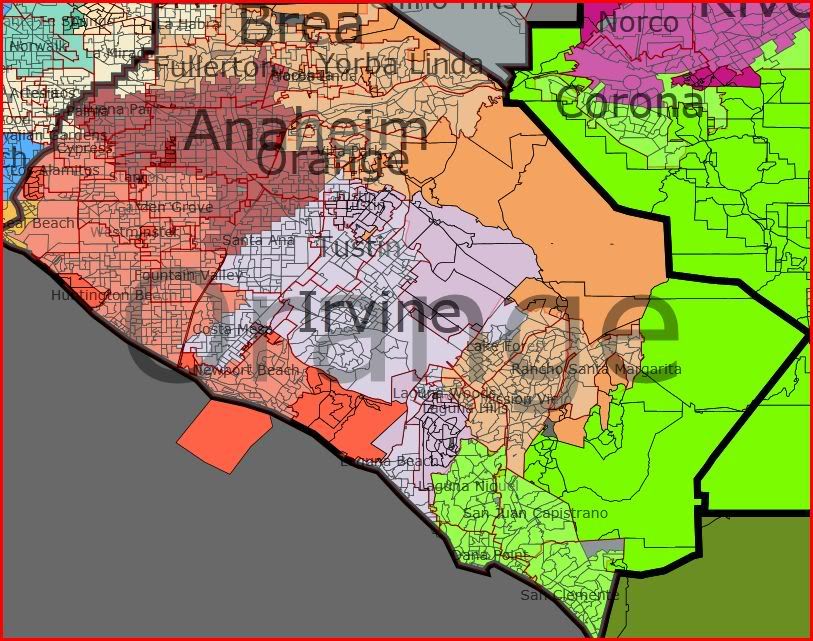
    Anyhow, here’s the plan:

    Photobucket

    Photobucket

    Photobucket

    District 1:

    Incumbent: Mike Thompson (D)

    Current District:  Obama 66; McCain 32

    Proposed District:  Obama 64; McCain 34

    Proposed District Demographics:

    2000 Census: 73 white ; 2 black ; 1 native american ; 3 asian ; 18 hispanic ; 3 other

    Estimated 2006-2008: 67 white ; 2 black ; 1 native american ; 4 asian ; 23 hispanic ; 2 other

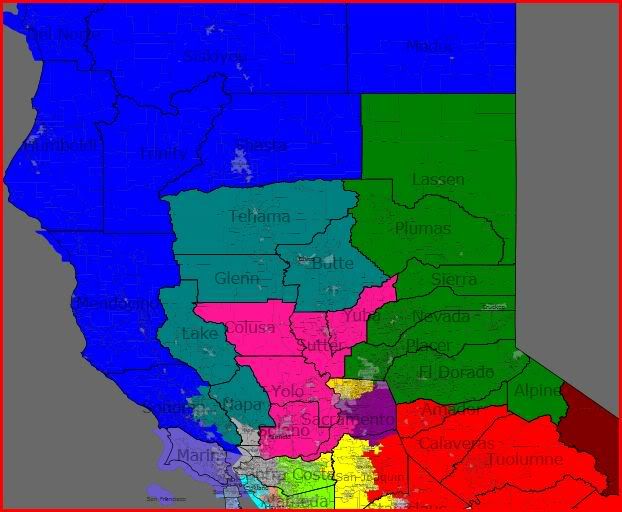
    Includes all of Napa, Lake, Colusa and Glenn Counties, part of Sonoma Co. – Santa Rosa, Sonoma, Rohnert Park, Cotati, Sebastopol, and part of Butte Co. – Chico, Oroville, Paradise

    District 2:  

    Incumbent: Wally Herger (R)

    Current District:  Obama 43; McCain 55

    Proposed District:  Obama 41; McCain 57

    Proposed District Demographics:

    2000 Census: 78 white ; 2 black ; 2 native american ; 4 asian ; 11 hispanic ; 3 other

    Estimated 2006-2008: 74 white ; 2 black ; 2 native american ; 4 asian ; 15 hispanic ; 3 other

    Includes all of Siskiyou, Modoc, Shasta, Tehama, Lassen, Plumas, Sierra, Nevada, Yuba and Sutter Counties, part of Sacramento Co. and part of Butte Co. – Gridley, Biggs

    District 3:  

    Incumbent: Dan Lungren (R)

    Current District:  Obama 49; McCain 49

    Proposed District:  Obama 63; McCain 35

    Proposed District Demographics:

    2000 Census: 52 white ; 9 black ; 1 native american ; 13 asian ; 20 hispanic ; 4 other

    Estimated 2006-2008: 46 white ; 10 black ; 1 native american ; 16 asian ; 24 hispanic ; 4 other

    New minority-majority district

    New Democratic district

    Includes all of Yolo Co., and part of Sacramento Co. – Citrus Heights and part of city of Sacramento

    District 4:  

    Incumbent: Tom McClintock (R)

    Current District:  Obama 44; McCain 54

    Proposed District:  Obama 43; McCain 55

    Proposed District Demographics:

    2000 Census: 83 white ; 1 black ; 1 native american ; 3 asian ; 10 hispanic ; 3 other

    Estimated 2006-2008: 79 white ; 2 black ; 1 native american ; 4 asian ; 11 hispanic ; 2 other

    Includes all of Placer, El Dorado, Amador, Calaveras, Tuolumne and Mariposa Counties, and small sliver of Sacramento Co.

    District 5:  

    Incumbent: Doris Matsui (D)

    Current District:  Obama 70; McCain 28

    Proposed District:  Obama 63; McCain 35

    Proposed District Demographics:

    2000 Census: 60 white ; 9 black ; 1 native american ; 11 asian ; 15 hispanic ; 4 other

    Estimated 2006-2008: 53 white ; 10 black ; 1 native american ; 13 asian ; 20 hispanic ; 4 other

    Includes part of Sacramento Co. – incl. most of the city of Sacramento

    District 6:

    Incumbent: Lynn Woolsey (D)

    Current District:  Obama 76; McCain 22

    Proposed District:  Obama 72; McCain 26

    Proposed District Demographics:

    2000 Census: 78 white ; 2 black ; 2 native american ; 3 asian ; 12 hispanic ; 3 other

    Estimated 2006-2008: 74 white ; 2 black ; 2 native american ; 4 asian ; 16 hispanic ; 3 other

    Includes all of Del Norte, Humboldt, Trinity, Mendocino and Marin Counties, and part of Sonoma Co. – Petaluma, Windsor, Healdsburg, Cloverdale

    District 7:  

    Incumbent: George Miller (D)

    Current District:  Obama 72; McCain 27

    Proposed District:  Obama 66; McCain 33

    2000 Demographics: 53 white ; 11 black ; 1 native american ; 12 asian ; 19 hispanic ; 5 other

    Estimated 2006-2008 Demographics: 47 white ; 11 black ; 1 native american ; 13 asian ; 25 hispanic ; 4 other

    Includes all of Solano Co. and part of Contra Costa Co. – Martinez, Pleasant Hill, Concord, Clayton, Pittsburg

    District 8:  

    Incumbent: Nancy Pelosi (D)

    Current District:  Obama 85; McCain 12

    Proposed District:  Obama 85; McCain 13

    Proposed District Demographics:

    2000 Census: 42 white ; 9 black ; 0 native american ; 31 asian ; 15 hispanic ; 3 other

    Estimated 2006-2008: 45 white ; 7 black ; 0 native american ; 31 asian ; 15 hispanic ; 2 other

    Includes most of San Francisco (district expands into Sunset District to maintain equal population)

    District 9:  

    Incumbent: Barbara Lee (D)

    Current District:  Obama 88; McCain 10

    Proposed District:  Obama 74; McCain 25

    Proposed District Demographics:

    2000 Census: 54 white ; 17 black ; 0 native american ; 12 asian ; 14 hispanic ; 3 other

    Estimated 2006-2008: 48 white ; 16 black ; 0 native american ; 15 asian ; 18 hispanic ; 3 other

    Includes part of Alameda Co. – Berkeley, Albany, Emeryville, Dublin, Livermore and part of Oakland, and part of Contra Costa Co. – Moraga, Orinda, Danville, San Ramon, Oakley

    District 10:  

    Incumbent: John Garamendi (D)

    Current District:  Obama 65; McCain 33

    Proposed District:  Obama 65; McCain 33

    Proposed District Demographics:

    2000 Census: 57 white ; 11 black ; 1 native american ; 11 asian ; 17 hispanic ; 4 other

    Estimated 2006-2008: 49 white ; 11 black ; 0 native american ; 13 asian ; 23 hispanic ; 3 other

    New minority-majority district

    Includes part of Contra Costa Co. – Richmond, San Pablo, El Cerrito, Hercules, Pinole, Lafayette, Walnut Creek, Antioch, Brentwood, and part of Sacramento Co. – Isleton, Galt, Folsom

    District 11:  

    Incumbent: Jerry McNerney (D)

    Current District:  Obama 54; McCain 44

    Proposed District:  Obama 66; McCain 33

    Proposed District Demographics:

    2000 Census: 54 white ; 9 black ; 1 native american ; 12 asian ; 20 hispanic ; 4 other

    Estimated 2006-2008: 49 white ; 8 black ; 0 native american ; 15 asian ; 24 hispanic ; 3 other

    New minority-majority district

    New Democratic district
    – that may sound strange, but this district was designed in 2002 as a GOP seat.  It has moved towards the Democrats since then, but there’s a reasonable chance the incumbent Democrat could be defeated under the current lines at some point in the future.  The proposed plan significantly increases the Democratic percentage here.

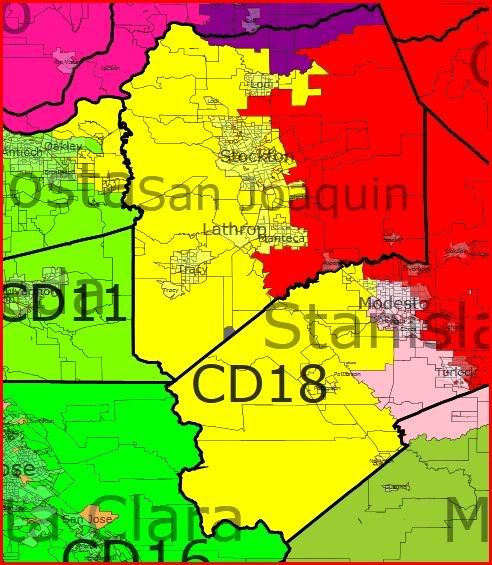
    Includes part of Alameda Co. – Piedmont, Pleasanton and part of Oakland, and part of San Joaquin Co. – Tracy, Manteca, Ripon, Escalon, Lodi and part of Stockton

    District 12:  

    Incumbent: Jackie Speier (D)

    Current District:  Obama 74; McCain 24

    Proposed District:  Obama 74; McCain 24

    Proposed District Demographics:

    2000 Census: 50 white ; 3 black ; 0 native american ; 26 asian ; 16 hispanic ; 4 other

    Estimated 2006-2008: 48 white ; 2 black ; 0 native american ; 30 asian ; 17 hispanic ; 3 other

    Includes part of San Francisco and part of San Mateo Co. – Daly City, Brisbane, South San Francisco, Colma, San Bruno, Pacifica, Half Moon Bay, Millbrae, Burlingame, Hillsborough, Foster City, San Mateo, Belmont, San Carlos, Woodside and part of Redwood City

    District 13:

    Incumbent: Pete Stark (D)

    Current District:  Obama 74; McCain 24

    Proposed District:  Obama 75; McCain 23

    Proposed District Demographics:

    2000 Census: 36 white ; 8 black ; 1 native american ; 28 asian ; 22 hispanic ; 5 other

    Estimated 2006-2008: 32 white ; 7 black ; 0 native american ; 33 asian ; 25 hispanic ; 3 other

    New Asian-plurality district

    Includes part of Alameda Co. – Fremont, Newark, Union City, Hayward, San Leandro, Alameda, and part of Oakland

    District 14:  

    Incumbent: Anna Eshoo (D)

    Current District:  Obama 73; McCain 25

    Proposed District:  Obama 63; McCain 35

    Proposed District Demographics:

    2000 Census: 59 white ; 3 black ; 1 native american ; 9 asian ; 24 hispanic ; 3 other

    Estimated 2006-2008: 54 white ; 3 black ; 0 native american ; 11 asian ; 30 hispanic ; 2 other

    Includes part of San Mateo Co. – Menlo Park, Atherton, East Palo Alto, Portola Valley and part of Redwood City, part of Santa Clara Co. – Palo Alto, Mountain View, Los Altos, Los Altos Hills, Monte Sereno, part of Merced Co. – Los Banos, Gustine, and part of Stanislaus Co. – Turlock, Hughson, Waterford, Oakdale, Riverbank and part of Modesto (A bit over 50% of the new district is in Silicon Valley, while the remainder is in the Central Valley.)

    District 15:  

    Incumbent: Mike Honda (D)

    Current District:  Obama 68; McCain 30

    Proposed District:  Obama 69; McCain 29

    Proposed District Demographics:

    2000 Census: 44 white ; 2 black ; 0 native american ; 35 asian; 15 hispanic ; 3 other

    Estimated 2006-2008: 38 white ; 2 black ; 0 native american ; 42 asian ; 16 hispanic ; 2 other

    New Asian-plurality district

    Includes part of Santa Clara Co. – Milpitas, Santa Clara, Sunnyvale, Cupertino, Saratoga and part of San Jose

    District 16:

    Incumbent: Zoe Lofgren (D)

    Current District:  Obama 70; McCain 29

    Proposed District:  Obama 68; McCain 31

    Proposed District Demographics:

    2000 Census: 45 white ; 3 black ; 1 native american ; 20 asian ; 27 hispanic ; 3 other

    Estimated 2006-2008: 39 white ; 3 black ; 0 native american ; 25 asian ; 30 hispanic ; 2  other

    Includes part of Santa Clara Co. – Campbell, Los Gatos, Morgan Hill, Gilroy and part of San Jose

    Photobucket

    Photobucket

    District 17:

    Incumbent: Sam Farr (D)

    Current District:  Obama 72; McCain 26

    Proposed District:  Obama 63; McCain 35

    Proposed District Demographics:

    2000 Census: 67 white ; 2 black ; 1 native american ; 4 asian ; 22 hispanic ; 3 other

    Estimated 2006-2008: 63 white ; 2 black ; 1 native american ; 5 asian ; 27 hispanic ; 2 other

    Includes all of Santa Cruz Co., part of Monterey Co. – Monterey, Carmel, Pacific Grove, Del Rey Oaks, Sand City, Seaside, Marina, part of San Luis Obispo Co. – Paso Robles, Atascadero, Arroyo Grande, and part of Santa Barbara Co. – Lompoc, Buelton, Solvang

    District 18:  

    Incumbent: Dennis Cardoza (D)

    Current District:  Obama 59; McCain 39

    Proposed District:  Obama 61; McCain 37

    Proposed District Demographics:

    2000 Census: 34 white ; 4 black ; 1 native american ; 7 asian ; 50+ hispanic ; 3 other

    Estimated 2006-2008: 29 white ; 4 black ; 1 native american ; 7 asian ; 59 hispanic ; 2

    other

    New Hispanic-majority district

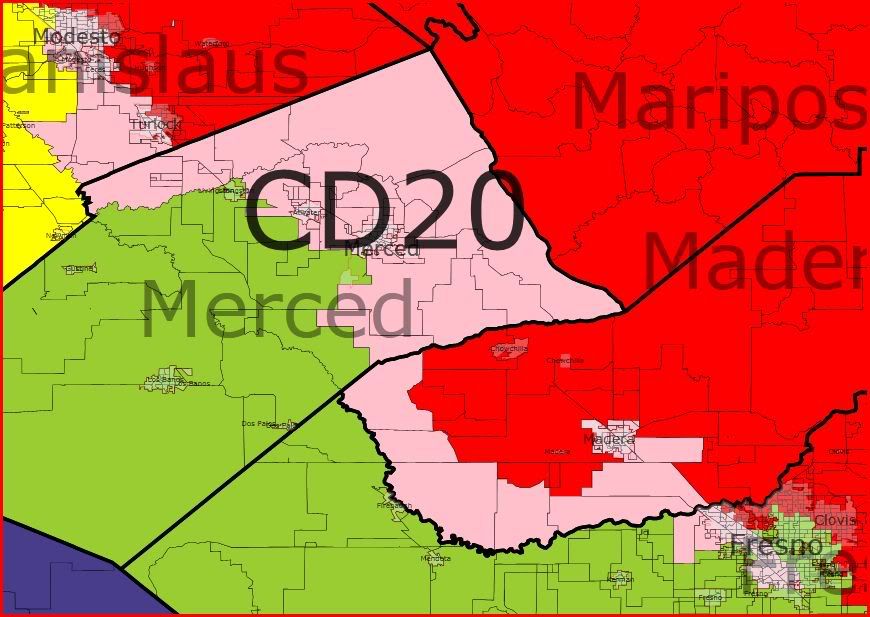
    Includes all of San Benito Co., part of Monterey Co. – Salinas, Gonzales, Soledad, Greenfield, King City, part of Merced Co. – Merced, Atwater, Livingston, Dos Palos, and part of Fresno Co. – Firebaugh, Mendota, San Joaquin, Coalinga, Huron, Kerman and part of city of Fresno

    District 19:  

    Incumbent: George Radanovich (R) (retiring)

    Current District:  Obama 46; McCain 52

    Proposed District:  Obama 45; McCain 53

    Proposed District Demographics:

    2000 Census: 40 white ; 2 black ; 1 native american ; 4 asian ; 50+ hispanic ; 2 other

    Estimated 2006-2008: 35 white ; 2 black ; 1 native american ; 4 asian ; 56 hispanic ; 1 other

    New Hispanic-majority district


    Includes part of Madera Co. – Madera, Chowchilla, part of Fresno Co. – Sanger, Reedley, Orange Cove, Kingsburg, part of Clovis and part of the city of Fresno, and part of Tulare Co. – Tulare, Porterville, Lindsay, Farmersville, Woodlake, Dinuba

    The territory contained in the proposed district is already over 50% Hispanic even under the 2000 Census numbers; it is estimated to be at least 56% Hispanic today.  The problem for Democrats is that a large proportion of the Hispanic population is undocumented and/or unregistered (also there’s a sizeable historical Portuguese population here which “skews” the Hispanic numbers).  Nevertheless, with demographic change over the next decade, this district can quickly turn our way despite the current GOP status (like CA-47 did in the 1990’s; remember Loretta Sanchez v. Bob Dornan)

    District 20:  

    Incumbent: Jim Costa (D)

    Current District:  Obama 60; McCain 39

    Proposed District:  Obama 61; McCain 37

    Proposed District Demographics:

    2000 Census: 22 white ; 8 black ; 2 native american ; 7 asian ; 59 hispanic ; 2 other

    Estimated 2006-2008: 20 white ; 8 black ; 1 native american ; 6 asian ; 64 hispanic ; 1 other

    Includes all of Kings Co.,  part of Fresno Co. – Fowler, Selma, Parlier and part of city of Fresno, and part of Kern Co. – Delano, McFarland, Wasco, Arvin and part of Bakersfield

    District 21:  

    Incumbent: Devin Nunes (R)*

    Current District:  Obama 42; McCain 56

    Proposed District:  Obama 66; McCain 33

    Proposed District Demographics:

    2000 Census: 31 white ; 6 black ; 1 native american ; 14 asian ; 45 hispanic ; 3 other

    Estimated 2006-2008: 25 white ; 6 black ; 1 native american ; 16 asian ; 50+ hispanic ; 2 other

    * District is completely “relocated” to another part of the Central Valley.  Most of Nunes’ current district is split between the new CA-19 and the new CA-22.

    New Hispanic-majority district

    New Democratic district

    Includes part of Santa Clara Co. – part of San Jose, part of Stanislaus Co. – Newman, Patterson, Ceres and part of Modesto, and part of San Joaquin Co. – Lathrop and most of Stockton

    District 22:  

    Incumbent: Kevin McCarthy (R)

    Current District:  Obama 38; McCain 60

    Proposed District:  Obama 34; McCain 64

    Proposed District Demographics:

    2000 Census: 70 white ; 3 black ; 1 native american ; 4 asian ; 19 hispanic ; 3 other

    Estimated 2006-2008: 65 white ; 3 black ; 1 native american ; 4 asian ; 24 hispanic ; 2 other

    Includes part of Madera Co., part of Fresno Co. – part of Clovis, part of Tulare Co. – Exeter, Visalia, and part of Kern Co. – Shafter, California City, Tehachapi, Ridgecrest and part of Bakersfield

    District 23:  

    Incumbent: Lois Capps (D)

    Current District:  Obama 66; McCain 32

    Proposed District:  Obama 62; McCain 36

    Proposed District Demographics:

    2000 Census: 57 white ; 2 black ; 1 native american ; 4 asian ; 34 hispanic ; 2 other

    Estimated 2006-2008: 53 white ; 2 black ; 0 native american ; 5 asian ; 39 hispanic ; 2 other

    Includes part of San Luis Obispo Co. – Morro Bay, San Luis Obispo, Pismo Beach, Grover Beach, part of Santa Barbara Co. – Santa Maria, Guadalupe, Santa Barbara, Carpinteria, and part of Ventura Co. – Ojai, Santa Paula, Filmore, Simi Valley and part of Oxnard

    Photobucket

    Photobucket

    Photobucket

    Photobucket

    District 24:  

    Incumbent: Elton Gallegly (R)

    Current District:  Obama 51; McCain 48

    Proposed District:  Obama 62; McCain 37

    Proposed District Demographics:

    2000 Census: 63 white ; 3 black ; 1 native american ; 6 asian ; 26 hispanic ; 3 other

    Estimated 2006-2008: 57 white ; 2 black ; 0 native american ; 7 asian ; 31 hispanic ; 2 other

    New Democratic district

    Includes part of Ventura Co. – Ventura, Port Hueneme, Camarillo, Moorpark, Thousand Oaks, and most of Oxnard, and part of Los Angeles Co. – Malibu, Santa Monica, Venice part of Los Angeles

    District 25:

    Incumbent: Howard McKeon (R)

    Current District:  Obama 49; McCain 48

    Proposed District:  Obama 63; McCain 35

    Proposed District Demographics:

    2000 Census: 30 white ; 7 black ; 1 native american ; 9 asian ; 50+ hispanic ; 2 other

    Estimated 2006-2008: 28 white ; 6 black ; 1 native american ; 9 asian ; 55 hispanic ; 1 other

    New Hispanic-majority district

    New Democratic district

    Includes all of Alpine, Mono and Inyo Counties, part of San Bernardino Co. – Adelanto, Victorville, and part of Los Angeles Co. – Baldwin Park, Irwindale, El Monte, Azusa, Covina, Claremont and parts of Pomona, Palmdale, Monrovia and Duarte

    District 26:  

    Incumbent: David Dreier (R)

    Current District:  Obama 51; McCain 47

    Proposed District:  Obama 62; McCain 37

    Proposed District Demographics:

    2000 Census: 24 white ; 6 black ; 1 native american ; 12 asian ; 55 hispanic ; 2 other

    Estimated 2006-2008: 21 white ; 5 black ; 0 native american ; 12 asian ; 60 hispanic ; 1 other

    New Hispanic-majority district

    New Democratic district

    Includes part of Los Angeles Co. – La Puente, South El Monte, Industry, West Covina, and part of Pomona, and part of San Bernardino Co. – Chino, Chino Hills, Montclair, and parts of Upland and Rancho Cucamonga

    District 27:  

    Incumbents: Brad Sherman (D)

    Current District:  Obama 66; McCain 32

    Proposed District:  Obama 64; McCain 34

    Proposed District Demographics:

    2000 Census: 54 white ; 5 black ; 1 native american ; 8 asian ; 29 hispanic ; 3 other

    Estimated 2006-2008: 52 white ; 5 black ; 0 native american ; 9 asian ; 32 hispanic ; 2 other

    Includes part of Kern Co. – Taft, Maricopa and part of Bakersfield, and part of Los Angeles Co. – part of Santa Clarita and part of the city of Los Angeles – parts of San Fernando Valley and Hollywood

    District 28:  

    Incumbent: Howard Berman (D)

    Current District:  Obama 76; McCain 22

    Proposed District:  Obama 64; McCain 34

    Proposed District Demographics:

    2000 Census: 26 white ; 7 black ; 1 native american ; 6 asian ; 58 hispanic ; 2 other

    Estimated 2006-2008: 25 white ; 6 black ; 0 native american ; 6 asian ; 62 hispanic ; 1 other

    Includes part of Los Angeles Co. – San Fernando, Lancaster, part of city of Los Angeles – San Fernando Valley, and part of Palmdale

    This district is very likely to elect a Hispanic representative at some point in the near future

    District 29:  

    Incumbent: Adam Schiff (D)

    Current District:  Obama 68; McCain 30

    Proposed District:  Obama 63; McCain 35

    Proposed District Demographics:

    2000 Census: 49 white ; 7 black ; 1 native american ; 9 asian ; 31 hispanic ; 4 other

    Estimated 2006-2008: 48 white ; 6 black ;  0 native american ; 10 asian ; 33 hispanic ; 2 other

    Includes part of Los Angeles Co. – Burbank, Pasadena, Sierra Madre, Bradbury, Glendora, San Dimas, La Verne and part of Los Angeles

    District 30:  

    Incumbent: Henry Waxman (D)

    Current District:  Obama 70; McCain 28

    Proposed District:  Obama 64; McCain 34

    Proposed District Demographics:

    2000 Census: 71 white ; 3 black ; 0 native american ; 10 asian ; 13 hispanic ; 3 other

    Estimated 2006-2008: 69 white ; 2 black ; 0 native american ; 11 asian ; 16 hispanic ; 2 other

    Includes part of Los Angeles Co. – Beverly Hills, West Hollywood, Calabassas, Hidden Hills, Agoura Hills, Westlake Village, part of Los Angeles – parts of Bel Air and San Fernando Valley, and most of Santa Clarita

    District 31:  

    Incumbent: Xavier Beccera (D)

    Current District:  Obama 80; McCain 18

    Proposed District:  Obama 72; McCain 26

    Proposed District Demographics:

    2000 Census: 25 white ; 5 black ; 1 native american ; 13 asian ; 53 hispanic ; 4 other

    Estimated 2006-2008: 24 white ; 4 black ; 0 native american ; 14 asian ; 56 hispanic ; 2 other

    Includes part of Los Angeles Co. – Glendale, La Canada Flintridge, and part of city of  Los Angeles

    District 32:  

    Incumbent: Judy Chu (D)

    Current District:  Obama 68; McCain 30

    Proposed District:  Obama 62; McCain 36

    Proposed District Demographics:

    2000 Census: 22 white ; 2 black ; 1 native american ; 42 asian ; 32 hispanic ; other

    Estimated 2006-2008: 20 white ; 2 black ; 0 native american ; 45 asian ; 32 hispanic ; 1 other

    New Asian-plurality district

    Includes part of Los Angeles Co. –  Monterey Park, Alhambra, South Pasadena, San Marino, Temple City, San Gabriel, Rosemead, Arcadia, Walnut, Diamond Bar, La Habra Heights, part of Montebello and part of Los Angeles

    The district becomes plurality Asian.  Many Hispanic-majority areas of the current CA-32 are detached in order to create the new Hispanic-majority CA-25 and CA-26 just to the north and east of the new CA-32.

    District 33:  

    Incumbent: Diane Watson (D) (retiring)

    Current District:  Obama 87; McCain 12

    Proposed District:  Obama 83; McCain 16

    Proposed District Demographics:

    2000 Census: 11 white ; 24 black ; 1 native american ; 11 asian ; 52 hispanic ; 2 other

    Estimated 2006-2008: 11 white ; 21 black ; 0 native american ; 11 asian ; 56 hispanic ; 1 other

    New Hispanic-majority district

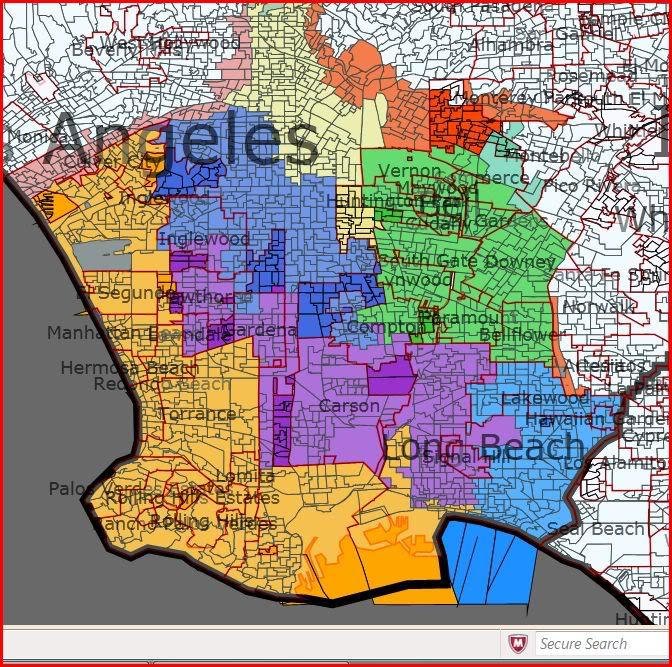
    Includes part of Los Angeles Co. – Lawndale, Culver City, and parts of Los Angeles, Inglewood and Hawthorne

    District 34:  

    Incumbent: Lucille Roybal-Allard (D)

    Current District:  Obama 75; McCain 23

    Proposed District:  Obama 70; McCain 28

    Proposed District Demographics:

    2000 Census: 26 white ; 6 black ; 1 native american ; 11 asian ; 54 hispanic ; 2 other

    Estimated 2006-2008: 24 white ; 5 black ; 0 native american ; 12 asian ; 57 hispanic ; 1 other

    Includes part of Los Angeles Co. –  Downey, Bellflower, Signal Hill, Vernon, Maywood, Bell Gardens, and parts of Los Angeles and Long Beach

    District 35:  

    Incumbent: Maxine Waters (D)

    Current District:  Obama 84; McCain 14

    Proposed District:  Obama 82; McCain 16

    Proposed District Demographics:

    2000 Census: 15 white ; 43 black ; 1 native american ; 9 asian ; 31 hispanic ; 2 other

    Estimated 2006-2008: 15 white ; 40 black ; 0 native american ; 9 asian ; 34 hispanic ; 2 other

    New African-American plurality district – yes, that may sound strange, but the current CA-35 is already over 50% Hispanic; this plan combines the most African-American parts of several districts into one; otherwise, there’s a good chance a black representative may not hold a single seat in southern California at some point during the next decade, as much of south-central LA has become Hispanic-majority

    Includes part of Los Angeles Co. –  Rancho Palos Verdes, Rolling Hills, Rolling Hills Estates, Avalon, and parts of Compton, Carson, Inglewood, Gardena and Hawthorne and Los Angeles (south central area and San Pedro)

    District 36:  

    Incumbent: Jane Harman (D)

    Current District:  Obama 64; McCain 34

    Proposed District:  Obama 64; McCain 35

    Proposed District Demographics:

    2000 Census: 58 white ; 5 black ; 0 native american ; 16 asian ; 17 hispanic ; 4 other

    Estimated 2006-2008: 58 white ; 4 black ; 0 native american ; 18 asian ; 18 hispanic ; 2 other

    Includes part of Los Angeles Co. – Palos Verdes Estates, Torrance, Lomita, Redondo Beach, Manhattan Beach, Hermosa Beach, El Segundo, and parts of Gardena and Los Angeles – Pacific Palisades, Brentwood, West LA and area around LAX

    District 37:  

    Incumbents: Laura Richardson (D)

    Current District:  Obama 80; McCain 19

    Proposed District:  Obama 69; McCain 29

    Proposed District Demographics:

    2000 Census: 21 white ; 11 black ; 1 native american ; 11 asian ; 54 hispanic ; 2 other

    Estimated 2006-2008: 21 white ; 10 black ; 0 native american ; 12 asian ; 57 hispanic ; 1 other

    New Hispanic-majority district


    Includes part of Los Angeles Co. –  Paramount, Huntington Park, Bell, Cudahy, and parts of Los Angeles and Long Beach, and part of Orange Co. – Los Alamitos, Cypress, La Palma

    District 38:  

    Incumbent: Grace Napolitano (D)

    Current District:  Obama 71; McCain 27

    Proposed District:  Obama 62; McCain 36

    Proposed District Demographics:

    2000 Census: 25 white ; 2 black ; 1 native american ; 8 asian ; 62 hispanic ; 2 other

    Estimated 2006-2008: 23 white ; 1 black ; 0 native american ; 8 asian ; 66 hispanic ; 1 other

    Includes part of Los Angeles Co. –  Whittier, Norwalk, La Mirada, Santa Fe Springs, East LA, and parts of Los Angeles, Montebello and Pico Rivera, and part of Orange Co. – Fullerton, La Habra

    District 39:

    Incumbent: Linda Sánchez (D)

    Current District:  Obama 65; McCain 32

    Proposed District:  Obama 62; McCain 36

    Proposed District Demographics:

    2000 Census: 24 white ; 3 black ; 1 native american ; 15 asian ; 55 hispanic ; 2 other

    Estimated 2006-2008: 22 white ; 3 black ; 0 native american ; 16 asian ; 58 hispanic ; 1 other

    Includes part of Los Angeles Co. –  Lakewood, Hawaiian Gardens, Artesia, Cerritos, and parts of Los Angeles and Pico Rivera, and part of Orange Co. – Buena Park, Stanton and part of Anaheim

    District 40:  

    Incumbent: Ed Royce (R)

    Current District:  Obama 47; McCain 51

    Proposed District:  Obama 42; McCain 56

    Proposed District Demographics:

    2000 Census: 58 white ; 1 black ; 1 native american ; 19 asian ; 18 hispanic ; 2 other

    Estimated 2006-2008: 53 white ; 1 black ; 0 native american ; 23 asian ; 21 hispanic ; 2 other

    Includes part of Orange Co. – Brea, Yorba Linda, Placentia, Garden Grove, Fountain Valley, Newport Beach and part of Anaheim

    Photobucket

    Photobucket

    Photobucket

    Photobucket

    Photobucket

    District 41:  

    Incumbent: Jerry Lewis (R)

    Current District:  Obama 44; McCain 54

    Proposed District:  Obama 40; McCain 58

    Proposed District Demographics:

    2000 Census: 69 white ; 4 black ; 1 native american ; 3 asian ; 19 hispanic ; 3 other

    Estimated 2006-2008: 62 white ; 4 black ; 1 native american ; 5 asian ; 26 hispanic ; 2 other

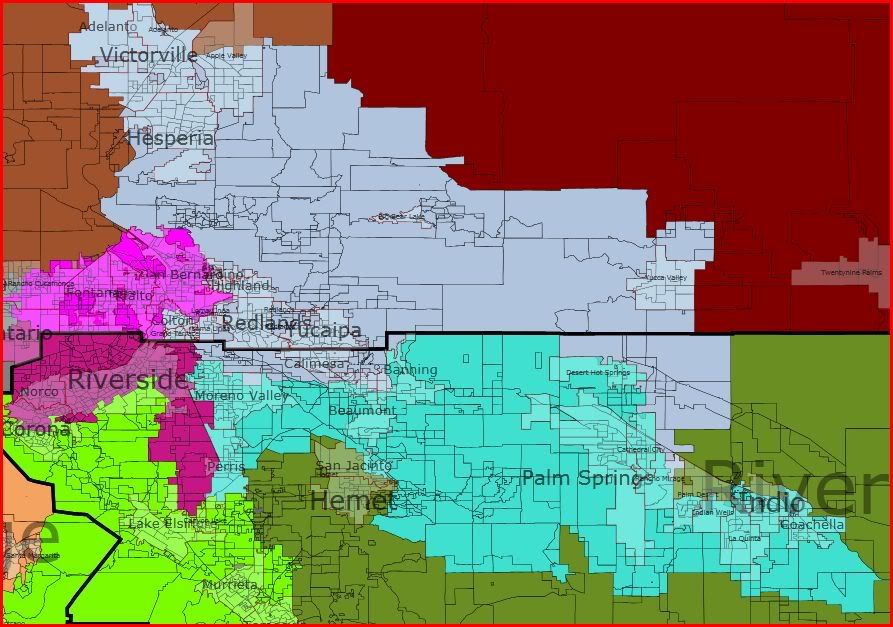
    Includes part of San Bernardino Co. – Hesperia, Apple Valley, Barstow, Needles, Twentynine Palms, Yucca Valley, Big Bear Lake, Yucaipa, Grand Terrace, and parts of

    Upland and Redlands, and part of Riverside Co. – Banning, Beaumont, Calimesa

    District 42:  

    Incumbent: Gary Miller (R)

    Current District:  Obama 45; McCain 53

    Proposed District:  Obama 43; McCain 55

    Proposed District Demographics:

    2000 Census: 72 white ; 1 black ; 0 native american ; 9 asian ; 14 hispanic ; 3 other

    Estimated 2006-2008: 68 white ; 1 black ; 0 native american ; 11 asian ; 17 hispanic ; 2 other

    Includes part of Orange Co. – San Clemente, Dana Point, San Juan Capistrano, Laguna Niguel, Laguna Woods, Laguna Hills, Lake Forest, Orange, Villa Park, Mission Viejo, Rancho Santa Margarita

    District 43:  

    Incumbent: Joe Baca (D)

    Current District:  Obama 68; McCain 30

    Proposed District:  Obama 65; McCain 33

    Proposed District Demographics:

    2000 Census: 28 white ; 13 black ; 1 native american ; 4 asian ; 50+ hispanic ; 2 other

    Estimated 2006-2008: 22 white ; 12 black ; 0 native american ; 5 asian ; 59 hispanic ; 2 other

    Includes part of San Bernardino Co. – city of San Bernardino, Colton, Rialto, Fontana, Highland, Loma Linda, part of Redlands

    District 44:

    Incumbent: Ken Calvert (R)

    Current District:  Obama 50; McCain 49

    Proposed District:  Obama 43; McCain 55

    Proposed District Demographics:

    2000 Census: 66 white ; 4 black ; 1 native american ; 4 asian ; 23 hispanic ; 2 other

    Estimated 2006-2008: 56 white ; 4 black ; 1 native american ; 6 asian ; 32 hispanic ; 2 other

    Includes part of Riverside Co. – Norco, Corona, Canyon Lake, Murrietta, San Jacinto, Hemet, and part of city of Riverside

    District 45:  

    Incumbent: Mary Bono (R)

    Current District:  Obama 52; McCain 47

    Proposed District:  Obama 65; McCain 34

    Proposed District Demographics:

    2000 Census: 33 white ; 10 black ; 1 native american ; 4 asian ; 50+ hispanic ; 2 other

    Estimated 2006-2008: 28 white ; 9 black ; 1 native american ; 4 asian ; 57 hispanic ; 2 other

    New Hispanic-majority district

    New Democratic district

    Includes part of Riverside Co. – Moreno Valley, Perris, Lake Elsinore, Palm Springs, Desert Hot Springs, Cathedral City, Indio, Coachella, Blythe and part of city of Riverside

    District 46:  

    Incumbent: Dana Rohrabacher (R)

    Current District:  Obama 48; McCain 50

    Proposed District:  Obama 64; McCain 34

    Proposed District Demographics:

    2000 Census: 27 white ; 10 black ; 1 native american ; 7 asian ; 54 hispanic ; 1 other

    Estimated 2006-2008: 24 white ; 9 black ; 0 native american ; 8 asian ; 58 hispanic ; 1 other

    New Hispanic-majority district

    New Democratic district

    Includes part of Los Angeles Co. –  Lynwood, South Gate, and parts of Compton, Carson and city of Los Angeles, and part of Orange Co. – Seal Beach, Westminster, Huntington Beach

    District 47:  

    Incumbent: Loretta Sanchez (D)

    Current District:  Obama 60; McCain 38

    Proposed District:  Obama 62; McCain 36

    Proposed District Demographics:

    2000 Census: 33 white ; 2 black ; 1 native american ; 12 asian ; 51 hispanic ; 2 other

    Estimated 2006-2008: 28 white ; 2 black ; 0 native american ; 13 asian ; 55 hispanic ; 1 other

    Includes part of Orange Co. – Santa Ana, Irvine, Costa Mesa, Tustin, Laguna Beach, Aliso Viejo

    District 48:  

    Incumbent: John Campbell (R)*

    Current District:  Obama 49; McCain 49

    Proposed District:  Obama 62; McCain 36

    Proposed District Demographics:

    2000 Census: 33 white ; 8 black ; 1 native american ; 5 asian ; 50+ hispanic ; 2 other

    Estimated 2006-2008: 27 white ; 7 black ; 0 native american ; 7 asian ; 58 hispanic ; 2 other

    * District is completely “relocated” to another part of Southern California

    New Hispanic-majority district

    New Democratic district

    Includes part of San Bernardino Co. – Ontario, and parts of Fontana and Rancho Cucamonga, and part of Riverside Co. – part of city of Riverside and part of Corona

    District 49:  

    Incumbent: Darrell Issa (R)

    Current District:  Obama 45; McCain 53

    Proposed District:  Obama 47; McCain 51

    Proposed District Demographics:

    2000 Census: 59 white ; 4 black ; 1 native american ; 6 asian ; 28 hispanic ; 3 other

    Estimated 2006-2008: 54 white ; 3 black ; 0 native american ; 6 asian ; 34 hispanic ; 2 other

    Includes part of San Diego County – Oceanside, Vista, Carlsbad, San Marcos, Escondido, Camp Pendleton

    This district becomes slightly more Democratic, and there’s a chance it may go our way sometime during the next decade if demographic changes here proceed along the current path.

    District 50:  

    Incumbent: Brian Bilbray (R)

    Current District:  Obama 51; McCain 47

    Proposed District:  Obama 62; McCain 37

    Proposed District Demographics:

    2000 Census: 60 white ; 4 black ; 1 native american ; 14 asian ; 17 hispanic ; 3 other

    Estimated 2006-2008: 57 white ; 4 black ; 0 native american ; 16 asian ; 20 hispanic ; 3 other

    New Democratic district

    Includes part of San Diego County – northern part of San Diego, Del Mar, Solana Beach, Encinitas and coastal areas of Carlsbad and Oceanside

    District 51:  

    Incumbent: Bob Filner (D)

    Current District:  Obama 63; McCain 35

    Proposed District:  Obama 62; McCain 37

    Proposed District Demographics:

    2000 Census: 24 white ; 7 black ; 1 native american ; 13 asian ; 53 hispanic ; 3 other

    Estimated 2006-2008: 21 white ; 6 black ; 1 native american ; 13 asian ; 57 hispanic ; 2 other

    Includes all of Imperial Co., and part of San Diego County – southern part of San Diego, Chula Vista, Imperial Beach, Lemon Grove

    This district is very likely to elect a Hispanic representative at some point in the near future

    District 52:  

    Incumbent: Duncan Hunter (R)

    Current District:  Obama 45; McCain 53

    Proposed District:  Obama 38; McCain 60

    Proposed District Demographics:

    2000 Census: 75 white ; 2 black ; 1 native american ; 3 asian ;16 hispanic ; 2 other

    Estimated 2006-2008: 71 white ; 2 black ; 1 native american ; 4 asian ; 20 hispanic ; 2 other

    Includes part of San Diego County – Poway, Santee, and part of Riverside Co. – Temecula, La Quinta, Indian Wells, Palm Desert, Rancho Mirage

    District 53:  

    Incumbent: Susan Davis (D)

    Current District:  Obama 68; McCain 30

    Proposed District:  Obama 62; McCain 37

    Proposed District Demographics:

    2000 Census: 53 white ; 9 black ; 1 native american ; 7 asian ; 27 hispanic ; 3 other

    Estimated 2006-2008: 51 white ; 8 black ; 1 native american ; 8 asian ; 30 hispanic ; 3 other

    Includes part of San Diego County – central part of San Diego, Coronado, La Mesa, El Cajon

    And that’s it for my plan … Thanks for comments and suggestions.

    Fundraising Update: The Race for Scott Brown’s Seat

    Today thanks to OCPF (the state’s Office of Campaign and Political Finance) we got a first look at the fundraising prowess of the three candidates for Scott Brown’s The People’s state senate seat. Political newcomer and Emergency Room Physician Dr. Peter Smulowitz of Needham handily outraised his opponents, both of whom are sitting State Reps. This is very unusual, as incumbent elected officials almost always have the advantage when it comes to fundraising.

    Democratic State Rep. Lida Harkins of Needham raised a little over $48,000, and has spent about $27,000 so far.

    http://www.efs.cpf.state.ma.us…

    Republican State Rep. Richard Ross of Wrentham raised over $55,000 and spent almost $31,000

    http://www.efs.cpf.state.ma.us…

    Smulowitz, on the other hand, has raised more than $69,000 so far, although he has already burned through more than $66,000, about half of it on direct mail by the looks of it.

    http://www.efs.cpf.state.ma.us…

    How doe this alter the race? Well, money doesn’t vote, but that said it’s obviously better to have more than your opponent rather than less. I think it’s important to notice that while Rep. Harkins seems to be saving some of her haul for after the Democratic Primary, Smulowitz appears to be spending everything he’s got on the primary itself.

    For a political newcomer who is facing off against a well-known local official, this is probably wise.

    It’s probably also important to note that a sizable chunk of Rep. Harkins’ money came from registered lobbyists and her own colleagues in the legislature. These individuals have a much lower limit on how much money they can give to individual candidates each cycle in Massachusetts, so that could make her fundraising more complicated going forward. Smulowitz and Ross will probably be able to go back to their non-lobbyist/elected official donors and hit them up for more money later- Harkins won’t have that option.

    SSP Daily Digest: 4/5 (Afternoon Edition)

    AZ-Sen: Looks like the Maverick has finally been broken (as he’s decided that it’s preferable to spend six years chewing his cud while fenced in the GOP pasture, instead of getting sent prematurely to the glue factory). In the face of a potentially serious primary from the right from J.D. Hayworth, John McCain says not only is he no longer a maverick, but he “never considered himself a maverick.” (Except for in all those campaign ads from two years ago?) In response, Hayworth said McCain is trying to “encourage amnesia.”

    CA-Sen, CA-Gov: There’s a new LA Times/USC poll of the two major races in California, with a mixed bag of results for Democrats. Like most pollsters, they find that Republican Meg Whitman has pulled into a small lead over Jerry Brown in the governor’s race, thanks to her nonstop deluge of self-funded advertising; she leads Brown 44-41, while she leads Steve Poizner in the GOP primary 60-20. On the Senate side, Barbara Boxer leads a Generic Republican by a surprisingly wide 48-34. Polling Generic R seems pretty weird, though, considering that there are only two likely opponents for her: Tom Campbell leads Carly Fiorina in the GOP primary 29-25, with Chuck DeVore lagging at 9. One other bit of good news for Dems: by a 46-29 margin, voters prefer to back a candidate who backed health care reform.

    CO-Sen: Michael Bennet is playing it safe, making plans for a petition drive to make sure his name is on the ballot in November. He needs at least 30% at the Democratic state convention to qualify, but his Plan B seems to be an acknowledgment that he may be facing a rough time at the convention too. Remember that he lost at the caucus level to former state House speaker Andrew Romanoff (whose main source of strength seems to be insiders and activists, rather than the broader population).

    IN-Sen: CQ takes a look at the NRSC’s private teeth-gnashing over the possibility that kooky ex-Rep. John Hostettler might beat ex-Sen. Dan Coats in the primary, something that can’t be ruled out in an anti-establishment year like this one. They’d then have to decide whether they want to financially prop up Hostettler, a legendarily poor fundraiser who’s relied on shoestring campaigns and religious right ground troops. Still, a reasonably competent Hostettler ought to be able to make short work of Coats in the GOP primary, given the amount of material he has to work with: for instance, it turns out that Coats, when lobbying for King & Spaulding, lobbied Congress in favor of cap and trade, the same legislation he claims he now opposes.

    NV-Sen: If there’s one reason not to quite count out Harry Reid yet, it’s his ability to bring in the campaign cash. He brought in more than $1.5 million for the quarter, giving him more than $10 million in receipts so far this cycle. Sue Lowden, ostensibly the GOP’s top contender, says she raised about $500K and will match that dollar-for-dollar from her own personal stash. Danny Tarkanian raised $445K last quarter.

    NY-Sen-B (pdf): These numbers are a little stale, but we found there were some more useful numbers buried in that Marist poll from last week where the topline was just the usual rigamarole about the Kirsten Gillibrand vs. George Pataki matchup that’s very unlikely to happen (especially not if Al D’Amato has anything to say about it). They also tested some head-to-heads with the lesser GOPers who are actually in the race: Gillibrand beats Bruce Blakeman 54-25, Joe DioGuardi 54-27, and David Malpass 54-25. They also looked at the GOP primary, finding DioGuardi winning it with 18, followed by Blakeman at 10, Malpass at 9, and non-candidate Dan Senor at 4. A permutation including Pataki finds Pataki at 62, with DioGuardi at 7, Blakeman at 4, and Malpass and Senor at 2. In other news, Gillibrand picked up an endorsement today from one of her biggest skeptics, Assemblyman and Kings Co. Dem chair Vito Lopez. Lopez had been considering backing Harold Ford Jr., way back in those heady days of February.

    WA-Sen: Dino Rossi is still saying he’s “completely undecided” about running for Senate, but will do it if he thinks he has a “50% chance” of winning. Here’s one more bit that might help move his decision along, though: financially, he’d be starting from scratch against Patty Murray, who raked in another $1 million last quarter, bringing her total war chest to $5.9 million.

    AL-Gov: I gather from the comments that SSP is full of mustache aficionados, and this news might prove heartbreaking to them: Ron Sparks shaved off his legendary ‘stache. He says this was a spur-of-the-moment decision at the barber shop (and hopefully not the result of thorough focus grouping?). I just hope Travis Childers doesn’t decide to follow suit.

    NY-Gov: Wealthy businessman Carl Paladino has decided to go ahead with his teabaggish-sounding campaign for Governor, kicking off his bid today in Buffalo. He’ll be running in the GOP primary, although he’d previously made noises about a possible independent run. Unfortunately, his rollout might be overshadowed by other news today… that he had a daughter with his mistress 10 years ago, and kept the child secret from his wife until last year.

    OH-Gov: In response to pressure to release his financials, John Kasich released his 2008 tax returns. Kasich earned $615K from now-kaput Lehman Brothers in 2008, including $183K base and a $432K bonus (but no “golden parachute” as Lehman Brothers collapsed). Oh, by the way, he also earned $265K as a Fox News commentator, $166K in speaking fees, $62K as an associate for Schottenstein Property Group, $45K as an Ohio State Univ. lecturer, $77K for being on the board of directors of two companies, and $122K in interest and dividends. Just your average teabagging Joe Lunchpail.

    HI-01: Charles Djou is trying to get some mileage out of the fact that neither Ed Case nor Colleen Hanabusa lives in HI-01. This kind of thing usually doesn’t matter much even in most other states, and seems to matter even less in Hawaii, though, where the island of Oahu gets split between the two districts and no one seems to care that Mazie Hirono lives in the 1st instead of HI-02.

    CO-04: Rep. Betsy Markey is near the top of most people’s vulnerable Dems lists, especially after her pro-HCR vote, but her cash haul may go along way toward allaying fears. She pulled in $505K, with $355K of that coming between Mar. 21 (the HCR vote) and Mar. 31. Her vote (plus being in Sarah Palin’s sorta-metaphorical crosshairs) seems to have helped, not hurt. Likely GOP opponent Cory Gardner raised only $75K last quarter after the HCR vote.

    ND-AL: One GOPer who is doing well on the fundraising front is state Rep. Rick Berg, who pulled in $483K in the first quarter. $330K of that came in the last 10 days of the quarter, although that seems to have more to do with his winning the state party’s endorsement rather than the HCR vote. Most of the rest of that took the form of $100K from his own pocket. Between this and the downdraft from John Hoeven at the top of the ballot, looks like Rep. Earl Pomeroy’s in for a real race this year.

    PA-06: Doug Pike picked up another labor endorsement, and it’s a big one: the AFL-CIO. They also backed Paul Kanjorski in the 11th, who’s being challenged by Corey O’Brien in the primary.

    RI-01: Here’s one more huge House Democratic fundraising haul, although this isn’t a race that the DCCC has been sweating too hard. Providence mayor David Cicilline pulled in a huge $725K (although some of that was checks re-written away from his mayoral fund to his newly-established House fund). His main Democratic rival, former state party chair William Lynch, raised $230K (including $100K of his own money).

    TX-17: Bill Flores pulled in an endorsement that will help in his GOP primary runoff against Rob Curnock, from perhaps the most unlikable man in the entirety of American politics, ex-Sen. Phil Gramm. In fact, that district may be conservative enough that it might still be a positive in the general.

    LA-LG: Republican SoS Jay Dardenne’s plan for an easy upgrade to the position of Lt. Governor (left vacant by Mitch Landrieu’s move to mayor of New Orleans) ran into a bit of a snag. He’s facing GOP primary opposition now from the state GOP chair, Roger Villere.

    CA-Init: Proposition 15 looks to be the only interesting initiative on the June primary ballot in California, and it lays some important groundwork for countering the flood of corporate money into elections. The Fair Elections Act, as it’s called, is a pilot program for public financing of state races; if passed, it’ll publicly fund the 2014 and 2018 Secretary of State races, which, if successful, could lead to a broader system.
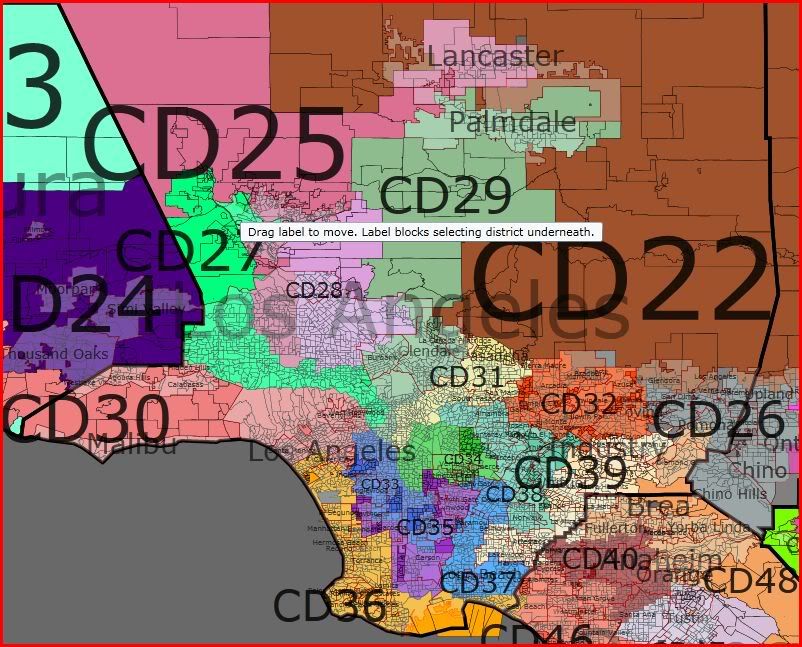
    Fundraising: There are a number of other fundraising roundups today, courtesy of National Journal’s Reid Wilson and also the crew at TPM. Other highlights include Tom Campbell, Pat Toomey, Bob Dold!, Colleen Hanabusa, Bruce O’Donoghue, and various OR-Gov contestants.
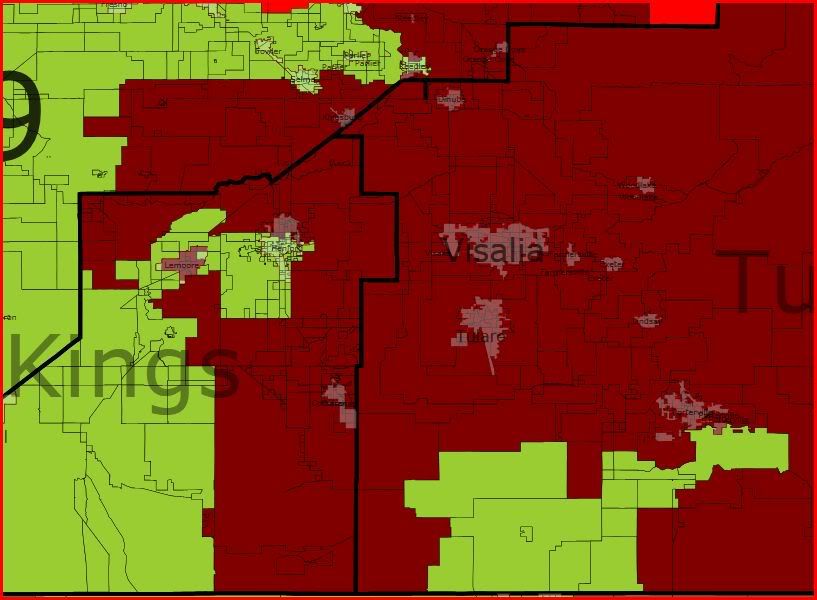
    Teabaggers: Ed Kilgore continues his hot streak of dismantling the myth of the teabaggers, pointing to today’s Gallup/USA Today poll as more evidence that they’re nothing more than louder, angrier Republicans (who’d like access to a time machine). Only 7% say they’re Democrats, and while many say they’re independents, all evidence suggests they’re not from the center but those indies who think the GOP is too establishment, too liberal, or just too unsalvageable.
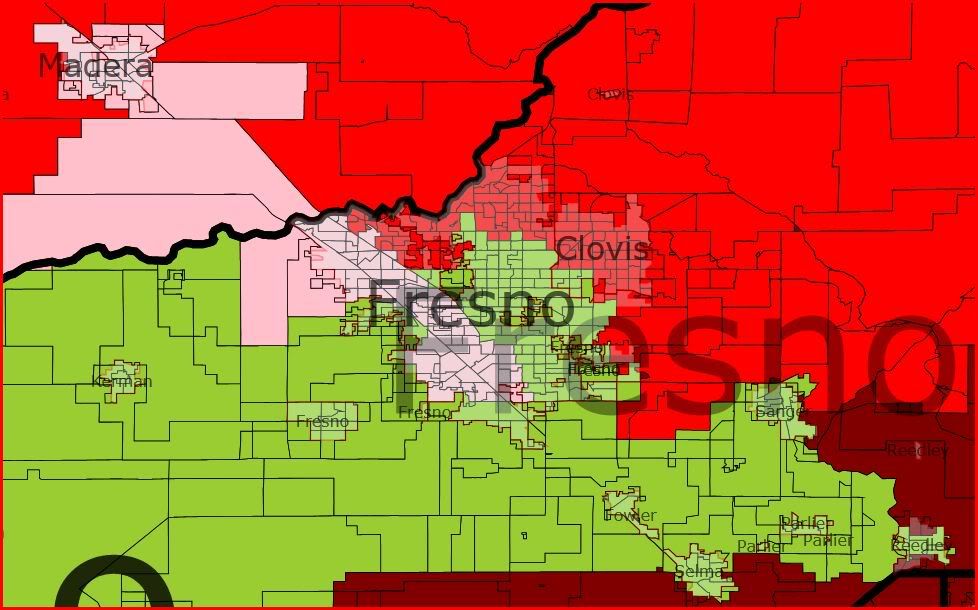
    RNC: You might remember several weeks ago the RNC lost a case in the D.C. District Court, squelching their desires for unlimited “soft money” contributions, which they felt they should be able to do in the wake of Citizens United. The RNC has decided to go ahead and appeal the case to the Supreme Court, although it doesn’t seem likely it’ll be decided in time for this year’s general election. (If you’re wondering why the case is bypassing the DC Circuit, McCain-Feingold allows challenges to it to leapfrog directly from the trial level to SCOTUS.)

    Census: Here’s an interesting tidbit: despite her early anti-Census fearmongering, Michele Bachmann’s district is actually well outpacing much of the nation on Census form return rates. Counties in her district have had an especially high return rate, ranging from 68-71% (compared with the current national average of 50%). Perhaps Republicans have decided it’s better in the long-term to, y’know, get conservative parts of the country to get accurately represented, rather than to try to appeal to the black-helicopters fringes, if Karl Rove cutting an ad urging Census participation is any indication.

    O2B: Finally, over at the Great Orange Satan, there’s an open call for nominations for the Orange to Blue program. Stop by and suggest some names of candidates who should get the netroots’ financial help this year.

    California Democratic Gerrymander

    California Democratic Gerrymander

    CalDem 4-2010PDF1

    CalDem 4-2010 PDF2

    4-2010 California

    Photobucket

    CD01 Dark blue. Marin to CD08 so that this district could extend further north.  Woolsey now lives here.  Mostly new to her except for Sonoma County, which is the base of the district.  Coastal areas Democratic, inland Republican.  The old 6th district, where she was before, had 76% Obama, the new 1st 59% Obama.  The more conservative inland D’s might be a problem for her brand of politics, but the move is part of a key for dismantling CD04 in Northern California. Safe Dem

    CD02. Dark Green, North State. Safe R. The old  CD02 is gone. This is basically the old CD04, sans the area it had in Sacramento County.  Wally Herger [02] could move here or fight a 60% Obama vote where he is now, in CD06. Of course Tom McClintock [04] still lives here, and it is basically his old district.  

    Photobucket

    CD03. Purple, Sacramento. Safe Dem. 60% Obama. It has acquired 1/2 of Sacramento. As near as I can tell Dan Lungren [R] lives here now, tho he may be in CD05. Either way the district is safe D. The key to a D gerrymander of Sacramento is to split the city between two districts. Without this split you get one supersafe district and one swing, or lean R.

    I dont know if Matsui is in CD03 or CD05, but boundaries within the city of Sacramento could be changed to adjust rather easily.

    CD05 Dark Yellow, Sacramento. Safe Dem. The other half of Sacramento City, with county areas.  Not sure if Matsui lives here or in CD03, but both safe D.

    CD06 Napa, Butte Counties. Safe D.  Moved north into the Sacramento Vally. Butte and Lake Counties lean or swing. Loses Dem coastal counties. Mike Thompson, of the old CD01, now lives here, but retains his base of Napa with some of Sonoma.  

    CD10. Pink, Solano County. The next part of the dismemberment of CD02 is the extenstion of CD10 to the lower Sacramento Valley.  I also extend it to include Garamendis home in Sacramento County, allowing me to avoid the ads calling him a carpetbagger. Now entireley north of the Sacramento, San Joaquin rivers.

    4-2010 BayArea

    CD07. Gray, north of Oakland. Safe D. Gray Similar to old 7th. George Martinez should have no problems.

    CD08. San Francisco, Marin. Safe D. Nancy Pelosi. I moved Marin County into her district. I suspect that if she objects to this, it wont happen, but this is a key to enabling the new 1st and 6th districts moving north to eliminate the old 2nd.

    CD09. Light blue, Oakland. Safe D. similar to old district.  Barbara Lee should have no problems here.

    CD11. Light Green, east of Oakland and Fremont. Safe D. McNerney now is completelly in the Bay area, from 54% to a new 62% D.

    CD12. North San Mateo County, San Francisco. Safe D. Jackie Speier is safe here.  

    CD13. Safe D. Fremont, Hayward. Pete Stark has no worries.

    CD14. San Mateo, Santa Clara County. Safe D. Anna Eshoo.

    CD15. Orange, San Jose. Safe D. Mike Honda.

    CD16. Bright Green, San Jose. Safe D. Zoe Lofgren.

    Photobucket

    CD04. Dark Red, Eastern San Joaquin Valley. Safe Rep.  This district is actually the old 19th district, on the eastern San Joaquin Valley. I think that it might be most accurate to say that the old 2nd district, R, was evicted from the Sacramento Valley, to reappear as the new 19th district [D], in the eastern San Joaquin Valley.  old 2nd eliminated, with brand new 19th

            4th renamed new 2nd

            19th renamed as new 4

    CD17.  Purplish, Monterey County. Safe D. Few changes.  Sam Farr.

    CD18. Yellow, San Joaquin, Stanislaus County. Safe or Likely D. Loses Modesto, but still 57% Democratic. Dennis Cardoza.

    CD19.  Green, Western San Joaquin County. Safe D. Brand new district on on the west of San Joaquin Valley. Based in Fresno.  Dont know if jim Costa lives here or in the new 20- but he has his choice.  No incumbents.

    CD20. Pink. Central San Joaquin Valley. Safe Dem. Jim Costa. Fresno, Merced and Modesto cities. Lost Bakersfield.

    CD21. Dark Brown, Tulare County. Safe R. still based in Tulare County.  Devin Nunes incumbent.

    CD22. Light Brown, Kern County. Safe R. Republican parts of Bakersfield and lots of desert.  Kevin McCarthy. if he doesnt live in the right part of Bakersfield, he can rent a fake apartment like Delay did.

    CD23. Light Blue, Santa Barbara. Safe or Likely D. All of Santa Barbara and San Luis Obispo Counties, instead of hugging the coast. Lois Capps.

    CD24. Dark Purple, Ventura. Safe or Likely D. Now entirely in Ventura County.  

    CD25. Pink, Kern and N. LA County. Likely or Lean D as a district. Howard McKeon[R] goes from 49% to 55% Obama. As incumbent he may very well survive.  Democratic Fresno with the most Dem. areas of N. LA County I could find, with a large dollop of the Democratic strongholds south of the mountain range. The principle problem with this map is that when the actual census figures for the cities of the San Joaquin valley come out, 18, 19, and 20 may need the Democratic votes in Bakersfield.

    Photobucket

    CD26. Grey, eastern LA County. Likely D. Lost the more Repuclican parts of the district and gained Dem areas. Most of San Dimas, where David Dreir[R] lives, is still in the district, but it went from 51 to 56% Obama.

    CD27. Santa Clarita, Bright Greenish. Safe D. Brad Sherman, Sherman Oaks.  Extended an arm North to take in part of Santa Clarita.   68% Dem.

    CD28.  Pinkish, San Fernando City. Safe D. Hispanic 62% instead of 72%. Howard Berman. Extended an arm north to take in part of Santa Clarita. 72% Dem

    CD29. Greenish. Palmdale, Glendale. Safe D. Adam Schiff, Burbank. Goes north to take in Palmdale, but still 65% Dem.

    CD30. Spans LA County and Ventura County. Safe D. Goes west into Ventura County to take in some R areas. Still 71% Dem.  Henry Waxman.

    CD31. Light yellow, Pasadena. Safe D. Moves east to take Pasadena. Xavier Becerra- lives in LA, and I cant tell if he is still here.

    CD32. Bright orange, Baldwin Park. Safe D.  Moves north to take in some of the old 26th.  Hilda Solis.

    CD33. Dark blue, Inglewood. Safe D. Only Black majority district on the list. Diane Watson, LA. hard to tell where she lives.

    CD34. Green, Vernon, Commerce. Safe D. Lucille Roybal-Allaard. Lives Los Angeles City. Hard to tell if still in district.

    CD35. Purple, Carson, Lynwood.  Safe D. Maxine Waltrs. designed to take in the non-black majority areas around CD33. 67% Hispanic.

    CD36. Yellowish. Safe D. Coastal LA County. Takes in most of the Rep. leaning areas, [trending D?] of CD46 which was in LA County. Because of this, it dropped precipitously from 64 to 61% Obama.  

    CD37. Blue, Long Beach. Safe D. Moved east, taking in some R areas. still 70% D.  Laura Richardson, D.

    CD38. Light blue, Norwalk, Alhambra. Safe D. Grace Napolitano, D.

    CD39. Very light yellow, Alhambra, Lakewood. Safe or Likely D. Takes in some R. areas, especially in Orange County, to help out CD47 and CD40. Linda Sanchez, D. From 65 to 57% Obama.

    Photobucket

    CD40. Dark Brown, Western Anaheim. Safe or Likely D. from 47 to 56% Democratic.  Edward Royce, R, will have to work for his money.  This is one of two Orange County districts constructed from every Dem vote I could find. Loretta Sanchez, [D, CD47] lives in Anaheim, which is now split between the new CD40 and the new CD48[R]. Most of the old CD47 seems to be in the new CD40.

    CD46. Orangish, coastal Orange County. Huntingdon Beach. Safe R. Dana Rohrbacher[R] moved out of LA to obtain some R districts which will save his bacon. From 48 to 44% Obama.

    CD47. Light Pink, Irvine. The other D district in Orange County. moved from 60% Obama to 57% Obama. Loretta Sanchez, D. Anaheim, where she lives Anaheim is now CD40  and CD48. John Campbell, of old CD48, lives here in Irvine. He can run here against Sanchez, run against Royce in CD48, or run against Rohrbacher in CD46. All three have substanial portions of his old district.

    CD48. Yorba Linda, Orange County. Safe Rep. Democratic portions of the district stripped out for CD47. Replaces most ofCD42. From 49 to 43% Obama. Ed Royce lives in Fullerton, which is now split between CD40 and CD48.  Gary Miller, [R, old CD42] also lives here in 48.

    CalDem 4-2010Inland Empire

    CD41 Light Blue, Redlands. Safe R. Gains Victorville Jerry Lewis, R should be happy.

    CD42. Bright green, Corona. Safe R. Now Southern portion of Orange County and Southwest Riverside. From 45 to 42% Obama. I cant see any incumbents for this area, unless Ken Calvert [44] lives in that portion.

    CD43 Pink, San Bernardino City. Safe D. Joe Balca D goes from 68 to 65% Obama.

    CD44 Darker pink, Riverside city. Likely D. From 48 to 56% Obama. Ken Calvert [D, CA44] lives in Corona, which is split between CD42 and CD44.

    CD45 Dark Blue, Palm Springs.  Safe D. From 52 to 59% Obama. Mary Bono [R] is the incumbent.

    Republican areas were excised out, and Dem parts added.

    CD52 Puke Green, Hemet. Safe R. San Diego and San Bernardino Counties- leftover R areas. Duncan Hunter, [R] should survive any challenge by Ds

    IMG]

    CD49 Dark Pink, Vista. Lean Dem/Tossup . From 45% to 53% Dem.  Most of Vista, where Darell Issa lives, is still in CD49. The balance is in CD52.  There has to be a district for the readers of Swing State to worry about in the state of California, and this would qualify.

    CD50 Light Blue San Diego. Safe or Likely  Dem.  Brian Bilbray [R] is listed as living in Imperial Beach, which is not in the district. I redrew CD50 to include it, which is almost on the Mexican border. I hope he appreciates the thought.  From 51% to 57% Obama.

    CD51 White San Diego. Safe Dem Bob Filner.

    CD53 Brown. San Diego, Imperial. Safe Dem. Susan Davis may live here or iin CD50.

    Some other detailed maps:

    East LA District 3/1010

    CalDem 4-2010 Kings/Tulare

    CalDem 4-2010Fresno

    CalDem 4-2010 CD18

    CalDem 4-2010 Kings/Tulare

    CalDem 4-2010 CD20

    CalDem 4-2010 CD20