AZ-Sen: McCain With Comfortable Lead Over Hayworth

Research 2000 for Daily Kos (3/29-31, likely voters):

John McCain (R-inc): 52

J.D. Hayworth (R): 37

Undecided: 11

(MoE: ±5%)

Bruce Babbitt (D): 42

John McCain (R-inc): 48

Undecided: 10

Gabrielle Giffords (D): 34

John McCain (R-inc): 53

Undecided: 13

Rodney Glassman (D): 33

John McCain (R-inc): 52

Undecided: 15

Nan Stockholm Walden (D): 21

John McCain (R-inc): 57

Undecided: 22

Bruce Babbitt (D): 42

J.D. Hayworth (R): 43

Undecided: 15

Gabrielle Giffords (D): 36

J.D. Hayworth (R): 49

Undecided: 15

Rodney Glassman (D): 37

J.D. Hayworth (R): 48

Undecided: 15

Nan Stockholm Walden (D): 22

J.D. Hayworth (R): 53

Undecided: 25

(MoE: ±4%)

Steve Singiser already got there first with the “good news! for John McCain!” joke, so I suppose I’ll just play it straight. McMaverick is not only leading all Democratic opposition in the general election, but also defeating right-wing insurgent ex-Rep. J.D. Hayworth in the primary by a 15-point margin (some other pollsters have shown it a closer race, in the 10-point ballpark).

Democrats have been increasingly intrigued by this race, out of the possibility that they might have a shot here if the odious Hayworth somehow wins the primary. This poll shows that Hayworth still wins the general (even against ex-Gov. and ex-Interior Sec. Bruce Babbitt, probably the state’s most prominent Dem and not one who’s expressed any interest in returning to electoral politics), but Dems do poll much better against him. Most notably, their likeliest nominee, young Tucson city councilor Rodney Glassman, loses to McCain by 19 to McCain but 11 to Hayworth. Glassman also fares slightly better than Rep. Gabrielle Giffords, so this should hopefully disabuse everyone of the idea that she should run (and thus open up her competitive seat in AZ-08).

Glassman still faces a possible primary against businesswoman and Democratic party insider Nan Stockholm Walden, who’s scoping out the race; Walden doesn’t fare well, but that’s because she’s virtually unknown, even compared with the little-known Glassman (her favorables are 11/3, while Glassman’s at 23/15… compare that with John McCain, at 47/46, with only 7% with no opinion).

RaceTracker Wiki: AZ-Sen

Regional Realignment, Part 6: The South Gulf Coast

The South Gulf Coast consists of Texas, Louisiana, Alabama, and Mississippi.  50 years ago, the Democrats had a virtual monopoly within this region.  Republicans, for the most part, had no strength at all and were lucky to hold a token seat or two within Congress.  Not any more.  While the Democrats have a strong presence in local races, and the Dems control the Alabama, Mississipi, and Louisiana legislatures, the Republicans now have a solid upper hand on a National level.

US House Representation Realignment

After the 1960 general election, the Democrats had approximately 60% of all house seats (and 64 of the 100 senate seats).  I have inserted below the results of certain general elections.

1960 44(D), 1(R)

1962 42(D), 2(R)

1964 38(D), 6(R)

1970 38(D), 6(R)

1972 34(D), 10(R)

1974 34(D), 10(R)

1978 32(D), 12(R)

1980 32(D), 12(R)

1982 36(D), 11(R)

1984 31(D), 16(R)

1990 33(D), 14(R)

1994 31(D), 18(R)

1996 23(D), 26(R)

2002 24(D), 26(R)

2004 17(D), 33(R)

2006 19(D), 31(R)

2008 19(D), 31(R)

50 years ago, this region had one Republican representative (Bruce Alger, who was subsequently defeated in 1964).  Another Texan joined the Republican Caucus in 1962 (Ed Foreman, whose claim to fame is that he represented Texas for 2 years and then was elected as a Congresman representing New Mexico in 1968).  In 1964, with a backlash from the Civil Rights Act of 1964, Alabama elected 5 Republicans and Mississipi elected 1 Republican.  By 1970, this region still had a split of 38 Democrats, 1 Republican.  Slowly but surely, many of the former conservative Democrats switched party affiliations (Lott and Cochran of MS, for examples) to the Republicans, attracting more voters to the Republican movement.  By 1972, the Republicans reached double digits in this region.  Watergate had no bearing on the 1974 election, probably because the region’s shift to the Republicans offset any damage created from this scandal.  By 1978, the Republicans had 12 reps, but the Republicans didn’t ride the Reagan coatails from the 1980 election.  It wasn’t until 1984 that the Republicans capitalized on the Reagan revolution.  Starting in 1990, the Democrats still had considerable control of this region.  Although the Republicans were able to pick off a big Texan named Jack Brooks, the Demcrats still had a 31-18 advantage.  Starting around 1995, this region saw several Democrats swtiched to the Republican side (Mike Parker, MS-04, Billy Tauzin, LA-03, Jimmy Hayes, LA-07, Greg Laughin, TX-14).  After the 1996 election, the Republicans had a 26-23 advantage.  By 2004, with the infamous Texas redistricting, the Republicans capitalized and had a 33-17 advantage.  Today, the Republicans have a 32-18 advantage since Parker Griffith left our party.

US Senate Representation Realignment

1960 8(D), 0(R)

1962 7(D), 1(R)

1964 7(D), 1(R)

1970 7(D), 1(R)

1972 7(D), 1(R)

1974 7(D), 1(R)

1978 6(D), 2(R)

1980 5(D), 3(R)

1982 5(D), 3(R)

1984 5(D), 3(R)

1990 5(D), 3(R)

1994 4(D), 4(R)

1996 2(D), 6(R)

2002 2(D), 6(R)

2004 1(D), 7(R)

2006 1(D), 7(R)

2008 1(D), 7(R)

50 years ago the Democrats controlled all 8 senate seats in this region.  John Tower won a special election in 1962 to take LBJ’s former senate seat, but for the next decade they couldn’t pick up another seat.  Thad Cochran won a MS Senate seat in 1978, and then Alabama elected Denton to a Senate seat in 1980 (only to lose reelection to Richard Shelby in 1986, who would later be a turncoat).  By 1990, MS had to Republican Senators, and Texas had 1 (Phil Gramm).  The Democrats lost another seat in 1993 (special election for Bentsen’s TX seat, won by Kay Bailey Hutchison).  By 1996, Alabama joined LA and MS in having 2 Republican Senators with the election of Jeff Sessions plus Richard Shelby changing party affiliation.  Louisiana elected David “Diaper” Vitter in 2004.  Currently, the Democrats have one Senator in this region (Mary Landrieu, a conservative Democrat).

Conclusions

This region has always had a conservative leaning.  50 years ago, the conservative Democrat ruled this region, and only a handful of moderate, progressive Democrats were in the mix.  The Civil Rights Act of 1964 probably was the beginning of a Republican tide in MS, AL, and LA.  Slowly but surely, many of these conservative Democrats joined the Republican party.  As recent as last year, we had Parker Griffith jump ship to the Republicans.  

I haven’t lost faith that we will continue to be decimated in this region.  Alabama, Mississipi, and Louisiana will remain strong Republican footholds, but there are areas within these states that will fully support a Blue Dog Democrat.  Also, these states have stagnant population growth, meaning that they will not be awarded new districts that will probably go to the Republicans.  Texas, OTOH, is a vastly growing state.  Much of the growth can be contributed to the growing Hispanic population that’s more willing to support Democrats over Republicans.  I anticipate that Texas will become much more Democratic-friendly in the next 20 years.

SSP Daily Digest: 4/5 (Morning Edition)

Welcome to the workin’ week!

  • FL-Sen: Rudy & Rubio, together at last. Giuliani will become the latest johnny-come-lately to endorse Marco.
  • GA-Sen: Johnny Isakson, who had been hospitalized twice in one week, is now back home.
  • KY-Sen: Weirdo Rand Paul is launching a 1,000-point ad buy (that’s big) attacking Trey Grayson as a pro-bailout insider too cozy with DC. The primary is about six weeks away. On the Dem side, The Lexington Herald-Leader reviewed state records and found that Lt. Gov. Dan Mongiardo has spent four times as much taxpayer money on travel, hotels and meals as AG Jack Conway. Mongiardo has also racked up expenses for the security detail that travels with him (Conway doesn’t have security).
  • NV-Sen: Jon Ralston says that federal investigators are looking to nail John Ensign for “structuring,” which is “a broad term that refers to the crime of creating financial transactions to evade reporting requirements.” Ensign, you’ll recall, had his parents give a $96,000 “gift” to his mistress instead of reporting it as a severance payment. The DoJ is moving very methodically, though, ever-mindful of the wretchedly botched prosecution of ex-Sen. Ted Stevens (which was thrown out on appeal due to prosecutorial misconduct.)
  • SD-Sen: Ugh. Not only did no Democrats file to run against John Thune, but he’s become the first senator in South Dakota history to run without major-party opposition. My advice to John Thune: Save your $6 million warchest for a 2012 presidential run.
  • UT-Sen: Sen. Bob Bennett and his Republican challengers faced off in a debate last Friday, which saw Bennett defend earmarks and get attacked for supporting an individual mandate to buy health insurance. The GOP state convention, which will choose a nominee, is May 8th.
  • AL-Gov: Hah – Artur Davis, fresh off his vote against healthcare reform, is now pushing a petition on his website attacking Alabama state legislators who voted to “obstruct” the new bill.
  • IA-Gov: Republican pollster Magellan Data and Mapping Strategies has a survey of the Iowa gubernatorial race, showing Terry Branstand crushing incumbent Dem Chet Culver 50 to 34. Culver leads Bob Vander Plaats 40-39 and Rod Roberts 38-32. It’s unclear to me whether Magellan was polling for fun or if this was on behalf of a client.
  • MA-Gov: Politico has a piece describing the extraordinary efforts Obama’s political team is making to help Gov. Deval Patrick win re-election. Patrick has visited the White House half a dozen times over the past year, and he’s the only office-seeker so far (other than Harry Reid) to have a fundraiser headlined by the president himself.
  • PA-Gov: The Philadelphia Daily News obtained an interesting strategy memo penned by the campaign of Dem Dan Onorato. Apparently, Onorato was prepared to challenge the signatures of opponents Joe Hoeffel and Anthony Williams. However, since Hoeffel didn’t move to challenge Williams’ signatures, Onorato’s campaign apparently decided it was better to leave both of them alone, figuring it would be better to have two candidates from the Philly region in the race rather than one. (Onorato hails from Western PA.)
  • UT-Gov: Salt Lake County Mayor and Dem gubernatorial candidate Peter Corroon says he raised more than $360,000 since the start of the year. No word yet on GOP Gov. Gary Herbert’s haul.
  • AL-03: Dems found someone to replace Josh Segall on the ballot at the last minute: Montgomery native Steve Segrest, who lost to GOPer Kay Ivey in the Treasurer’s race in 2006. Segrest comes from a political family: His father served in the Alabama House and his grandfather, Napoleon Broward, was elected governor… of Florida… in 1905. In some other Alabama news, state Sen. Jim Preuitt, who had long been on the outs with the Democrats, switched parties to the GOP.
  • FL-08: GOP Bruce O’Donoghue says he raised $300K since joining the race, and has a similar amount on hand. O’Donoghue’s camp says that this sum does not include any self-donations.
  • NH-01, NH-02: Dem Ann McLane Kuster, seeking Paul Hodes’ open seat in NH-02, says she raised $285K in Q1, and apparently has made a record haul from New Hampshire residents. Supposedly Katrina Swett will announce a bigger haul, but no numbers yet. Meanwhile, GOPer Frank Guinta, running in NH-01, supposedly raised $250K, including $100K of his own money. (Guinta’s fundraising had been pretty sucky prior to this.)
  • NY-19: The Republican field to take on Dem Rep. John Hall still seems very unsettled. Ophthalmologist Nan Hayworth has gotten a lot of love from the NRCC, but a broad swath of the GOP establishment in the 19th CD doesn’t seem to feel similarly, and she faces several strong opponents. One of them, former Pentagon analyst Kristia Cavere, says she raised $200K in Q1 & will soon convert her exploratory committee into the real thing. Meanwhile, ex-Tuxedo Mayor David McFadden says he’s raised about $100K. He also says that if he doesn’t win the party’s nomination at the May convention, he’ll drop out.
  • PA-07: Dem Bryan Lentz is challenging the validity of GOP opponent Pat Meehan’s signatures. As we noted previously, Lentz is also questioning the impartiality of the investigator, which happens to be Republican AG Tom Corbett’s office. Lentz now has a new arrow in his quiver: Some of the same people who circulated petitions for Meehan also did so for Corbett. Even better, it looks like some local GOP leaders may have signed false affidavits saying they personally gathered signatures, even though others may have actually carried the petitions.
  • SD-AL: Physician Kevin Weiland had planned to challenge Rep. Stephanie Herseth Sandlin in the Democratic primary after she voted “no” on healthcare. But Weiland pulled out at the last minute, after receiving calls from Steny Hoyer, and Chris Van Hollen. He also spoke with Herseth Sandlin herself, and reportedly “negotiated an assurance from Herseth Sandlin that she would reconnect with her Democratic base in South Dakota and never vote for a repeal of the health care plan.” Doesn’t sound like much. He also apparently cheesed off one-time Obama strategist Steve Hildebrand, who declined to run himself but worked overtime to help Weiland gather signatures (he only had a week in which to do it) to qualify for the ballot.
  • TN-06: Another veteran is entering this open-seat race on the Democratic side. Brett Carter, an attorney and TN National Guardsman who served in Iraq, joins Marine Capt. Ben Leming in the Dem field.
  • TN-08: Things are really starting to get hot in the GOP primary in Tennessee’s 8th CD. The Republican establishment isn’t just stumping for agribusiness magnate Steve Fincher – they’re actively attacking his opposition. Georgia Rep. Lynn Westmoreland, whose trip to Fincher’s district we noted in an earlier digest, slammed physician Ron Kirkland for allegedly being wobbly on the healthcare reform bill and for his past support of Democrats. (Kirkland previously said he liked most of what was in the bill, except for the public option – and when he was chair of the American Medical Group Association when they made donations to Max Baucus.) Kirkland is no random teabagger pushover, which is why he’s drawing fire. This could be an unusually interesting primary.
  • TX-17: The Texas Tribune takes a look at the two Republicans in a run-off for the privilege of facing Dem Chet Edwards in the fall: 2008 nominee Rob Curnock and oil exec Bill Flores. Here’s an interesting detail: Flores voted in the Democratic presidential primary in 2008, supposedly “casting his ballot against Barack Obama.” That’s some cute spin, but if he voted for Hillary Clinton (he won’t say), I don’t really see how that helps him. But in any event, Flores outraised Curnock by a huge margin, $214K to $16K, in newly-filed pre-runoff FEC reports.
  • WA-03: Ex-state Rep. Denny Heck (D) says he raised $350K in the first quarter (including $150K of his own money), leaving him with $530K on hand.
  • Census: There’s a bill pending in both houses of the NY state legislature that would require counting prison inmates as part of their home communities, rather than upstate, where most prisons are located. Given how dysfunctional the lege is, though, there’s no telling if this badly-needed reform will actually see the light of day.
  • Fundraising: GOP bigs are hitting the trail on behalf of their brethren during the congressional recess. John Boehner is helping Californians Mary Bono Mack and Ken Calvert, Pete Sessions is helping Illinoisans Randy Hultgren and Adam Kinzinger, and a bunch of other top Republicans are also putting their backs into things.
  • Redistricting: Former DCCC nat’l field director Casey O’Shea will replace Brian Smoot as head of the National Democratic Redistricting Trust. Smoot is leaving to head up the DSCC’s independent expenditure arm. (And O’Shea and Smoot are consulting partners.)
  • WATN: Dede Scozzafava says she’s working on a memoir about last year’s special election race. Can’t wait to read it! She also says she’s unsure about whether she’ll seek reelection to her seat in the Assembly this year.
  • Site News: Thanks for helping us reach 1,500 followers on Twitter and 400 fans on Facebook!
  • Rasmussen Reports, You Decide, Vol. 13

    Ever take the week off, and come back to find your inbox full of spam?

    AL-Gov (3/29, likely voters):

    Artur Davis (D): 33

    Bradley Byrne (R): 50

    Some other: 9

    Not sure: 9

    Artur Davis (D): 36

    Kay Ivey (R): 43

    Some other: 12

    Not sure: 8

    Artur Davis (D): 35

    Tim James (R): 49

    Some other: 10

    Not sure: 7

    Artur Davis (D): 44

    Roy Moore (R): 40

    Some other: 11

    Not sure: 6

    Ron Sparks (D): 33

    Bradley Byrne (R): 43

    Some other: 11

    Not sure: 13

    Ron Sparks (D): 33

    Kay Ivey (R): 39

    Some other: 15

    Not sure: 13

    Ron Sparks (D): 34

    Tim James (R): 38

    Some other: 13

    Not sure: 14

    Ron Sparks (D): 40

    Roy Moore (R): 35

    Some other: 15

    Not sure: 10

    (MoE: ±4.5%)

    AL-Sen (3/29, likely voters):

    William Barnes (D): 32

    Richard Shelby (R): 59

    Some other: 3

    Not sure: 6

    (MoE: ±4.5%)

    AR-Sen (3/30, likely voters, 3/1 in parentheses):

    Blanche Lincoln (D): 36 (39)

    John Boozman (R): 51 (48)

    Some other: 6 (6)

    Not sure: 7 (7)

    Blanche Lincoln (D): 36 (40)

    Gilbert Baker (R): 51 (45)

    Some other: 6 (6)

    Not sure: 7 (8)

    Blanche Lincoln (D): 35 (38)

    Kim Hendren (R): 51 (43)

    Some other: 5 (7)

    Not sure: 8 (12)

    Blanche Lincoln (D): 36 (41)

    Curtis Coleman (R): 48 (43)

    Some other: 7 (7)

    Not sure: 8 (10)

    Blanche Lincoln (D): 35 (38)

    Jim Holt (R): 51 (45)

    Some other: 7 (6)

    Not sure: 7 (10)

    Bill Halter (D): 34 (33)

    John Boozman (R): 48 (55)

    Some other: 8 (6)

    Not sure: 11 (9)

    Bill Halter (D): 36 (37)

    Gilbert Baker (R): 44 (43)

    Some other: 7 (5)

    Not sure: 12 (13)

    Bill Halter (D): 34 (35)

    Kim Hendren (R): 42 (42)

    Some other: 10 (7)

    Not sure: 13 (15)

    Bill Halter (D): 37 (35)

    Curtis Coleman (R): 40 (38)

    Some other: 10 (9)

    Not sure: 13 (18)

    Bill Halter (D): 34 (38)

    Jim Holt (R): 43 (42)

    Some other: 9 (8)

    Not sure: 14 (12)

    (MoE: ±4.5%)

    FL-Gov (3/18, likely voters, 2/18 in parentheses):

    Alex Sink (D): 36 (35)

    Bill McCollum (R): 47 (48)

    Some other: 5 (4)

    Not sure: 12 (12)

    (MoE: ±3%)

    FL-Sen (3/18, likely voters, 2/18 in parentheses):

    Kendrick Meek (D): 34 (32)

    Charlie Crist (R): 45 (48)

    Some other: 11 (11)

    Not sure: 10 (9)

    Kendrick Meek (D): 34 (31)

    Marco Rubio (R): 48 (51)

    Some other: 6 (7)

    Not sure: 11 (11)

    (MoE: ±3%)

    HI-Gov (3/24, likely voters):

    Neil Abercrombie (D): 54

    Duke Aiona (R): 31

    Some other: 6

    Not sure: 9

    Mufi Hannemann (D): 50

    Duke Aiona (R): 29

    Some other: 14

    Not sure: 7

    (MoE: ±4.5%)

    HI-Sen (3/24, likely voters):

    Dan Inouye (D): 65

    Linda Lingle (R): 25

    Some other: 3

    Not sure: 6

    (MoE: ±4.5%)

    IA-Gov (3/17, likely voters, 2/18 in parentheses):

    Chet Culver (D): 36 (37)

    Terry Branstad (R): 52 (53)

    Some other: 6 (6)

    Not sure: 6 (4)

    Chet Culver (D): 40 (40)

    Bob Vander Plaats (R): 42 (46)

    Some other: 8 (7)

    Not sure: 11 (7)

    Chet Culver (D): 40

    Rod Roberts (R): 38

    Some other: 10

    Not sure: 13

    (MoE: ±4.5%)

    ID-Gov (3/23, likely voters):

    Keith Allred (D): 28

    Butch Otter (R): 60

    Some other: 3

    Not sure: 9

    (MoE: ±4.5%)

    ID-Sen (3/23, likely voters):

    Generic Democrat (D): 28

    Mike Crapo (R): 60

    Some other: 3

    Not sure: 9

    (MoE: ±4.5%)

    MI-Gov (D) (3/24, likely voters):

    Andy Dillon (D): 12

    Alma Wheeler Smith (D): 10

    Virg Bernero (D): 8

    Some other: 17

    Not sure: 53

    (MoE: ±4%)

    MI-Gov (R) (3/24, likely voters):

    Peter Hoekstra (R): 27

    Rick Snyder (R): 18

    Mike Cox (R): 13

    Mike Bouchard (R): 6

    Some other: 5

    Not sure: 32

    (MoE: ±4%)

    NC-Sen (3/22, likely voters, 2/23 in parentheses):

    Elaine Marshall (D): 35 (34)

    Richard Burr (R): 51 (50)

    Some other: 6 (4)

    Not sure: 8 (12)

    Cal Cunningham (D): 32 (29)

    Richard Burr (R): 51 (51)

    Some other: 7 (6)

    Not sure: 11 (14)

    (MoE: ±4.5%)

    ND-AL (3/23-24, likely voters, 2/9-10 in parentheses):

    Earl Pomeroy (D): 44 (40)

    Rick Berg (R): 51 (46)

    Some other: 1 (3)

    Not sure: 4 (11)

    (MoE: ±4.5%)

    ND-Sen (3/23-24, likely voters, 2/9-10 in parentheses):

    Tracy Potter (D): 25 (17)

    John Hoeven (R): 68 (71)

    Some other: 2 (4)

    Not sure: 5 (8)

    (MoE: ±4.5%)

    NM-Gov (3/24, likely voters):

    Diane Denish (D): 51

    Susana Martinez (R): 32

    Some other: 7

    Not sure: 10

    Diane Denish (D): 52

    Pete Domenici Jr. (R): 35

    Some other: 6

    Not sure: 6

    Diane Denish (D): 45

    Allen Weh (R): 35

    Some other: 7

    Not sure: 13

    Diane Denish (D): 52

    Janice Arnold-Jones (R): 30

    Some other: 6

    Not sure: 12

    Diane Denish (D): 43

    Doug Turner (R): 34

    Some other: 7

    Not sure: 16

    (MoE: ±4.5%)

    NY-Gov (3/29, likely voters, 3/1 in parentheses):

    Andrew Cuomo (D): 52 (55)

    Rick Lazio (R): 29 (30)

    Some other: 6 (5)

    Not sure: 13 (10)

    Andrew Cuomo (D): 51 (56)

    Carl Paladino (R): 28 (27)

    Some other: 6 (6)

    Not sure: 15 (11)

    Andrew Cuomo (D): 50

    Steve Levy (R): 26

    Some other: 7

    Not sure: 17

    (MoE: ±4.5%)

    OH-Gov (3/30, likely voters, 3/4 in parentheses):

    Ted Strickland (D): 45 (38)

    John Kasich (R): 46 (49)

    Some other: 2 (6)

    Not sure: 7 (7)

    (MoE: ±4.5%)

    OH-Sen (3/30, likely voters, 3/4 in parentheses):

    Lee Fisher (D): 38 (39)

    Rob Portman (R): 43 (44)

    Some other: 4 (5)

    Not sure: 14 (12)

    Jennifer Brunner (D): 38 (37)

    Rob Portman (R): 45 (43)

    Some other: 4 (6)

    Not sure: 13 (15)

    (MoE: ±4.5%)

    RI-Gov (3/25, likely voters, 2/25 in parentheses):

    Frank Caprio (D): 28 (27)

    John Robitaille (R): 22 (19)

    Lincoln Chafee (I): 39 (37)

    Not sure: 11 (17)

    Patrick Lynch (D): 22 (24)

    John Robitaille (R): 26 (22)

    Lincoln Chafee (I): 37 (38)

    Not sure: 15 (16)

    (MoE: ±4.5%)

    SD-AL (3/25, likely voters, 2/23 in parentheses):

    Stephanie Herseth Sandlin (D): 44 (45)

    Chris Nelson (R): 42 (38)

    Some other: 6 (6)

    Not sure: 9 (11)

    Stephanie Herseth Sandlin (D): 46 (49)

    Kristi Noem (R): 35 (34)

    Some other: 8 (4)

    Not sure: 10 (13)

    Stephanie Herseth Sandlin (D): 45 (51)

    Blake Curd (R): 33 (33)

    Some other: 8 (5)

    Not sure: 14 (12)

    (MoE: ±4.5%)

    SD-Gov (3/25, likely voters, 2/23 in parentheses):

    Scott Heidepriem (D): 32 (32)

    Dennis Daugaard (R): 49 (41)

    Some other: 6 (7)

    Not sure: 13 (19)

    Scott Heidepriem (D): 37 (34)

    Dave Knudson (R): 32 (31)

    Some other: 13 (13)

    Not sure: 19 (22)

    Scott Heidepriem (D): 39 (37)

    Gordon Howie (R): 34 (29)

    Some other: 9 (12)

    Not sure: 17 (22)

    (MoE: ±4.5%)

    TN-Gov (3/22, likely voters):

    Mike McWherter (D): 27

    Bill Haslam (R): 45

    Some other: 5

    Not sure: 23

    Mike McWherter (D): 29

    Ron Ramsey (R): 43

    Some other: 5

    Not sure: 23

    Mike McWherter (D): 31

    Zach Wamp (R): 41

    Some other: 7

    Not sure: 22

    Kim McMillan (D): 26

    Bill Haslam (R): 46

    Some other: 5

    Not sure: 23

    Kim McMillan (D): 25

    Ron Ramsey (R): 43

    Some other: 8

    Not sure: 24

    Kim McMillan (D): 29

    Zach Wamp (R): 42

    Some other: 5

    Not sure: 25

    (MoE: ±4.5%)

    WY-Gov (3/25, likely voters):

    Mike Massie (D): 25

    Matt Mead (R): 43

    Some other: 8

    Not sure: 24

    Mike Massie (D): 23

    Ron Micheli (R): 45

    Some other: 8

    Not sure: 25

    Mike Massie (D): 26

    Rita Meyer (R): 43

    Some other: 7

    Not sure: 25

    Mike Massie (D): 26

    Colin Simpson (R): 41

    Some other: 8

    Not sure: 25

    (MoE: ±4.5%)

    Maps of Pennsylvania Elections

    By: Inoljt, http://mypolitikal.com/

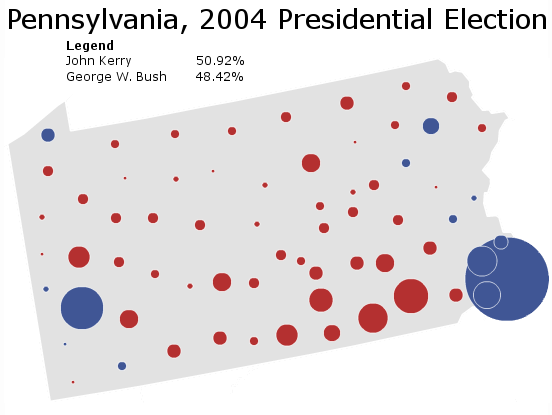
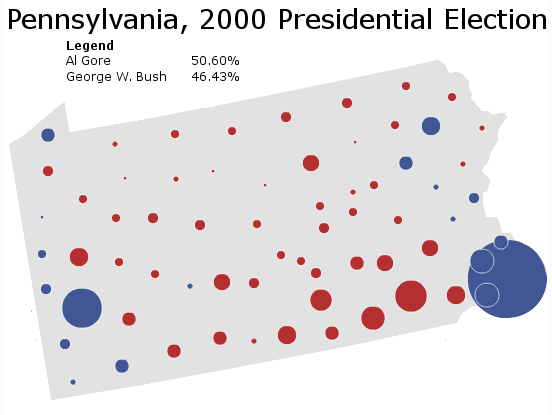
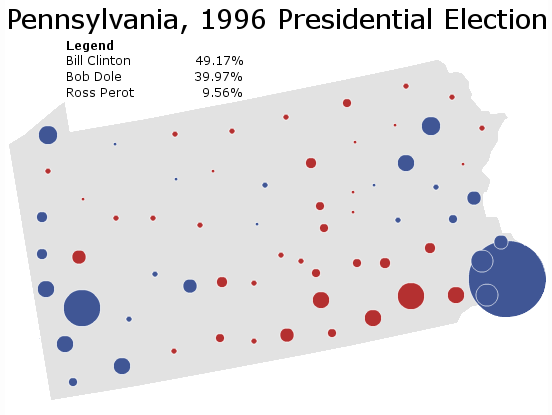
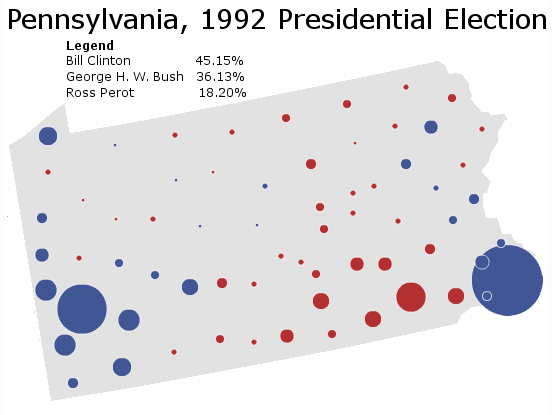
    A few maps of Pennsylvania’s presidential elections are posted below, for your enjoyment. Each map comes with some brief analysis. Note how in each succeeding election, Democratic margins in the Philadelphia metropolis increase, while their margins in the Pittsburgh corridor decrease.

    (Note: Because the Times stopped updating before all absentee/provisional ballots were counted, this map does not fully reflect the actual results. I have corrected the discrepancy.)

    Maps of Pennsylvania Elections

    As the national tide increasingly turns in Senator Barack Obama’s favor, Senator John McCain mounts a quixotic attempt to win Pennsylvania. While Mr. McCain improves in the southeastern rustbelt, Democratic dominance in eastern Pennsylvania ensures a double-digit blue margin.

    More below.

    Maps of Pennsylvania Elections

    President George W. Bush mounts a determined attack on Pennsylvania, coming within 2.5% of Senator John Kerry. Mr. Bush does quite well in the traditionally Democratic Pittsburgh corridor and Republican strongholds throughout the “T.” But double-digit losses in Philadelphia’s suburbs (and a 400,000 vote deficit coming out of the city itself) prevent Mr. Bush from victory.

    ______________________________________________________

    Maps of Pennsylvania Elections

    Without President Bubba holding the line, Republican margins in Pennsyltucky are much higher. Nevertheless, Al Gore closely carries Pennsylvania based on Democratic strongholds in the Philadelphia and Pittsburgh metropolises.

    _____________________________________________________

    Maps of Pennsylvania Elections

    With incumbent Bill Clinton poised to win comfortably weeks before election day, Senator Bob Dole does not seriously contest Pennsylvania. Democrats improve in the east and weaken in the west, while Mr. Clinton sails to a comfortable victory.

    ______________________________________________________

    Maps of Pennsylvania Elections

    Governor Bill Clinton romps to a nine-point margin, following three straight Republican victories in the state. Mr. Clinton milks Democratic strength in the industrial southwest for everything it’s worth, winning 2-1 margins in a number of counties. More ominously for Republicans, President George H. W. Bush barely loses the Philadelphia suburbs – the first Republican to do so since Senator Barry Goldwater (and before him President William Taft, in 1912).

    (Note: Credit goes to the NYT for these amazing images.)

    HI-01: CQ Says DCCC May Back Case

    Wow, this would be explosive:

    House Democrats are considering backing former Rep. Ed Case in Hawaii’s competitive winner-take-all special election next month, a move that would run counter to the endorsements of the Aloha State’s two Senators.

    Several sources with knowledge of the situation said that the Democratic Congressional Campaign Committee is inclined to support Case over state Senate President Colleen Hanabusa, who has the support of Hawaii Democratic Sens. Daniel K. Inouye and Daniel K. Akaka, organized labor and EMILY’s List.

    CQ doesn’t really get into the “why,” except to say:

    But according to sources familiar with the committee’s considerations, national Democrats see several weaknesses in Hanabusa’s candidacy stemming mostly from her tenure in the state Legislature.

    Hanabusa’s second campaign spot of the cycle, for example, boasted she “cut legislative salaries,” but she was maligned in the press last week for taking a pay raise while she made the cut.

    That’s it? Really? Don’t get me wrong – the ad flub is pretty ugly. And many people don’t have especially warm feeling towards state legislatures these days. But not only does Hanabusa have the support of pretty much the entire political establishment in Hawaii, she’s also a much stronger fundraiser than Case. Indeed, she’s expected to report $400K raised in Q1, while Case hasn’t offered an estimate and very likely raised less. Then of course there’s also the fact that supporting the conservative Case in a district this blue would be a monster fuck-you to progressives. (Yes, favorite son Barack Obama inflated the vote totals in his home state, but this was a D+7 district just based on the Gore & Kerry results.)

    Now, I appreciate that the unusual nature of this all-party jungle election might force the DCCC to make some unusual choices here. And perhaps they have polling showing some tough negatives for Hanabusa. But backing Case would nonetheless be a very divisive move which could very well backfire, seeing as it could sour the race between the two Democrats even further. (Just think about all the bad blood there’s been in GOP races where the Republican establishment picks a favorite.) I have a sinking feeling in my stomach about how this one will play out.

    SSP currently rates this race as Lean Dem, but that rating could definitely change.

    CA-Gov, CA-Sen: County Baselines

    Here is my attempt at estimating the county baselines to see the absolute minimum we can pull in the counties to be able to break 50% statewide in California. Based on trends that I’ve pointed out many times over, close races in California are likely to get rarer and rarer, so I decided that now would be my best chance at showing what a close race in California could look like. Third parties usually pull between 3 and 5% of the vote, so I gave 4% to the third parties.

    County 2008 # voters % of 2008 vote 2008% Pres. Needed to reach 50%
    State
    13,743,177
    100.0%
    61/37
    50/46
    Los Angeles
    3,368,057
    24.5%
    69/29
    58/38
    San Diego
    1,245,947
    9.1%
    54/44
    43/53
    Orange
    1,167,657
    8.5%
    50/48
    57/39
    Santa Clara
    678,033
    4.9%
    69/29
    58/38
    Riverside
    657,005
    4.8%
    50/48
    39/57
    Alameda
    628,545
    4.6%
    79/19
    68/28
    San Bernardino
    616,320
    4.5%
    52/46
    41/55
    Sacramento
    546,660
    4.0%
    58/39
    47/48
    Contra Costa
    456,876
    3.3%
    68/30
    57/39
    San Francisco
    388,112
    2.8%
    84/14
    73/23
    Ventura
    343,690
    2.5%
    55/43
    44/52
    San Mateo
    307,350
    2.2%
    73/25
    62/34
    Fresno
    275,554
    2.0%
    50/48
    39/57
    Kern
    235,854
    1.7%
    40/58
    29/67
    Sonoma
    231,817
    1.7%
    74/24
    63/33
    San Joaquin
    212,214
    1.5%
    54/44
    43/53
    Santa Barbara
    176,562
    1.3%
    60/37
    49/46
    Placer
    175,215
    1.3%
    43/54
    32/63
    Stanislaus
    162,941
    1.2%
    50/48
    39/57
    Solano
    162,638
    1.2%
    63/35
    52/44
    Marin
    141,321
    1.0%
    78/20
    67/29
    Monterey
    131,381
    1.0%
    68/30
    57/39
    Santa Cruz
    128,555
    0.9%
    77/20
    66/29
    Tulare
    106,551
    0.8%
    41/57
    30/66
    Butte
    99,392
    0.7%
    50/47
    39/56
    El Dorado
    93,890
    0.7%
    44/54
    33/63
    Shasta
    81,378
    0.6%
    36/62
    25/71
    Yolo
    80,674
    0.6%
    67/31
    56/40
    San Luis Obispo
    68,424
    0.5%
    51/46
    40/55
    Merced
    64,688
    0.5%
    53/45
    42/54
    Humboldt
    64,358
    0.5%
    62/34
    51/43
    Napa
    60,366
    0.4%
    65/33
    54/42
    Nevada
    56,177
    0.4%
    51/46
    40/55
    Madera
    43,032
    0.3%
    42/56
    31/65
    Mendocino
    40,580
    0.3%
    69/27
    58/36
    Imperial
    39,823
    0.3%
    62/36
    51/45
    Kings
    35,775
    0.3%
    42/56
    31/65
    Sutter
    33,337
    0.2%
    41/57
    30/66
    Tuolumne
    27,499
    0.2%
    42/55
    31/64
    Lake
    25,863
    0.2%
    58/39
    47/48
    Tehama
    24,803
    0.2%
    36/60
    25/69
    Calaveras
    23,588
    0.2%
    42/55
    31/64
    Siskiyou
    21,723
    0.2%
    43/53
    32/62
    Yuba
    21,681
    0.2%
    41/56
    30/65
    San Benito
    19,982
    0.1%
    60/38
    49/47
    Amador
    19,006
    0.1%
    41/56
    30/65
    Lassen
    11,510
    0.1%
    31/65
    20/74
    Plumas
    11,169
    0.1%
    43/55
    32/64
    Glenn
    10,053
    0.1%
    38/60
    27/69
    Mariposa
    9,756
    0.1%
    42/55
    31/64
    Del Norte
    9,684
    0.1%
    45/52
    34/61
    Inyo
    8,625
    0.1%
    44/53
    33/62
    Colusa
    6,532
    0.0%
    40/58
    29/67
    Trinity
    6,482
    0.0%
    50/46
    39/55
    Mono
    5,621
    0.0%
    56/42
    45/51
    Modoc
    4,505
    0.0%
    30/67
    19/76
    Sierra
    2,012
    0.0%
    37/58
    26/67
    Alpine
    697
    0.0%
    61/36
    50/45

    Here’s a visual aid, comparing the expected results in a close race in California with the 2008 results:

    Hypothetical close race

    Image and video hosting by TinyPic

    2008

    Image and video hosting by TinyPic

    Maryland Non-Biased Redistricting: Sadly, my last one until Dave adds more partisan data

    I do have some other cool things coming up for you soon, however.  

    Photobucket

    This is by far the simplest state to redistrict.  There are relatively few counties, and the shape of the state makes it easy to redistrict as well.  Right now, the partisan composition is 7-1 D, but in a few months, it will most likely be 6-2 D.  The 2012 Redistricting will be based on that.

    1st: Blue District

    57-41 McCain, from 58-40 McCain

    Little change here, but the district is much more contiguous.  Kratovil will be gone by the time the 2012 election rolls around, but since St. Sen. Andy Harris, the man most likely to succeed him, doesn’t live in this new district, Kratovil could conceivably run again, as could Caroline Co. Commisioner Jefferson Ghrist, who is running in the primary against Harris this year.  79% White, 15% Black, and Republican unless Obama wins by a landslide in 2012.  The E. Shore and Harford and Cecil Counties make up this district.

    2nd: Green District: Dutch Ruppersberger-D and John Sarbanes-D

    56-42 Obama, from 60-38 Obama (R) or 59-39 Obama (S)

    I guess technically it’s now a swing district, not a Democratic district, but it’s pretty safe for any reasonably popular Democratic incumbent. I believe Ruppersberger would retire and Sarbanes would retain the seat. Nearly all of Suburban Baltimore County is here.  65% White, 26% Black. + 0.5 R.

    3rd: Red District: Elijah Cummings-D

    83-15 Obama, from 79-20 Obama

    58% Black, 35% White, and very Democratic.  Cummings is safe here, with all of Baltimore and small arms of inner suburbs.

    4th: Purple District

    53-45 Obama

    A nearly perfect swing district, consisting of Annapolis, Baltimore Suburbs, Ellicott city, etc.

    71% White, 17% Black.  I’d assume this area is very wealthy. Now at +1 R.

    5th: Yellow District: Roscoe Bartlett

    58-40 McCain (no change)

    Bartlett’s district is very similar and safe, with the panhandle, Frederick, and some Baltimore Exurbs. 85% White.

    6th: Periwinkle District: Steny Hoyer

    77-22 Obama.  From 65-33 Obama

    This would be a very interesting primary if it happened, as Donna Edwards, lives here, too, but she’ll probably run in the 8th.  If she does run here, the district is 55% Black, 37% White, but Hoyer is a member of the leadership and highly entrenched.  Either way, it’s safe Dem.  Hoyer could always retire as well.  It combines high-minority Prince George’s County with Southern Maryland.

    7th: Blue-ish District: Chris Van Hollen

    68-30 Obama, from 74-25 Obama.

    Van Hollen is happy he has no contested primary.  His district’s safe; it’s all DC Suburbs.  60% White, 14% Hispanic, 14% Asian, 11% Black.

    8th: Gray District: Donna Edwards

    82-17 Obama.  From 85-14 Obama.

    If Edwards runs here, which is more likely, she’s safe.  It’s more DC Suburbs, including the U. of Maryland.  42% Black, 29% White, 19% Hispanic.

    All in all, this district converts two blue seats to purple seats, which could lead to anything from a 6-2 Dem to a 4-4 split, depending on the year and the candidates.  I believe 5-3 would more accurately reflect Maryland’s Democratic lean, but this is how it turned out.


    TX-Redistricting: Deal or no deal? Examining the proposed Texas compromise

    In today's daily digest, it was posted that Team Blue and the GOP are trying to hammer out a compromise that would effectively split Texas' four new congressional districts: two for Democrats and two for Republicans. (The article can be found here.)

    For a little while, I've been working on a diary examining whether the VRA helps or hurts Team Blue, specifically in the South. My first diary was going to be about Texas, specifically the Metroplex and the near-the-border districts. So, while that diary might still happen, I think it would be interesting to use Dave's Redistricting App to examine how this proposed compromise would affect the Texas Congressional delegation. 

    DISCLAIMER: All districts are drawn as a Republican gerrymander, keeping with VRA restrictions. Also, incumbent homes are largely ignored.

    As many of you know, Texas is supposed to gain four congressional seats from the upcoming Census. If they only gain three, then this is all moot, but let's assume that they'll gain four.

    Over the past four years, the Dallas-Ft. Worth Metroplex has experienced rapid population growth, specifically Hispanic population growth. In fact, the MSA grew by almost exactly 25% since the 2000 census–a little more than one million people. Therefore, the area should gain a district an a half.

    As it stands right now, there are eight districts that occupy part of Tarrant County (Ft. Worth, Arlington) or Dallas County: seven are GOP seats and one is occupied by Eddie Bernice Johnson, who represents a minority-majority district that sucks up a whole lot of Democratic votes.

    After the DeLaymander, DavidNYC posted a good explanation of the VRA that would affect any redistricting process: 

    But #3 is, perversely, what gets us. The Voting Rights Act is a very complex piece of legislation, and the litigation interpreting it is very, very hard to get a handle on. But at its core, the VRA says that redistricters must try to maximize the number of "majority-minority" districts – ie, districts where cohesive minorities constitute a sufficiently large bloc such that this group's will is likely to prevail at election time. 

    This means that Texas redistrict-ers must maximize the majority-minority districts in the Metroplex. After the 2010 census, if the GOP has control over of the Senate, the House, and the governor’s mansion (which is probable, but not a foregone conclusion), they must create two majority-minority districts, something like this:

    Photobucket

    The turquoise and the yellow snake-like districts in Ft. Worth and Dallas are the minority-majority districts.

    Yellow District:

    Obama: 80%

    McCain: 20%

    White: 27%

    Black: 51%

    Hispanic: 18%

    Turquoise District:

    Obama: 62%

    McCain: 37%

    White: 27%

    Black: 9%

    Hispanic: 61%

    The rest of the districts all had 45% or less for Obama.

    A black majority and a Hispanic majority district should come out of this process. The current 30th (seen below) has the 2000 Census demographics:

    White: 36.6%

    Black: 41.8%

    Hispanic: 34.8%
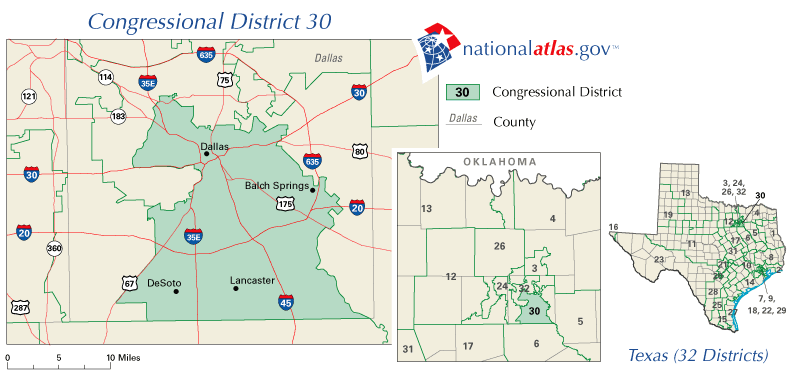
    There’s no way that could pass VRA muster right now. So, from the two new VRA districts in the Metroplex, Democrats automatically gain a safe seat without any deal.

    Now, we explore Houston, where Hispanic growth has occurred over the past ten years. To accommodate the VRA, a new Hispanic district must be drawn. Further, both black plurality districts must remain. It should look something like this:

    Photobucket

    I used MattTX2’s bipartisan compromise as inspiration for the boundaries. However, my pink Hispanic district is much less Democratic. Here are the results:

    Pink District:

    Obama: 52%

    McCain 47%

    White: 35%

    Black: 8%

    Hispanic: 51%

    Blue District:

    Obama: 59%

    McCain: 41%

    White: 27%

    Black: 12%

    Hispanic: 58%

    Beige District:

    Obama: 79%

    McCain: 21%

    White: 17%

    Black: 47%

    Hispanic: 24%

    Army Green District (Northern District)

    Obama: 65%

    McCain: 35%

    White: 34%

    Black: 38%

    Hispanic: 22%

    Now, the pink district is barely a Hispanic majority district, so it could be argued that there are not enough voting age Hispanics to make it a VRA-protected districts (I’ll get to that later). So, the district might need to change shapes and might need to add more Hispanic precincts (making it more Democratic). I would think that this would be a safe Democratic seat, so a Hispanic Dem would win here. Without the deal, we just picked up two seats.

    Here’s where it gets complicated:

    Photobucket

    Southern Texas. Let’s ignore the El Paso seat because it’s a safe Dem seat anyway. Let’s also ignore the yellow suburban San Antonio seat because it’s safely Republican and not completely drawn (and Lamar Smith’s). Here, we have six VRA-protected Hispanic seats. They cannot be packed along the border (no McAllen-only district) because that would put too many Hispanics in one district, which was ruled unconstitutional after the DeLaymander.

    Let’s go left to right.

    PURPLE DISTRICT

    Obama: 47%

    McCain: 52%

    White: 37%

    Black: 3%

    Hispanic: 58%

    When Bonilla was the congressman for this district, it was R+14. After the DeLaymander, the district was ruled unconstitutional because it didn’t have enough Hispanics of voting age. Well, this district is 58% Hispanic now, compared to Ciro Rodriguez’s current district, which has 55%. So I think this would pass muster. This is where the GOP can screw everything up (and open a whole big can of worms). They can draw this district to elect a Hispanic Republican, but they will be open to lawsuits as it takes in heavily conservative white suburban parts–but, hey, it’s a gerrymander! We can still hold this seat, but it gets harder.

    Red District

    Obama: 54%

    McCain: 45%

    White: 33%

    Black: 7%

    Hispanic: 57%

    This would be frustrating for Dems, as Cuellar now has to enter San Antonio. Still, this is a safe Dem district.

    Green District

    Obama: 50%

    McCain: 50%

    White: 27%

    Black: 3%

    Hispanic: 69%

    A newly-created district, we would be competitive, but I think it would be hard. However, with changing demographics, I think this is winnable very soon.

    The District With Brooks County (sorry, I don’t know what color that is)

    Obama: 61%

    McCain: 38%

    White: 18%

    Black: 1%

    Hispanic: 80%

    Corpus Christi District

    Obama: 52%

    McCain: 47%

    White: 28%

    Black: 3%

    Hispanic: 67%

    San Antonio Blue District

    Obama: 66%

    McCain: 33%

    White: 19%

    Black: 5%

    Hispanic: 74%

    Here are some more close ups:

    Photobucket

    Photobucket

    What this means is that the Purple and Green districts would become ultra competitive (and lean Republican). Still, the demographics changes could eventually lead to a Dem flip.

    Conclusion:

    Even without such a deal, we will likely gain two seats due to the VRA anyway. In addition, one of the other added seats is a Hispanic majority seat in Southern Texas that would be a tossup.

    Since the Dems have a little leverage (a possible gubernatorial win or a possible takeover of the House), they could push to take the two of the newly-drawn districts Dallas and Houston districts (which they’ll get anyway), protect Edwards, and draw all of the Southern districts. I think that would probably be the best.

    And, lastly, this took forever!!! So please comment and tell me what you think.
    Weekly Open Thread: What Races Are You Interested In?

    We’re very proud to announce that we recently welcomed our 8 millionth visitor to the Swing State Project. To help us celebrate, we’re looking to hit another couple of important milestones on Twitter and Facebook: we need five more followers on Twitter to hit 1500 and 32 more fans on Facebook to hit 400. Who will put us over the top?

    UPDATE: Thanks everybody! We blew right through our Twitter goal, but we’re still 18 13 11 5 swingnuts short of an even 400 on Facebook. I know we can do this!

    LATER UPDATE: We did it: 401 fans on Facebook! Thanks for your support, everyone!