Updated!! Arizona, take 2

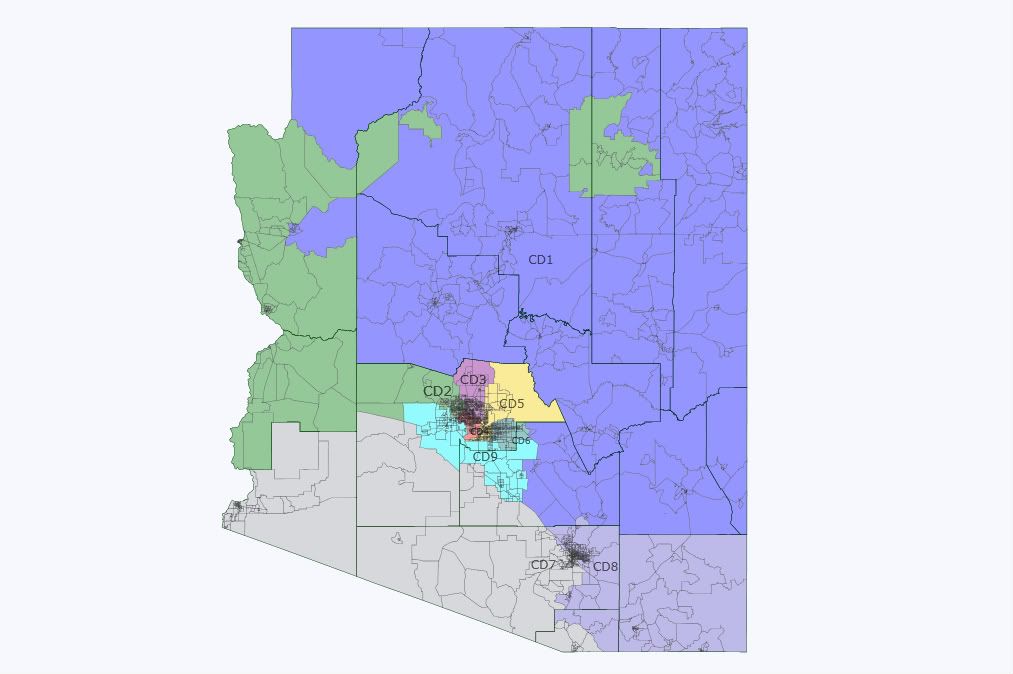
Speak of the devil! After all my grumbling about the inadequacy of the county-level population estimates, it turned out that our friend Dave was about to produce new tract-level estimates from the American Community Survey. So here is a new district map of Arizona, with exactly the same concept (new exurban AZ9 drawn mostly from the overpopulated AZ2, AZ6, and AZ7) but actual district boundaries as opposed to rough guesses.

With the ACS estimates, the aggregate population was very close to the Census 2010 figure so the “phantom” problem disappeared. It also turned out that Nico was exactly right about how much the old districts had grown: AZ6 was first, followed by AZ2, AZ7, and AZ8. AZ3 and AZ4 weren’t far behind, and AZ5 was actually about 9k understrength.

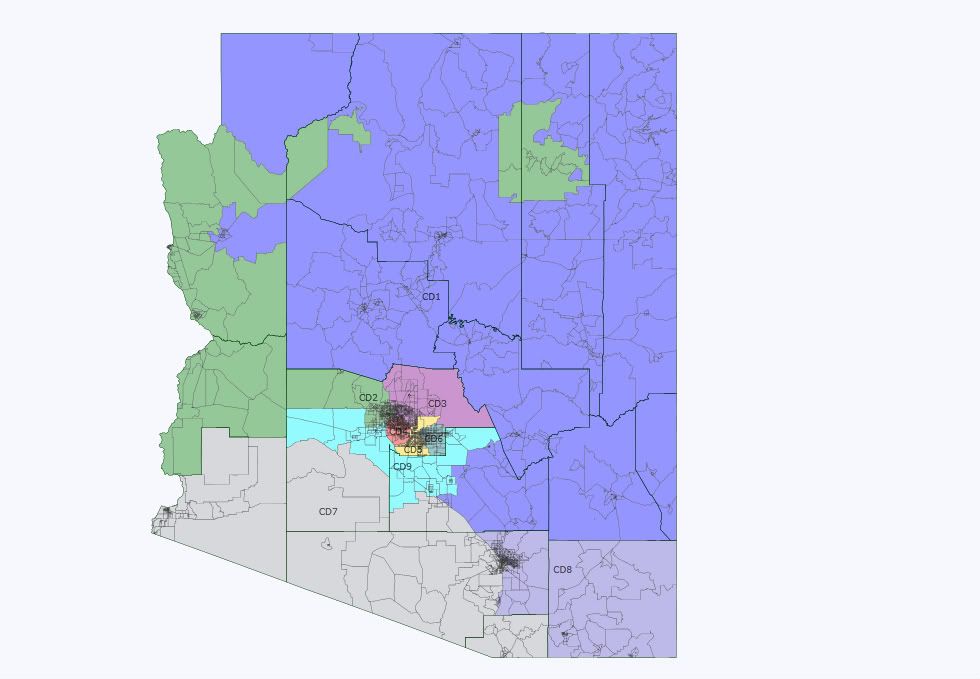
Here is the new state-level map:

Photobucket

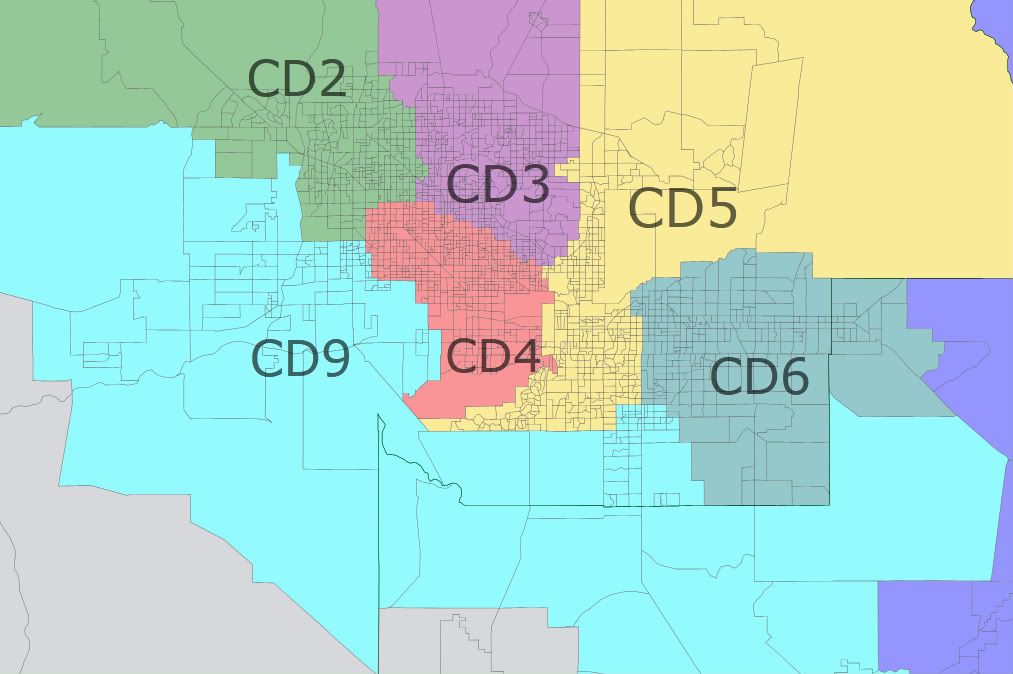
The Phoenix map:

Photobucket

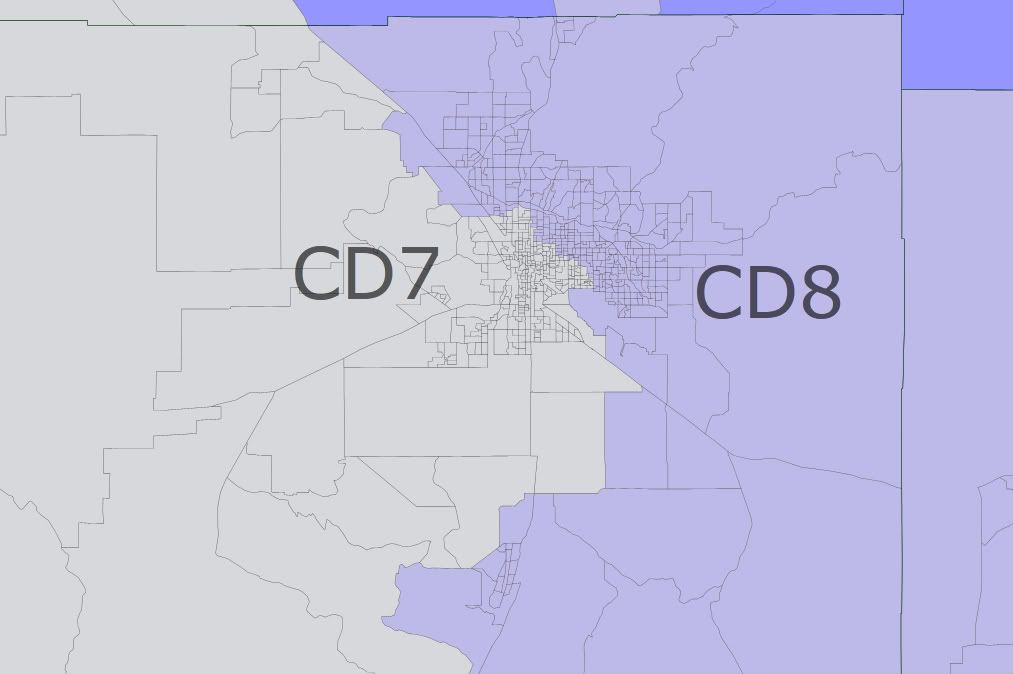
I drew a serious border between AZ7 and AZ8 instead of just guessing, so here is the Tucson map:

Photobucket

District notes:

AZ1: The boundaries were almost identical to the first map I drew, as it needed to take the strip and Kingman from AZ2 to hit its target. Ethnic mix: old 58 white/18 Hispanic/20 Native American, new 61W/15H/21N. Probably a bit more red now.

AZ2: Lost a bit more territory than I expected to the new AZ9. Ethnic mic: old 70W/20H, new 73W/18H.  

AZ3: Had to lose about 45k, and lost them all on its southern end to AZ4. No need to take any of AZ5, which was below its target. Ethnic mic: old 71W/20H, new 73W/18H.

AZ4: Also had to lose about 45k and AZ9 took a big bite out of its southwest corner, forcing it to move a bit north. Not as pretty as it was before, but still nice and blocky. Ethnic mic: old 22W/66H, new 24W/64H. I don’t think Ed’s worried.

AZ5: Only 9k under its target, it could basically stand pat. Swapped a few districts with AZ6 to make the lines cleaner. Ethnic mic: still 71W/17H.

AZ6: I decided to keep Apache Junction here since it’s really an extension of east Mesa and didn’t grow much in the 00s. As in the previous map, it loses the rest of its Pinal piece to AZ9 and its Chandler piece (this time mostly to AZ9 instead of all to AZ5), and retains Gilbert, Queen Creek, and almost all of Mesa. Ethnic mic: old 71W/21H, new 72W/20H.

AZ7: It had to keep a bigger than expected piece of Pinal, which resulted in AZ9 being pushed north. It had to take about 57k people from AZ8, and the current boundaries are a fairly straightforward northwest-southeast line as opposed to a strained attempt to jam as many Hispanics as possible into AZ7. I decided to stick with this and had AZ7 nibble at the edges of AZ8, although I restricted it to tracts that were at least 20% Hispanic. Ethnic mic: old 34W/55H, new 36W/54H.

AZ8: Looks much more like the current AZ8 than my previous map did, and keeps its Pinal tract now. The pieces it lost to AZ7 had the effect of reducing the Hispanic percentage in both districts. Ethnic mic: old 70W/21H, new 71W/20H.

AZ9: The previous AZ9 I drew turned out to not have enough peeps, so now it has to go deep into Chandler on the east side and well north of I-10 on the west side. Interestingly this district is majority-minority at 46% white, 41% Hispanic, and 6% black which is high for Arizona. It probably leans Dem at least in a presidential year.

(here is the original post in its entirety)

Short version: Exurban areas of Pinal and Maricopa counties that grew like a weed in the 00s are carved out of districts 2 (Franks), 6 (Flake), and 7 (Grijalva) to form a new district 9. The other 5 districts only get minor tweaks to meet population requirements for the most part.

This map is my interpretation of shamlet’s description of his own map with an exurban AZ9. My original concept was for AZ9 to stay entirely within the west valley of Maricopa county including the established cities of Glendale and Peoria along with some of the bubble areas to the south, pushing AZ2 to the west to pick up Yavapai county and forcing AZ1 (Gosar) to pick up almost all of Pinal county. I decided that I liked shamlet’s concept better, as mine would have been more disruptive to the current map and would have likely resulted in AZ1 being dominated by exurban Pinal at the expense of its far-flung, highly diverse rural communities.

Some words of warning: The boundaries between the districts are approximate, not absolute. The population estimates in the redistricting app only go down to the county level. This is fine for a state like Iowa where no county is big enough to contain as many as one district, but it causes trouble in Arizona which has just 15 counties, with nearly 80% of the population in just two of them! The distribution of population within Maricopa and Pima counties is uncertain, especially in Pima where nearly 90% of the population is either in Tucson or in unincorporated areas. I drew the lines based on my best guess. A further complication is that the 2010 census shows the state with 6.39m people, well below the 2009 estimate of 6.60m. This map is based on the 2009 estimates for cities and counties, which somewhere include 200k people who apparently aren’t really there. I suspect that a disproportionate number of these phantom people are in the bubblicious AZ9, but they could be anywhere. It will be interesting to see the 2010 census figures for cities and counties, but we don’t have those yet, so…

Here is the statewide map, with the usual color scheme.

Arizona

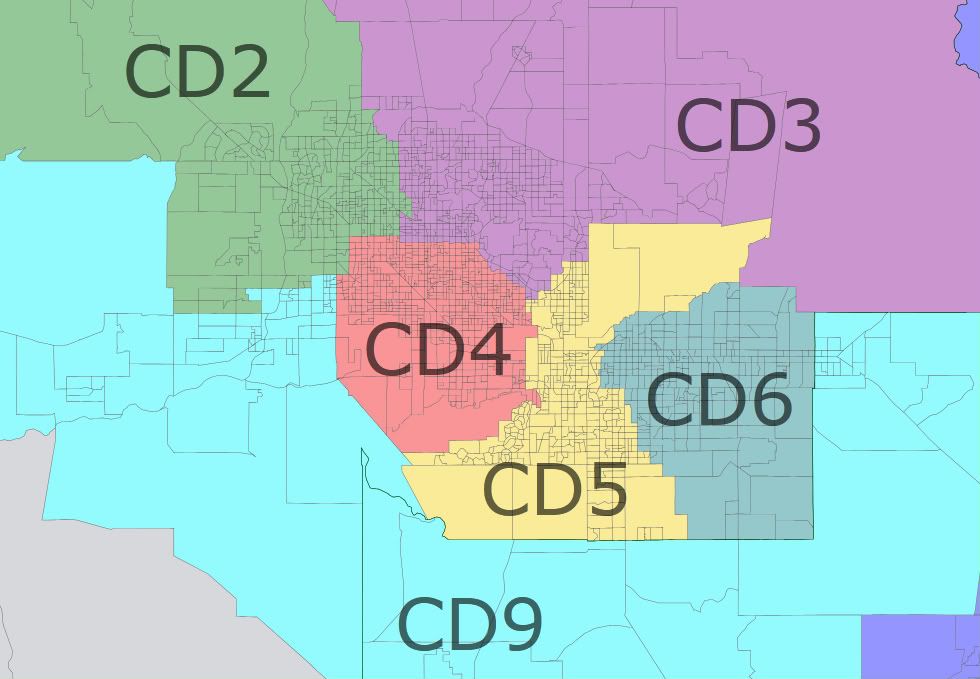
And here is the close-up of the Phoenix area.

Phoenix area

Now for notes on the individual districts. The target population for each is 713k.

AZ1 (blue): Paul Gosar’s district has an estimated population of 619k (less any phantoms) in its core counties of Yavapai, Coconino, Apache, Navajo, Gila, Graham, and Greenlee. That means it probably needs about 100k from somewhere else, either Mohave or the less populated eastern end of Pinal. I’m  guessing that they would get about that amount from the Kingman area and the “strip” north of the Canyon in Mohave, and from eastern Pinal which has a lot of old mining towns that fit well with the rest of the district. Changes: loses some of south-central Pinal to AZ7, picks up Kingman and strip areas from AZ2 and one Pinal precinct from AZ8 (Giffords).

AZ2 (green): Trent Franks’ district will have to shed a lot of people, but even after losing the Kingman and strip areas and the (formerly?) fast-growing areas of southwest Maricopa, it retains its west valley base with Peoria, most of Glendale, Surprise, and the Sun Cities. I moved La Paz county here from AZ7, as with 33% of its population over age 65 it fits better in AZ2. The boundary shown here between AZ2 and AZ9 is just a guess and could move north or south depending on the final counts. As always, the Hopi reservation is separated from the surrounding Navajo reservation and attached to AZ2. I intended no change in the river-connector between the Hopi rez and the rest of the district, although it does not show up on the map.

AZ3 (purple): I drew Ben Quayle’s Phoenix-dominated district to lose some of its southernmost precincts to AZ4 (Pastor) and absorb north Scottsdale and Fountain Hills from AZ5 (Schweikert), but it appears that it grew faster than AZ5 did. The increase in the House vote from 2002 to 2010 was 34% in AZ3 and just 25% in AZ5, so it’s possible that AZ5 could retain its northeast end. AZ3 could also lose some of its western end to AZ2 if it turns out that AZ2 is too small after AZ9 fills up.

AZ4 (red): Ed Pastor’s Phoenix district started the decade with by far the least undeveloped land of the 8 districts and probably had the least new construction, but its House vote increased by 39% from 2002 to 2010. Its people still vote at a rate far below the state’s other districts (just 92k total votes; the other  7 were all over 150k and 6 were over 200k), so this increase may represent increasing Hispanic participation more than population growth per se. The Census estimated that Phoenix grew just 21% between 2000 and 2009 and it seems likely to me that most of this growth was in AZ3, so I drew AZ4 to pick up some of AZ3’s southern precincts. This may be the cleanest-looking VRA district in the country, and I drew it to stay that way.  If it needs to contract, it would lose some of its southwestern precincts to the new AZ9.

AZ5 (yellow): I generally tried to keep existing districts together, but in this case I went for keeping cities together. David Schweikert’s district loses its Mesa piece to AZ6 while picking up the rest of Chandler. It now consists of Tempe (179k in 2009), Chandler (250k), Ahwatukee (85k in 2000 but probably more in 2009), and enough of Scottsdale (238k) starting from its south end to fill up to its quota of 713k.

AZ6 (teal): Jeff Flake’s district shrinks considerably and pulls entirely out of Pinal. It now consists of Mesa (467k), Gilbert (222k), and Queen Creek (26k) which put together would be big enough to make up a district if not for the phantoms. It could take Chandler-area precincts that I drew it losing to AZ5 as necessary to fill up.

AZ7 (gray): There are a total of 1.39m people (again, less any phantoms) in the four southern counties of Yuma, Pima, Santa Cruz, and Cochise, which is nearly enough to support two districts. Raul Grijalva’s district can pick up the necessary overage from the sparsely populated Gila Bend (I-8) section of Maricopa and the southwest corner of Pinal. If needed it could also retain La Paz, which as mentioned above is a poor fit for the district in my view. I don’t know where the border between AZ7 and AZ8 in Pima should go. I suspect that the AZ8 piece of Pima grew faster, as the House vote increase from 2002 to 2010 was 32% in the AZ7 section compared to 40% in the AZ8 section. I had AZ7 take the mostly-empty remaining sections of Santa Cruz and a few Pima precincts mostly west of I-10 or I-19 from AZ8.

AZ8 (blue-gray): I suspect that poor Gabrielle Giffords’ district won’t have to lose too much ground. Its House vote increased 41% from 2002 to 2010, but this may have been partly due to the 2010 race being a barnburner whereas 2002 was a snoozer. Cochise county grew 10% in the 00s and Pima 21%, and it’s likely that the AZ7 section of Pima grew at a decent clip so it seems probable that AZ8’s growth was less than its vote totals suggest. This district loses its small Pinal and Santa Cruz pieces and otherwise looks about the same as before.

AZ9 (toothpaste blue): The new district comes almost entirely from the fast-growing exurban Phoenix areas of southwestern Maricopa and western Pinal. It combines the Pinal portion of AZ6, some south-central Pinal areas of AZ1, the Phoenix-area piece of AZ7, and much of the southern end of AZ2. Its population centers include Avondale (85k), Buckeye (52k), Goodyear (64k), the city of Maricopa (45k) which oddly enough is in Pinal, most of unincorporated Pinal (161k), Casa Grande (44k), Apache Junction (34k), and probably a fair portion of unincorporated Maricopa (229k). This district may have the highest percentage of homes in foreclosure in the nation, and probably more phantoms than any of the other districts. As necessary it could take some of the eastern part of Pinal from AZ1 or the southern end of AZ2 to get up to full, which would affect the division of Mohave county between AZ1 and AZ2. Politically this district would probably start out tilt-R or lean-R but shift D as its Hispanic population starts to vote more. Flake won exactly 2/3 of the two-party vote in the AZ6 Pinal piece (30k total votes), although this was less than his districtwide margin. On the other hand, the very liberal Grijalva won 54% of the two-party vote in the AZ7 Maricopa piece (24k total). The current AZ2 is blood-red, but the piece it would lose to AZ9 is most likely younger, poorer, and more Hispanic than most of the rest of the district given that housing prices tend to be lowest in the furthest-out areas. Gosar did about as well in the Pinal section of AZ1 as he did districtwide, but the section that would be lost to AZ9 may differ from the section that would remain in AZ1.

Overall, Arizona presents a rare case where a new district can be created without fundamentally changing any of the existing districts. The state’s most explosive growth areas were nearly empty at the start of the decade and close enough together that combining them makes a compact, contiguous, sensible district that would pass muster in a commission-redistricting state. AZ2, AZ6, and AZ7 lose a lot of territory, but almost everyone who lived in one of these districts in 2002 and stayed put will still be in their old district. None of the current House members are likely to be helped or hurt much. Grijalva will be glad to be rid of La Paz but not so much his Phoenix-area precincts, and Gosar would like to pick up some of Mohave, but these are marginal changes.  

Thoughts?  
By what margin will Bob Shamansky win?

View Results

Loading ... Loading ...

South Carolina: 3 Minority-Majority Seats

This is a short diary for me – and one where I just wanted to “make a point.”

The diary is not really about South Carolina, although the state is used here as an example.  The VRA has been discussed in a number of diaries recently, but I think it’s important to revisit this issue again.  I previously did a post on South Carolina where two compact black-majority districts are created:

http://www.swingstateproject.c…

In this diary, three minority-majority districts are created.  Granted, they are not as compact (and would likely not pass a Supreme Court test as they are pretty clear racial gerrymanders), and the African-American percentage is only 49% in each district using the “new population estimate” in Dave’s Application.

Photobucket

Here’s a quick breakdown (pop. deviation is +/- 865 persons, btw).

Yellow – 49% black; 45% white (50%+ black; 46% white using “old” estimate)

Teal – 49% black; 46% white (51% black; 45% white using “old” estimate)

Gray – 49% black; 44% white (49% black; 47% white using “old” estimate)

Blue – 81% white; 10% black

Red – 78% white; 16% black

Green – 82% white; 10% black

Purple – 79% white; 14% black

Nevertheless, I am confident that, assuming the population figures under the Application are correct, it would be quite possible to make each district 50%+ African-American if precincts were split, lines were further refined, etc. — but that’s not really my point, as three black-majority districts will certainly not be drawn in South Carolina in 2012.

My point instead is that — if it’s basically possible to draw 3 black-majority seats in South Carolina — then it’s almost a “must” that just 2 are drawn, and furthermore, the Obama DOJ should not pre-clear any map of a state under the VRA where that map does not reflect the diversity of the state.

The above point should apply for states like South Carolina, which are gaining seats; states like Louisiana, which are losing seats; and states like Virginia, where the number of seats remains constant.  In a previous diary over a year ago, I drew 2 compact black-majority seats in Louisiana:

http://www.swingstateproject.c…

Just yesterday, roguemapper demonstrated how 6 compact minority-majority seats can be drawn in Georgia:

http://www.swingstateproject.c…

Here’s a map I did a while back (and posted only as an attachment to a diary comment) where Virginia gets 2 black-majority seats (and I have seen basically the same map done independently by several other posters on this site).  About 20% of Virginia’s population is African-American; yet there is currently only 1 black-majority district (out of 11) — where all the black population is “packed.”  Incidentally, using the “new population estimate”, the green district here (Hampton Roads area) is 51% black – 41% white, while the yellow district (Richmond and Southside area) is 52% black – 42% white.

Photobucket

Now, below is a really important map — that of geographic areas covered by the VRA:

Photobucket

I’m really not sure what the Obama DOJ will do regarding this issue, but I hope that they will take a strong stand in favor of drawing districts which reflect the diversity of the covered states, and will pre-clear only those maps which pass muster under that standard.

Daves Redistricting 2.0.5

Thanks to all of you who filled out the survey. Highlights below the fold.

But first, I uploaded a new version a couple of nights ago. The changes are:

— the New Way to color is the default (Old Way still there) and the annoying dialog box to choose is gone.

— Loading a 1.0 file that used special data is fixed. (If it’s TX you have to choose special or not; for NY and CA the app can figure it out.)

County lines are a little thicker Correction: coming soon.

— Biggest change: Better Population Estimates if you use Block Groups (for some states: all states coming soon)

— Also Block Groups are now there for all New England States, which give you much finer grain control (as many requested).

http://davesredistricting.com

On population estimates:

Astute observers have noticed that I’ve used County-Level population estimates (2008). Until recently, this was all that was available from the Census Bureau. This meant that any change in a county’s population had to be distributed among the voting districts or block groups. The app does this by assuming that every voting district/block group changed at the exact same rate. This is of course not the case and in counties where there has been significant growth the numbers can be off by a lot.

Recently the Census Bureau released 5-year American Community Survey data at the block group level. I’ve enabled the app to use this data, so if you choose Block Group instead of Voting Districts, and select Use New Pop Est, if the ACS data is on the server, the app will use it. That data is currently available for AZ,CA,FL,GA,MI,NJ,NY,OH,PA,TX and WA.

So, if you want to make more accurate maps, use Block Groups. Of course, there is no partisan data for Block Groups. There’s nothing at this time I can do about that.

Some quick highlights of the survey:

— 80% use Version 2.0 most

— Main like of Version 2.0 is seeing streets (50%); to a lessor degree save/open (30%), JPEGs (30%), Renumber (33%)

— Main dislikes of Version 2.0 ways to pan/zoom/color (each 30%), lose work (12%), move/resize labels (12%)

— To Color districts, 50% like New Way better, 30% Old Way, 20% never used New Way

— Mac Users (16%), Win7 (34%), Vista (24%), XP (26%)

— On the Rate features easy/hard/never used, the majority rated almost everything Very Easy or Easy. Exceptions (majority either neutral, hard or not used):

     – Renumber CD, Recalc CD labels, Area Views, Save As JPEG, Auto Assign Districts, Find CD Parts

Wish List:

(1) By Far: more election data.

(2): non-election data, faster.

(3): Allow LDs and CDs together, measure compactness, demographics for DragBox.

(4): output summary, shared maps, more Auto Assign strategies.

(5): Hide vote district boundaries, Help walkthroughs.

Other things that I’ve had requests for (either in the survey or email) include: the 1 CD states; ability to redistrict single counties; bring back city boundaries….

I’m going to look at the results more and I’ll do my best with all of these features.

I’m still working on trying to get funding to keep working on this. If you have any leads to non-profits who would support this, please let me know. And I’ll keep you posted on that front.

Thanks.

Handicapping the VA 2011 races in NoVA (Part 1-State Senate)

One of the few states holding elections this year is Virginia, where the entire state senate and house of delegates will be up for reelection in addition to some local races. I will be doing a series of diaries offering my early assessment of how the races here in Northern Virginia could turn out, and what that could mean for 2012. This diary will cover state senate races, Part II the races in the house of delegates, and Part III the local races for offices like County Supervisor. These races seem very down in the weeds, but in a crucial state for 2012 like VA they can give an idea how strong each party is leading up to the presidential election.

The state senate is controlled by Democrats, who took the senate in the 2007 elections. The state senate is currently the last bastion of Democratic control in VA, so taking it back will certainly be the #1 goal of the VA GOP in 2011. The GOP has a fairly easy path towards taking back the senate; they need to flip three seats in order to regain control (a two-seat gain for the GOP would result in a tie, giving tie-breaking power to republican lt. gov Bill Bolling). The GOP could do this by defeating long-serving blue dog senators in extremely conservative districts in the southern part of the state. Many of these senators have been considered so entrenched that they haven’t faced a serious challenge in a while, but OTOH the GOP has had some success in winning against similar incumbents across the south recently. Regardless of what happens in the south of the state, there will certainly be a lot of contested races up here in NoVA, and that is what I intend to cover. The one caveat here is that we don’t know what redistricting will do to many of these districts. I will try my best to make predictions as to what redistricting could do to these races, but as with many races that is a major unknown here.

One of the resources I will be using heavily here are the great maps provided by the Virginia Public Access Project. They have maps down to the precinct level of all statewide and state legislative elections across Virginia available by county, house district, or senate district, not to mention all the other cool stuff that they have (maps of turnout, detailed info on redistricting, fundraising info, etc). I don’t know of any other state that has such a good resource available.

Let’s start with the easiest districts to predict. The 30th, 31st, and 35th are all highly democratic seats that will not be competitive this year. Safe D

Now on to the more interesting districts.

* 32nd District

Areas: McLean, Great Falls, Reston, Herndon

Senator: Janet Howell (D)

2009 Gov: 53% Deeds, 47% McDonnell


2008 Pres: 60% Obama, 39% McCain


2007 State Senate: Uncontested

SSP Daily Digest: 1/19

FL-Sen: With everyone fixated on the three retirements in the Senate in the last week (although the Fix makes the good point this morning that by this point in the 2010 cycle, there had already been four retirements), Bill Nelson seems compelled to point out that he won’t be one of them. In front of as many reporters as possible (at an AP gathering), he confirmed today that he’s running again.

MO-Sen, MO-06: Wow, this is out of nowhere (although I’m not sure whether this is going to have any legs beyond today), but potentially very interesting: Republican Rep. Sam Graves is suddenly expressing some interest in the Senate race, calling it a “great opportunity.” He’s been in the House since 2000 and is chair of the Small Business Committee, so giving that up would be a big move. He may be seeing the diminished likelihood of a Jim Talent run and sensing there’s room for another establishmentarian-type candidate to go against the more tea-flavored Sarah Steelman. (This would open up MO-06 in the state’s rural northwest, which was Dem-held before Graves but has shifted to the right, currently R+7; Dems tried to make it competitive in 2008 and didn’t get any traction.)

ND-Sen: Ready for a whole lot of names of people who might run for Senate? In fact, let me just blockquote the Bismarck Tribune, rather than transcribing it laboriously:

The list of Republicans whose names are being thrown out include Gov. Jack Dalrymple, Lt. Gov. Drew Wrigley, Rep. Rick Berg, Attorney General Wayne Stenehjem, Tax Commissioner Cory Fong, Public Service Commissioners [Brian] Kalk and Kevin Cramer, Sen. John Hoeven’s state director Shane Goettle, GOP state treasurer Bob Harms, and Great Plains Software developer Doug Burgum.

As for Democrats, names circulating include both [ex-state Sen. and radio host]Joel and [ex-AG] Heidi Heitkamp, former state Sen. Tracy Potter, USDA Rural Development Director Jasper Schneider, state Sen. Mac Schneider, U.S Attorney Tim Purdon, Conrad’s state director Scott Stofferahn and former Byron Dorgan staffer Pam Gulleson, former agriculture commissioner Sara Vogel, former state Rep. Chris Griffin, State Sen. Tim Mathern of Fargo, Senate Minority Leader Ryan Taylor and even Earl Pomeroy.

The Bismarck Tribune article also gets a number of these people on record, although their comments are all various degrees of noncommittal. Kent Conrad tipped his hand a bit yesterday, giving nods in the Grand Forks Herald to both Heitkamps, as well as to Schneider. One other Dem who got mentioned a lot yesterday, Roger Johnson (the president of the National Farmers Union) has already said he’s not interested. And in what’s not a surprise, the Tea Partiers aren’t happy with anyone of ’em (although some had some words of praise for Berg), but are still promising to “battle for control.”

VT-Sen: It looks like Republican state Auditor Tom Salmon’s Facebook attacks on Bernie Sanders weren’t just the work of a bored guy at work but, as many speculated, part of a coordinated plan to move toward a run against Sanders; he’s now publicly saying that he he’s interested in the race. Color me puzzled: why would Salmon (who was a Democrat until a year and a half ago) go after an entrenched institution like Sanders in 2012 when he could run for Gov. against Peter Shumlin, who’s just getting situated and won by only a narrow margin in 2010?

KY-Gov: This one gets filed straight to the Department of Foregone Conclusions, but it was made official today: Republican state Sen. president David Williams and Ag Comm. Richie Farmer filed their candidacy papers today, to go up against incumbent Dem Steve Beshear in November.

WV-Gov: We’re getting some pushback/clarification from Shelley Moore Capito’s team regarding claims from gubernatorial candidate Betty Ireland that she wasn’t going to run for Governor; a spokesperson says the only thing that’s off the table is a run in the special election for Governor (which we know now will be held this November). She’s still open to a bid for either Governor or Senate in 2012. Dave Catanese also wonders whether Capito’s timeline is a little longer, i.e. a 2014 run against Jay Rockefeller (or for his open seat, if he retires, seeing as how he’ll be 77 then). It’s also looking like the candidates for November’s special election will be picked by primary rather than by the parties; acting Gov. Earl Ray Tomblin, who was the main impediment to a 2011 election until yesterday’s supreme court ruling, says he’s working with SoS (and likely Dem primary opponent) Natalie Tennant to set special primaries in motion.

NY-13: Ex-Rep. Mike McMahon seems to be laying groundwork for a rematch against Mike Grimm, who defeated him narrowly in 2010. He reached out to members of the Staten Island Democratic Association at a meeting last night.

OR-01: Rep. David Wu has always struck people as a little odd (many of you probably remember his Klingons speech), but it seems like something has intensified lately, and it’s starting to come out in the open. It’s been revealed that in the last few months, he’s lost a number of his key staffers amidst complaints about his public behavior, including his chief of staff (who left to join a Rep. with less seniority) and his communications director (who left without having another job lined up, which is even more highly unusual, especially in this economic climate). This chief fundraiser and chief pollster also say they don’t plan to work with him any longer. This is a D+8 district with a robust Dem bench, which is good because this may be a difficult story for Wu to shake, especially given general rumblings of discontent with him that have been building over time.

Mayors: Philadelphia mayor Michael Nutter looks like he’s in good shape for his 2011 re-election, according to a new poll from Municipoll. Nutter’s at 47-39 against Generic D primary opponent, wins a three-way primary against Bill Green and Anthony Williams 46-21-18, and wins a three-way against Sam Katz and Williams 44-22-21. Interestingly (though consistent with the original coalition that elected him), Nutter has stronger support among whites (64% favorable) than he does among African-Americans, at 45%. (Nutter is black.) Nutter also just secured the support of the Laborers union. Even further down the weeds in Philly, Republican state Rep. (and, briefly, former speaker) Dennis O’Brien will run for a vacant city council seat in NE Philly. That’s good news, because it might free up his state House seat and make any Dem attempt to retake the state House in 2012 easier, seeing as how his seat is one of the most Dem-leaning seats held by a Republican.

Minnesota: Two stories developing in Minnesota; one, the legal battle over 2012 redistricting has already begun, with Minnesota its first flashpoint. With the GOP controlling the legislature (but not the governorship), Dems have filed a suit seeking an injunction requiring legislators to submit proposed redistricting plans directly to the court (where they’ll probably wind up anyway, regardless of how this suit goes). Also, Minnesota GOP legislators are seeking to emulate their next-door neighbors in Wisconsin in making it more difficult to vote, seeking to push a voter ID bill.

Redistricting: You may remember some Republican laments from a few days ago about the apparent failure of their MAPS program to raise the money needed to coordinate redistricting at a national level; those fears seem to be spreading, including to ex-Rep. Tom Reynolds, who’s spearheading the process for the GOP this year. Part of the problem seems to be that they spent so much money winning control of state legislatures in November that nothing was reserved for coordinating the subsequent redistricting. Nathan Gonzales also previews how state legislators from both parties are currently hunkering down in Washington learning (since many weren’t in office in 2000) the redistricting process from the ground up; in particular, they’re learning the new technologies (like GIS programs like Maptitude), which obviously have come a long way since the last round of redistricting.

Census: Hats off to the Census Bureau, who, just in time to go with their upcoming onslaught of 2010 data, have launched a new and improved version of American FactFinder (the main research tool on their site), a significant improvement over the rather clumsy and unintuitive existing version. I wouldn’t go so far as to call the new version intuitive either, but it makes multi-variable searches and customized maps much easier.

CT-Sen: Lieberman Exits, Stage Center-Right

This seemed like a pretty foregone conclusion based on all of yesterday’s leaks and chatters, but at his lunchtime press conference today in Stamford, CT, Joe Lieberman just made it official: he will not be running for a fifth term in the Senate.

“I have decided it is time to turn the page to a new chapter, and so I will not be a candidate for re-election…”

“I promised [my wife] that when Regis leaves television, I’ll leave the Senate.”

The exit of Lieberman, who had many different ways of approaching the 2012 Senate race but probably no way of winning it, makes things easier for the Democrats here, turning this into a very straightforward two-way instead of a hard-to-game three-person race. Whether that Dem nominee will be Chris Murphy, Susan Bysiewicz, or somebody else… that’s the new big question in Connecticut.

UPDATE: If you haven’t seen it, here’s an excellent overview of Lieberman’s rise and fall, from Salon’s Steve Kornacki, who as always knows his history. Our younger readers may not be familiar with Lieberman’s first election in 1988, which he won by running to the right of iconoclastic Republican incumbent Lowell Weicker.

Race and Crime In The Big City: The Baltimore States’ Attorney Race (Conclusion)

This is the final installment in a four-part series about the 2010 Democratic Primary for States’ Attorney for Baltimore City in Maryland.

Why is this race notable? Well, the result, an upset win by challenger Gregg Bernstein over incumbent States’ Attorney Patricia Jessamy, challenged a lot of widely-held assumptions about racial dynamics in large cities and how one can win elections in the City of Baltimore and perhaps other similar jurisdictions.

Not to rehash the introduction, but since it’s been a while now… Jessamy had been pretty popular among the Black majority in Baltimore but was strongly disliked by the law enforcement community and had a feud with then-Mayor Martin O’Malley about police tactics. She was re-elected in 2006 with 71.52% of the vote against an largely unknown opponent in the Democratic primary named Aaron Fogleman who ran a minimal campaign. Fogleman nonetheless won nearly half of the White vote, and about 15% of the Black vote.  

So not many people gave Gregg Bernstein much of a chance when the campaign got off to a slow start in the spring, but the skeptics, myself included, were proven wrong…  

For a broad overview of what’s going on here, check out Part 1. For a summary of the methodology I used and what I looked for, check out Part 2. For a whole bunch of data about Baltimore elections and my attempt to put them in the context of what I expected to see when I looked at the election that was the subject of this series, check out Part 3.  

To refresh your memory, I classified Baltimore’s voting precincts (based on data from Dave’s App, which unfortunately is out of date b/c the city did a lot of precinct consolidation between 2000 and 2006) into six categories and twenty zones:

By Category:

baltbyrace

Type I: Red on the map. More than 70% White, less than 5% Hispanic and Asian population. Mostly found on the periphery of town. The Federal Hill, Mt. Washington, Roland Park, and Hampden areas consisted mostly of such precincts.

2006: Jessamy 7311 (51%), Fogleman 6932 (49%)

2010: Bernstein 10127 (79%), Jessamy 2447 (19%), Lansey 290 (2%)

Type II: Green on the map. More than 5% Hispanic. (Most of these were predominantly white, but two were otherwise predominantly black.) The lion’s share of these precincts were in Fells Point, Canton, or Highlandtown.

2006: Jessamy 1649 (50%), Fogleman 1630 (50%)

2010: Bernstein 2290 (77%), Jessamy 595 (20%), Lansey (3%)

Type III: Yellow on the map. More than 5% Asian. (Most of these were predominantly white, but two were otherwise predominantly black.) Most of these precincts were found in Downtown/Midtown or Charles Village, with a few that marginally qualified in Hampden.

2006: Jessamy 2331 (55%), Fogleman 1871 (45%)

2010: Bernstein 2994 (75%), Jessamy 898 (23%), Lansey 76 (2%)

Type IV: Gray on the map. None the above, but with more Whites than Blacks. They were scattered across town, with a cluster of them is in Northeast Baltimore.

2006: Jessamy 1706 (64%), Fogleman 976 (36%)

2010: Bernstein 1287 (58%), Jessamy 851 (38%), Lansey 91 (4%)

Type V: Teal Blue on the map. None of the above, more Blacks than Whites but Black population less than 70%. They are also scattered across town, and Northeast Baltimore has a cluster of them.

2006: Jessamy 3438 (71%), Fogleman 1386 (29%)

2010: Bernstein 1848 (48%), Jessamy 1837 (48%), Lansey 139 (4%)

Type VI: Blue on the map. More than 70% Black, less than 5% Hispanic and Asian. The West Baltimore, East Baltimore, and Forest Park/Arlington zones consist exclusively of such precincts; the Near West Baltimore, Frankford, Govans/Northwood, Waverly/Montebello, and Park Heights zones consist mostly of such precincts.    

2006: Jessamy 33413 (83%), Fogleman 6841 (17%)

2010: Jessamy 19200 (66%), Bernstein 8760 (30%), Lansey 1324 (5%)

By Neighborhood:

baltbyzone

[Note: Part 3 of this series contains more detailed descriptions of each of these clusters of neighborhoods than can be found here.]

Brooklyn/Cherry Hill [dark blue]:

2006: Jessamy 1131 (71%), Fogleman 473 (29%)

2010: Jessamy 705 (49%), Bernstein 633 (44%), Lansey 104 (7%)

Traditionally working class and racially mixed south Baltimore sums up Pat Jessamy’s whole problem in this re-election, even though she retained a bigger share of her 2006 vote total here than in the city as a whole. It was also the best-performing region for little-discussed third candidate Cheryl Lansey, also an African-American female, accused of being a spoiler candidate by Jessamy supporters.  

Federal Hill/Locust Point [dark green]:

2006: Fogleman 1013 (55%), Jessamy 823 (45%)

2010: Bernstein 1759 (86%), Jessamy 231 (11%), Lansey 58 (3%)

The whitest and generally most Republican-voting part of town (in 2006, Ehrlich topped 40% here while Steele topped 35%; in 2008, McCain fell just short of 35%, all very high for Baltimore) had already thought so little of Pat Jessamy that they voted for someone who barely campaigned over her in 2006. Bernstein swept all 10 of it’s precincts; one precinct, 24-02, gave the incumbent 4 votes of 90, her worst showing in the entire city. In context these numbers are unsurprising. But 11% is really low, and, even worse for Jessamy, this was one of only three zones to have a higher vote total in the 2010 primary than in the 2006 one.

Southwest Baltimore [purple]:

2006: Jessamy 637 (54%), Fogleman 542 (46%)

2010: Bernstein 793 (70%), Jessamy 298 (26%), Lansey 47 (4%)

This area is another part of town that tells the story in miniature. Jessamy went from carrying six of its nine precincts to carrying only one, and even in that one (20-11) she went from 62% of the vote to 46%. The big thumbs down came from precinct 25-04, one of only five precincts to be carried by John McCain.    

Edmondson [red]:

2006: Jessamy 2840 (80%), Fogleman 691 (20%)

2010: Jessamy 1668 (61%), Bernstein 963 (35%), Lansey 96 (4%)

And here’s where we learn that it was a multi-racial coalition that brought down Pat Jessamy.

Jessamy carried every precinct here but except for 28-15…but these areas supported black candidates over white ones big time (84% for Obama in his ’08 primary, 81% for Mfume in his ’06 Senate primary) in every previous election I looked at. While some of these precincts actually have sizable a sizable white minority, the ones further away from the county line don’t, and Bernstein was still getting in the 30% range in most such precincts, and that’s worth noting.

West Baltimore [mustard yellow]:

2006: Jessamy 5364 (85%), Fogleman 944 (15%)

2010: Jessamy 3056 (69%), Bernstein 1112 (25%), Lansey 241 (5%)

This one is partially about the ability of Bernstein to get at least some measure of the vote even in an area like this one (and this was his worst showing in town) where nearly everyone is both black and poor and suspicion of law enforcement tends to run high. But it’s mostly about the lack of turnout. Bernstein got 200 more votes than Fogleman did, which isn’t much; the real story is Pat Jessamy coming out of this area with a net loss of nearly 2,300 votes. That hurts.

Near West Baltimore [teal blue]:

2006: Jessamy 2539 (80%), Fogleman 641 (20%)

2010: Jessamy 1551 (64%), Bernstein 750 (31%), Lansey 116 (5%)

Same as above, but shifted five points since there are some urban gentrifiers here. I wondered if their effect would an amplification of a shift away from Jessamy. It did not.  

Downtown & Midtown [gray]:

2006: Jessamy 1107 (56%), Fogleman 874 (44%)

2010: Bernstein 1297 (60%), Jessamy (36%), Lansey 75 (3%)

I wonder if the demographics of this area may have shifted some in four years as it covers the booming Harbor East district. Either way, it went from a set of precincts that ranged between being indifferent towards and relatively friendly towards the incumbent turned hostile. In 2006 Jessamy carried 13 of these 15 precincts, tying in another, and losing one (11-05) by two votes. This time, Bernstein carried 11 of them. Even worse for Jessamy, this was the other area that cast substantially more votes in the 2010 primary than the one four years earlier, which possibly reflects the revitalization of central Baltimore vis-a-vis the rest of the city. (Interesting side note: Bernstein’s people were all over Baltimore Pride events this summer; Bernstein cleaned up in four precincts with large gay populations in Mt. Vernon and Bolton Hill that were some of Jessamy’s best predominantly white precincts in 2006.)  

East Baltimore [gray-blue]:

2006: Jessamy 3822 (85%), Fogleman 666 (15%)

2010: Jessamy 2224 (69%), Bernstein 859 (27%), Lansey 157 (5%)

See West Baltimore above. Proportions are almost exactly the same. The presence of Johns Hopkins Medical School is probably the main difference.  

Fells Point & Canton [aqua]:

2006: Fogleman 1219 (56%), Jessamy 953 (44%)

2010: Bernstein 1726 (83%), Jessamy 306 (15%), Lansey 58 (3%)

Much like Federal Hill, except with a larger Hispanic population and somewhat more liberal political outlook as a whole (it’s around 4-5 points more liberal and more Democratic than Fed Hill, Obama overperformed a little as well.) However, it had giving Jessamy her worst showing in 2006. And it was the site of the infamous Zach Sowers beating a few years back, in which Jessamy’s spokeswoman was berated for insensitivity to the family and community, so Jessamy had to know she was going to get crushed here.

Highlandtown [magenta]:

2006: Fogleman 970 (52%), Jessamy 895 (48%)

2010: Bernstein 1241 (80%), Jessamy 247 (16%), Lansey 56 (4%)

This southeastern part of town has more of a working class flavor than touristy Fells Point and yuppie haven Canton. Much like the East Side of Baltimore County (Dundalk, Essex) it borders, it’s got a reputation for Reagan Democrats none too fond of voting for black candidates. It’s where Barack Obama had his worst showing in town (Hillary Clinton got 57% of the primary vote, nearly 15 points more than any in other part of the city; John McCain got 37% of the general election vote, his best showing in the city) in 2008. Just to confuse everyone though, Pat Jessamy did carry the area in 2006, albeit barely. In 2010, Highlandtown was not Pat Jessamy’s worst area…but it was plenty bad enough at an even 16%.  

Frankford [lime green]:

2006: Jessamy 3076 (81%), Fogleman 738 (19%)

2010: Jessamy 1753 (59%), Bernstein 1059 (36%), Lansey 169 (6%)

Predominantly black (middle-class black specifically) but not monolithic, Jessamy lost 22 points and 1,300 votes here. A decent chunk of voters took the third option with Cheryl Lansey here, and in this area she was stronger where Jessamy was also strong as opposed to where Bernstein was strong, suggesting that the spoiler factor may have been key. Jessamy won 13 of the 15 precincts here, but mostly with numbers in the 50s and 60s rather than the 70s and 80s she got last time around.    

Northeast Baltimore [light blue]:

2006: Jessamy 3467 (61%), Fogleman 2172 (39%)

2010: Bernstein 2806 (60%), Jessamy 1701 (35%), Lansey 160 (3%)

Here’s one battleground where the Bernstein campaign did some heavy lifting, the area’s voting patterns doing a near-perfect 180 degree turn. Jessamy carried 18 of 22 precincts in her 2006 re-election, and Bernstein flipped all but two of them this time out for 20 of 22. There are more whites than blacks here, but neither Mfume (51% in his Senate primary) nor Obama (71% primary, 79% general) had that much trouble getting votes in this part of town; if I had to credit one part of town with being the tipping point, I’d probably cite this one as the most pivotal.

Govans/Northwood [peach]:

2006: Jessamy 5137 (82%), Fogleman 1124 (18%)

2010: Jessamy 2695 (62%), Bernstein 1524 (35%), Lansey 147 (3%)

This is where Pat Jessamy lives. Ouch. If she had gotten everyone in her own neighborhood who voted for her in 2006 to do so again, she would have squeaked by. Instead, she lost 400 votes to the white challenger, 147 votes to a random black challenger, and 1895 votes – enough by itself to put her over the top – to non-turnout. (Some people might have moved away; we’ll learn more when the new Census data emerges.) This was, incidentally, the second biggest turnout drop in the city after Park Heights; my postulate about middle-class black areas like this one holding turnout better between elections than poor areas turns out not to have held, at least in Baltimore.  

Waverly/Montebello [olive]:

2006: Jessamy 2547 (81%), Fogleman 590 (19%)

2010: Jessamy 1465 (60%), Bernstein 843 (35%), Lansey 114 (5%)

There are 12 precincts in this zone. Jessamy carried all of them both times. But instead of racking up numbers between 73-88%, they ranged from 51-70% instead. Couple that with the dropped turnout, and it spelled trouble for the incumbent as well as evidencing the fact that it wasn’t just a matter of Bernstein racking up the big numbers in white parts of town.

Roland Park, Guilford & Homeland [orange]:

2006: Jessamy 2005 (52%), Fogleman 1880 (48%)

2010: Bernstein 3082 (85%), Jessamy 534 (15%), Lansey 25 (1%)

In addition to being the wealthiest part of Baltimore, this is Bernstein’s home turf and does it ever show. Previously somewhat less hostile to Jessamy (it’s mostly liberals, and there’s just not much crime up there to complain about) than other white parts of town..one of their own put up huge numbers. (If Northwood had done for Jessamy what Roland Park did for Bernstein, Bernstein would have lost.) Bernstein’s 37 point improvement on Fogleman in this zone put him over the top.  

Charles Village [light green]:

2006: Jessamy 1000 (64%), Fogleman 554 (36%)

2010: Bernstein 873 (63%), Jessamy 462 (34%) Lansey 44 (3%)

The other big 180 reversal. It’s relatively integrated and chock full of liberals of all colors (they liked Mfume and loved Obama..but black Republican Michael Steele saw perhaps his worst numbers in the entire state there) that match the brightly colored houses that famously line some of its blocks. Jessamy won a comfortable 63% of the vote there last time.  

What happened here? Well, early this summer, an unarmed Hopkins graduate student was murdered in a robbery in broad daylight on a Charles Village street thought to be reasonably safe by a guy with a rap sheet a mile long. And people were pissed. Jessamy went to a community memorial for the student and got, to put it mildly, a very chilly reception. It was perhaps the flashpoint of the election.

Hampden [indigo]:

2006: Fogleman 937 (56%), Jessamy 733 (44%)

2010: Bernstein 1460 (87%), Jessamy 200 (12%), Lansey 21 (1%)

Bernstein did even better here than in neighboring Roland Park, not that he needed to do much to convince Hampdenites to not vote for Jessamy. The area has fewer blacks per capita than anywhere else in town and has long had a reputation for hostility towards black politicians (and towards non-politicians as well) although the reality is now somewhat more complicated by an influx of new residents and a softening of some old attitudes. Barack Obama found more support (56% primary, 72% general) than one would expect based on the old stereotypes.

But, yeah, everybody knew going in Pat Jessamy was not going to find much support here. I might have expected more than 12% though; Jessamy only got 20% in precinct 12-03, which is quite a bit more diverse than the rest of the area. Aaron Fogleman did about that well in West Baltimore and he barely campaigned. Also: note how few votes for Lansey there were here and in other mostly white areas.

Mount Washington/Cross Country [light-yellow]:

2006: Jessamy 2616 (57%), Fogleman 1988 (43%)

2010: Bernstein 2653 (73%), Jessamy 921 (25%), Lansey 74 (2%)

Pretty dramatic turnaround here too. In 2006 Jessamy won 9 of 11 precincts. The other two are part of an three-precinct [27-64, 27-65, and 27-66] cluster consisting largely of Orthodox Jews in the city’s NW corner; in general elections, McCain won all three precincts, Ehrlich won two of them, and all three were strong for Hillary in the ’08 primary.) This time around, Jessamy only carried a single precinct, 28-01, whose demographics are quite different than the others in this zone. Bernstein cleaned up in the Orthodox zone but almost as well in the rest of Cross County and even in more liberal Mount Washington Village.    

Park Heights [yellow-green]:

2006: Jessamy 2821 (82%), Fogleman 618 (18%)

2010: Jessamy 1578 (70%), Bernstein 597 (26%), Lansey 93 (4%)

The good news for Jessamy is that she held a higher percentage of her 2006 vote here than anywhere else in the city, and it’s the only part of town where Bernstein actually failed to match Fogleman’s vote total from 2006. The bad news is that turnout in this largely struggling area dropped 34% from 2006. So Jessamy’s vote margin here was nonetheless cut in half.  

Forest Park/Arlington [pink]:

2006: Jessamy 5720 (85%), Fogleman 975 (15%)

2010: Jessamy 3459 (71%), Bernstein 1265 (26%), Lansey 156 (3%)

This biggest redoubt of black middle-class voters in the city were more loyal to Pat Jessamy than her own neighbors further east, or, indeed, than anywhere else in the city. Furthermore, unlike many largely black areas, they didn’t even give Cheryl Lansey much support. But 30% fewer Forest Park-Arlington residents turned out this time around, and that spelled nearly 2,300 votes out of this area.  

So…in the final analysis, where did all this number crunching get me? I found three things that I think mattered and three things that I think didn’t.

1. Whites voted as a bloc for Bernstein in a way that they had not done for any other candidate in any of the several races I examined for this diary. I estimate Jessamy’s 2010 level of support among Whites to be somewhere around 15%, as compared with about 50% for Jessamy in 2006, about 35% for Mfume in 2006, and about 55% for Obama in the 2008 primary. I created a mathematical model whereby Shifting just 3% of the vote in the non-Type VI precincts back to Jessamy across the board (which still leaves her support among whites down near 20%, mind you) would have been enough to get her re-elected by 87 votes.

2. The deterioration of support for Jessamy among Blacks was also a contributing factor. She lost 16 points of support in Type VI precincts. I created a model whereby Jessamy’s support in Type VI precincts was raised while everything else (including the surprisng result, even knowing my source data had some noise in it, whereby Bernstein got more votes than Jessamy in Type V precincts) constant. Even when taking into account depressed black turnout (which I’ll discuss below) in a scenario when her support in the Type VI precincts is raised from 66% to 69%, still a 13-point drop, Jessamy gets re-elected by the narrowest of margins.

3. Turnout among Black voters was an issue. If the relative share of the total vote the 20 zones had held constant from 2006, even with the 2010 candidates keeping the same proportion of votes from each zone (in other words, this time I locked in Jessamy’s dismal performance in White areas and reduced performance in Black areas) the result would be reversed, with Jessamy winning over Bernstein 49-47. (I didn’t do the math on 2008, because it became obvious to me quickly that that electorate would have chosen Jessamy over Bernstein as well.)  

And three things I didn’t find to be important in the end:

1. The Lansey-as-spoiler factor. Certainly Jessamy supporters were angry with her, before and especially after the election. It’s hard to model with any confidence. Lansey’s vote total of 2011 was less than the 1456 vote margin between Bernstein and Jessamy. I know little about Cheryl Lansey and couldn’t figure out what her agenda was, other than not liking Jessamy, so that makes it tough to read voter minds. That most of her votes came from black neighborhoods suggests that Jessamy supporters had a reason to be unhappy. However, a Bernstein supporter could argue that her presence on the ballot as a third option gave people dissatisfied with Jessamy but reluctant to support a white challenger an easy way out of their dilemma and that at least some of those voters would have opted either for Bernstein or for a blank ballot. Even without Bernstein getting a single one of the the Lansey votes, Jessamy would have needed 72.5% of those votes to win. Since that figure was above her regular numbers in all but her very best precincts, I don’t think she was the difference in the election.  

2. There wasn’t enough of a difference between precincts with significant Hispanic or Asian minorities and those without them to support any effort to distinguish them from similar precincts that happen to lack significant Hispanic or Asian minorities.

3. I didn’t find any useful class-based distinctions in the data. In Black precincts, racial makeup (i.e. whether there’s much of a non-Black minority) explained the variances in election results much better than class makeup did, as usual for Baltimore elections of this type. Though there are often sizable gaps between results in White precincts in Baltimore that speak to real or perceived class differences, those were at best very muted with regards to this election, as these different neighborhoods acted in unison this time out.

Conclusion:

It took a near-perfect storm of high dissatisfaction among Whites, at least moderate dissatisfaction among Blacks, and low Black turnout to produce this surprising upset victory.  

6R-2D Gerrymander of Wisconsin

Looking at WI voting patterns, it seems that there pretty much have to be three Democratic districts in the state: one in Milwaukee, one in Madison, and one along the western border with Minnesota. But if the GOP wanted to be really nasty, they could pack Madison in with the heavily Democratic regions along the Western border into one super-democratic district and allowing them to take over all the other districts in the state. This map accomplishes a pretty solid 6-2 split in the WI delegation for the GOP, while simultaneously strengthening the districts of reps Ryan, Duffy, and Ribble.  

The Democratic vote dump in the 2nd connects Madison, La Crosse, the counties just south of Duluth, and some other highly Democratic counties in the SW region, forcing reps Kind and Baldwin into one district. I would have added in Ashland Co, but rep Duffy lives there (reps Duffy and Ryan are both in the unfortunate situation of living in the most democratic areas of their districts, interestingly). Rep Ryan’s 1st is probably shifted the most to the right of any district in this map, due to his seniority in the house. It loses the Dem-leaning areas of Racine and Kenosha, and gains a lot of more rural territory. Some of this territory in the SW corner of the state is ancestrally Democratic (although it voted mainly GOP this year), but the rest of the area is very conservative, which has the effect of giving Ryan a pretty safe seat for as long as he wants it. Ryan seemed to have a lock on his old seat, but if the GOP is smart they’ll probably try to make it safer; his old district was won by Obama in 08 (although some of that may have been due to the fact that WI-01 borders Illinois and contains areas like Racine and Kenosha that are suburbs of Chicago). Perhaps more importantly, Ryan is actually incredibly conservative for a swing district like his, this analysis by Crisitunity back in 2009 found him to be the house GOPer in the 110th congress most to the right of his district (the GOP version of Nate Silver’s Most Valuable Democrat, if you will). This seems to suggest that in the future Ryan could be vulnerable in his current district, although he hasn’t shown any signs of it yet. Anyway, under this map, he probably wouldn’t be vulnerable anymore. Racine and Kenosha are moved to the 5th and 6th, respectively. Those districts have moved slightly to the left to help other districts, but they are still solidly GOP districts anchored in very conservative territory. The 4th in Milwaukee has gotten slightly more Democratic, and is now majority-minority (47% W, 33% B, 15% H), which helps the surrounding districts a little. The 8th is changed a little in partisanship; it has lost some light red areas in the NE corner of the state for deep red areas around Manitowoc and Sheboygan. The 3rd now stretches east from Eau Claire to Oshkosh. It is probably the most Democratic of all the districts other than the 2nd and 4th. And finally the 7th has now lost the most Democratic parts of the district is now much safer for rep Duffy.

The upper midwest has generally had very little history for gerrymandering in the past, so there could be a good deal of political fallout for the GOP if they decide to push a plan like this. They might be able to get away with chunking the south of Duluth counties into the 3rd, but something like this, although not terrible by the standards of states like CA, MD, or TX, would be the worst gerrymander WI has seen in ages.

Georgia w/ 6 VRA seats

OK, so the recent thread on potential VRA seats in South Carolina has got me thinking about other Southern states. Leaving aside Texas & Florida, which are special cases in my view, the most obvious candidate seems to be Georgia as it also gained a seat for this redistricting cycle.

In short, I wanted to see whether I could increase the number of compact minority-majority seats. As an initial (somewhat crude) effort, the following map features six.

One thing I’ve realized, having made this map, is that the apparent conventional wisdom that Georgia’s 14th seat will be a heavily Republican seat north of Atlanta may very well be incorrect. It’s quite easy to draw a fairly compact minority-majority seat north of GA-04 & GA-05, and I’d say a strong argument could be made that the VRA would require as much.

Whether it would require that GA-12 become a bare majority-minority district as in my map below is another matter. Anyhow, more after the fold!

Below I’ve posted a statewide map and a close-up of the Atlanta region. The following districts on this map are majority-minority.

Downstate:

GA-02: 51% minority (45% Black – 4% Latino)

GA-12: 51% minority (46% Black – 2% Latino)

Atlanta Metro:

GA-04: 72% minority (56% Black – 10% Latino)

GA-05: 67% minority (53% Black – 10% Latino)

GA-13: 64% minority (52% Black – 8% Latino)

GA-14: 54% minority (22% Black – 20% Latino)

The usual caveat applies that my maps are only as good as the data at Dave’s app.

Here are the maps:

Lieberman Will Not Run for Re-Election

Just posted to the NYT. Some of the pertinent information –

One aide believes Lieberman wanted to leave voluntarily rather than being voted out (with a stronger Republican candidate and Lieberman’s slightly more left-of-center voting record this past year, that scenario seemed a bit more likely):

Mr. Lieberman, whose term is up in 2012, chose to retire rather than risk being defeated, said the person, who spoke to the senator on Tuesday.

“I don’t think he wanted to go out feet first,” the person said

.

Another aide seems to have a more policy-based analysis of the decision to keep quiet about his retirement plans, which implies that Sen. Lieberman has been considering this for a while:

One aide, speaking on condition of anonymity ahead of the announcement, said Mr. Lieberman arrived at his decision around Thanksgiving but postponed revealing his decision until after the legislative effort that culminated in the repeal of the “don’t ask, don’t tell” ban on gays in the military – an effort in which Mr. Lieberman played a central role.

I for one am thankful for Sen. Lieberman’s role in pushing DADT repeal through the Senate. I believe he, along with Sens. Gillibrand, Udall, Maj. Leader Reid and others, engaged in a lot of brilliant strategy to bring that bill to the floor when it had been all but counted out days  before.

This now is a Dem v. Rep race, which will probably be a better situation for Team Blue. I’m betting Rep. Murphy’s announcement comes by the end of next week.