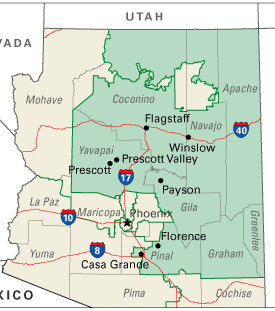
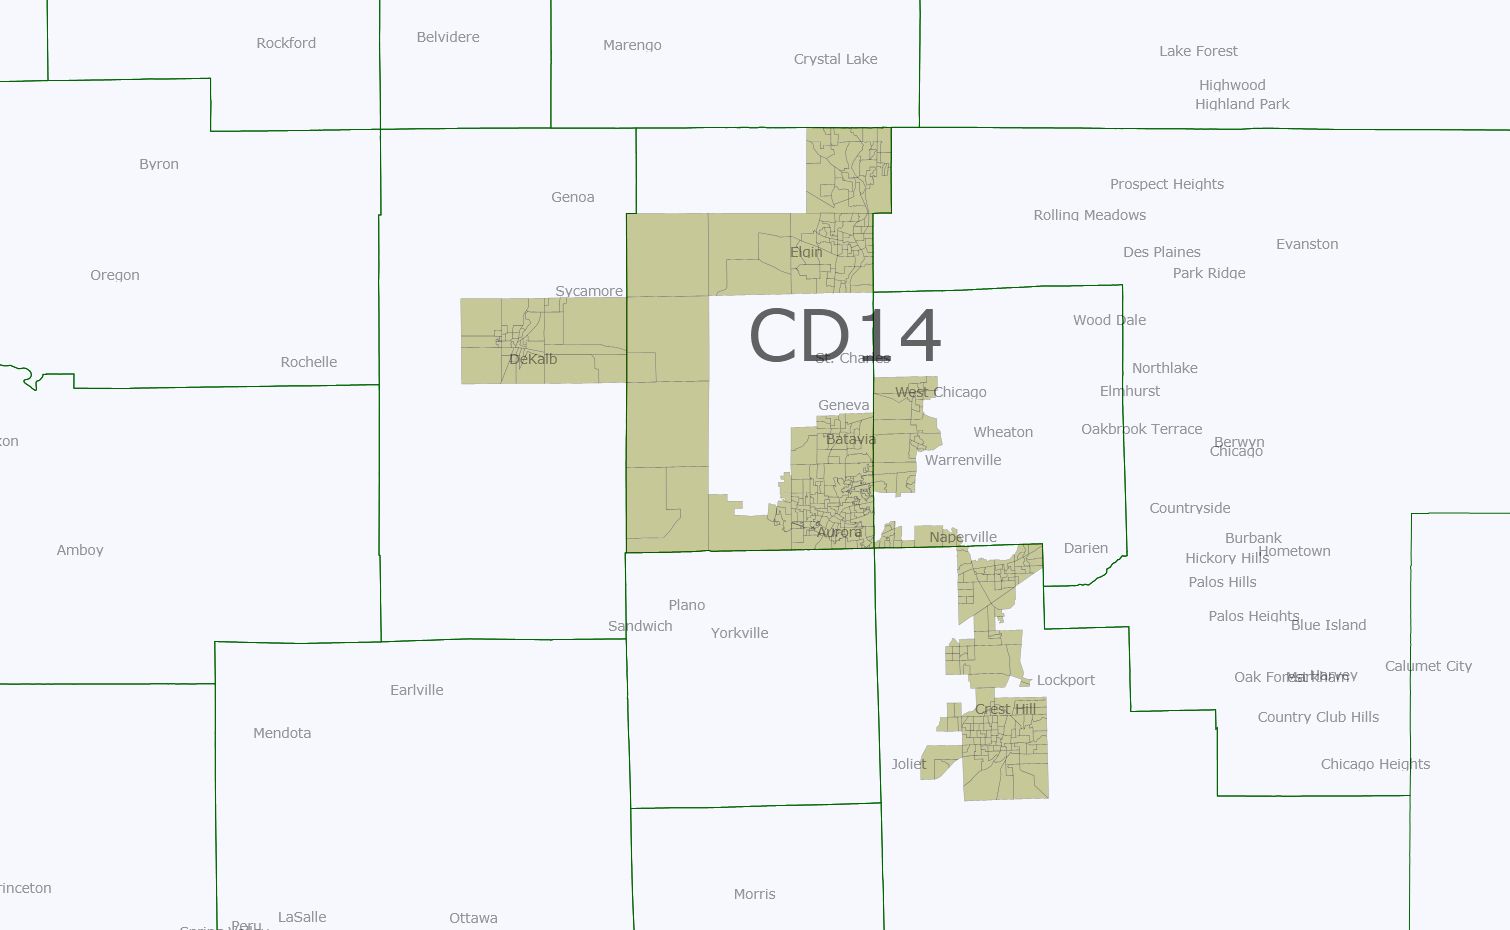
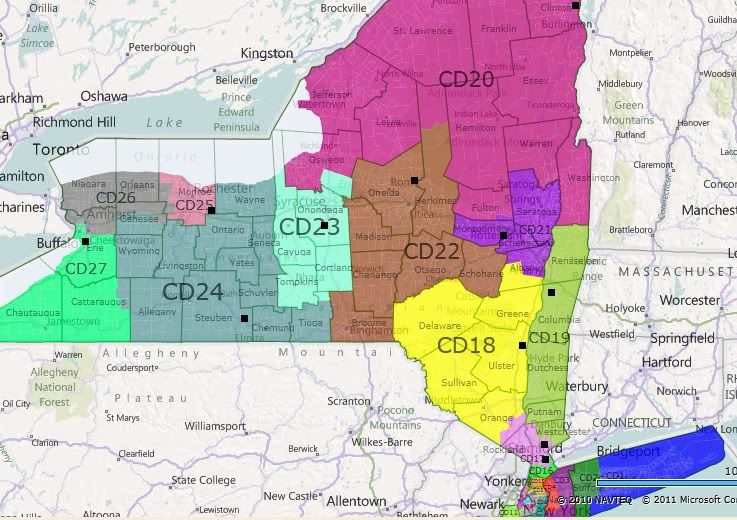
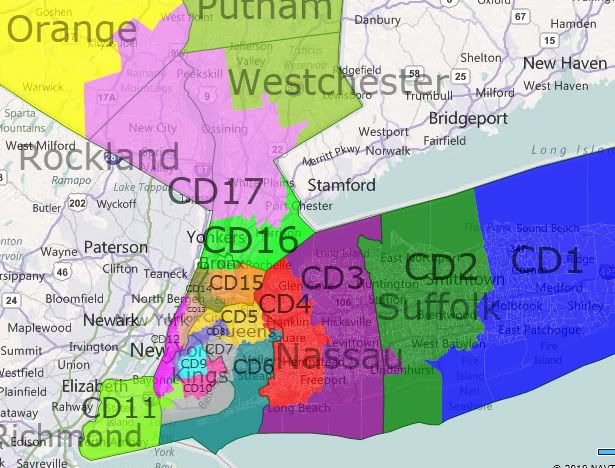
With the Census Bureau having completed its gradual rollout of data from all the states last week, I’ve finally gotten around to assembling data from all the various congressional districts into one place. While the actual population gain or loss in each district isn’t as important a number, for SSP purposes, as the number of people each district will need to shed or gain as part of the redistricting process (which you can see in the various posts we did as each state’s data came out), the overall gain and loss is an important part in the overall picture of where people are moving to and from (and where they’re being born). Just the numbers of people moving in or out isn’t as helpful as knowing who exactly these people are, and we’ll delve a little more deeply into the changing racial compositions of the CDs in the next day or two… but for now, here are the overall population change numbers.
You’re probably noticing, “Wow, that’s a lot of Republican districts.” That’s certainly true, but these are also districts that (as we’ll see when we talk about changing racial composition), for the most part, aren’t becoming more Republican; people tend to bring their values with them rather than undergoing some magical David Brooksian conversion experience once they move in from the city, the inner-ring suburbs, or another country. Some of these districts are ones where much of the gains are Hispanic (like NV-03 or TX-10, or just about any California district on the list); in the case of GA-07, it’s becoming more African-American. That isn’t to say that these are all on the verge of becoming blue, of course; with much of these districts’ non-white populations under 18, it’ll be a gradual process. And redistricting is likely to de-diversify at least some of these districts, with some of the closer-in suburban portions of these districts (note that many of these districts are the ones right on the cusp of suburb and exurb) to be given to lower-population urban districts that need to expand outward, with the remaining parts of the districts staying red. (GA-07, again, is a case in point; the innermost parts of Gwinnett County, which are pretty diverse today, probably will need to get added on to underpopulated GA-05, leaving the rest of the district in very Republican-friendly condition.)
You may recall I did this same thing a year and a half ago when the 2008 estimates came out; there’s been very little change to the list since then, although with some swapping of places. Despite its position at the absolute epicenter of the housing bubble, NV-03 moved up from 4th to 1st place, past the two Arizona districts and TX-10. Districts that fell out of the top 25 in 2008 include GA-06, TX-03, CO-06, FL-25, IL-14, and FL-06, replaced by VA-10, FL-12, TX-28, TX-23, TX-04, and ID-01.
| District | Rep. | 2000 | 2010 | Change |
|---|---|---|---|---|
| NV-03 | Heck (R) | 665,345 | 1,043,855 | 378,510 |
| AZ-02 | Franks (R) | 641,435 | 972,839 | 331,404 |
| AZ-06 | Flake (R) | 641,360 | 971,733 | 330,373 |
| TX-10 | McCaul (R) | 651,523 | 981,367 | 329,844 |
| FL-05 | Nugent (R) | 639,719 | 929,533 | 289,814 |
| CA-45 | Bono Mack (R) | 638,553 | 914,209 | 275,656 |
| GA-07 | Woodall (R) | 630,511 | 903,191 | 272,680 |
| TX-26 | Burgess (R) | 651,858 | 915,137 | 263,279 |
| TX-22 | Olson (R) | 651,657 | 910,877 | 259,220 |
| TX-31 | Carter (R) | 651,868 | 902,101 | 250,233 |
| NC-09 | Myrick (R) | 619,705 | 852,377 | 232,672 |
| VA-10 | Wolf (R) | 643,714 | 869,437 | 225,723 |
| UT-03 | Chaffetz (R) | 744,545 | 966,232 | 221,687 |
| FL-14 | Mack (R) | 639,298 | 858,956 | 219,658 |
| AZ-07 | Grijalva (D) | 640,996 | 855,769 | 214,773 |
| NC-04 | Price (D) | 619,432 | 826,878 | 207,446 |
| CA-44 | Calvert (R) | 639,008 | 844,756 | 205,748 |
| CA-25 | McKeon (R) | 638,768 | 844,320 | 205,552 |
| TX-21 | Smith (R) | 651,930 | 856,954 | 205,024 |
| FL-12 | Ross (R) | 640,096 | 842,199 | 202,103 |
| TX-28 | Cuellar (D) | 651,259 | 851,824 | 200,565 |
| TX-23 | Canseco (R) | 651,149 | 847,651 | 196,502 |
| TX-04 | Hall (R) | 651,500 | 846,142 | 194,642 |
| GA-09 | Graves (R) | 629,678 | 823,583 | 193,905 |
| ID-01 | Labrador (R) | 648,922 | 841,930 | 193,008 |
And here are the biggest losers, looking every bit as heavily Democratic as the list of gainers is Republican. However, if you go through the list line by line, you’ll notice that very few of these districts are even remotely-considered as being on the chopping block. That’s partly because many of these are VRA seats, or otherwise set up by Republican legislatures as Democratic vote sinks (PA-14, for example). The most obvious exceptions up for elimination are PA-12, which almost everyone concedes is gone with the wind, OH-10, which is set to get mashed with OH-13, and possibly IL-17, ironically one of the few GOP-held seats on the list (although it might instead wind up getting turned into a significantly bluer district by the now-Dem-controlled Illinois legislature). Instead, as I mentioned earlier, many of these districts are going to wind up reaching out further into the suburbs… in many cases, expanding to follow the same constituents who just moved out of the city (for instance, all the Detroit residents who moved across 8 Mile into MI-12).
| District | Rep. | 2000 | 2010 | Change |
|---|---|---|---|---|
| LA-02 | Richmond (D) | 639,048 | 493,352 | – 145,696 |
| MI-13 | Clarke (D) | 662,844 | 519,570 | – 143,274 |
| MI-14 | Conyers (D) | 662,468 | 550,465 | – 112,003 |
| OH-11 | Fudge (D) | 630,668 | 540,432 | – 90,236 |
| IL-01 | Rush (D) | 654,203 | 587,596 | – 66,607 |
| PA-14 | Doyle (D) | 645,809 | 584,493 | – 61,316 |
| IL-04 | Gutierrez (D) | 653,654 | 601,156 | – 52,498 |
| IL-02 | Jackson (D) | 654,078 | 602,758 | – 51,320 |
| MS-02 | Thompson (D) | 710,996 | 668,263 | – 42,733 |
| NY-28 | Slaughter (D) | 654,464 | 611,838 | – 42,626 |
| MO-01 | Clay (D) | 621,497 | 587,069 | – 34,428 |
| PA-12 | Critz (D) | 646,419 | 612,384 | – 34,035 |
| AL-07 | Sewell (D) | 635,631 | 603,352 | – 32,279 |
| OH-01 | Chabot (R) | 630,545 | 598,699 | – 31,846 |
| OH-10 | Kucinich (D) | 631,003 | 599,205 | – 31,798 |
| OH-17 | Ryan (D) | 630,316 | 600,111 | – 30,205 |
| CA-31 | Becerra (D) | 639,248 | 611,336 | – 27,912 |
| MI-05 | Kildee (D) | 662,584 | 635,129 | – 27,455 |
| MI-12 | Levin (D) | 662,559 | 636,601 | – 25,958 |
| NY-27 | Higgins (D) | 654,200 | 629,271 | – 24,929 |
| IL-09 | Schakowsky (D) | 653,117 | 628,859 | – 24,258 |
| NY-11 | Clarke (D) | 654,134 | 632,408 | – 21,726 |
| TN-09 | Cohen (D) | 631,740 | 610,823 | – 20,917 |
| IL-17 | Schilling (R) | 653,531 | 634,792 | – 18,739 |
| PA-02 | Fattah (D) | 647,350 | 630,277 | – 17,073 |
Much more over the flip…
Now, let’s switch over to counties. Counties are a unit of analysis that don’t get talked about at SSP as much as congressional districts, despite the fact that they’re more useful for talking about historical trends because their boundaries (almost) never change over the decades; the rationale, I suppose, is that much of the nation’s population lives in huge counties that contain multiple (or in the case of Los Angeles County, more than a dozen) CDs, so in many cases it’s not as granular a sort (and conversely, counties turn into too-granular a sort if you’re interested in, say, Kansas or west Texas).
Still, looking at which counties gained the most population in raw numbers, it provides an interesting counterpoint to the biggest-gaining CDs. While you’d get the impression of impending utter Republican dominance by looking at the party IDs of which CDs have excess population to shed, looking at the nation’s largest counties shows that, when you balance out the parts and pieces that make up the various CDs, many of the counties have very swingy results at the presidential level. I was also planning to look at changes in racial composition by county as well as by CD in the coming days, so it’ll also become quite evident (if you hadn’t already mentally extrapolated from which CDs are in which counties) that much of the growth coming in these fastest-growing counties is coming from non-whites.
| County | 08 Results | 2000 | 2010 | Change |
|---|---|---|---|---|
| Maricopa, AZ | 44/54 | 3,072,149 | 3,817,117 | 744,968 |
| Harris, TX | 50/49 | 3,400,578 | 4,092,459 | 691,881 |
| Riverside, CA | 50/48 | 1,541,387 | 2,189,641 | 644,254 |
| Clark, NV | 58/39 | 1,375,765 | 1,951,269 | 575,504 |
| Tarrant, TX | 44/55 | 1,466,219 | 1,809,034 | 362,815 |
| San Bernardino, CA | 52/46 | 1,709,434 | 2,035,210 | 325,776 |
| Bexar, TX | 52/47 | 1,392,931 | 1,714,773 | 321,842 |
| Los Angeles, CA | 69/29 | 9,519,338 | 9,818,605 | 299,267 |
| Collin, TX | 37/62 | 491,675 | 782,341 | 290,666 |
| San Diego, CA | 54/44 | 2,813,833 | 3,095,313 | 281,480 |
| Wake, NC | 57/42 | 627,846 | 900,993 | 273,147 |
| Orange, FL | 59/40 | 896,344 | 1,145,956 | 249,612 |
| Miami-Dade, FL | 58/42 | 2,253,362 | 2,496,435 | 243,073 |
| Fort Bend, TX | 48/51 | 354,452 | 585,375 | 230,923 |
| Hillsborough, FL | 53/46 | 998,948 | 1,229,226 | 230,278 |
| Denton, TX | 37/62 | 432,976 | 662,614 | 229,638 |
| Mecklenburg, NC | 62/37 | 695,454 | 919,628 | 224,174 |
| Gwinnett, GA | 44/55 | 588,448 | 805,321 | 216,873 |
| Travis, TX | 64/34 | 812,280 | 1,024,266 | 211,986 |
| Hidalgo, TX | 69/30 | 569,463 | 774,769 | 205,306 |
| Pinal, AZ | 42/56 | 179,727 | 375,770 | 196,043 |
| Sacramento, CA | 58/39 | 1,223,499 | 1,418,788 | 195,289 |
| King, WA | 70/28 | 1,737,034 | 1,931,249 | 194,215 |
| Palm Beach, FL | 61/38 | 1,131,184 | 1,320,134 | 188,950 |
| Kern, CA | 40/58 | 661,645 | 839,631 | 177,986 |
The counties with the biggest numeric loss, on the other hand, are almost all Democratic ones with a few exceptions from the New Orleans suburbs. Some are Dem strongholds that are just intensifying (like Cook County, home of Chicago, whose blueness we kind of take for granted these days… Mike Dukakis won it only 56-43). Others are onetime solid Dem counties that have turned swingy as older ex-unionists die off and educated young voters book their tickets elsewhere (like the western Pennsylvania and West Virginia counties).
| County | 08 Results | 2000 | 2010 | Change |
|---|---|---|---|---|
| Wayne, MI | 74/25 | 2,061,162 | 1,820,584 | – 240,578 |
| Cook, IL | 76/23 | 5,376,741 | 5,194,675 | – 182,066 |
| Orleans, LA | 79/19 | 484,674 | 343,829 | – 140,845 |
| Cuyahoga, OH | 69/30 | 1,393,978 | 1,280,122 | – 113,856 |
| Allegheny, PA | 57/42 | 1,281,666 | 1,223,348 | – 58,318 |
| Hamilton, OH | 53/46 | 845,303 | 802,374 | – 42,929 |
| St. Bernard, LA | 26/71 | 67,229 | 35,897 | – 31,332 |
| Erie, NY | 58/40 | 950,265 | 919,040 | – 31,225 |
| Baltimore city, MD | 87/12 | 651,154 | 620,961 | – 30,193 |
| St. Louis city, MO | 84/16 | 348,189 | 319,294 | – 28,895 |
| Montgomery, OH | 52/46 | 559,062 | 535,153 | – 23,909 |
| Jefferson, LA | 36/62 | 455,466 | 432,552 | – 22,914 |
| Mahoning, OH | 62/36 | 257,555 | 238,823 | – 18,732 |
| St. Louis, MO | 60/40 | 1,016,315 | 998,954 | – 17,361 |
| Trumbull, OH | 60/37 | 225,116 | 210,312 | – 14,804 |
| Lucas, OH | 65/33 | 455,054 | 441,815 | – 13,239 |
| Fayette, PA | 49/50 | 148,644 | 136,606 | – 12,038 |
| Washington, MS | 67/32 | 62,977 | 51,137 | – 11,840 |
| Beaver, PA | 48/50 | 181,412 | 170,539 | – 10,873 |
| Genesee, MI | 65/33 | 436,141 | 425,790 | – 10,351 |
| Saginaw, MI | 58/40 | 210,039 | 200,169 | – 9,870 |
| Essex, NJ | 76/23 | 793,633 | 783,969 | – 9,664 |
| Hampton city, VA | 69/30 | 146,437 | 137,436 | – 9,001 |
| Cambria, PA | 49/48 | 152,598 | 143,679 | – 8,919 |
| Kanawha, WV | 49/49 | 200,073 | 193,063 | – 7,010 |
While looking at congressional districts by percentage of change isn’t that interesting (as they all start from a very similar baseline, giving you almost the same results as raw numeric change), it’s worth a deeper look with counties, because counties come in a wide variety of sizes and the fastest-gainers by population don’t dovetail much with the fastest-gainers by percentage. The percentage gainers tend to smaller counties that are poised at the very edge of metropolitan growth, making the transition from rural to exurban. Case in point: #1 Kendall County, which is where you wind up if you find already-exurban Kane County and then head south, to where Chicagoland meets the prairie. The bigger-name counties on this list, like Loudoun County, Virginia, Douglas County, Colorado, and Collin and Fort Bend Counties, Texas, are some of the archetypal exurbs of decades past, which are starting to diversify and make the stylistic transition from exurb to outer-ring suburb… and their voting patterns are starting to change too, with Loudoun turning light-blue and Douglas and Collin still pretty red but making sharp moves in 2008.
| County | 08 Results | 2000 | 2010 | Change Factor |
|---|---|---|---|---|
| Kendall, IL | 53/46 | 54,544 | 114,736 | 2.10 |
| Pinal, AZ | 42/56 | 179,727 | 375,770 | 2.09 |
| Flagler, FL | 50/49 | 49,832 | 95,696 | 1.92 |
| Lincoln, SD | 42/57 | 24,131 | 44,828 | 1.86 |
| Loudoun, VA | 54/45 | 169,599 | 312,311 | 1.84 |
| Rockwall, TX | 26/73 | 43,080 | 78,337 | 1.82 |
| Forsyth, GA | 20/78 | 98,407 | 175,511 | 1.78 |
| Sumter, FL | 36/63 | 53,345 | 93,420 | 1.75 |
| Paulding, GA | 30/69 | 81,678 | 142,324 | 1.74 |
| Sublette, WY | 21/76 | 5,920 | 10,247 | 1.73 |
| Henry, GA | 46/53 | 119,341 | 203,922 | 1.71 |
| Teton, ID | 49/49 | 5,999 | 10,170 | 1.70 |
| Williamson, TX | 43/55 | 249,967 | 422,679 | 1.69 |
| Fort Bend, TX | 48/51 | 354,452 | 585,375 | 1.65 |
| Union, NC | 36/63 | 123,677 | 201,292 | 1.63 |
| Douglas, CO | 41/58 | 175,766 | 285,465 | 1.62 |
| Dallas, IA | 46/52 | 40,750 | 66,135 | 1.62 |
| Newton, GA | 50/49 | 62,001 | 99,958 | 1.61 |
| Hays, TX | 48/50 | 97,589 | 157,107 | 1.61 |
| Collin, TX | 37/62 | 491,675 | 782,341 | 1.59 |
| Franklin, WA | 37/61 | 49,347 | 78,163 | 1.58 |
| Delaware, OH | 40/59 | 109,989 | 174,214 | 1.58 |
| Forest, PA | 42/55 | 4,946 | 7,716 | 1.56 |
| Osceola, FL | 59/40 | 172,493 | 268,685 | 1.56 |
| Montgomery, TX | 23/76 | 293,768 | 455,746 | 1.55 |
Finally, here are the biggest losing counties by percentage. Unfortunately, beyond the obvious Orleans Parish (and several other smaller Louisiana parishes obliterated by hurricanes), it’s a bunch of counties that you’ve probably never heard of, most of which are very tiny. Beyond that, it tells us that blindingly-red western Kansas and western North Dakota are losing population, as well as the Texas and Oklahoma Panhandles… and also dark-blue, mostly-black rural counties in the Mississippi Delta, which was seen in MS-02’s population loss. The list continues on like that ad nauseam; the next county with a population over 100,000 is all the way down at #148: Wayne County, MI, which is 88% of its 2000 size. St. Louis city and Cuyahoga County, OH follow along at 92%.
| County | 08 Results | 2000 | 2010 | Change Factor |
|---|---|---|---|---|
| St. Bernard, LA | 26/71 | 67,229 | 35,897 | 0.53 |
| Issaquena, MS | 61/38 | 2,274 | 1,406 | 0.62 |
| Cameron, LA | 16/81 | 9,991 | 6,839 | 0.68 |
| Orleans, LA | 79/19 | 484,674 | 343,829 | 0.71 |
| Sharkey, MS | 68/31 | 6,580 | 4,916 | 0.75 |
| Chattahoochee, GA | 50/49 | 14,882 | 11,267 | 0.76 |
| Sheridan, ND | 29/69 | 1,710 | 1,321 | 0.77 |
| Kiowa, KS | 18/80 | 3,278 | 2,553 | 0.78 |
| Towner, ND | 52/45 | 2,876 | 2,246 | 0.78 |
| Cimarron, OK | 12/88 | 3,148 | 2,475 | 0.79 |
| Cottle, TX | 27/72 | 1,904 | 1,505 | 0.79 |
| Jefferson, MS | 87/12 | 9,740 | 7,726 | 0.79 |
| Tensas, LA | 54/45 | 6,618 | 5,252 | 0.79 |
| Monroe, AR | 47/51 | 10,254 | 8,149 | 0.79 |
| King, TX | 5/93 | 356 | 286 | 0.80 |
| Culberson, TX | 65/34 | 2,975 | 2,398 | 0.81 |
| Esmeralda, NV | 24/69 | 971 | 783 | 0.81 |
| McDowell, WV | 53/45 | 27,329 | 22,113 | 0.81 |
| Jewell, KS | 20/78 | 3,791 | 3,077 | 0.81 |
| Claiborne, MS | 86/14 | 11,831 | 9,604 | 0.81 |
| Washington, MS | 67/32 | 62,977 | 51,137 | 0.81 |
| Lane, KS | 19/79 | 2,155 | 1,750 | 0.81 |
| Quitman, MS | 67/32 | 10,117 | 8,223 | 0.81 |
| Greeley, KS | 20/79 | 1,534 | 1,247 | 0.81 |
| Swift, MN | 55/42 | 11,956 | 9,783 | 0.82 |


