Multivariate analysis of Wisconsin polling data

(This is cross-posted at Daily Kos)

A couple weeks ago, Kos/PPP polled all the Wisconsin Republicans up for recall and found some very interesting results. However, he did not poll the Dem races up for recall, as well as the statewide upcoming Supreme Court race. In an attempt to rectify this fault, although I’m no Poblano, I decided to try to use multivariate regression to try and model the Wisconsin polling data using information from each district.

Fortunately, the dynamics of the race were much simpler than Clinton vs. Obama 2008, and I found in the end that the polling results could be described by only two variables (which is very nice, as we only had eight data points, so the model shouldn’t be overfitted):

1. Obama: The percentage of the vote Obama received in 2008 (Courtesy of SSP)

2. Incumbency: The number of years the person has been in office (for instance, someone elected in 2008 would have an Incumbency of 2 years.) – Numbers from SSP above.

I also experimented with other variables (which I discarded in the end as being not statistically significant):

3. Barrett: The percentage of the vote Tom Barrett received in 2010. (Thanks to the Journal-Sentinel)

4. Scandal: A 1/0 value describing the unique circumstances of the aptly named Randy Hopper, and perhaps Mr. Prosser as well.

5. Kerry: Percentage of the vote Kerry received in 2004

I also decided on using percentages rather than margins as there was a better correlation between the two.

In the end, my 2-variable model describes very accurately (within +/- 1.5%) the percentage of voters who would commit to voting for a Democrat in a hypothetical election this year; the spreadsheet is included below.


(The main prediction is highlighted in red. There are other columns to the right which include the additional variables that did not turn out to be significant.)

In short, the vulnerability of each Senator is based mostly off of Obama’s performance in the state in 2008, along with a small bonus from incumbency (about 0.3 points per year in office.) Thus, Hopper is quite vulnerable simply from being a freshman (the scandal had not impacted his poll numbers at that point yet), while Alberta Darling has built up goodwill from being in office for 18 years.

Extrapolating this model for the three Democrats who are considered semi-vulnerable, we find they are mostly safe. The only one who’s really vulnerable is Mr. Holperin, who was first elected by 2.5% in 2008 and represents a seat Obama won by single digits. Note that I give the Democrats negative incumbency so it gives a bonus to the D #s (rather than a penalty), and since the model considers undecideds, anything 48% or up is probably leaning D.

Examining Justice Prosser, who gets elected by the State of Wisconsin as a whole, we find that the seat is probably somewhat leaning D at this point, but I would put the margin of error much higher on this estimate – the race is still developing, and a Supreme Court race is very different from a Senate one.

Maryland Legislature

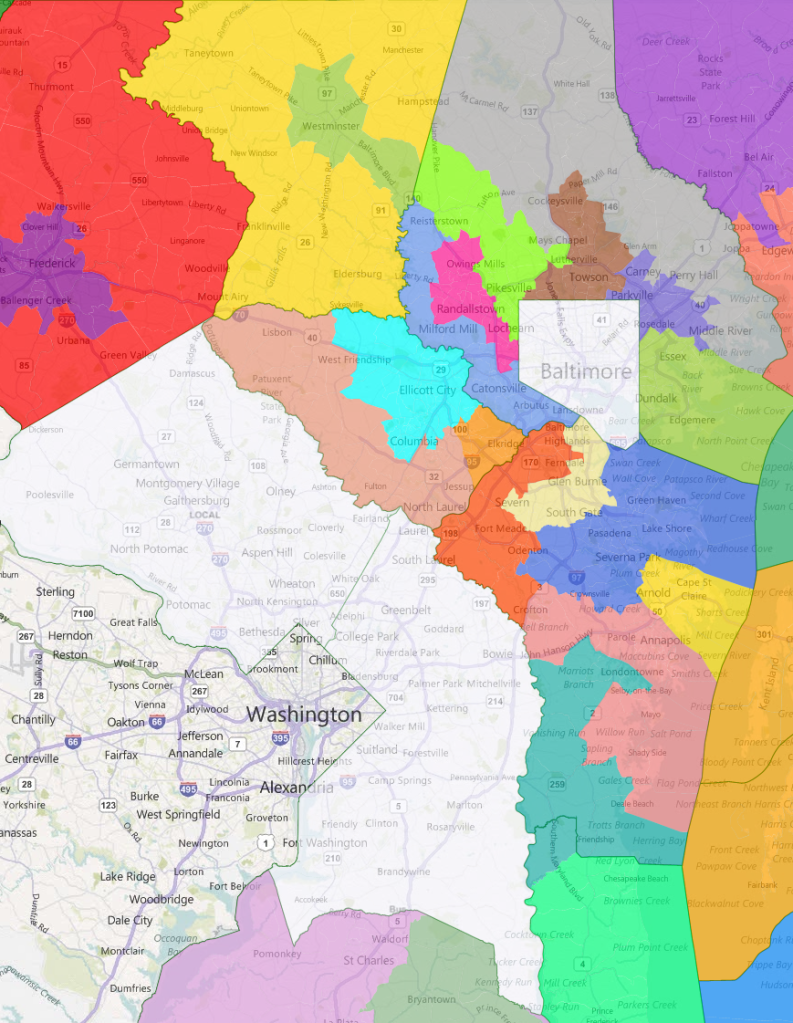
Now that the Census numbers are out and the Maryland prison population has been “reallocated” in accordance with a new law here (well, mostly reallocated — http://planning.maryland.gov/P… ….) I wanted to do a diary showing how Democrats can still be added to the Maryland Legislature despite the fact that Baltimore City is set to lose one district to the more Republican northeastern part of the state.  This map is also done in a manner where there are as few county splits as possible and I likewise tried to keep communities within counties in the same district.

I only drew districts for areas outside Montgomery and Prince George’s Counties and Baltimore City.  Those three jurisdictions are hyper-Democratic (combined vote 81.2 Obama – 17.7 McCain) and should have no trouble electing only Democrats.  The only trick there will be to balance the interests of the incumbent Democrats and the interests of minority communities.

Maryland’s Legislative redistricting should actually be quite easy this time around.  Due to a random mathematical quirk, a very large proportion of counties and regions of the state can be redrawn whereby very few districts need to cross county lines.  I made most of my new districts have a population deviation of +/- 3.5% (although most are +/- 2.5%), which is better than the +/- 5% deviation that has been used in the past.  (A few of the sub-districts here deviate up to +/- 4.5%.)  I have also made the new districts reflect the population adjustments required by a new Maryland law that reassigns the prison population from place of incarceration to last known address —  http://planning.maryland.gov/P…

You can see what I mean below:

The ideal district population this time around is 122,813 (for sub-districts it equates to 81,875 and/or 40,938).

– Baltimore City corresponds to exactly 5 districts with 125,333 persons each (2.1% above ideal).

– Montgomery Co. corresponds to exactly 8 districts with 121,542 persons each (1.0% below ideal).

– Prince George’s Co. corresponds to exactly 7 districts with 123,589 persons each (0.6% above ideal).

– Harford Co. corresponds to exactly 2 districts with 122,697 persons each (0.1 % below ideal).

– Frederick Co. and the three western Maryland counties correspond to exactly 4 districts with 119,727 persons each (2.5% below ideal).

– Baltimore and Carroll Counties together correspond to exactly 8 districts with 121,744 persons each (0.9% below ideal).

– Charles and St. Mary’s Counties together correspond to exactly 2 districts with 126,073 persons each (2.7% above ideal).

– Cecil and Kent Counties together correspond to exactly 1 district with 121,553 persons (1.0% below ideal).

– The lower Eastern Shore (5 counties including Caroline) corresponds to exactly 2 districts with 120,223 persons each (2.1% below ideal).

At this point, what’s left is only Calvert, Anne Arundel and Howard Counties on the western shore and Talbot and Queen Anne’s on the eastern shore.  Crossing as few county lines as possible was the reason why I drew a district across the Bay Bridge linking Talbot and Queen Anne’s with the Broadneck  Peninsula in Anne Arundel (one of the eastern shore districts has to cross somewhere, so why not here).  Anne Arundel still has 4 districts that are all or mostly in the county, while 2 more cross over with Calvert and Howard.  Howard itself has 2 that are completely within the county.  I drew separate sub-districts for those parts of Anne Arundel shared with Howard, Calvert and the Eastern Shore.

The main way I get more Democrats is the following two major changes:

1.) In Howard, the new District 9 becomes a whole lot more Democratic — new district is 60.1 Obama – 38.0 McCain — while the current district is only around 43 Obama.

2.) In Anne Arundel the new District 31 becomes a whole lot more Democratic — new 53.7 Obama – 44.3 McCain (but the Democratic 2006-2008 partisan numbers look even better there: 57.9 Dem. – 42.1 GOP) — while the current district is only around 40 Obama.

Here’s the map:
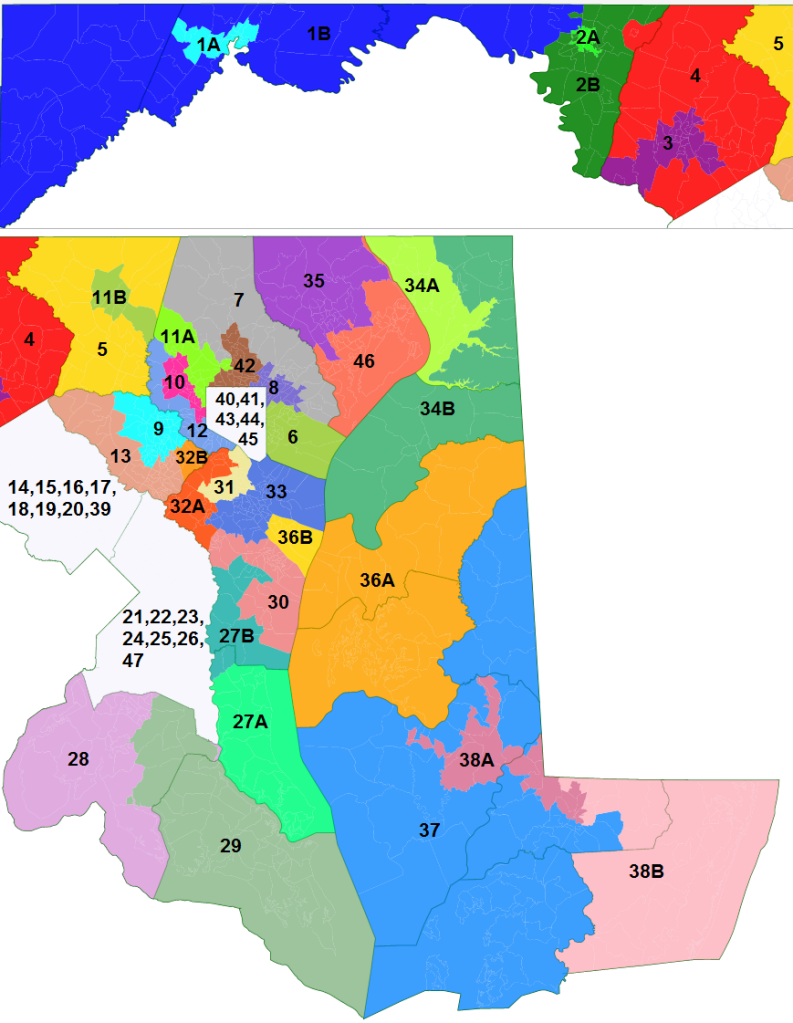
Photobucket

Photobucket

As I’ve said before, I didn’t even mess with Montgomery, Prince George’s and Baltimore City for the purpose of this diary which is to show how to draw the lines so more Democrats are elected — those three combined will have 20 Democratic Senators and 60 Democratic Delegates.  The lines can easily be drawn where all 5 Baltimore City districts are 60%+ African-American, and the Maryland suburban districts can likewise be drawn to reflect the great ethnic and racial diversity there.  

Virtually all other existing Democratic districts remain roughly at the same Democratic percentage or better.  Basically, to improve Democratic chances, I made the Dem-held districts more Democratic while making the GOP-held ones even more Republican, while still adding the two new Democratic seats discussed above.

The suburban districts in Baltimore Co. are all redrawn whereby the 6 districts going clock-wise around Baltimore City will all elect as many Democrats as possible (all the Republicans are packed into District 7 in the northern and eastern extremity of the county).

There is one district where the Democratic percentage would decline by a lot – District 27 which is the home of Senate Leader Mike Miller.  The new 27th would no longer have southern Prince George’s to make it more Democratic, but on the flip side, Miller would no longer need to fear a black primary challenger while his district would remain at 50.0 Dem – 50.0 GOP (2006-2008 partisan aggregate) – enough for him to win the general, as his “conserva-Dem” persona would fit the Calvert-based district perfectly.

Now to brief discussion of individual districts:

Western Maryland and Frederick Co.

District 1 – remains GOP, 65.3 McCain, 32.7 Obama

Sub-district 1A – 1 Delegate, Cumberland and Frostburg, made to be more Democratic, 55.6 McCain, 42.0 Obama (current sub-district is only about 34 Obama)

Sub-district 1B – 2 Delegates, 69.6 McCain, 28.5 Obama

District 2 – remains GOP, 53.4 McCain, 44.7 Obama

Sub-district 2A – 1 Delegate, Hagerstown, 56.5 Obama, 41.4 McCain (same as current sub-district)

Sub-district 2B – 2 Delegates, 57.6 McCain, 40.5 Obama

District 3 – made more Democratic, 56.5 Obama, 41.8 McCain (current district is about 54 Obama), sub-districts eliminated so that all 3 Delegates can now be Democrats

District 4 – remains GOP, 58.3 McCain, 39.9 Obama

Baltimore Co. and Carroll Co.

District 5 – remains GOP, 65.7 McCain, 31.6 Obama

District 6 – remains the “conserva-Dem” district that it is, 52.7 McCain, 44.7 Obama (BUT, 58.0 Dem – 42.0 GOP avg. 2006-2008), which is same as current district.

District 7 – remains GOP, 62.3 McCain, 35.1 Obama

District 8 – made to be more Democratic in order to add Delegates here, 52.2 Obama, 45.4 McCain (current district is around 48 Obama)

District 10 – new district is 69.1% black, 88.0 Obama, 11.1 McCain

District 11 – remains Democratic, 55.5 Obama, 42.6 McCain (but 59.3 Dem – 40.7 GOP avg. 2006-2008), less Democratic than current but should be plenty safe here

Sub-district 11A – 2 Delegates mostly Jewish areas in northwestern Baltimore Co., 62.4 Obama, 35.9 McCain

Sub-district 11B – 1 Delegate, Westminster area in Carroll Co., 60.9 McCain, 36.6 Obama, this is really a bone thrown to the GOP as District 11 could be left without sub-districts and would then elect 3 Democratic Delegates

District 12 – remains Democratic, 59.4 Obama, 38.3 McCain (slightly more Democratic than current)

District 42 – remains as is, Democratic Senator here now should be OK, hopefully a few more Democratic Delegates are added; the elections here have been very close in recent past, 53.0 Obama, 44.6 McCain (same as current district)

Howard County

District 9 – made to be much more Democratic, 60.1 Obama, 38.0 McCain. Current district is only around 43 Obama so Democratic Senator and 3 Democratic Delegates are added !

District 13 – remains Democratic, 60.4 Obama, 37.9 McCain (somewhat less Democratic than current, but should still be very safe)

Anne Arundel County

District 30 – remains Democratic, 53.0 Obama, 45.4 McCain (a bit more Democratic than current, so hopefully the lone GOP Delegate will be ousted)

District 31 – made to be much more Democratic, 53.7 Obama, 44.3 McCain (but 57.9 Dem – 42.1 GOP avg. 2006-2008).  Current district is only around 40 Obama so Democratic Senator and 3 Democratic Delegates are added !  (and bye, bye to the odious Don Dwyer).  Most of the Democrats who now represent District 32 could really run here, as much of the territory in the current 32 becomes part of the new 31; I could have just flipped the numbering here … For the first time in decades Glen Burnie would now all be in one district.

District 32 – remains Democratic, 55.3 Obama, 42.7 McCain (slightly more Democratic than current)

Sub-district 32A – 2 Delegates, Anne Arundel Co., 55.8 Obama, 42.3 McCain

Sub-district 32B – 1 Delegate, Howard Co., 54.3 Obama, 43.5 McCain

District 33 – remains GOP, 60.9 McCain, 37.0 Obama

Southern Maryland

District 27 – drawn for Senate Leader Mike Miller, 54.2 McCain, 44.2 Obama (but exactly 50.0-50.0 Dem/GOP avg. 2006-2008, with exactly 10 more votes for the Dems !) – current district is ofcourse a whole lot more Democratic as it goes into Prince George’s but in order to preserve the little or no county splitting goal, this is the only way to draw here.  As I mentioned above, Miller may not be against drawing the lines this way.

Sub-district 27A – 2 Delegates, Calvert Co. (except Dunkirk), 52.2 McCain, 46.2 Obama (but 51.9 Dem – 48.1 GOP avg. 2006-2008), would continue to be a swing area as currently

Sub-district 27B – 1 Delegate, Anne Arundel Co. (and Dunkirk in Calvert), 58.0 McCain, 40.3 Obama

District 28 – remains Democratic, 67.8 Obama, 31.3 McCain, new district is 44.5 white, 43.6 black

District 29 – remains the conserva-Dem swing area that it currently is, 55.5 McCain, 43.1 Obama (but 51.2 Dem – 48.8 GOP avg. 2006-2008) – about the same as current

Harford County

District 35 – remains GOP, 67.0 McCain, 30.4 Obama

District 46 – this district is “moved” here from Baltimore City, 50.0 Obama, 47.9 McCain (but 53.8 Dem – 46.2 GOP avg. 2006-2008), so should be a lean-Democratic district

Eastern Shore

District 34 – GOP Senator would remain, 55.1 McCain, 42.7 Obama

Sub-district 34A – 1 Delegate, 62.3 McCain, 35.3 Obama

Sub-district 34B – 2 Delegates, 51.4 McCain, 46.6 Obama (but 49.5 Dem – 50.5 GOP avg. 2006-2008), so area would be competitive

District 36 – remains GOP, 56.9 McCain, 41.4 Obama

Sub-district 36A – 2 Delegates, Queen Anne’s and Talbot Counties, 59.3 McCain, 39.2 Obama

Sub-district 36B – 1 Delegate, Anne Arundel Co. – Broadneck peninsula (Arnold and Cape St. Claire), 52.6 McCain, 45.4 Obama

District 37 – remains GOP, 59.2 McCain, 39.3 Obama

District 38 – reconfigured to shore up newly-elected Democratic Senator here, 50.4 McCain, 48.3 Obama (current district is only about 41 Obama)

Sub-district 38A – 1 Delegate, majority-black, 68.5 Obama, 30.3 McCain

Sub-district 38B – 2 Delegates, 58.3 McCain, 40.4 Obama

Michigan Redistricting: An Unexpected Problem

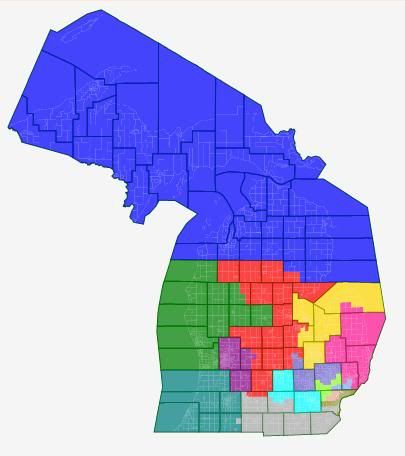
Maintaining two VRA majority-African-American districts in the metro Detroit area is going to be much more of pain than I originally thought. In the relevant population by CD thread, I breezily commented:

And, on an even more important “not-to-mention” note, the Detroit metro area still has more than enough African Americans for two VRA districts, so consolidating MI-13 and MI-14 isn’t in the cards quite yet.

This is not untrue, but the measures required to get those two districts were a lot more dramatic than I expected. The most recent Census estimates painted a very different picture from the actual Census’s report of massive population loss in Wayne County. And so the new districts are likely to be quite different from what I (and others) had previously imagined.

After the jump, I present two different scenarios for the Detroit area districts. Please feel free to post your own — this is very much more about getting a discussion going than presenting anything close to a polished proposal.

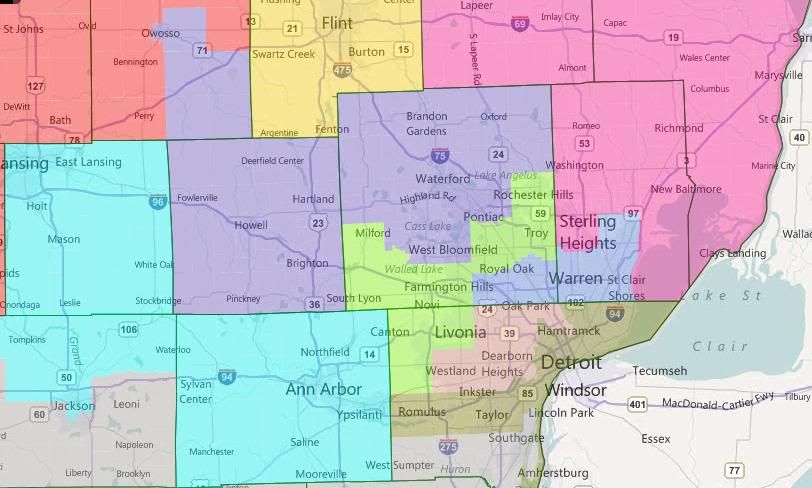
Map 1: Skirting the Line

So far as I can tell, this is the best you can do in terms of maximizing the African American percentages of the two Detroit districts while staying in Wayne County. However, the two Detroit districts are majority African American by total population, but not by VAP. So to the best of my understanding of current case law, this solution is VRA-suspect.

Which is unfortunate for the GOP, because this is reasonably successful map for them. Basically, this is an attempt to cut out both Dingell and Peters, while replacing one of their districts with a new safe Ann Arbor plus Lansing district.

District-by-district, briefly:

Benishek’s MI-01 (Blue) is shored up for the Republicans with the addition of Grand Traverse County. Likewise, Upton’s MI-06 (teal) gains Allegan County. Amash’s MI-03 (purple) holds more or less steady, as does Miller’s MI-10 (pink).

Huizenga’s MI-02 (green) – currently the most Republican district – absorbs a couple of problematic counties from Camp’s MI-04 (red). MI-04 is a little shaky for the Republicans, but I’m not sure how to fix that.

Walberg’s MI-07 (grey) loses Eaton and outer Washtenaw County and picks up Monroe County and the southern tier of Wayne County – I could be wrong, but my instincts tells me that’s a wash. Kildee’s MI-05 (yellow) stretches north to take in more of the Thumb and all of Bay County, which marginally weakens it for the Democrats. MI-09 (cyan) is a new heavily Democratic open seat stretching from Ann Arbor to Lansing.

Then, we move into the Detroit Metro area. Massive population loss in Detroit causes Conyer’s MI-14 (brown) and Clarke’s MI-13 (salmon) to chew up most of the Wayne County portions of Dingell’s dismantled MI-15. They’re 50.6% African American total pop, 49.6% VAP and 50.3% African American total pop, 49.5% VAP respectively. Levin’s MI-12 (cornflower blue) stays more or less the same, picking up the rest of Royal Oak from Peter’s dismantled version of MI-09.

Speaking of which, that’s been bisected between McCotter’s MI-11 (lime) and Rogers’s MI-08 (slate blue). McCotter picks up Peters himself and some of the more Republican parts of the dismantled Ninth. Rogers gets some of the most Democratic parts of the old ninth in West Bloomfield, Pontiac, and Auburn Hills — but he no longer has to worry about Lansing, so he should still be fine.

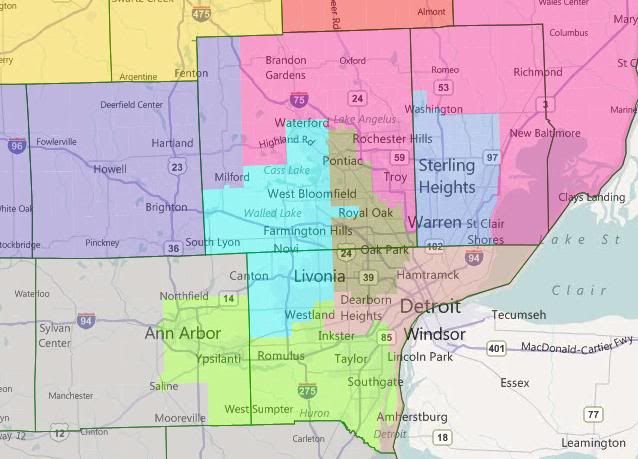
Map 2: The Problem of Pontiac


Same thing, just zoomed in with locality lines

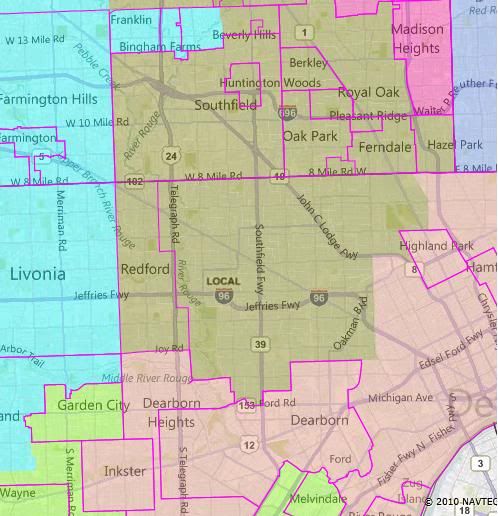
This one really just focuses on the two Detroit districts. In contrast to the first map, you’re looking at two true majority African-American districts. MI-13 (salmon) is 53.0% African American on both measures. MI-14 (brown) is 56.5% African American by total population, 54.6% African American by VAP.

So far as I can tell, stretching Conyers’s district over into Oakland County like this to pick up Southfield and Oak Park is the only way to get the two Detroit districts to combine into majority-African-American status. Having done that, stretching up to majority-African-American Pontiac seems to make a lot of sense.

Having Clarke’s district stretch through Dingell’s Dearborn to get to majority-African-American Inkster isn’t strictly necessary to get to 50% African American by VAP, but it does help.

Now, if I’m right in my understanding of case law and this basic configuration is necessary to comply with the requirements of the VRA, then state GOP has a problem on its hands. They can’t draw a district for McCotter that (1) he can win and (2) conforms with state redistricting standards.

Michigan state redistricting standards frown on county and locality splitting and are generally understood to prohibit what user rdelbov generally calls a “double-cross” — that is, having Districts X and Y share both Counties A and B. If you look over the current map, you’ll see that interpretation seems to have been followed under the last GOP gerrymander. McCotter’s district is the one allocated Oakland-Wayne split district. If Conyers’s district becomes one, then McCotter’s district, under state redistricting standards, can’t do that any more. But McCotter lives in Wayne County, and he needs those Oakland County Republicans to have a winnnable district.

Now, the potential out here is that, so far as I understand it, the state Supreme Court basically declared the state redistricting standards non-justiciable the last time a suit was filed based on them after the 2000 round of redistricting. So if the GOP wants to ignore them, they probably can.

I drew in sample districts around the two Detroit districts. The Detroit metro area ones more of less work, from a GOP perspective, although some of the non-pictured outstate ones were pretty ugly. But without knowing how to resolve the “double-cross” conundrum, I wasn’t really sure how to proceed.

Wrap-Up

So, which is the better way for the GOP to push the limits of redistricing law? Two only-borderline majority African American districts in Detroit? Or violate (potentially unenforceable) state law and have two districts cross the Oakland-Wayne border? Or do you have a better solution altogether?

NY Stand-pat Map

I basically tried to put together a NY standpat map, which could happen if Gov. Cuomo backs down from his threat to veto any gerrymandered map. The Senate Republicans passed a constitutional amendment for non-partisan redistricting, which would only take affect in 2022. I guess this could also be a judges map, if the judges just wanted to keep everything pretty much the same. I just tinkered with the edges in NYC, not wanted to run afoul of the VRA. The upstate areas I tried to clean up the map, save the Plattsburgh to Syracuse district for Bill Owens. The map takes apart NY-05 and NY-25.

Photobucket

Ok starting in Western NY:

Photobucket

27: Higgins get a compact district, solely in Buffalo. Safe as well, Obama won with 62%. (TEAL)

26: The special election winner for Chris Lee’s old district gets a Obama 46% district. It eats up the Slaughter earmuffs and Chautauqua County. (SLATE)

5: Slaughter gets a compact district in her home Monroe County (I just called this NY-05 because Gary Ackerman’s district evaporated). This is an Obama 58 % district. (YELLOW)

25: Tom Reed’s district takes a chunk of Richard Hanna’s blue-color district, as that compacts towards Hanna’s home in the Utica area. Gets some of the area’s around Ithaca. Obama 47.5%. (RED)

Photobucket

23: Richard Hanna’s district is now cleaner and more centered around Utica. It picks up some area from Bill Owens’ district and Gibson’s. Obama 49%. (INDIGO)

21: Paul Tonko picks up a Greene county from Gibson in what is now an Obama 57% district. (DARK BROWN)

Photobucket

This is NY-23, which now runs from Owens’ home in Plattsburgh to Syracuse. He is probably safe with an Obama 58% district. He may be vulnerable to a primary challenge however from a Syracuse based politician. Gibson gets a few of the counties up north here.

Photobucket

22: Hinchey picks up all of Delaware county.  He keeps the tendril to Ithaca and picks up a little area in Orange county. Obama 58% (LIGHT BROWN)

20: The southern half of Gibson’s district doesn’t change much. It stays swingy, Obama won it with 52.5 %. (PINK)

19: Hayworth district picks up part of Nita Lowey’s district that had been in Rockland county, the area north of New City. Obama 51% (GREEN)

Photobucket

18: Nita Lowey gets a solely Westchester based seat. She loses her areas in Rockland to Engel and Hayworth and picks up New Rochelle, Mount Vernon and parts of Yonkers from Engel. Still safe, Obama 64% (YELLOW)

17: Engel picks up New City from Lowey, as well as some areas strongly Democratic from Joe Crowley in the Bronx. This becomes a Rockland/Bronx/Yonkers district. Obama 72% (BLUE)

Photobucket

7: Crowley’s district loses some Hispanic areas of the Bronx, but retains the more White, eastern area of it. He gets parts of Flushing, Great Neck and Elmhurst as well. While this is a minority-majority district, Crowley holds immense power as head of the Queens Democratic Party, so he would probably be safe from a primary. Obama 71 %, W 33 B 9 H 33 A 21 (SILVER)

16: Jose Serrano’s district grabs a few precincts to its east. Stays mostly same though. Obama 88 %, 62% Hispanic.  (GREEN)

15: Charlie Rangel’s district stays pretty much the same, just picks up a few blocks on the UES and UWS. Obama won 92 % here. B 30 H 47, so this may be won by Senator Espillat whenever Rangel leaves. (ORANGE)

14: Maloney picks up little more area in Queens, but other than that, no major changes. Obama 78%. (OLIVE)

Photobucket

9: Anthony Weiner’s district pulls out of Brooklyn for the most part. I had to give him a little chunk to the West of Marine Park, but other than that this is a Queens district (Weiner lives in Forest Hills). He picks up a big chunk of Ackermans old district in the Flushing area and Corona. Obama 64%, W 47 H 25 A 18 (LIGHT BLUE)

6: Meeks district picks up a little bit of the area from Ackerman. They are mostly white voters, and my map couldnt keep him above 50 % black voters for this VRA district. I’m sure its possible though, but its just darn hard. 88 % Obama, 49.9 % Black. (TEAL)

10: Towns’ district gives some Hispanic areas to Velasquez in the North, and picks up some White areas from Weiner’s old Brooklyn area near Marine Park. Obama 86% B 56 H 15 (LIGHT RED)

11: Yvette Clark picks up a little bit of Weiner’s district as she moves slightly south. 88 % Obama, 55 % Black.

12: Velasquez expands a little bit in the Williamsburg area. This inches slightly closer to a majority hispanic district. Obama 56 %, W 24 B 10 H 48 A 15. (LIGHT BLUE)

8: Nadler’s district stays the same, snaking from Manhattan to Boro Park, but he adds all of Coney Island as well from Weiner. Obama 72 % (DARK BLUE)

13: Michael Grimm picks up a few more Brooklyn Precincts from Weiner. Obama 49 % (SALMON)

Photobucket

This is where Ackerman gets taken out.

4: McCarthy takes a tiny piece of Queens, as well as the Southern half of Ackerman’s Nassau portion. Obama 58 % (DARK RED)

3: Peter King picks up Port Washington and Great Neck and keeps his weird tendril to grab Republican voters in Suffolk. Obama 48.5% (PURPLE)

2-1: Steve Israel’s district goes a little farther into Nassau county (GREEN: Obama 56 %) as Bishop (BLUE: Obama 52 %) grabs a little more Suffolk County territory to make up for population loss.

All in all, most of the republicans that won in 2010 stay within a point or two of where they were before. Hanna gets safer, Higgins becomes safe, Slaughter loses a few points of PVI but gets to be in her home base of Rochester. The map gets a lot cleaner upstate, few counties are split. All the congressmen in this map would be okay with very few new constituents, and the Dems would not be giving safe seats to all the republicans that just own their seats.  

Daves Redistricting: 2010 data for all but 5 states

All but 5 states now have 2010 data.

Four of the five require Block Groups and will be done in a week-ish: KY, MT, OR, RI.

The last is Alaska, which I’m not planning to do. It presents a unique technical problem, which I don’t want to spend the time on unless there is a huge groundswell of interest.

So, the new states are ME, MA, MI, NH, NY, SC and WV.

Note on CA: some of the voting districts are indeed huge. Example: City of Fremont (pop. 84000+) is a single voting district. I went back and checked the raw files from the Census Bureau and this is indeed the case. When I get the other Block Group states done, I will add block groups for CA, too. I will also add block groups for some New England states. NH really seems to need it, but MA does not seem bad.

Daves Redistricting

Remember, you can support this project with a tax-deductible contribution through ProgressiveCongress.org.

Thanks.

Illinois with 2 Hispanic* districts

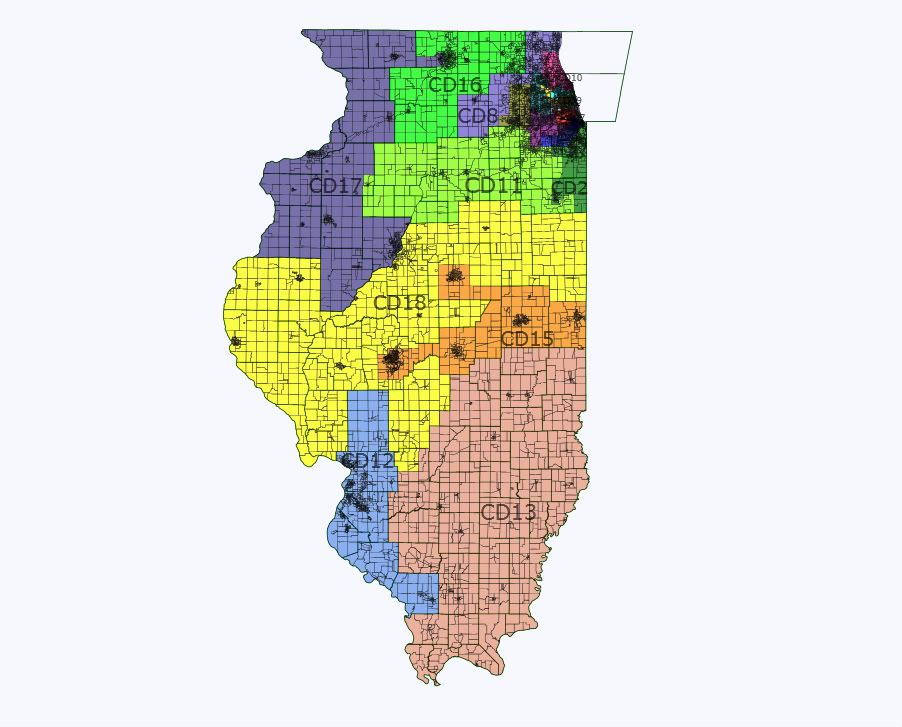
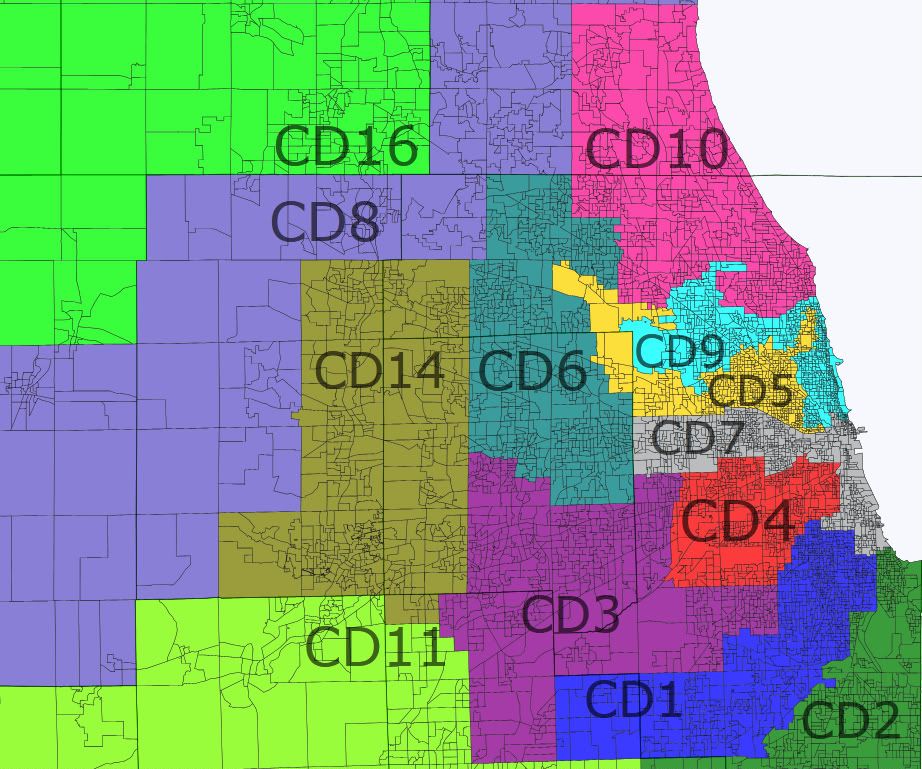
This map is intended to favor Dems as they control both houses and the governor’s office. I tried to avoid any egregious gerrymanders, and I suspect that some of the suburban Chicago districts could be made more favorable. The only really ugly districts are IL5 (Quigley) and IL9 (Schakowsky). IL5 had to take a pretty strained shape to get a voting-age Hispanic plurality, although it still isn’t nearly as bad as the current Hispanic-majority IL4 (Gutierrez). IL9 had to pick up the vacated IL5 precincts that didn’t have enough Hispanics, as IL7 (Davis) has just a 50.1% voting-age black majority and could not pick anything up.  

State map:

Photobucket

Chicago area map:

Photobucket

Notes on districts, with voting-age populations. w = Anglo, b = black, h = Hispanic, a = Asian.

IL1 (blue, Rush): 38.2w-52.1b-7.4h-1.2a. Underpopulated and has to expand to the west. Safe D.

IL2 (green, Jackson): 36.0w-50.8b-11.2h-0.9a. Underpopulated and has to expand to the south to pick up most of Kankakee. The southernmost area is Pembroke, an 85% black semi-rural area which is unusual outside the south. Safe D.

IL3 (purple, Lipinski?): 77.2w-6.1b-8.9h-6.6a. This district has more of the current IL13 (Biggert) than the current IL3, as it really had nowhere else to go. It’s probably competitive. Tossup?

IL4 (red, Gutierrez): 31.3w-6.1b-58.3h-3.6a. One of the ugliest districts in the nation is now one of the cleanest. Safe D.

IL5 (yellow, Quigley): 43.2w-4.8b-44.4h-6.1a. I don’t think it’s possible to draw a second Hispanic-majority district without using really tortured lines. As is I think this proposed district as pushing it as far as “compact” goes, although obviously it isn’t nearly as screwy as the current IL4. Safe D

IL6 (teal, Roskam): 73.3w-3.1b-11.4h-11.1a. It picks up the Palatine and Schaumburg areas, and loses its heavily Hispanic area in the east and some of its western end. It may be slightly more red now, but I know very little about the political leanings of Chicago suburbs. Tilt R?

IL7 (gray, Davis): 31.0w-50.1b-9.8h-7.5a. There probably will not be 3 black-majority districts after 2020. Black plurality, maybe. Safe D.

IL8 (blue-gray, Walsh): 69.2w-6.4b-18.1h-5.1a. Dumps its piece of reddish McHenry county and some Cook suburbs, and picks up Waukegan, much of swingy Kane county, and bluish DeKalb county. This is intended for Melissa Bean to return to DC. Walsh doesn’t live here. Tilt D?

IL9 (toothpaste blue, Schakowsky): 73.1w-6.4b-10.0h-8.7a. Moves south and much more into Chicago proper. Safe D.

IL10 (pink, Dold!): 72.6w-4.1b-8.9h-12.9a. Moves south into IL9’s vacated areas, taking most of the college town of Evanston along with neighboring suburbs that are heavily Asian. This would probably be one of the most Asian districts outside California or Hawaii. The intent is to ensure that Dold! serves one term! Likely D?

IL11 (pea soup green, Kinzinger): 80.1w-5.8b-11.3h-2.0a. Loses some of its eastern end including Kinzinger’s house, picks up northwest Kendall county and some western rural areas. Lean R?

IL12 (light blue, Costello): 80.5w-14.7b-2.4h-1.2a. The St. Louis area district sheds most of its southern end but keeps the college town of Carbondale, and adds Macoupin county and the rest of Madison county. Obama got 57.3% of the two-party vote here. Lean D.

IL13 (pink-gray, Shimkus): 93.5w-3.6b-1.6h-0.5a. Renumbered from IL19. Downstate Republican sink. Safe R.

IL14 (brown-green, Hultgren): 61.4w-5.5b-24.1h-7.9a. Loses most of its western rural areas (which are actually swingy for the most part) and exurbs and picks up the Naperville and Hanover areas. Tossup?

IL15 (orange, Johnson):  80.5w-10.6b-3.0h-4.4a. This is my concept of the “midstate cities swing district” that jsramek mentioned on an earlier Illinois thread. It has Springfield, Decatur, Bloomington-Normal, Champaign, and Danville. Obama got 52.8% of the two-party vote in the 6 counties within the district, although it’s missing some (probably red) rural and exurban areas within these counties. Toss up, but it would likely take a very strong candidate to beat Johnson.

IL16 (garden hose green, Manzullo): 85.9w-2.7b-8.4h-2.0a. The north state Republican “sink”. It picks up the rest of McHenry and loses its western end and the bluest parts of Rockford. Walsh also lives here. Likely R?

IL17 (indigo, Schilling): 82.0w-9.6b-5.7h-1.5a. Moves north from its current fugly-mess configuration to take in purple or blue areas of the state’s northwest, including Peoria and the bluest parts of Rockford. Obama got 58.2% of the two-party vote here without any of Rockford, so his overall share here was probably closer to 60%. Lean D/likely D.

IL18 (yellow, Schock): 94.1w-2.6b-1.9h-0.5a. Mid-state Republican sink. Schock actually lives in IL17 but would probably run here. Likely R/safe R.

Under this map, the Dems would easily hold districts 1, 2, 4, 5, 7, and 9. They should (finally) take 10 and retake 8 and 17, and Costello shouldn’t have too much trouble in 12. Reeps will hold 13, 16, and 18. Then you have 3, 6, 11, 14, and 15 which appear to all be competitive and all of which could conceivably be held by Republicans. Given that 3, 6, 11, and 14 occupy a contiguous block of western and southwestern suburbs, I suspect it would be possible to draw them such that one of them is lean-R or even likely-R and the other 3 are tossup or tilt-D. (I would leave this for someone who knows more about Chicago-area politics.) As is, I would say this is a 10-3-5 map but probably 11-7 or 12-6.

Thoughts? In particular, thoughts about how the Dems might draw the lines in the western and southwestern Chicago suburbs?

By what margin will Bob Shamansky win?

View Results

Loading ... Loading ...

Live blogging the NSW 2011 state election

Okay let’s take a crack at this. I’m going to attempt to live blog the New South Wales state election. Polls close at 6:00pm Sydney time, which is 12:00am PST, 3:00am EST. Since it’s going to be very late in the morning for me I’ll cut off the live blogging around 8:00pm Sydney time, 2:00am PST. But it is expected that if the polls are correct, we should know within an hour of the polls closing if the Coalition has won government.

3:19am PST (9:19pm AEST): Last update for this blog. Coalition has won 65 seats, Labor 16 seats. Labor will be in the wilderness for at least 8 years. And if you stumble upon this diary, just start reading from the bottom.

3:15am PST (9:15pm AEST): Former Labor premier Bob Carr says Labor could of won tonight. Riiiiight. And I’m the King of England.

3:09am PST (9:09pm AEST): Kristina Keneally announces she will step down as Labor Party leader. Says another leader needs to lead the party in the wilderness. Good thing John Robertson got elected to the seat of Blacktown tonight.

3:07am PST (9:07pm AEST): Foley: 1/3rd of Labor voters voted for the Coalition today. Most of those 1/3rd had never voted Liberal until today. Coalition has won 64 seats, projected to win 70. Labor has won 15 seats, projected to win 20.

3:01am PST (9:01pm AEST): Kristina Keneally delivering her concession speech now.

2:57am PST (8:57pm AEST): Balmain is a three way race between the Greens, Labor and the Liberals. The Liberals are leading in the primary vote right now with the Greens and Labors in a dead heat with each other.

2:52am PST (8:52pm AEST): Kristina Keneally will concede the election around the top of the hour.

2:49am PST (8:49pm AEST): Foley bemoans the fact that the Labor’s best leadership talent for the next twenty years will be former Premiers (Kristina Keneally & Nathan Rees).

2:42am PST (8:43pm AEST): After saying “Amazing” for the 1 millionth time, Berejiklian noted that the Coalition has made major inroads in Labor Heartland like the Illawara and Western Sydney.

2:33am PST (8:33pm AEST): Kristina Keneally will not concede the election for at least another hour. This is for respect for Earth Hour.

2:24am PST (8:24pm AEST): Carmel Tebbutt is the comeback kid! She’s probably going to beat Greens candidate Fiona Byrne who Foley termed a “disaster” because of her role in the Marrickville boycott of Israel. While the seat of Balmain is on a knife’s edge with the Greens just narrowly ahead.

2:12am PST (8:12pm AEST): Berejiklian happy that the Liberals could most likely pick up the seat of Campbelltown, a seat they themselves thought they couldn’t win. To imagine how bad Labor is losing right now, think of last year and imagine if Democrats had lost every marginal seat in the House and a boatload of VRA and super super safe house seats.

2:08am PST (8:08am AEST):
Upper House Labor MP Luke Foley, “The Labor Heartland is gone.”

2:01am PST (8:01pm AEST): Liberals pick up the seat of Drummoyne which was held by Labor MP Angela D’Amore who was barred from running again after being found guilty on corruption charges. Coalition has won 60 seats, Labor 13. While in Blackdown, John Robertson who’s been tapped to become the next leader of the Labor Party is leading in the primary count right now. Polls had shown a close fight here.

1:57am PST (7:57pm AEST): Watching the two seat that the Greens are trying to win, Marrickville and Balmain, the Greens candidates are leading in the primary vote but ABC News has projected Labor holds on both seats. Quite confusing.

1:50am PST (7:50pm AEST): Roads Minister David Borger (who was caught covering his party affiliation on his campaign signs with sticky notes) is in a dead heat with Liberal Candidate Tony Issa. ABC News is projecting he will be reelected at the moment.

1:29am PST (7:29pm AEST): ABC Election Analysis Anthony Green comments that right now the Coalition will have a 49 seat majority in the new Parliament. Kristina Keneally is back in the lead by double digits in Heffron with 11.2% swing towards the Liberal party. As of now, Labor has won 9 seats, Coalition 60. There is a 17.1% swing against Labor with 12.1% of the vote counted.

1:26am PST (7:26pm AEST): Shadow Transport Minister Gladys Berejiklian comments that former Premier Nathan Rees will probably hold this seat of Toongabbie thanks to Greens preferences. Labor at 9 seats, Coalition 57, Greens 0.

1:22am PST (7:22pm AEST): Looks like the Australian Greens may not pick up any seats at all. There is only a 3-4% swing against Carmel Tebbutt in Marrickville and Labor and the Liberals are in the top two in the primary vote right now in the seat of Balmain.

1:15am PST (7:15pm AEST): About 2% of the vote counted in Premier Keneally’s seat of Heffron….she’s down six points to the Liberal Candidate on the 2PP count.

1:11am PST (7:11pm AEST): Labor MP Noreen Hay lost her seat to an independent. What’s so startling about that? Labor carried that seat by a 24% margin in 2007.

1:06am PST (7:06pm AEST): It’s over. Barry O’Farrell is the new Premier of New South Wales. The Coalition sits on 45 seats (2 away from a majority), Labor at 6.

1:04am PST (7:04pm AEST): The cover of tomorrow’s Sunday Telegraph: http://twitpic.com/4dejz3

12:58am PST (6:56pm AEST): Labor commentator on ABC News says Carmel Tebbutt is only suffering a 5% swing against her towards the Greens at the moment. Liberals have picked up the seat of Strathfield from Labor in a massive swing of 30.7% (based on one polling booth.) Labor is now at 4 seats won, 33 for Coalition.

12:52am PST (6:52pm AEST): Check the latest results here.  Coalition is at 31 seats, only 15 away from an outright majority.

12:47am PST (6:47pm AEST): Coalition has picked up the following seats: Dubbo, Bathurst, Kiama with a massive swing of 24% towards the Coalition.

12:44am PST (6:44pm AEST): Labor at 3 seats, Coalition at 18. Coalition has picked up the seat of Lake Macquaire and Strathfield.

12:39am PST (6:39pm AEST): Labor at 3 seats won, Coalition 15. ABC News has projected Labor has lost the seat of Mulgoa (15.4% swing to the Liberals). Liberals are leading the Labor seat of Londonberry with a 9.0% swing to the Liberals. Election Analysis Anthony Green saying a massive swing against Labor is going on statewide.

12:34am PST (6:32pm AEST): Labor has won 3 seats so far. Coalition 6 seats. ABC News has lifted their Geo block on their video feed. So you can watch the election coverage on their site now.

12:09am PST (6:09pm AEST): NSW Electoral Commission will start posting its first results in 20 minutes. Catch you then. ABC NewsRadio is reporting that Deputy Premier Carmel Tebbutt who’s seat is threatened by Greens candidate Fiona Byrne is going to make some sort of address to her supporters within the hour.

12:00am PST (6:00pm AEST): Polls are now officially closed in New South Wales. Sky News exit polling shows a 21% swing against the Labor Party. It’s about 3% larger than most polls have predicted. If this is true, every single Labor seat is at play tonight.

ABC News elections page

NSW Electoral commission

SSP Daily Digest: 3/25

CA-Sen (PDF): The Field Poll also has approvals and re-elects for Dianne Feinstein. The former stands at 48-33 (more or less in line with her historical averages), while the latter comes in at 46-42 (somewhat below her scores at similar points prior to her previous re-election campaigns). One aside: Is it normal for the Field Poll to go into the field for a two-week period? The dates on this survey are Feb. 28-March 14.

FL-Sen: God, Mike Haridopolos really is such a joke. He’s now had to amend his financial disclosure forms a third time, because he somehow keeps forgetting to account for all the sources of his income. You have to be pretty rich and disconnected not to remember where you’re getting all your money from. So in other words, Haridopolos is a perfect GOP exemplar. (He claims he didn’t disclose the property in question because his mortgage payments exceed the rent he’s taking in… but ya know, he’s still getting checks in each month!)

NM-Sen: GOP Lt. Gov. John Sanchez tells Le Fixe that he is “very close” to getting into the Republican Senate primary and will decide “very soon.”

OH-Sen: Quinnipiac has some numbers out on Sherrod Brown. He has a 43-27 job approval (in January, it was 45-25); a 45-29 lead over Generic R (Jan: 45-33); and almost identical 45-30 re-elects (unchanged). President Obama gets 41-34 over Generic R, but just 45-46 re-elects.

Meanwhile, Dave Catanese caught up with Ken Blackwell, who says he’s intrigued by PPP’s recent smorgasbord poll of the Ohio GOP primary showing him “leading the way” with all of 21% and now plans to take a “serious look” at the race. Hey, thanks a lot, Tom Jensen! No, I really mean it! Ken Blackwell would be entertaining, and he’s also not exactly a very strong candidate. PPP should goad more also-rans into re-thinking their futures.

VA-Sen, VA-03: Dem Rep. Bobby Scott visited Larry Sabato’s class the other day and said he’s still thinking about running for Senate and will decide by July. Scott also called Obama’s actions in Libya “unconstitutional”… hrm. Anyhow, Blue Virginia also notes that Scott could potentially take advantage of an obscure state law which would allow him to run in two primaries at once, meaning he could, say, run against Tim Kaine in the Senate race but if he gets pounded, could hold on to his House seat.

MT-Gov: I wonder what the connection is here: very temporary former Florida Sen. George LeMieux is holding a fundraiser for businessman Neil Livingstone in DC next month. Livingstone is one of several Republicans seeking to replace outgoing Gov. Brian Schweitzer next year. I’m really curious to know why LeMieux is taking an interest in this race.

NH-Gov: I don’t know if Papa Sununu is merely running off his mouth, or if he actually knows something. But he seems to suggest that Dem Gov. John Lynch, already serving a highly unusual fourth two-year term, might seek a fifth next year. He also tosses out a few names for potential Republican challengers: 2010 nominee John Stephen, 2010 Senate primary loser Ovide Lamontagne, state Sen. (and ex-Rep.) Jeb Bradley, and ex-State Sen. Bruce Keogh.

WA-Gov: Seattle Magazine has a lengthy profile of King County Executive Dow Constantine, whose name you occasionally hear mentioned in the gubernatorial context despite most people’s assumptions that Rep. Jay Inslee has first right of refusal on the Dem nomination. The article mentions unnamed insiders who think that Constantine may a better choice than Inslee (whose district’s center of gravity is in Snohomish County) for beating AG and former King County Councilor Rob McKenna. McKenna-unlike any other possible Republican candidate-is capable of winning over suburban moderates in east King County, the only possible road for a Republican to win statewide. (The 49-year-old Constantine’s gubernatorial timeline might be more appropriately 2020… though he has three times as many constituents as Inslee, so he may have the leverage to cut to the front of the line.) Speaking of McKenna, he’s on Step 2 of his Quasi-Moderate Reboot following his attempted equivocation on HCR repeal: now he’s also distancing himself from the new GOP boogeyman Scott Walker, saying he’d never mess with collective bargaining rights.

CA-36: It’s looking like Gov. Jerry Brown’s hoped-for statewide special election on ballot proposals to extend certain tax measures may not happen in June after all, which means the race in the 36th could stand all alone-and face even lower turnout than might otherwise have been expected.

FL-26: We mentioned (thanks to Greg Giroux) Karen Diebel’s unusual FEC filing the other day-she says she plans to run in the non-existent “FL-26.” Now, says Dave Catanese, NRCC chair Pete Sessions was seen squiring Diebel around DC, taking her to a meeting of House Republicans, and raising some eyebrows in the process, seeing as she lost to now-Rep. Sandy Adams in the FL-24 GOP primary last year. Diebel must be hoping that a new Orlando-based district carves out some room for her.

MN-06: If god really loved us, Michele Bachmann would run for pretzeldent. And now she’s saying it just might happen!

Ohio Init.: Here’s what’s going to happen: the Republicans who are busy destroying themselves in Ohio will pass SB5, a bill designed to strip away collective bargaining rights from union members. Then unions and their supporters will get a referendum on SB5 placed on the ballot. If polls and history (see 1958) are any guide, SB5 will get overturned. Republicans, of course, don’t want that to happen, and at least some of them think they stand a better chance if the measure goes up for a vote this November, rather than next November. For that to happen, Gov. John Kasich needs to sign SB5 into law by April 6th. But the Republican Speaker of the House isn’t so sure 2011 will be better for the GOP than 2012, and I’m not sure I disagree with him.

Suffolk Co. Exec.: This sure is an unusual way to end a criminal investigation-and a political career. Steve Levy said he won’t seek re-election to his current post… and he’s turning over his $4 million warchest to the Suffolk Co. DA’s office, which had been probing him for campaign finance violations. Of course, Levy’s political suicide really began in earnest last year, when the one-time Democrat tried to change parties to run for the GOP nomination for governor… only to get dinged at the Republican convention. Quite the capper to an ignominious career best known for immigrant-bashing.

Wisconsin Recall: Democrats now say they have “over fifty percent of the number of petitions they need to recall eight Republican state senators, although they are not over the fifty percent threshold in every district.”

Meanwhile, the Randy Hopper mistress story keeps getting better. It now looks as though his paramour managed to avoid the formal recruitment process that normal people went through in order to land state jobs during the transition period after Gov. Scott Walker was elected. Despite that, she scored a gig, and a pay raise.

WI Sup. Ct.: The Capital Times has a detailed profile of the Wisconsin Supreme Court race, noting in particular the increased enthusiasm for getting rid of David Prosser in light of Scott Walker’s evildoing. Prosser, by the way, continues to blame his fellow women justices for the lack of civility on the court, now claiming that they’ve “ganged up” against him. Remember this, is the guy who screamed at the Chief Justice that she was a “bitch” and he’d “destroy” her.

Models: Nate Silver critiques Harry Enten’s house forecasting model that we mentioned here the other day, saying that Enten has too many variables and not enough data sets. Enten responds here.

WATN?: We mentioned the Idaho GOP’s move to a close primary system a little while back, but I’m linking this article because I was unaware that 2008 ID-01 Dem nominee Larry Grant is now the chair of the Idaho Democratic Party. Grant lost to the infamous Bill Sali in 2006 by a relatively tight 50-45 margin.

Redistricting Roundup:

Arkansas: One place where, seemingly against all odds, Dems control the redistricting trifecta is Arkansas. The only Democrat left in the House delegation is Blue Dog d-bag Mike Ross, and he’d apparently worked out a map with his colleagues in the legislature that would protect his 4th CD seat, but also continue to make the 1st and 2nd CDs (now held by Republicans) potentially competitive. But according to Blue Arkansas, at the last minute, Ross changed his mind and insisted on a plan which would shore up his own district at the expense of the other two. Blue AR says this was particularly galling, because, they say, Ross has been telegraphing his plans to run for governor in 2014. However, Ross didn’t get his way: a little tinkering was done, but not enough to materially change the original plan. Anyhow, I believe that the map in question can be viewed here.

Louisiana: I don’t think there’s much if anything new here, but Politico seems increasingly convinced that Rep. Jeff Landry is on the verge of getting screwed. This of course would not be a surprise, as the teabagging freshman is definitely the low man on the totem pole.

NY-26 Hochul Chat

Kathy Hochul visited Genesee County and gave a modest chat, apparently the first candidate to do so in a Batavia-based publication.

Being from this part of the state, I am pleased that she at least is not ignoring the GLOW region.  This could give her a good stead in that region because she is doing her best to sit down and learn it.

Some concerns that I have as a result of this article is that I do not know if she has ever visited GLOW before or not.  She will need to shore up the vote here is she plans to win.