Congressional races 2010: Alabama

Cross posted from daily Kos

I’m starting up this series again.  I’m going to try to do at least 2 rounds before the 2010 election.

It will be an update of the previous series, which makes it a lot easier, as some things haven’t changed.

Going alphabetically, we start with ALABAMA

Sources:

House vote in 2008 from WaPo

VoteView

Race Tracker

Obama vote by CD from Swing State

and my previous diaries.

Alabama has 7 CDs, 4 are Republican, 3 are Democratic

District: AL-01

Location : the southwest part of AL, bordering MS, FL, and the Gulf of Mexico.  It has a weird finger taken out of it, that is part of AL-07.

Representative Jo Bonner (R)

VoteView ranking 310/447  (1 = most liberal, 447 = most conservative)

First elected  2002

2008 margin Unopposed

2006 margin 68-32

2004 margin 63-37

Obama margin 2008 39-61

 Bush margin 2004 64-35

 Notes on opponents The 2006 opponent had no money; in 2004, though, Judy Belk spent $400K.

Current opponents No Democrat, but he has a primary opponent.

Demographics A low-income ($34K, rank = 345), rural (36%, rank = 100), conservative district

Assessment This is a longshot

District: AL-02

Location The southeast quarter of AL, bordering FL and GA, and including Montgomery

Representative Bobby Bright (D)

VoteView rating NA

First elected  2008

2008 margin 50-50; 1,700 votes of 485,000 cast

2006 margin NA

2004 margin 71-28

Obama margin 2008 39-61

 Bush margin 2004 67-33

 Notes on opponents NA

Current opponents  Jay Love (R), who was 2008 opp.

Demographics Similar to the 1st, but poorer (med income = $32K, rank = 378) and more rural (50%, rank = 48th). This was one of the highest percentages of Blacks of any Republican represented district (only 7 had more Blacks

Assessment This was open in 2008, as Terry Everitt retired.  

District: AL-03

Location Most of the eastern part of AL, bordering GA, including Talladega and Tuskegee

Representative Mike Rogers

VoteView rating 299/447  (1 = most liberal, 447 = most conservative)

First elected 2002

2008 margin 53-47

2006 margin 59-38

2004 margin 61-39

Obama margin 2008 43-56

 Bush margin 2004 58-41

 Notes on opponents

Current opponents Joshua Segall (site in development, clearly)

Demographics Like the 1st and 2nd, but even more so.  Median income is $31K (rank = 400); 32.2% Black (rank = 41st).  

Assessment This district is trending more and more D. Black turnout will be key; Rogers did 3 points better than McCain.

District:   AL-04

Location Northern AL, but south of AL-05, runs from MS to GA.

Representative Robert Aderholt (R)

VoteView rating 311/447  (1 = most liberal, 447 = most conservative)

First elected  1996

2008 margin 75-25 over Nicholas Sparks

2006 margin 70-30

2004 margin 75-25

Obama margin 2008 23-76

 Bush margin 2004 71-28

Current opponents Nicholas Sparks, the 2008 opponent

Demographics The second most rural district in the country (73.5%) (only KY-05 is more rural).

Assessment Another long shot

District: AL-05

Location The northernmost part of AL, running from MS to GA, and borders TN.  Includes Huntsville and Decautur

Representative Parker Griffith (D)

VoteView rating NA

First elected  2008

2008 margin 52-48

2006 margin NA

2004 margin NA

Obama margin 2008 38-61

 Bush margin 2004 60-39

Current opponents At least two Repubs running

Demographics Not quite as poor as other AL districts.

Assessment  The former rep, Cramer was one of the most conservative Dems in the House.  But there are only 13 districts that have Democratic representatives and are this Republican at the national level.  It’s great that we kept the seat in 2008, after he retired; it can’t be called safe, but if we won it when it was open ….

District: AL-06

Location More or less the middle of the state, but shaped like a V to allow AL-07 to include as many Blacks as possible

Representative Spencer Bacchus (R) May retire

VoteView rating 333/447  (1 = most liberal, 447 = most conservative)

First elected  1992

2008 margin Unopposed

2006 margin unopposed

2004 margin unopposed

Obama margin 2008 23-76

 Bush margin 2004 78-22

 Notes on opponents none

Current opponents  none

Demographics One of the most Republican district per Cook PVI, only UT-03 is more so, and only TX-11, TX-13 and TX-19 are equally so

Assessment If we have to skip a race, this is probably the one

District: AL-07

Location Mostly in western AL, bordering MS, this district has two ‘fingers’ to include more Blacks.

Representative Artur Davis Retiring to run for governor

VoteView rating NA

First elected  NA

2008 margin NA

2006 margin NA

2004 margin 75-25

Obama margin 2008 61-39

 Bush margin 2004 35-64

 Notes on opponents None close

Current opponents A whole lot of Democrats running; safe Democratic seat.

Demographics The majority Black district in AL, it’s got the 5th highest percentage of Blacks of any district in the USA (61.7%) (more so are IL-01, IL-02, LA-02 and MS-02) and the 5th lowest median income ($27K) (lower are CA-31, KY-05, NY-16 and WV-03)

Assessment With Davis retiring, maybe we can get a real progressive here.

Comparing ways of rating congresspeople

There are a variety of ways to rate congresspeople, and I will cover several, but I’ll spend most of my time on the method I think best.  It’s seriously geeky, but I give a nongeeky summary, and then I give links to the geeky parts.

Many organizations rank congresspeople.  In the Almanac of American Politics, they include ranks from mny.  Each of these organizations looks at votes on their particular issues, and sees how each congress person votes (for their position or against it).  I am not going to talk more about these individual organizations.  

I will discuss three ways of ranking or rating congresspeople, they are used by a) National Journal  b) Progressive Punch  and c) Keith Poole and his associates.  I think the last is the best.

National Journal ratings does the following for the House, and similar for the Senate:

House members are assigned separate scores for their roll-call votes on key economic, social and foreign-policy issues during 2008. The members are rated in each of the three issue categories on both liberal and conservative scales, with the scores on each scale given as percentiles. An economic score of 78 on the liberal scale, for example, means that the member was more liberal than 78 percent of his or her House colleagues on the key votes in that issue area during 2008. A blank in any cell in the table below means that the member missed more than half the rated votes in an issue area. Composite scores are an average of the six issue-based scores. Members with the same composite scores are tied in rank. (C) indicates a conservative score; (L) indicates a liberal score.

If you sort on “composite”, you’ll see one issue: There are a lot of ties.  The top 12 representatives are all tied.  In the senate there are fewer ties.  But how does Bernie Sanders rank as tied for 13th most liberal, and with almost the same rating as Clinton?

The details of how they rated the congresspeople are for subscribers only, but they do have this snippet:

A panel of National Journal editors and reporters initially compiled a list of 167 key congressional roll-call votes for 2008 — 79 votes for the Senate and 88 for the House — and classified them as relating to economic, …

So it seems like they averaged a bunch of votes.

Progressive Punch rates people on the percentage of correct votes, and it offers ranks based on all voeertes, crucial votes, and votes on particular issues.  It is kept up to date, which is a major plus.  This has some advantages and disadvantages.  According to their methods, the three most progressive senators are: Roland Burris, Kirsten Gillibrand, and Edward Kaufman.  Huh?  Well, all 3 have 100% ratings.  Even for Senators that have been in for a while, there are anomalies: Is Sherrod Brown really as liberal as Bernie Sanders?  One problem is revealed when we see that Ted Kennedy has a very low rating for 2009-10: They don’t deal properly with missed votes.  If we look at “Crucial Votes” for “lifetime” Jack Reed is rated as the most progressive senator among those who have been in the Senate for at least one full session.  

The way they came up with scores is summarized here. Briefly, they first identified a few “hardcore progressives” in the Senate and the House.  The ‘overall’ ratings are based on votes in which a majority of those progressives voted against a majority of the Republicans.  The problem here is that all votes are weighted equally, and this isn’t right (see below).  


The crucial votes are a subset of those, specifically:

The votes used to calculate the scores in the “Crucial Votes ’09-’10” column are a subset of the overall votes that qualify according to the Progressive Punch algorithm described above. They show the impact that even a small number of Democrats have when they defect from the progressive position. These are votes where EITHER progressives lost OR where the progressive victory was narrow and could have been changed by a small group of Democrats voting differently.

 This is better, but it’s not as good as more sophisticated methods.

Why not? Well, the good people at Progressive Punch recognize the problem: Not all votes are equal, even among those that are ideological.  Some are easy wins, some are lost by a lot.  But they dichotomize this into “crucial” and “noncrucial” when there is really a continuum.

The site is great for looking into past votes of congresspeople, and it’s great that they keep it up to date, but there is one better method.

That is the method used by the people at voteview.  The software and methods are the best, but it’s not the most user friendly site in the world.  They describe two methods of rating congresspeople: NOMINATE and Optical Classification.  Both are based on using every vote and attempting to place legislators in a way that maximizes the ability to predict how they will vote.  Both work really well: Optimal classification works a bit better, but takes more computer time; NOMINATE (if I understand it correctly) allows placement of issues as well as politicians.  With a single number for each congressperson, you can predict, with 95% accuracy, how they will vote on any bill.

One question is whether a single dimension (liberal to conservative) is enough to accurately classify people.  For most periods in American history, it is.  In the 1960s, a second dimension (racial attitudes) added a lot to the accuracy, but, right now, one dimension does very well.  You can see how OC works in one dimension.  It predicts 95% of the vote correctly.  Note that the things that look like fancy script L (or the old sign for pound) are supposed to be less than or equal to signs.

I am not going to duplicate the example in that link, but I’ll try to explain it a bit more (you might want to open it in another window).  The diamonds are legislators, the spades are ‘cutting points’ for nine votes, each with a different number of “ayes” and “nays”.  The Ace of Spades is a vote with only one “aye”, the two of spades has two “ayes” and so on.  Now, we attempt (first iteration) to place legislators correctly per the votes.  That gives the diagram listed after 2.  Then we re-order the cutpoints, as shown in step 3, and repeat the process.  

(end geekiness)

How do these methods compare?  I am not going to compare all the senators and reps, simply because I can’t figure out an easy way to copy the data into a spreadsheet.  But let’s take 5 well-known Senators from the 110th Senate:  Feingold, Schumer, Bayh, Specter and Coburn.

             OC rank                PP lifetime    NJ 2008 comp.      

Feingold -     most liberal           20th           37th

Schumer -      16th most liberal      16th            7th

Bayh  -        51st most liberal      45th           51st

Specter -      56th most liberal      59th           53rd

Coburn -       101st most liberal     71st           92nd


(there are 102 ranks in OC because of senators getting replaced …e.g. WY has Enzi, Barasso and Thomas).  I couldn’t find Progressive Punch for the 110th, so I gave lifetime ratings.

Which do you think is most accurate?

By what margin will Bob Shamansky win?

View Results

Loading ... Loading ...

Anomalous congressional districts, part 1: New pickup possible

Thanks to David here at Swing State Project, we now have data on how every congressional district voted for POTUS for the last several elections.  This is a treasure trove for geeks like me.  That list is here.

Today, I look at districts where a Republican is the representative, but Obama won, and Obama did markedly better than Kerry.  I call these “new pickup possibles”.  I give some details about each district, along with the rank of the current rep from 1 (most liberal) to 435 (most conservative) per nominate data.

In these districts, Obama got 50% or more,  Kerry less than 45%.  I put the barrier lower for Kerry because he did about 5 points worse than Obama in the average CD.

CA 24 CA 25 CA 26 CA 44 CA 45 CA 50

IL 16

MI 4

NE 2

VA 4  VA 10

WI 6

Look at all those CA districts!  

Going one by one

CA-24 is Ventura and Santa Barbara counties, except for a tiny strip along the coast.  Current rep. is Elton Gallegly, ranked 341; in last 3 elections he got 58% (2008), 62% and 63%.  Obama got 51%, Kerry and Gore each got 43%. It’s a wealthy district (median income $61,400) with almost a quarter of the population is Latino.

CA-25 is a weirdly boot-shaped district, with the leg part along the Nevada border and the toe in Santa Clarita, near LA.  Current rep is “Buck” McKeon, ranked 356; last 3: 53, 58, 64.  Obama got 50, Kerry 40, Gore 42.  Over 1/4 Latino.

CA-26 is a blob shaped district of suburbs of LA.  Current rep is David Dreier, ranked 366; last 3: 53, 57, 55.  Obama got 51, Kerry and Gore got 44 each.  It’s another wealthy district (median income $58,968) with about a quarter Latinos.

CA-44 is mostly Riverside county.  Current rep is Calvert, ranked 318; last 3: 52, 60, 62.  Obama got 50, Kerry 40, Gore 44. It’s just over half White, and just over 1/3 Latino.

CA-45  is exurbs of LA, the “inland empire”.  Current rep is Bono, ranked 291; last 3: 57, 61, 67.  Obama got 52, Kerry 43, Gore 47.  This district has some very wealthy places (e.g. Palm Springs), but the median income is only $40,468, and 15% are in poverty; it’s also 38% Latino (41st most in the USA).

CA-50  is San Diego and some suburbs. Current rep is Bilbray, ranked 371; last 3: 50, 53, 54.  Obama got 51, Kerry 44, Gore 43.  Median income is almost $60,000, about 10% Asian and 19% Latino.

IL-16  is the northwest corner of IL.  Current rep is Manzullo, ranked 345; last 3: 61, 64, 69.  Obama got 51, Kerry 44, Gore 43. IL-16 is not distinctive, demographically.  

MI-04  is farmland in the center of MI.  Current rep is Camp, ranked 327; last 3: 62, 61, 64.  Obama got 50, Kerry and Gore 44 each.  This is the 20th least urban district in the USA, and the 46th “whitest” (93% White).  

NE-02  is Omaha and its western suburbs.  Current rep is Terry, ranked 373; last 2 elections: 52 and 56 (elected 2006).  Obama got 50, Kerry 38, Gore 39. Only 4 districts had bigger swings to Obama from Kerry (HI-01 and 02, IN-04 and 07).  NE-02 is not distinctive, demographically.  

VA-04 is Tidewater country.  Current rep is Forbes, ranked 339; last 3: 60, 76, 64 (no Dem in 2006).  Obama got 50, Kerry 43, Gore 44.  VA-04 has the 48th most Blacks (33%), the 5th most Blacks of any district with a Republican rep. (the other 3 are all in Lousiana (02, 04, 05, and 06).

VA-10 is northern VA, including the Beltway.  Current rep is Wolf, ranked 266; last 3: 59, 57, 54.  Obama got 53, Kerry 44, Gore 41.    VA-10 is the 10th wealthiest district (median income = $71,560).

WI-06 is central WI.  Current rep is Petri, ranked 390; last 3: 64, 56, 53 (the only district in this list where the rep is increasing his lead).  Obama got 50, Kerry 43, Gore 42. Per the Almanac of American Politics, it has the highest percentage of German-Americans.  It’s also the 22nd ‘Whitest’ (94%), 94th most rural, 30th least Black, and 38th fewest in poverty (although median income is only about $44,000).  

Where conservative Democratic reps come from

Thanks to David here at Swing State Project, we now have data on how every congressional district voted for POTUS for the last several elections.  This is a treasure trove for geeks like me.  That list is here.

Today, I look at districts with conservative Democrats as representatives

Perhaps the best way to rate the liberalness of a representative is that taken by Jeff Lewis, Keith Poole, and their associates in the nominate data.  They rank the House, from 1 to 435.  I’ve provided the list of districts, and their ranks (1 is most liberal, 435 most conservative).

The most conservative Democrat is ranked 241.  Here are the 42 most conservative Democrats (from least to most conservative), with the election results for POTUS :


Dist    Rep          Obama %  Kerry %    Gore %

TX 17   EDWARDS       32        30       32

CA 18   CARDOZA       59        49       53

CA 20   COSTA         60        51       55

FL 22   KLEIN         52        52       52  

CO 7    PERLMUTTER    59        51       50

FL 2    BOYD          45        46       47

OH 6    WILSON        48        49       47

CO 3    SALAZAR       47        44       39

MO 4    SKELTON       38        35       40

TN 6    GORDON        37        40       49

AL 5    CRAMER (now Griffith - D)

                     38        39       44        

KY 6    CHANDLER      43        41       42

KS 2    BOYDA      (now Republican)

AR 4    ROSS          39        49       49

MN 7    PETERSON      47        43       40

SD AL   HERSETH       45        38       38

TX 28   CUELLAR       56        46       50

OH 18   SPACE         45        43       41

LA  3   MELANCON      37        41       45

MS  4   TAYLOR        32        31       33

TN  8   TANNER        43        47       51

TN  4   DAVIS         34        41       49

FL 16   MAHONEY       (now Republican)

NC  7   MCINTYRE      47        44       48

NY 20   GILLIBRAND    (to be decided)

                     51        46       44

OK  2   BOREN         34        41       47

IL  8   BEAN          56        44       42

UT  2   MATHESON      39        31       31

IL 14   FOSTER        55        44       43

IN  9   HILL          49        40       42

AZ  5  MITCHELL       47        45       43

AZ  8  GIFFORDS       46        46       46

NC 11  SHULER         47        43       40

IN  8  ELLSWORTH      47        38       42

PA 10  CARNEY         45        40       41

IN  2  DONNELLY       54        43       45

PA  4  ALTMIRE        44        45       46

GA  8  MARSHALL       43        39       42

GA 12  BARROW         54        49       52

MS  1  CHILDERS       38        37       40

LA  6  CAZAYOUX       (now Republican)

TX 22  LAMPSON        (now Republican)

Personally, I am on the left edge of the Democratic party.  I very much like my representative, Jerry Nadler, who, per Nominate data, is the 50th most liberal (I’d have to look to find where he differs from the top few); I also like that NY-08 gave over 70% to all three Democratic POTUS candidates.  But not every district is like mine.

More Democrats; better Democrats.   Not better Democrats, fewer Democrats.  Only a few of the above seem to be in districts that could remotely be called ‘safe’.  Many are in Republican strongholds.  Would you rather have Cazayoux or Cassidy?  Mahoney or Rooney?  And those two didn’t even face primaries.  

If we want to replace blue dogs with red Repubs, we can primary them and put up liberals.  If we want to replace blue dogs with better Democrats, we need to educate the people.  

Are there people to primary?  Yes.  Of this list, I’d say Cardoza, Klein, Costa and Perlmuter are candidates.  Barrow, in GA-12, might be also, but not by a liberal, just by someone more in the middle of the Democratic party.  

Key Senate races — update, with prediction

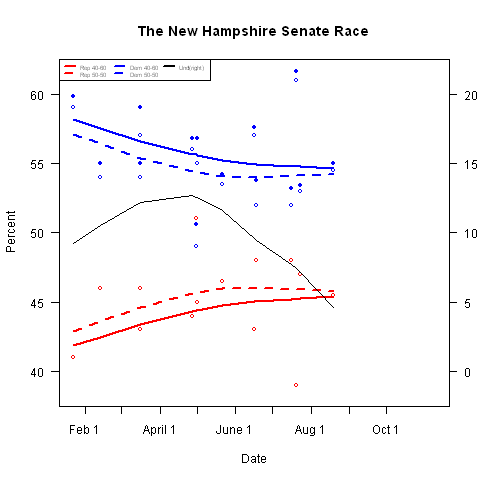
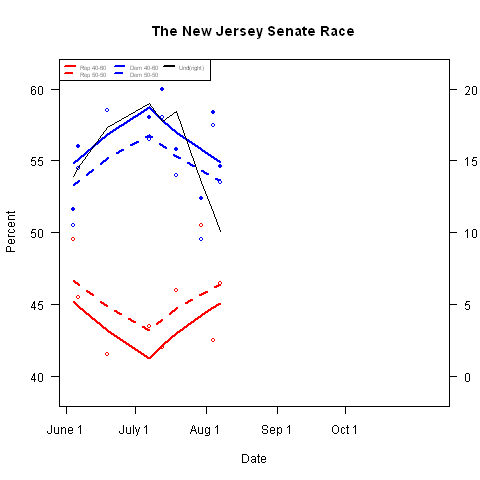
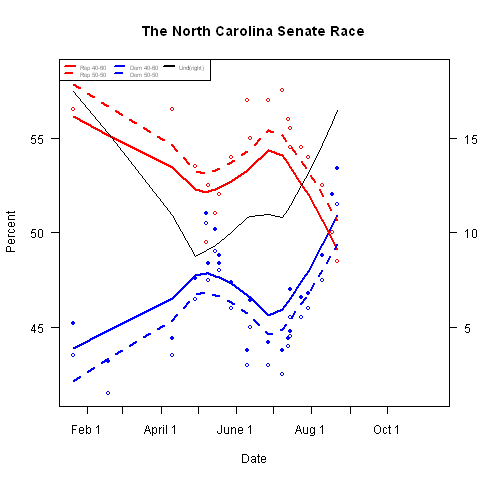
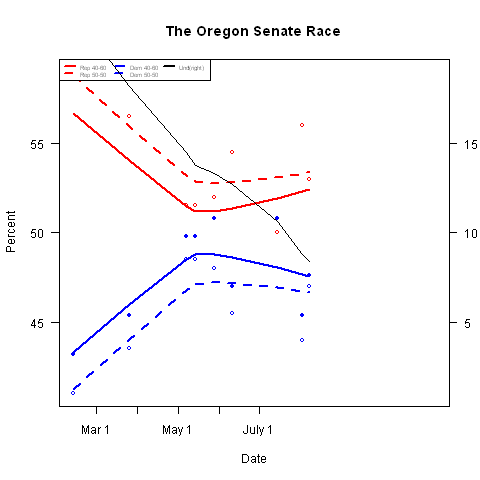
Two years ago I published a bunch of diaries on Senate races, with elaborate graphs.  

They’re BAAAAACK!

Method:

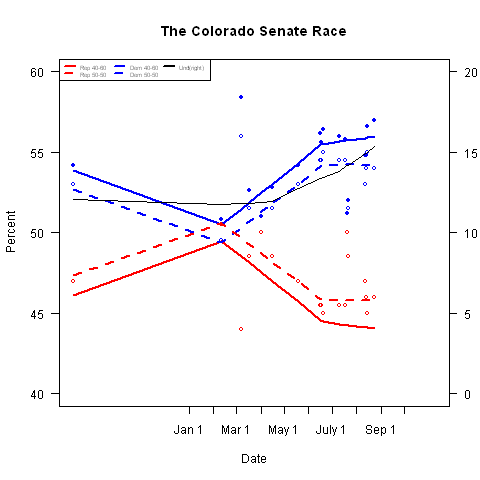
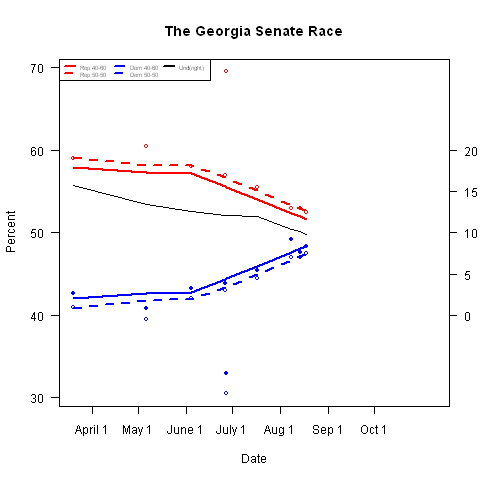
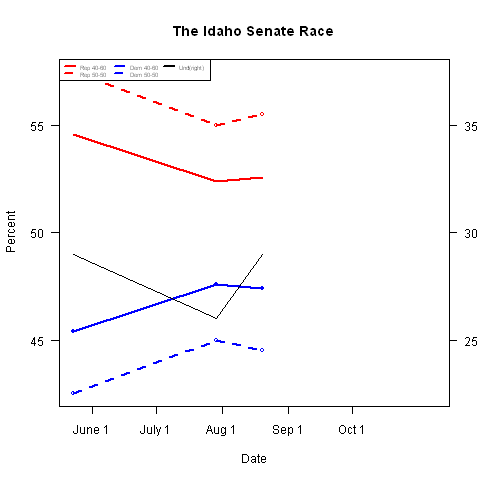
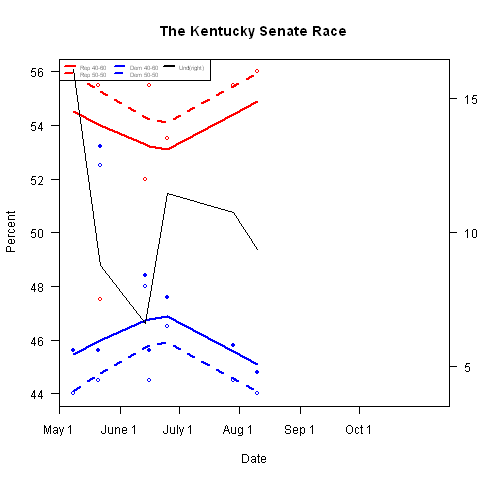
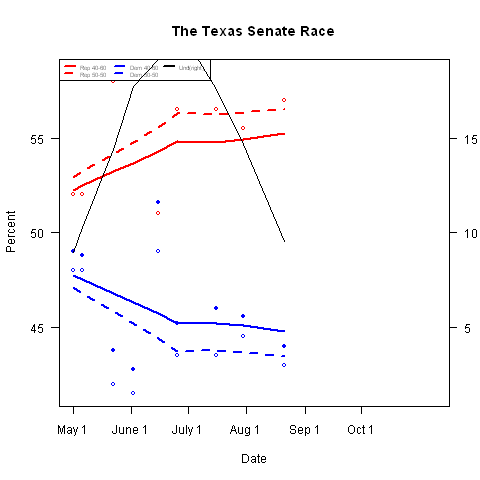
 1.  I gathered polling data from Pollster.com and from brownsox‘s summaries.  I only included polls in 2008.

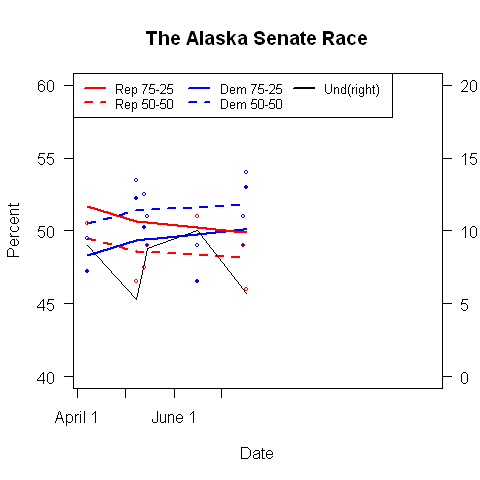
 2.  I assigned the undecided in two ways: 60% to the challenger (per general practice) and 50-50.  The first method is represented by solid boxes.  The latter method by hollow dots.  

 3.  I then added loess lines to all 4 series of boxes: Solid lines for the solid boxes, dotted lines for the hollow dots.  Good descriptions of loess (aka local regression) are here  (technical notes on local regression)

Some notes:

 1.   For any poll and for either method, the percentages add to 100.  

 2.  If the hollow box is far from the solid box, then there are a lot of undecideds.

pollster.com has its own charts, and there’s nothing wrong with them.  I like mine better.  First, they have more information. I show different outcomes with different divisions of the undecided.  Second, I like my smooths better.  Third, I assign the undecideds, making things a little less choppy.  

there are  races, below the fold

There are now 15 states where the Senate race is judged by 538 to not be “safe”. :

Nate Silver (aka poblano) rates these as

Safe Dem takeover: VA, NM

Likely Dem: AK, NH, NJ

Lean Dem: CO

Tilt Dem: none

Tilt Repub: none

Lean GOP: MSB, OR, MN, NC

Likely GOP: ID, TX, ME, KY, GA

Note that 14 of these (all but NJ) are currently Republican held

Since I have little interest in figuring out whether, e.g. John Kerry wins by 30 points or 40 points, I confine my analysis to these 15.

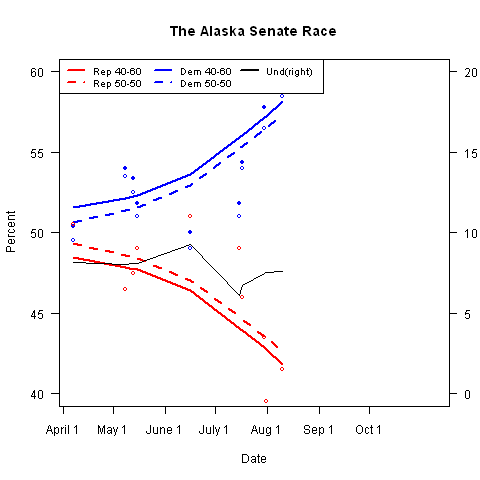
Alaska

Nothing new since last time.  This is pretty close to ‘safe’, unless somehow Stevens wins the primary (very likely), goes to trial (somewhat likely), and gets acquitted before the election (not too likely)

Colorado


Udall continues to gain on Schafer.  Also looking very good.

Georgia

poblano now lists this one as “likely GOP”:


Martin is gaining, fast.  No new polls since last time.

Idaho


Still not many polls — it doesn’t look very promising, but you never know; lots of undecided voters (note that I had to change the scale!)

Kentucky

No new polls since last time. McConnell (R) is expanding his lead over Lunsford.  This is starting to look very difficult

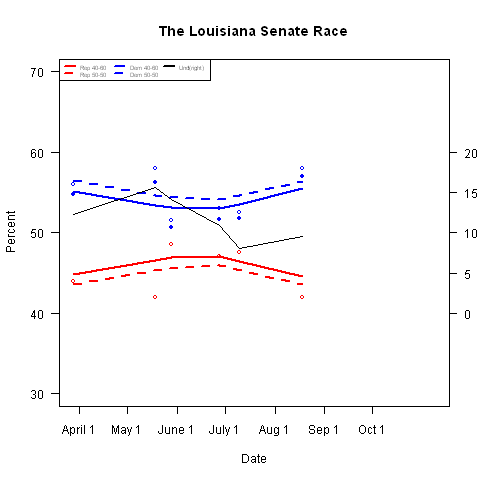
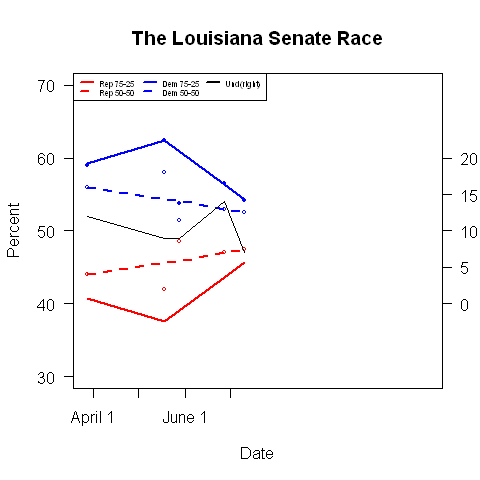
Louisiana (note that 538 now has this as “safe Dem”)

No new polls since last time, this is now looking safer than a few weeks ago

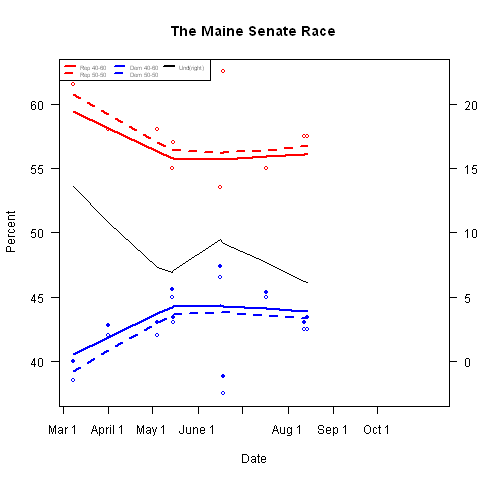
Maine

Also nothing new since last time.  Allen (D) has stopped making up ground against Collins (R).  Still, he isn’t losing any ground, and the lead is only about 10 points.

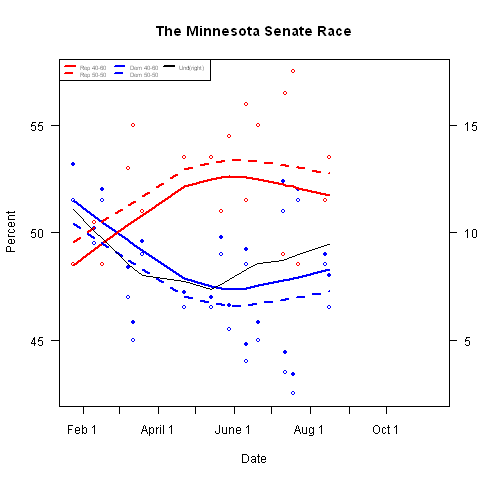
Minnesota

Another with no new polls. Franken (D) appears to have stopped the decline and is now making up ground against Coleman (R).  This is looking more competitive.

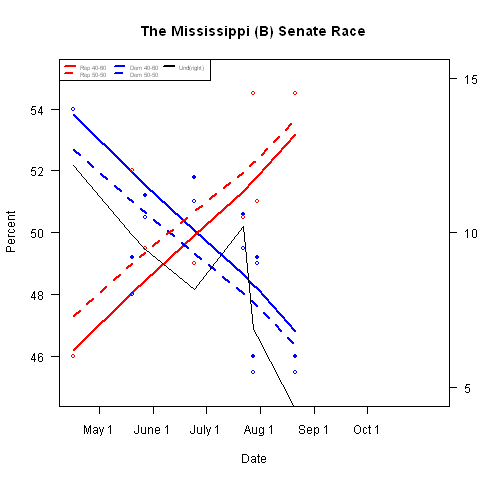
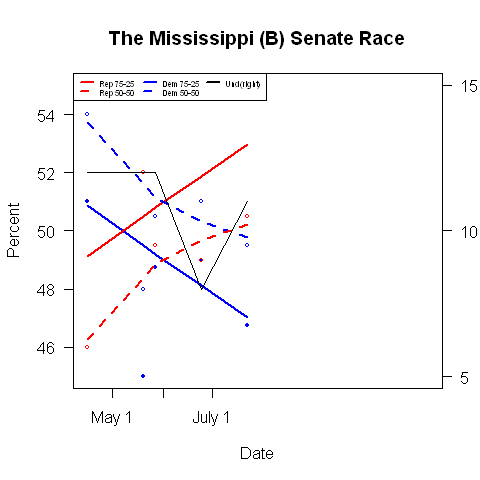
Mississippi

The new polls here are bad for our side…. MS was always a bit of a longshot.

New Hampshire

Shaheen (D) has a fairly steady lead over Sununu (R), and new polls confirm it.  Probably our fourth most likely pickup (after VA, NM and AK) or maybe fifth (CO)

New Jersey

This looks pretty safe, to me.

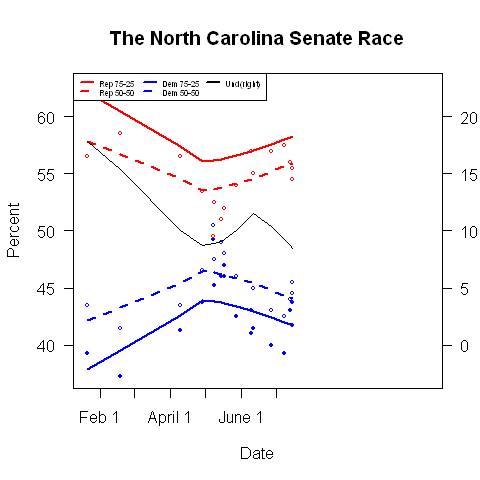
North Carolina


Hagan (D) continues gaining ground on Dole (R), and is now slightly ahead!.

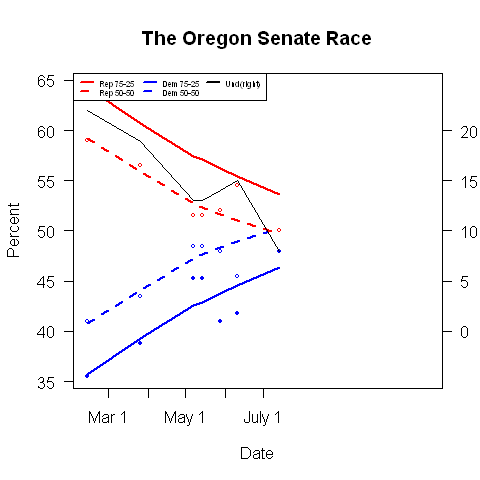
Oregon

No new polls. After showing steady gains in the early part of the year, Merkley (D) has stopped gaining. But it’s close, and November is still a ways off.  

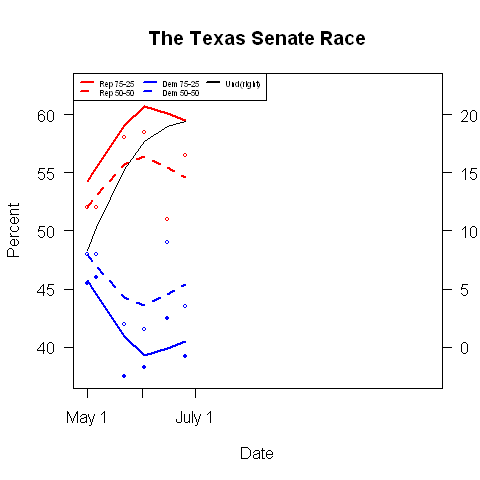
Texas

Cornyn has a considerable lead over Noriega… and nothing is changed in the newest poll

Predictions:


Gaining exactly          Chance

2                         0.04%

3                         0.71%

4                         5.14%

5                        17.88%

6                        31.02%

7                        25.95%

8                        13.90%

9                         4.24%

10                        0.92%

11                        0.19%

12                        0.01%

Tracking the Senate races

Two years ago I published a bunch of diaries on Senate races, with elaborate graphs.  

They’re BAAAAACK!

Method:

 1.  I gathered polling data from Pollster.com.  I only included polls in 2008.

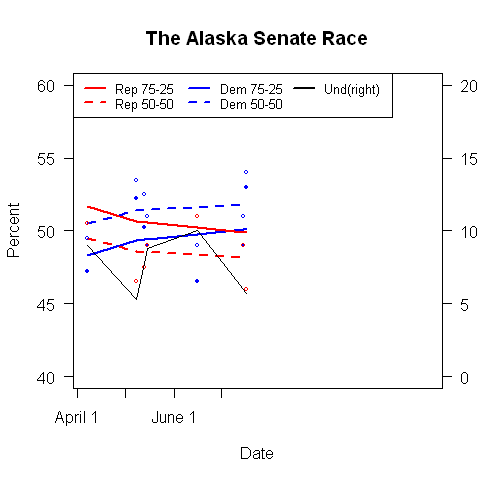
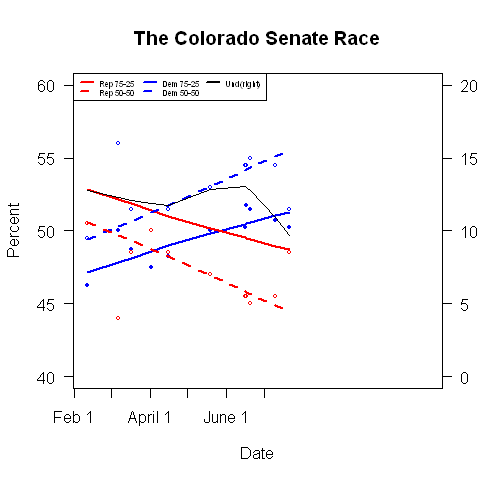
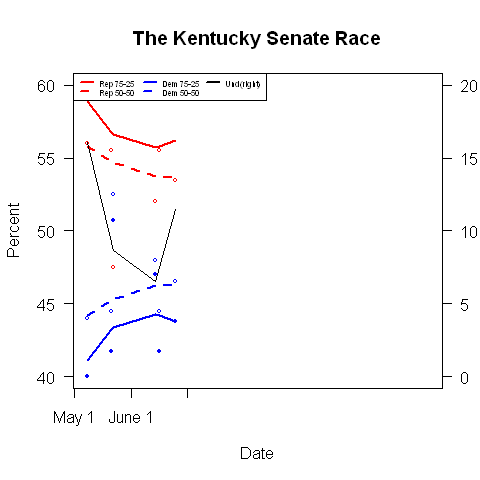
 2.  I assigned the undecided in two ways: 75% to the challenger (per general practice) and 50-50.  The first method is represented by solid boxes.  The latter method by hollow dots.

 3.  I then added loess lines to all 4 series of boxes: Solid lines for the solid boxes, dotted lines for the hollow dots.  Good descriptions of loess (aka local regression) are here  (technical notes on local regression)

Some notes:

 1.   For any poll and for either method, the percentages add to 100.  

 2.  If the hollow box is far from the solid box, then there are a lot of undecideds.

pollster.com has its own charts, and there’s nothing wrong with them.  I like mine better.  First, they have more information. I show different outcomes with different divisions of the undecided.  Second, I like my smooths better.  Third, I assign the undecideds, making things a little less choppy.  

there are  races, below the fold

There are 13 states where the Senate race is judged by 538 to not be “safe” for the incumbent party:

Nate Silver (aka poblano) rates these as

Likely Dem: CO, LA, NH

Lean Dem: None

Tilt Dem: AK

Tilt Repub: MSB

Lean GOP: OR, KY, MN

Likely GOP: TX, ME, NC, OK, ID.

Note that 12 of these (all but LA) are currently Republican held; Idaho did not have enough poll results to track

Since I have little interest in figuring out whether, e.g. John Kerry wins by 30 points or 40 points, I confine my analysis to these 13.

Alaska

If the undecideds break for the incumbent (which seems unlikely, here), the race is even.  If undecideds break evenly, then Begich is up by about 5 points.

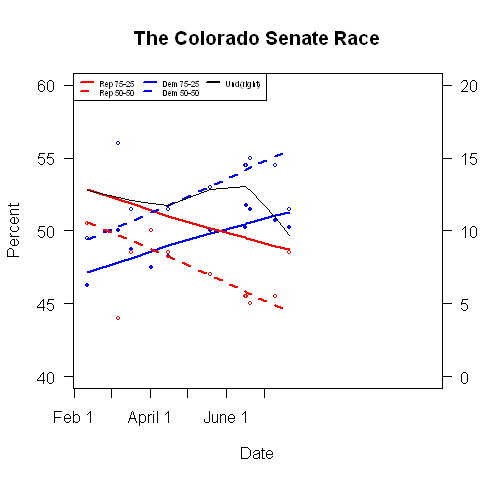
Colorado

A steady trend towards Udall, who is now ahead, even if the undecideds vote mostly for the incumbent.  If they break evenly, then Udall is up by 10 points, and his lead is growing

Kentucky

Although the incumbent (Mitch McConnell R) is still ahead, Lunsford is closing the gap.  The increase in undecideds is encouraging — that has to favor a challenger, I think

Louisiana

A worrisome race, in which Landrieu (D) seems unable to gain a solid lead.  

Maine

Allen (D) was doing better earlier in the year; recent polls have been all over the place.  Why Collins (R) remains popular in Maine is hard to figure.

Mississippi (B)

I don’t think a lot of people expected this to be close, but it is. Don’t put too much stock in the lines — there are very few polls.

North Carolina

Relatively little movement, here, and most of that was in the first part of the year.  

Oregon

Here, on the other hand, there is dramatic movement.  If you compare the change in undecided to the proportions endorsing each candidate, it appears that Merkly (D) is winning nearly every person who has made up his or her mind in 2008.  

Texas

Another race where few expected the Republican to be in any danger; lines also based on few polls

Key Senate races 2008: Intro, Alaska, Colorado

Two years ago on daily Kos, I published a bunch of diaries on Senate races, with elaborate graphs.  

They’re BAAAAACK, and this time, I’m cross posting them here!

Method:

 1.  I gathered polling data from Pollster.com.  I only included polls in 2008.

 2.  I assigned the undecided in two ways: 75% to the challenger (per general practice) and 50-50.  The first method is represented by solid boxes.  The latter method by hollow dots.

 3.  I then added loess lines to all 4 series of boxes: Solid lines for the solid boxes, dotted lines for the hollow dots.  Good descriptions of loess (aka local regression) are here  (technical notes on local regression)

Now, pollster.com has its own charts, and there’s nothing wrong with them.  I like mine better.  First, they have more information. I show different outcomes with different divisions of the undecided.  Second, I like my smooths better.  Third, I assign the undecideds, making things a little less choppy.  

On to the first two races:

Alaska:

If we assume that the undecideds break evenly (dotted lines) then Begich is up by about 5.  If we assume they favor the incumbent (seems unlikely in Alaska) then Stevens and Begich are tied.

Colorado:

If we assume that the undecideds break evenly (dotted lines) then Udall is up by about 11; if we assume they break in favor of the Republicans (as incumbents) then Udall is up by about 5

Some notes:

 1.   For any poll and for either method, the percentages add to 100.  

 2.  If the hollow box is far from the solid box, then there are a lot of undecideds.

By what margin will Bob Shamansky win?

View Results

Loading ... Loading ...

Congressional races that were close in 2006

There are 435 seats in the House.  

Some are near locks for one party or the other.  Some are close.  No race is a sure thing (50 state strategy) but the races that were close in 2006 are clearly the ones that are most likely to switch in 2008.  One reason they might switch is fundraising.  So, below the fold, I look at districts that were within 10 points in 2006

Financing info is from the FEC

Polling info is from Election Inspection

The DCCC list is here

SSP ratings are   here

District AZ-01

Incumbent Renzi (R)

2006 opponent Ellen Simon

Margin and notes 52-43, remainder to a Libertarian.

Current situation

     Renzi is retiring.

     Allan Affeldt (D)     no recent info

     Ann Kirkpatrick (D)  $660K raised, $465K COH

     Jeff Riley (D)       $220K raised, $216K COH, $205K debt

     Howard Shanker (D)   $137K raised, $34K COH,  $9K debt

     Ellen Simon (D)      $13K raised,  $0  COH, $252K debt

     Mary Kim Titla (D)   $169K raised, $49K COH

     Sydney Hay  (R)      $268K raised, $222K COH, $70K debt

     Preston Korn (R)     $19K  raised, $10K COH, $3K debt

Assessment AZ-01 went 54-45 for Bush, but it’s still possible.

   SSP rating: Tossup

   On the DCCC list

District AZ-05

Incumbent Harry Mitchell (D)

2006 opponent JD Hayworth

Margin and notes 50-46. Mitchell had a million less to work with, and Hayworth was the incumbent.

Current situation  

        Mitchell (D): $1.3 millon raised, $1.1 million COH

        Schweikert (R): $681K raised, $514K COH, $250K debt

        Ogsbury (R):    $427K raised, $353K COH, $250K debt

        Knaperek (R):   $100K raised, $44K COH

        Anderson (R):   $55K raised,  $70K COH

Assessment

        SSP rating: Leans D

        On the DCCC list

District CA-04

Incumbent John Doolittle (R)

2006 opponent Charlie Brown

Margin and notes 49-46; Doolittle raised $2.4 million, Brown $1.6

Current situation

    Doolittle’s done, he’s  and Brown is running again.

    Charlie Brown (D) $950 K raised, $590K COH, $26K debt

    John Wolfgram (D) no funding info

    Eric Egland (R)  $193K raised,   $49K COH

    John Holmes (R)  $26K raised,  $0 COH

    Tom McClintock(R) $316K raised, $126K COH

    Doug Ose (R)     $2.4 million raised, $801K COH, $1.0 million debt

Assessment  This is a rare case where it would have been easier to run against an incumbent….but still, it bears watching.  

     SSP rating: Lean R

     On the DCCC list

District CA-11

Incumbent Jerry McNerney (D)

2006 opponent Richard Pombo

Margin and notes 53-47, even though McNerney was  outspent by $2 million.

Current situation

    Jerry McNerney (D): $1.6 million raised, $1.1 million COH, $48K debt

    Dean Andal (R):   $638K raised, $531K COH, $25K debt    

Assessment  Bush took CA-11 by 54-45 in 2004, it’s an R+3 district.   But McNerney has a fundraising lead and name recognition

     SSP rating: Lean D

    On the DCCC list

District CO-04

Incumbent  Marilyn Musgrave (R)

2006 opponent Angie Paccione

Margin and notes 46-43, Musgrave spent over $1 million more and was the incumbent.

Current situation  

   Betsy  Markey (D)      $594K raised, $376K COH, $25K debt

   Marilyn Musgrave (R)   $1.4 million raised, 1.0 million COH, $16K debt

Assessment

      SSP rating: Lean R

      On the DCCC list

District CT-02

Incumbent  Joe Courtney (D)

2006 opponent Rob Simmons

Margin and notes 73 votes out of 242,000. Courtney got $2.4 million to Simmons $3.2. Simmons was the incumbent

Current situation

 Joe Courtney (D)  $1.5 million raised, $1.2 million COH

 Sean Sullivan (R) $230K raised, $121K COH

Assessment

   SSP rating: Likely D

   On the DCCC list

District CT-04

Incumbent Christopher Shays (R)

2006 opponent  Diane Farrell

Margin and notes 51-48. Shays raised $3.8 million, Farrell just under $3 million. Shays was the incumbent

Current situation    

  Jim Himes (D)    $1.4 million raised, $1.1 million COH

  Chris Shays (R)  $1.6 million raised, $1.1 million COH

Assessment To be equal in fundraising to the incumbent is impressive.

    SSP rating:  Lean R

    On the DCCC list

District FL-08

Incumbent Ric Keller (R)

2006 opponent  Charlie Stuart

Margin and notes  53-46.  Keller was the incumbent and raised $1.7 million.  Stuart raised $1 million

Current situation

  Alexander Fry (D) $19K raised, $15K COH

  Alan Grayson (D)  $142K raised, -$4K COH, $75K debt

  Corbett Krohler (D) $59K raised, $0 COH, $54K debt

  Mike Smith (D)     $443K raised, $296K COH

  Charles Stuart (D) $415K raised, $316K COH, $101K debt

  Quoc Va Banh (D) $3K raised, $0 COH

  Bob Hering (R) $69K raised, $53K COH, $20K debt

  Ric Keller (R) $742K raised, $735K COH

  Todd Long (R)  $192K raised, $17K COH

Assessment

  SSP rating: Likely R

   On the DCCC list

District FL-13

Incumbent Vern Buchanan (R)

2006 opponent  Christine Jennings

Margin and notes 369 votes out of 237,000; Jennings raised $3 million, but Buchanan had $8 million. This was the most expensive race in the country. Katharine Harris’ old district

Current situation

    Christine Jennings (D) $1.1 million, $483K COH

    Vern Buchanan (R) $2.3 million raised, $1.1 million COH

Assessment

 Polls: Early March – Buchanan 53, Jennings 37SSP rating:

 SSP rating: Likely R

 On the DCCC list

District FL-16

Incumbent Tim Mahoney (D)

2006 opponent  Joe Negron

Margin and notes 50-48; this was Mark Foley’s seart.  Mahoney raised $2.8 million and Negron $800K

Current situation

    Tim Mahoney (D)     $2.1 million raised, $1.0 million COH

    Gayle Harrell (R)   $546K raised, $256K COH, $25K debt

    Thomas Rooney (R)   $691K raised, $421K COH, $25K debt  

    Rob Siedlecki (R)  no funding info

    Hal Valeche (R)    no funding info

Assessment

   SSP rating:  Lean D

   On the DCCC list

District FL-22

Incumbent Ron Klein (D)

2006 opponent  Clay Shaw

Margin and notes 51-47; Shaw, who was the incumbent, raised $5 million; Klein raised $4 million

Current situation

  Ron Klein (D)  $2.2 million raised, $2.1 million COH, $18K debt

  Marc Flagg (R) $64K raised, $0 COH

  Clay Shaw (R)  $62K raised, $11K COH

  Allen West (R) $101K raised, $57K COH

Assessment

  SSP rating: Not rated (very likely D)

   On the DCCC list

District GA-08

Incumbent Jim Marshall (D)

2006 opponent  Mac Collins

Margin and notes 51-49; Marshall, the incumbent, held off Collins. Each raised about $2 million

Current situation

   Jim Marshall (D)  $1.0 million raised, $1.2 million COH, $7.5K debt

   Robert Nowak (D) $10K raised, $1K COH

   Rick Goddard (R) $577K raised, $404K COH

Assessment

     SSP rating: Leans D

     On the DCCC list

District GA-12

Incumbent John Barrow (D)

2006 opponent Max Burns

Margin and notes 864 votes of 140,000, Barrow, who was the incumbent, held off Max Burns, who used to hold this seat. Each had a little over $2 million.

Current situation  

 John Barrow (D)      $1.4 million raised, $1.3 million COH, $65K debt

 Rodney Edenfield (R) $14K raised, $0 COH

 Raymond McKinney (R) $35K raised, $10K COH, $17K debt

 John Stone (R)       $61K raised, $43K COH

Assessment

   SSP rating: Likely D

   On the DCCC list

District ID-01

Incumbent Bill Sali (R)

2006 opponent  Larry Grant

Margin and notes 50-45, Sali raised $1 million, Grant about $750K

Current situation  

    Walter Minnick (D) $629K raised, $321K COH

    Bill Sali (R)      $405K raised, $124K COH, $145K debt

    Matt Salisbury (R) $41K raised, $5K debt

Assessment ID-01 is about as Republican as districts get – Cook PVI of R + 19.  But Sali is crazy. Larry Grant withdrew and endorsed Minnick.  

    SSP rating: Likely R

    On the DCCC list

District IL-06

Incumbent Peter Roskam (R)

2006 opponent  Tammy Duckworth

Margin and notes 51-49.  This is Henry Hyde’s old seat, it was open in 2006, and Duckworth raised more than Roskam ($4.5 million to $3.5 million)

Current situation

  Jill Morgenthaler (D)      $307K raised, $161K COH, $10K debt

  Peter Roskam (R)           $1.4 million raised, $967K COH

Assessment

 SSP rating:  Likely R

 On the DCCC list

District IL-08

Incumbent Melissa Bean (D)

2006 opponent  David McSweeney

Margin and notes 51-44.  Bean, the incumbent, held off David McSweeney, although he raised $5.1 million to her $4.3 million, and this is a R+5 district.

Current situation

  Melissa Bean (D)     $2.2 million raised, $1.4 million COH, $17K debt

  Randi Scheuer (D)    no funding info

  Steve Greenberg (R)  $522K raised, $5K COH, $153K debt

Assessment

    SSP rating: Likely D

   On the DCCC list

District IL-10

Incumbent Mark Kirk (R)

2006 opponent Dan Seals

Margin and notes 53-47. Kirk, the incumbent, raised $3.5 million to Seals’ $1.8 million.

Current situation

  Dan Seals (D) $1.47 million raised, $745K COH

  Mark Kirk (R) $2.95 million raised, $2.92 million COH

Assessment

 Polls: Early Feb.  Kirk 46 Seals 39

 SSP rating: Lean R  

   On the DCCC list

District IN-02

Incumbent Joe Donnelly (D)

2006 opponent  Chris Chocola

Margin and notes 54-46. Donnelly ousted Chocola, though he had less than half as much money (1.5 million to 3.4 million)

Current situation

 Joe Donnelly (D)    $1.1 million raised, $713K COH, $49K debt

 Luke Puckett (R)    $5K raised, $0 COH

 Joseph Roush (R)    no funding info

 Anthony Zirkle (R)  no funding info

Assessment

   SSP rating: Likely D

   On the DCCC list

District IN-03

Incumbent Mark Souder (R)

2006 opponent  Thomas Hayhurst

Margin and notes 54-46. Souder, the incumbent, and Hayhurst each raised about $700K

Current situation

   Michael Montagno (D) $205K raised, $181K COH

   Mark Souder  (R)     $315K raised, $211K COH

Assessment For an incumbent in a close race, Souder’s fundraising is pretty anemic.

  SSP rating: Not rated    

District IN-09

Incumbent Baron Hill (D)

2006 opponent  Mike Sodrel

Margin and notes 50-45.  Hill ousted Sodrel, despite raising less ($1.9 million to $2.7 million)

Current situation

 Baron Hill (D) $1.1 million raised, $862K COH, $49K debt

 Mike Sodrel (R) $201K raised, $166K COH, $1.2 million (!) in debt

Assessment

   SSP rating:  Lean D  

   On the DCCC list

District IA-02

Incumbent Dave Loebsack (D)

2006 opponent  Jim Leach

Margin and notes 51-49; Loebsack ousted Leach; each raised about $500K

Current situation

 Dave Loebsack (D)          $561K raised, $425K COH

 Lee Harder (R)             $9K raised, $5K COH, $1K debt

 Marianette Miller-Meeks (R) $68K raised, $68K COH      

 Peter Teahen (R)           $66K raised, $34K COH, $32K debt

Assessment

   SSP rating: Not rated (very likely D)

District IA-03

Incumbent Leonard Boswell (D)

2006 opponent  Jeff Lamberti

Margin and notes  52-46. Boswell, the incumbent, and Lamberti each raised about $2 million

Current situation

 Leonard Boswell (D)  $983K raised, $841K COH

 Ed Fallon (D)        $172K raised, $20K COH, $17K debt

 Kim Schmett (R)      $70 (no K!) raised, $70 COH, $700 debt.  

Assessment $70? Is that a joke?

  SSP rating: Not rated (very likely D)

   On the DCCC list

District KS-02

Incumbent Nancy Boyda (D)

2006 opponent  Jim Ryun

Margin and notes 51-47.  Boyda ousted Ryun, raising $700K to his $1 million. In 2004, Boyda lost to Ryun, 56-41.

Current situation

   Nancy Boyda (D)   $993K raised, $811K COH, $287K debt

   Lynn Jenkins (R)  $682K raised, $426K COH, $101K debt

   Jim Ryun (R)      $1.2 million, $489K COH    

Assessment

  SSP rating:  Lean  D

   On the DCCC list

District KY-03

Incumbent John Yarmuth (D)

2006 opponent  Anne Northrup

Margin and notes 51-48. Yarmuth ousted Northrup, he raised about $2.2 million to her $3.4 million.

Current situation

 John Yarmuth (D)    $1.0 million raised, $811 COH

 Bob DeVore (R)      no funding info

 Corley Everett (R)  no funding info

 Anne Northrup (R)   $494K raised, $428K COH

Assessment

   SSP rating:  Lean D

   On the DCCC list

District KY-04

Incumbent Geoff Davis (R)

2006 opponent Ken Lucas

Margin and notes 52-43. Davis, the incumbent, raised $4.2 million to hold off Ken Lucas, who raised $1.5 million

Current situation

  Michael Kelley (D)    $7 K raised, $3K COH, $3K debt

  Geoff Davis (R)       $1.4 million raised, $720K COH, $85K debt

  G. E. Puckett (R)     no funding info

  Warren Stone (R)      no funding info  

Assessment

   SSP rating:  Not rated (very likely R)

District MI-07

Incumbent Tim Walberg (R)

2006 opponent  Sharon Renier

Margin and notes 50-46. The seat was open and Renier raised only $55K to Walberg’s  $1.2 million.  

Current situation

  Sharon Renier (D) $2 K raised, $45 (no K) COH, $5K debt

  Mark Schauer (D) $905 K raised, $751 K COH

  Tim Walberg (R)  $830 K raised, $604 K COH

Assessment  Very impressive to be outraising an incumbent.

 Polls:  Feb/March – Walberg 51 Schauer 40

 SSP rating: Lean R

 On the DCCC list

District MI-09

Incumbent Joe Knollenberg (R)

2006 opponent  Nancy Skinner

Margin and notes 52-46. Knollenberg, first elected in 1992, raised $3 million.  Skinner raised about $400K

Current situation  

  Gary Peters (D)       $750K raised, $645K COH, $2K debt

  Joe Knollenberg (R)   $1.8 million raised, $1.3 million COH

Assessment

   SSP rating: Lean R  

   On the DCCC list

District MN-01

Incumbent Tim Walz (D)

2006 opponent  Gil Gutnecht

Margin and notes 53-47. Walz ousted Gutnecht relatively easily, raising about $1.3 million to Gutnecht’s $1.7 million

Current situation

    Tim Walz (D)        $1.6 million raised, $1.0 million COH

    Brian Davis (R)     $222 K raised,  $50K COH,  $34K debt

    Dick Day (R)        $226K raised,   $72K COH,  $23K debt

    Randy Demmer (R)    $223K raised,   $3K COH,   $119K debt

    Mark Meyer (R)      $27K raised,    $0 COH

Assessment

   SSP rating: Likely D

   On the DCCC list

District MN-06

Incumbent Michele Bachmann (R)

2006 opponent  Patty Wetterling

Margin and notes 50-42.  This seat was open and Wetterling actually raised a bit  more than Bachmann ($3million to $2.7 million)

Current situation

      Bob Olson (D)            $268K raised,  $112K COH, $160K debt

      Elwyn Tinklenberg (D)    $260K raised,  $102K COH

      Michele Bachman  (R)     $1.5 million raised, $1.0 million COH

Assessment

   SSP rating: Likely R  

   On the DCCC list

District NV-02

Incumbent Dean Heller (R)

2006 opponent  Jill Derby

Margin and notes 50-45.  The seat was open, Derby and Heller each raised about $1.6 million

Current situation

     Jill Derby (D)          $144K raised,  $134K COH

     Dean Heller (R)         $981K raised,  $808K COH, $370K COH

Assessment

    SSP rating:  Likely R

    On the DCCC list

District NV-03

Incumbent Jon Porter (R)

2006 opponent  Tessa Hafen

Margin and notes 48-47.  Porter, the incumbent, raised $3 million to Hafen’s $1.5

Current situation

     Robert Daskas (D)   $584K raised, $453K COH

     Andrew Martin (D)   $379K raised, $204K COH, $295K debt  

     Jon Porter (R)      $1.6 million raised, $1.0 million COH, $14K debt

Assessment

  SSP rating: Lean R

   On the DCCC list

District NH-01

Incumbent Carol Shea-Porter (D)

2006 opponent  Jeb Bradley

Margin and notes 51-49.  An amazing race.  Bradley, the incumbent, raised over $1 million. Shea-Porter raised less than $300K.

Current situation

  Carol Shea-Porter (D)  $663K raised,  $546K COH

  Jeb Bradley (R)        $566K raised,  $516K COH,  $300K debt

  John Stephen (R)       $337K raised,  $258K COH

Assessment

  SSP rating: Lean D

   On the DCCC list

District NH-02

Incumbent Paul Hodes (D)

2006 opponent  Charles Bass

Margin and notes 53-46.  Hodes ousted Bass (who had beaten him by 20 points in 2004) raising $1.6 million to Bass’ $1.2

Current situation

    Grant Bosse (R)    $15K raised, $10K COH

    Bob Clegg  (R)     $120K raised, $86K raised, $100K debt

    Jennifer Horn (R)  $71K raised, $31K COH, $15K debt

    Jim Steiner (R)    $14K raised, $11K COH

    Paul Hodes(D)      $1.3 million raised, $832K COH, $157K debt

Assessment

  SSP rating:  Likely D

   On the DCCC list

District NJ-07

Incumbent Michael Ferguson (R) who is retiring

2006 opponent  Linda Stender

Margin and notes 49-48. Ferguson, the incumbent, raised $3 million and just held off Stender, who raised almost $2 million

Current situation

  Linda Stender (D) $1.0 million raised,  $840K COH

   Kelly Hatfield $106K raised,  $94K COH, $60K debt

   Michael Hsing  $16K raised, $13K COH

   Leonard Lance $294K raised, $256K COH, $139K debt

   Martin Marks  $123K raised, $104K COH, $75K debt

   Thomas Roughneen No funding info

   Victor Sorillo   No funding info

   Kate Whitman   $444K raised, $307K COH

Assessment

   SSP rating:  Tossup

   On the DCCC list

District NM-01

Incumbent Heather Wilson retiring

2006 opponent  Patricia Madrid

Margin and notes 861 votes out  of 210,000. Wilson, the incumbent, raised $4.9 million to Madrid’s $3.4 million

Current situation

   Joseph Carraro               no funding info

   Michelle Lujan Grisham (D)   $224K raised, $139K COH, $6K debt

   Martin Heinrich (D)          $666K raised, $342  COH, $1K debt

   Robert Pidcock (D)           $36K raised, $9K COH, $34K debt

   Rebecca Vigil-Giron (D)      $6K raised, $2K COH, $15K debt

   Darren White (R)             $46K raised, $297K COH

Assessment  Looks good.

  Polls: October – White 51 Heinrich 33

  SSP rating: Tossup  

  On the DCCC list

District NY-19

Incumbent John Hall (D)

2006 opponent   Sue Kelly

Margin and notes  51-49.  Hall ousted Kelly, raising $1.6 million to her $2.5 million

Current situation

  John Hall (D)     $1.5 million raised, $1.1 million COH.

  George Oros (R)   $62K raised,  $60K COH, $10K debt

  Kieran Lalor (R)  $87K raised,  $63K COH, $13K debt

Assessment

    SSP rating: Likely D

   On the DCCC list

District NY-20

Incumbent Kirsten Gillibrand (D)

2006 opponent John Sweeney

Margin and notes 53-47. Gillibrand ousted Sweeney farily easily, raising $2.5 million to his $3.4

Current situation

 Kirsten Gillibrand (D)     $3.1 million  raised, $2.5 million COH

 Michael Rocque (R)         $222K raised, $52K COH

 Alexander Treadwell (R)    $1.68 million raised, $929K COH

 Richard Wager (R)          $415K raised, $197 COH

 John Wallace (R)           $74K raised,  $4 K COH

Assessment

  SSP rating: Lean D

   On the DCCC list

District NY-24

Incumbent Michael Arcuri (D)

2006 opponent  Ray Meier

Margin and notes 54-45.  Arcuri raised $2.2 million to Meier’s $1.6 million for this open seat

Current situation

  Michael Arcuri (D)  $919K raised $591K COH

  No opponents

Assessment  So far, it’s a free ride

      SSP rating: Likely D  

   On the DCCC list

District NY-25

Incumbent James Walsh (R)

2006 opponent  Dan Maffei

Margin and notes 51-49.  Walsh, the incumbent, raised $1.8 million to hold off Maffei, who raised $900K

Current situation Walsh is retiring.

   Dan Maffei (D)       $847K  raised $676K COH

   Dale Sweetland (R)   No funding info

   David Gay (R)        No funding info

Assessment Hehe.  An open seat, in a swing district, and neither GOP candidate has even filed reports with the FEC

  Polls:  February  Maffei 41  Cappuccilli 29 (but Cappuccilli has quit)

  SSP rating: Lean D

   On the DCCC list

District NY-26

Incumbent Tom Reynolds (R)

2006 opponent  Jack Davis

Margin and notes 52-48.  Davis raised $2.4 million to Reynolds’ $5.3

Current situation  Reynolds is retiring.

   Jack Davis (D)  No funding info

   Alice Kryzan (D)     $287K raised, $207 COH   $97K debt

   Jon Powers  (D)     $598K raised, $402K COH

   No Republican  has filed

Assessment  Will the Republicans find anyone?

   SSP rating: Tossup

   On the DCCC list

District NY-29

Incumbent Randy Kuhl (R)

2006 opponent  Eric Massa

Margin and notes 51-49.  Kuhl and Massa each raised about $1.5 million, but Massa couldn’t knock Kuhl out

Current situation

  Eric Massa (D)       $868K  raised, $565K COH

  Randy Kuhl (R)       $628K  raised  $366K COH

Assessment  Massa continues to out-raise the incumbent (1st Q Massa got $278K to Kuhl’s $111.  Prime pickup

       SSP rating:  Lean R

   On the DCCC list

District NC-08

Incumbent Robin Hayes (R)

2006 opponent  Larry Kissell

Margin and notes 329 votes out of 121,000.  Hayes, the incumbent, raised $2.5 million, Kissell almost won, raising just $800K

Current situation

  Larry Kissell (D)   $392K raised,  $137K COH

  Robin Hayes (R)     $1.3 million raised, $793K COH

Assessment

 Polls: November – Kissell 49  Hayes 47

 SSP rating: Lean R

   On the DCCC list

District NC-11

Incumbent  Heath Shuler (D)

2006 opponent Charles Taylor (R)

Margin and notes Shuler raised $1.8 million to oust Taylor, who raised $4.4 million

Current situation

   Heath Shuler (D)        $795 K raised, $626K COH

   John Armor (R)          no funding info

   Spence Campbell (R)     $188K raised,  $29K COH

   Carol Mumpower (R)      $3K raised, $1K COH, $3K debt

Assessment

   SSP rating: Likely D

District OH-01

Incumbent   Steve Chabot (R)

2006 opponent  John Cranley

Margin and notes 52-48.  Chabot, the incumbent, raised $3 million to Cranley’s $2 million

Current situation

   Steven Dreihaus (D)      $695K raised, $567K COH

   Steve Chabot (R)         $1.3 million raised, $1.1 million COH

Assessment

      SSP rating: Lean R  

   On the DCCC list

District OH-02

Incumbent Jean Schmidt (R)        

2006 opponent  Victoria Wulsin (D)

Margin and notes 50-49.  Schmidt, the incumbent, raised $2 million to Wulsin’s $1 million

Current situation

  Victoria Wulsin (D)  $771K raised, $211K COH, $21K debt

  Jean Schmidt (R)     $566K raised, $177K COH, $277K debt

Assessment To be outraising the incumbent is good.

 Polls:  Mid March – Schmidt 51 Wulsin 33

 SSP rating:  Lean R

   On the DCCC list

District OH-15

Incumbent  Deborah Pryce (R)

2006 opponent  Mary Jo Kilroy

Margin and notes 1,055 votes of 220,000.  Pryce, the incumbent, raised $4.7 millon, Kilroy raised $2.7 million

Current situation Pryce is retiring.  

  Mary Jo Kilroy (D)   $1.2 million raised, $944K COH, $62K debt

  Steve Stivers (R)    $789K COH, $600K COH

Assessment

  SSP rating: Tossup

   On the DCCC list

District PA-04

Incumbent Jason Altmire (D)

2006 opponent  Melissa Hart

Margin and notes 52-48.  Altmire raised $1.1 million to oust Hart, who raised $2.2 million

Current situation

  Jason Altmire (D)  $1.6 million raised, $1.3 million COH, $1K debt

  Melissa Hart (R)   $529K raised, $323K COH

Assessment If Hart can’t win, as the incumbent, with a fundraising edge, can she win as a challenger with a big deficit?

  SSP rating:  Lean D

   On the DCCC list

District PA-06

Incumbent Jim Gerlach (R)

2006 opponent  Lois Murphy

Margin and notes 51-49.  Murphy (who also ran in 2004) raised $4 million to Gerlach’s $3.5 million

Current situation  

 Bob Roggio (D)   $205K raised, $168K COH, $60K debt

 Jim Gerlach (R) $1.5 million raised, $715K COH

Assessment

 SSP rating: Likely R

   On the DCCC list

District PA-08

Incumbent Patrick Murphy (D)

2006 opponent  Mike Fitzpatrick

Margin and notes 1,518 votes of 250,000.  Murphy raised $2.4 million to oust Fitzpatrick, who raised $3.2 million

Current situation

  Patrick Murphy (D)  $2.2 million raised, $1.7 million COH, $1K debt

  Thomas Manion (R)   $422K raised, $417K COH

Assessment

     SSP rating: Likely D

   On the DCCC list

District PA-10

Incumbent Christopher Carney (D)

2006 opponent  Don Sherwood

Margin and notes 53-47.  Carney raised $1.5 million to oust Sherwood, who raised $2.3 million

Current situation

  Christopher Carney (D)   $1.3 million raised, $967K COH

  Chris Hackett (R)        $931K raised, $175K COH, $490K debt

  Dan Meuser (R)           $1.5 million raised, $70K COH, $925K debt

Assessment

 Polls: December – Carney 53 Meuser 23

                   Carney 55 Hackett 21

 SSP rating:  Lean D

   On the DCCC list

District TX-23

Incumbent Ciro Rodriguez (D)

2006 opponent  Henry Bonilla

Margin and notes 54-46 in special runoff.  Only 70,000 votes.  Rodriguez raised $1 million to oust Bonilla who raised $3.8 million.

Current situation No Republican opponent

Assessment Free ride

    SSP rating: Likely D

   On the DCCC list

District VT-AL

Incumbent Peter Welch (D)

2006 opponent  Martha Rainville

Margin and notes 53-45.  This seat was open after Bernie Sanders got elected to the Senate

Current situation No declared Republicans

Assessment So far, a free ride.  VT’s filing doesn’t close until July 22 though.  Welch has $828K COH

         SSP rating: Not rated (very likely D)

District VA-02

Incumbent Thelma Drake (R)

2006 opponent  Phil Kellam (D)

Margin and notes 51-48. Drake, the incumbent, raised $2.3 million to hold off Kellam, who raised $1.7 million

Current situation

  Glenn Nye (D)      $253K raised, $223K COH

  Thelma Drake (R)   $1.0 million raised, $594K COH  

Assessment

   SSP rating:  Likely R

   On the DCCC list

District WA-08

Incumbent Dave Reichert (R)

2006 opponent  Darcy Burner

Margin and notes 51-49.  Reichert, the incumbent, and Burner each raised $3 million

Current situation

  Darcy Burner  (D)  $1.4 million raised, $922K COH, $24K debt

  Dave Reichert (R)  $1.4 million raised, $698K COH

Assessment

   SSP rating:  Lean R

   On the DCCC list

District WI-08

Incumbent Steve Kagen (D)

2006 opponent  John Gard

Margin and notes 51-49.  This seat was open.  Kagen raised $3.2 million ot Gard’s $2.8 million

Current situation

 Steve Kagen (D)    $1.1 million raised, $760K raised, $469K debt

 John Gard (R)      $555K raised, $428K COH

Assessment

  SSP rating: Lean D

   On the DCCC list

District WY-AL

Incumbent Barbara Cubin (R)

2006 opponent  Gary Trauner

Margin and notes 1,012 votes of 200,000. The Libertarian got 7,481.

Current situation Cubin is retiring (what a shame!)

   Gary Trauner (D)     $648K raised,   $550K COH,  $500 debt

   Kenn Gilchrest (R)   no funding info

   Mark Gordon (R)      $412K raised, $86K COH

   Cynthia Lummis (R)   $171K raised, $141K COH

   Swede Nelson (R)     no funding info

   Dan Zwonitzer (R)    $9K raised, $4K COH

Assessment

   SSP rating: Likely R

   On the DCCC list
Congressional races round 2: WV, WA, WI, WY

The end of round 2!

Washington has 9 representatives: 6 Democrats and 3 Republicans

Filing deadline is June 6, primary is Aug 19

West Virginia has 3 representatives: 2 Democrats and 1 Republican

Filing deadline was Jan 26, primary is May 13

Wisconsin has 8 representatives: 5 Democrats and 3 Republicans

Filing deadline is July 7, primary is Sept. 9

Wyoming has 1 representative: A Republican

Filing deadline is May 30, primary Aug 19

District: WA-01

Location North of Seattle on both sides of Puget Sound

Representative Jay Inslee (D)

First elected  1998

2006 margin 68-32

2004 margin 62-36

Bush margin 2004 42-56

Notes on opponents Neither raised much

Current opponents Larry Ishmael, who lost in 2006 ($22K raised, -8K net COH).  Inslee has $850K COH

Demographics 46th highest income (median = $59K), 67th fewest Blacks (1.8%), 53rd most nonWhite, nonLatino, nonBlacks (7.9% Asian, 3.1% multiracial)

Assessment safe

District: WA-02

Location Northwestern WA, but east of Strait of Georgia and Puget Sound; bordering Canada, including many islands in the strait and sound.  

Representative Rick Larsen (D)

First elected  2000

2006 margin 64-36

2004 margin 64-34

Bush margin 2004 47-51

Notes on opponents In 2006, Doug Roulstone raised $700K to Larsen’s $1.5 million.  The 2004 opponent raised little

Current opponents None declared

Demographics 32nd most veterans (16.3%), 36th fewest Blacks (1.1%)

Assessment Probably safe; certainly safe if no one runs.

District: WA-03

Location Southeastern WA, bordering OR and the Pacific

Representative Brian Baird (D)

First elected  1998

2006 margin 63-37

2004 margin 62-38

Bush margin 2004 50-48

Notes on opponents In 2006, Michael Messmore raised $150K to Baird’s $735K.  The 2004 opponent raised little

Current opponents None declared

Demographics 34th most veterans (16.2%), 42nd fewest Blacks (1.2%)

Assessment Probably safe, especially if no one runs

District: WA-04

Location Central WA, bordering OR, including Yakima

Representative Doc Hastings (R)

First elected  1994

2006 margin 60-40

2004 margin 63-37

Bush margin 2004 63-35

Notes on opponents In 2004, Sandy Matheson raised $400K to Hastings $560K.  In 2006, Richard Wright raised $293K to Hastings $622K.

Current opponents George Fearing ($63K raised, $20K net COH); Hastings has $250K net COH.

Demographics 27th fewest Blacks (0.8%), 67th most Latinos (26.4%), 61st most Republican

Assessment Potentially vulnerable.  Hastings is part of the Abramoff scandal.  

District: WA-05

Location Eastern WA, bordering ID and OR, including Spokane and Walla Walla

Representative Cathy McMorris Rodgers

First elected  2004

2006 margin 56-44

2004 margin 60-40

Bush margin 2004 57-41

Notes on opponents In 2004, Don Barbieri raised $1.6 million to Rodgers $1.5; in 2006, Peter Goldmark raised $1.2 million to Rodgers $1.9.

Current opponents Mark Mays (no funding info), Rodgers has $280K net COH

Demographics 34th most veterans (16.2%), 47th fewest Blacks (1.3%)

Assessment Long shot

District: WA-06

Location Northwestern WA, west of Puget Sound, bordering the Pacific and across the Strait of Juan de Fuca from Canada.

Representative Norm Dicks (D)

First elected  1976

2006 margin 71-29

2004 margin 69-31

Bush margin 2004 45-53

Notes on opponents Neither raised much

Current opponents None declared

Demographics 15th most veterans (19.8%)

Assessment Safe

District: WA-07

Location Seattle

Representative Jim McDermott (D)

First elected  1988

2006 margin 79-16

2004 margin 81-19

Bush margin 2004 19-79

Notes on opponents Neither raised much

Current opponents None declared

Demographics 88th fewest veterans (10.6%), 19th most nonWhite, nonBlack, nonLatino (13.2% Asian, 3.9% multiracial), 23rd most Democratic

Assessment Safe

District: WA-08

Location Eastern suburbs and exurbs of Seattle

Representative Dave Reichert (R)

First elected  2004

2006 margin 51-49

2004 margin 52-47

Bush margin 2004 48-51

Notes on opponents In 2006, Darcy Burner and Reichert each raised about $3 million.  In 2004, Dave Ross and Reichert each raised about $1.5 million

Current opponents Darcy Burner is running again. She has raised $870K and has $600K COH (as of 12/31). Reichert has about $500K COH

Demographics 25th highest income (median = $64K), 78th fewest Blacks (2.0%), 54th most nonBlack, nonWhite, nonLatino (7.8% Asian)

Assessment Vulnerable. Superribbie ranks it the 8th most vulnerable Republican seat.  On the DCCC list
District: WA-09

Location Eastern shore of Puget Sound

Representative Adam Smith (D)

First elected  1996

2006 margin 66-34

2004 margin 63-34

Bush margin 2004 46-53

Notes on opponents Neither raised much

Current opponents None declared

Demographics 17th most veterans (17.2%), 37th most nonWhite, nonBlack, nonLatino (7.1% Asian, 4.2% multiracial)

Assessment Safe

District: WV-01

Location Northern WV, bordering OH, PA, and MD

Representative Alan Mollohan (D)

First elected  1982

2006 margin 64-36

2004 margin 68-32

Bush margin 2004 58-42

Notes on opponents In 2006, Chris Wakim raised $700K to Mollohan’s $1.7 million

Current opponents None declared

Demographics 67th most rural (46.3%), 28th lowest income (median = $30K), 8th most White (95.8%), 64th fewest Blacks (1.7%), 7th fewest Latinos (0.7%)

Assessment Safe, especially if no one runs

District: WV-02

Location A wiggly strip across central WV, from west to east; borders OH, WV, and MD

Representative Shelley Moore Capito (R)

First elected  2000

2006 margin 57-43

2004 margin 57-41

Bush margin 2004 57-42

Notes on opponents In 2006, Mike Callaghan raised $600K to Capito’s $2.3 million. The 2004 opponent raised little

Current opponents

Thornton Cooper (no funding info)

Richard Robb – net COH about $1 K

Anne Barth has raised $330K since starting her campaign in late January.  Capito has $600K COH

Demographics 34th most rural (53.8%), 68th lowest income (median = $33K), 27th most White (93.9%), 11th fewest Latinos (0.8%)

Assessment Vulnerable.  Barth is raising money at a great clip, and has Byrd’s endorsement. Superribbie ranks it the 65th most vulnerable Republican seat. On the DCCC list
District: WV-03

Location Southern WV, bordering KY and VA

Representative Nick Rahall (D)

First elected  1976

2006 margin 69-31

2004 margin 65-35

Bush margin 2004 53-46

Notes on opponents Neither raised much

Current opponents Marty Gearhart (no funding info).  Rahall has over $1.2 million COH

Demographics 14th most rural (61.6%), 3rd lowest income (median = $26K), 27th most White (93.9%), fewest Latinos (0.6%)

Assessment safe

District: WI-01

Location Southeastern WI, bordering IL and Lake Michigan.

Representative Paul Ryan (R)

First elected  1998

2006 margin 63-37

2004 margin 65-33

Bush margin 2004 54-46

Notes on opponents Neither raised much

Current opponents Marge Krupp has raised about $50K and has about $4K net COH, Ryan has about $1.6 million COH

Demographics Not unusual on what I track

Assessment Long shot

District: WI-02

Location Central southern WI, including Madison

Representative Tammy Baldwin (D)

First elected  1998

2006 margin 63-37

2004 margin 63-37

Bush margin 2004 37-62

Notes on opponents Dave Magnum ran both times and raised $650K in 2004 and $1 million in 2006.  Baldwin raised about $1.5 million each time

Current opponents Dave Redick (no funding info).  Baldwin has $360K COH.

Demographics Not unusual on what I track

Assessment Safe

District: WI-03

Location Southwestern WI, bordering MN and IA, including Eau Claire

Representative Ron Kind (D)

First elected  1996

2006 margin 65-35

2004 margin 56-43

Bush margin 2004 48-51

Notes on opponents In 2004, Dale Schultz raised $500K to Kind’s $1.2 million; in 2006, Paul Nelson raised $250K to Kind’s $780K

Current opponents None declared

Demographics 23rd most rural (56.9%), 5th most White (96.1%), 11th fewest Blacks (0.5%), 17th fewest Latinos (0.9%)

Assessment Probably safe

District: WI-04

Location Milwaukee and some suburbs

Representative Gwen Moore (D)

First elected  2004

2006 margin 71-28

2004 margin 70-28

Bush margin 2004 30-70

Notes on opponents Neither raised much

Current opponents

Demographics 67th lowest income (median = $33K), 92nd fewest Whites (50.4%), 39th most Blacks (33.0%), 50th most Democratic

Assessment

District: WI-05

Location Northern suburbs of Milwaukee

Representative Jim Sensenbrenner (R)

First elected  1978

2006 margin 62-36

2004 margin 67-32

Bush margin 2004 63-36

Notes on opponents Bryan Kennedy ran both times, raising about $300K each time, Sensenbrenner got $700K and $800K

Current opponents A primary, but no declared Democrat

Demographics 47th highest income (median = $58K), 24th most Whites (94%), 47th fewest Blacks (1.3%), 74th most Republican

Assessment Long shot

District: WI-06

Location Central part of eastern WI, along Lake Michigan, including Sheboygan and Oshkosh

Representative Tom Petri (R)

First elected  1979

2006 margin unopposed

2004 margin 67-30

Bush margin 2004 56-43

Notes on opponents Little money

Current opponents Roger Kittleson has raised $7K and has $2K COH, Petri has $877K COH

Demographics 94th most rural (39.3%), 22nd most Whites (94.1%)

Assessment Long shot

District: WI-07

Location Northwestern WI, bordering MN, MI and Lake Superior

Representative Dave Obey

First elected  1969

2006 margin 62-35

2004 margin 86-9-5 against a Green and another minor party

Bush margin 2004 49-50

Notes on opponents Nick Reid raised $211K to Obey’s $1.4 million

Current opponents None declared

Demographics 21st most rural (58%), 14th most Whites (95.1%), fewest Blacks (0.3%), 17th fewest Latinos (0.9%)

Assessment safe

District: WI-08

Location Northeastern WI, bordering MI and Lake Michigan, including Green Bay

Representative Steve Kagen (D)

First elected  2006

2006 margin 51-49

2004 margin NA

Bush margin 2004 55-44

Notes on opponents This seat was open in 2006, and Kagen raised $3.2 million to beat John Gard, who raised $2.8 million

Current opponents John Gard, who lost in 2006, is running again.  He’s raised $360K and has $285K COH; Kagen has raised $850K and has about $200K net COH

Demographics 74th most rural (44%), 68th most Whites (92.2%), 18th fewest Blacks (0.6%)

Assessment Vulnerable.   Superribbie ranks it the 6th most vulnerable Democratic seat.

District: WY-AL

Location Wyoming

Representative Barbara Cubin (R) who is retiring

First elected  1994

2006 margin 1,012 votes of 185,000

2004 margin 55-42

Bush margin 2004 69-29

Notes on opponents In 2006, Gary Trauner raised $950K to Cubin’s $1.3 million; in 2004, Ted Ladd raised $400K to Cubin’s $900K

Current opponents Gary Trauner is running again, no funding info. Several Republicans are running too.

Demographics 44th most veterans (15.8%), 74th most Whites (88.9%), 23rd fewest Blacks (0.7%), 13th most Republican

Assessment Cubin’s retirement makes this harder, but I think there’s still a shot. Superribbie ranks it the 39th most vulnerable Republican seat.  On the DCCC list
Congressional races round 2: Utah, Vermont, Virginia

Continuing through the alphabet, and nearing the end 🙂

Utah has 3 representatives: 2 Republicans and a Democrat

The filing deadline was March 17, the primary is June 24

Vermont has 1 representative – a Democrat

Filing deadline is July 21, primary is Sept. 9

Virginia has 11 representatives: 8 Republicans and 3 Democrats

Filing deadline was April 11, primary is June 10

District: UT-01

Location Northwestern UT, including Ogden and part of Salt Lake City

Representative Rob Bishop (R)

First elected  2002

2006 margin 63-32

2004 margin 68-29

Bush margin 2004 73-35

Notes on opponents Neither raised much

Current opponents Morgan Bowen, no funding info.  Bishop has $150K COH

Demographics 36th fewest Blacks (1.1%), 8th most Republican (per Cook PVI)

Assessment  Long shot

District: UT-02

Location Most of Salt Lake City, and all of southeastern UT

Representative Jim Matheson (D)

First elected  2000

2006 margin 59-37

2004 margin 55-43

Bush margin 2004 66-31

Notes on opponents In 2004, John Swallow raised $1.5 million to Matheson’s $2 million; in 2006, LaVar Christenson raised $800K to Matheson’s $1.6 million

Current opponents Bill Dew, Donald Ferguson, Kenneth Gray, Merrill Cook, Brian Jenkins, Chris Jacobs (no funding info on any).  Matheson has $850K COH

Demographics 18th fewest Blacks (0.6%), 25th most Republican

Assessment Pretty safe

District: UT-03

Location Southwestern UT, including Orem and Provo

Representative Chris Cannon (R)

First elected  1996

2006 margin 58-32

2004 margin 63-33

Bush margin 2004 77-20

Notes on opponents Neither raised much

Current opponents A primary and then Bennion Spencer (n funding info). Cannon has only $52K COH and $180K in debt

Demographics 11th fewest Blacks (0.5%), most Republican district in the country

Assessment Cannon could lose a primary, but this is as Republican a district as exists.

District: VT-AL

Location Vermont

Representative Peter Welch (D)

First elected  2006

2006 margin 53-45

2004 margin NA

Bush margin 2004 39-59

Notes on opponents 13th most rural (61.8%), 4th most Whites (96.2%), 11th fewest Blacks (0.5%), 17th fewest Latinos (0.9%)

Current opponents None formally announced; Welch has $711K COH

Demographics 13th most rural (61.8%), 4th most White (96.2%), 11th fewest Blacks (0.5%), 17th fewest Latinos (0.9%)

Assessment Safe

District: VA-01

Location Northeast VA, including Fredericksburg and most of the Chesapeake shoreline (on the western side)

Representative Rob Wittman (R)

First elected  2007

2006 margin NA

2004 margin NA

Bush margin 2004 60-39

Notes on opponents NA

Current opponents A primary, then Keith Hummel (no funding info).

Demographics 13th most veterans (17.7%),

Assessment The primary may be a battle

District: VA-02

Location Virginia Beach and the eastern side of the Chesapeake

Representative Thelma Drake (R)

First elected  2004

2006 margin 51-48

2004 margin 55-45

Bush margin 2004 58-42

Notes on opponents In 2006, Phil Kellam raised $1.7 million to Drake’s $2.3 million. In 2004, David Ashe raised $400K to Drake’s $800K

Current opponents Glenn Nye, who raised over $250K in the 1st quarter of 2008. On 12/31, Drake had $425K COH

Demographics 3rd most veterans (20.3%)

Assessment  Vulnerable. Superribbie ranks it the 40th most vulnerable Republican seat.

District: VA-03

Location Richmond and Norfolk and more or less contiguous points in between

Representative Bobby Scott (D)

First elected  1992

2006 margin Unopposed

2004 margin 69-31

Bush margin 2004 33-66

Notes on opponents In 2004, Winsome Sears raised $200K to Scott’s $500K

Current opponents None

Demographics 53rd most veterans (15.5%), 59th fewest Whites (37.7%), 16th most Blacks (56%), 60th most Democratic

Assessment Free ride

District: VA-04

Location Southeastern VA

Representative Randy Forbes (R)

First elected  2001

2006 margin 76-23

2004 margin 64-35

Bush margin 2004 57-43

Notes on opponents Neither raised much

Current opponents Andrea Miller (no funding info).  Forbes has $350K COH

Demographics 34th most veterans (16.2%), 38th most Blacks (33.1%), 91st fewest Latinos (2.0%)

Assessment long shot

District: VA-05

Location Central southern VA, north to Charlottesville

Representative  Virgil Goode (R)

First elected  1996

2006 margin 59-40

2004 margin 64-36

Bush margin 2004 56-43

Notes on opponents Al Weed ran both times, raising about $500K each time

Current opponents Tom Perriello has raised $600K and has almost all of it.  Goode has raised $438K and has $593K COH (both as of 3/31/08)

Demographics 10th most rural (64.0%), 68th most Blacks (23.9%), 67th fewest Latinos (1.6%)

Assessment Slightly vulnerable   Superribbie ranks it the 54th most competitive Republican seat

District: VA-06

Location Northwestern VA, bordering WV, including Roanoke

Representative Bob Goodlatte (R)

First elected  1992

2006 margin 75-12-12 against minor parties

2004 margin essentially unopposed

Bush margin 2004 63-36

Notes on opponents NA

Current opponents Sam Rasoul had raised $131K and had $62K COH on 12/31; Goodlatte had over $1.3 million COH

Demographics 86th most Republican

Assessment  Long shot

District: VA-07

Location Richmond and points north and west

Representative Eric Cantor (R)

First elected  2000

2006 margin 64-34

2004 margin 75-24

Bush margin 2004 61-38

Notes on opponents In 2006, James Nachman raised $100K to Cantor’s $3.5 million

Current opponents Anita Hartke (no funding info).  Cantor has $555K COH

Demographics 90th highest income (median = $51K), 90th fewest Latinos (2.0%), 86th most Republican

Assessment

District: VA-08

Location DC suburbs

Representative Jim Moran (D)

First elected  1990

2006 margin 66-31

2004 margin 60-37

Bush margin 2004 35-64

Notes on opponents In 2004, Lisa Marie Cheney raised $300K to Moran’s $1.6 million.  In 2006, Tom O’Donoghue raised $111K to Moran’s $1 million

Current opponents Amit Singh, Mark Ellmore, Dianne Kelly, Basil Mossaides, John Villaneuva…. all of whom either have no funding info, or more debt than COH.  Moran has $700K COH

Demographics 68th highest income (median = $63K), 48th most nonBlack, nonLatino, nonWhites (mostly 9.5% Asians), 77th most Democratic

Assessment

District: VA-09

Location Eastern VA, bordering NC, TN, KY and WV

Representative Rick Boucher (D)

First elected  1982

2006 margin 68-32

2004 margin 59-39

Bush margin 2004 59-39

Notes on opponents In 2004, Kevin Triplett raised $600K to Boucher’s $1.6 million.  The 2006 opponent raised little

Current opponents Jody Egan (no funding info).  Boucher has $1.2 million COH

Demographics 7th most rural (65.9%), 24th lowest income (median = $30K), 27th most Whites (93.3%), 27th fewest Latinos (1.1%)

Assessment safe

District: VA-10

Location Northern VA, bordering MD and WV

Representative Frank Wolf (R)

First elected  1980

2006 margin 57-41

2004 margin 64-36

Bush margin 2004 55-44

Notes on opponents In 2004, James Socas raised $900K to Wolf’s $1.6 million.  In 2006, Judy Feder raised $1.6 million to Wolf’s $1.8 million

Current opponents Feder is running again, as is Mike Turner and there is a primary opponent, too.  Feder has raised $588K and has $480K COH, Turner has raised $60K and has $30K COH; Wolf has $550K COH.

Demographics 10th highest income (median = $72K), 76th most nonWhite, nonBlack, nonLatino (6.6% Asian, 1.9% multiracial),

Assessment Slightly vulnerable   Superribbie ranks it the 46th most competitive Republican seat

District: VA-11

Location DC suburbs

Representative Tom Davis (R) who is retiring

First elected  1994

2006 margin 55-44

2004 margin 60-38

Bush margin 2004 50-49

Notes on opponents In 2006, Andrew Hurst raised $300K to Davis $3.6 million

Current opponents The Democrats:

Doug Denneny $31K raised, $14K COH

Gerry Connolly no funding info

Leslie Byrne  $115K raised, $110K COH

Demographics Highest income (median = $80K), 41st most veterans (15.9%), 40th most nonWhite, nonBlack, nonLatino (10.9% Asian, 2.6% multiracial)

Assessment  Should be a competitive race.   Superribbie ranks it the 10th most competitive Republican seat