Congressional races round 2: Texas

Continuing through the alphabet.

Texas has 32 representatives: 19 Republicans and 13 Democrats

The filing deadline was Jan 2, and the primary was March 4, with a runoff on April 8, where needed

District: TX-01

Location Eastern TX, bordering LA and a tiny bit of AR, including Tyler

Representative Louie Gohmert (R)

First elected  2004

2006 margin 68-30

2004 margin 61-38

Bush margin 2004 69-31

Notes on opponents In 2004, Gohmert ousted Max Sandlin, each spent about the same ($1.8 mill for Gohmert, $1.6 for Sandlin).  The 2006 opponent raised little

Current opponents No Democrats

Demographics 55th most rural (49.1%), 72nd lowest income (median = $33K), 90th most Blacks (18.9%), 25th most Republican

Assessment Free ride

District: TX-02

Location Oh, the odd shapes of TX districts!  This one mostly runs east west, from the LA border (and the Gulf) west to outer Houston.  But it also extends north a bit.

Representative Ted Poe (R)

First elected  2004

2006 margin 66-33

2004 margin 56-43

Bush margin 2004 63-37

Notes on opponents In 2004, Poe ousted Nick Lampson, spending $1.5 million to Lampson’s $2.4. The 2006 opponent raise little

Current opponents No Democrats

Demographics 94th most Blacks (19%), 74th most Republican

Assessment Free ride

District: TX-03

Location North central TX, including Plano and Garland

Representative Sam Johnson (R)

First elected  1991

2006 margin 63-35

2004 margin 86-8-6 against minor parties

Bush margin 2004 67-33

Notes on opponents No money

Current opponents Tom Daley raised $5K, $3K COH;  Johnson has $750K COH

Demographics 61st highest income (median = $61K), 61st fewest veterans (9.5%), 25th most Republican

Assessment Long shot

District: TX-04

Location Northeastern TX, bordering OK and AR, including Texarkana

Representative Ralph Hall (R)

First elected  1980

2006 margin 64-33

2004 margin 68-30

Bush margin 2004 70-30

Notes on opponents In 2004, Jim Nickerson raised $200K to Hall’s $1.1 million, in 2006, Glenn Melancon raised less than $100K

Current opponents Glenn Melancon is running again; he has raised $25K but has no COH; Hall has $350K COH, not much for an incumbent with a challenger

Demographics  44th most rural (50.4%), 25th most Republican

Assessment Long shot, but not totally long…. Hall is getting old (born 1923 – he is the oldest person in the House) and his fundraising has been anemic.

District: TX-05

Location Shaped like a C; the inner-top of the C is near Dallas, it goes south and then east, and also east directly from Dallas

Representative Jeb Hansarling (R)

First elected  2002

2006 margin 62-36

2004 margin 64-33

Bush margin 2004 67-33

Notes on opponents neither raised much

Current opponents No Democrat

Demographics 34th most Republican

Assessment  Free ride

District: TX-06

Location Shaped sort of like a boot, with an added doodad on top, the top of the boot is south and west of Dallas, it extends south about 100 miles and then east

Representative Joe Barton (R)

First elected  1984

2006 margin 60-37

2004 margin 66-33

Bush margin 2004 66-34

Notes on opponents In 2004, Morris Meyer raised $100K to Barton’s $1.8 million.  The 2006 opponent raised little

Current opponents Ludwig Otto

Demographics 42nd most Republican

Assessment Long shot

District: TX-07

Location Western outskirts of Houston

Representative John Culberson (R)

First elected  2000

2006 margin 59-38

2004 margin 64-33

Bush margin 2004 64-36

Notes on opponents In 2006, Jim Henley raised $122K to Culberton’s $700K

Current opponents Michael Skelly has (this is interesting) raised $465K (almost all from individuals) to Culberson’s $322K (almost half from PACs).  Even more interesting, Skelly has more COH: $400K to $82K

Demographics 70th highest income (median = $58K), 66th fewest veterans (9.9%), 33rd most Republican

Assessment Somewhat vulnerable. Superribbie ranks it the 75th most vulnerable Republican seat

District: TX-08

Location The southern part of eastern TX, bordering LA

Representative Kevin Brady (R)

First elected  1996

2006 margin 67-33

2004 margin 69-30

Bush margin 2004 72-28

Notes on opponents  Jim Wright ran both times, and raised little

Current opponents Kent Hargett

Demographics 45th lowest income (median = $40K), 10th most Republican

Assessment Long shot

District: TX-09

Location Part of Houston and southern suburbs

Representative Al Green (D)

First elected  2004

2006 margin Unopposed

2004 margin 72-27

Bush margin 2004 30-70

Notes on opponents In 2004, Arlette Molina raised $133K to Green’s $838K

Current opponents No Republican

Demographics 28th fewest veterans (7.1%), 13th fewest Whites (17.4%), 54th most Blacks (37%), 64th most Latinos (32.8%), 12th most nonWhite, nonBlack, nonLatinos (mostly 11% Asians), 45th most Democratic

Assessment Free ride

District: TX-10

Location A long, narrow district running from Austin almost to Houston

Representative Michael McCaul (R)

First elected  2004

2006 margin 55-40 (most of rest to a Libertarian)

2004 margin 79-15-6 against minor parties

Bush margin 2004 62-38

Notes on opponents In 2006, Ted Ankrum raised only $64K

Current opponents Larry Joe Doherty has raised $447K, almost all from individuals.  McCaul has raised about $500K, 40% of it from PACs. Each has about $100K COH

Demographics 77th highest income (median = $52K), 85th most Latinos (18.7%), 61st most Republican

Assessment Somewhat vulnerable. Superribbie ranks it the 62nd most vulnerable Republican seat; Doherty is a TV star, so has good name recog, and seems to be a good fundraiser

District: TX-11

Location Western TX, bordering (a little) on NM, including Odessa, Midland, and Brownwood

Representative Mike Conaway (R)

First elected 2004

2006 margin unopposed

2004 margin 77-22

Bush margin 2004 78-22

Notes on opponents no money

Current opponents No Democrat

Demographics 60th lowest income (median = $33K), 50th most Latinos (29.6%), 4th most Republican

Assessment Free ride

District: TX-12

Location Part of Ft. Worth, and western and northern suburbs

Representative Kay Granger (R)

First elected  1996

2006 margin 67-31

2004 margin 72-28

Bush margin 2004 67-33

Notes on opponents No money

Current opponents Tracey Smith (no fundraising info).  Granger has about $120K COH.

Demographics 63rd most Latinos (23.7%), 50th most Republican

Assessment Long shot

District: TX-13

Location Northern panhandle, bordering OK and NM

Representative Mac Thornberry (R)

First elected  1994

2006 margin 74-23

2004 margin 92-8 against a Libertarian

Bush margin 2004 78-22

Notes on opponents No money

Current opponents Roger Waun , who lost in 2006, is running again

Demographics 72nd lowest income (median = $34K), 4th most Republican

Assessment Long shot

District: TX-14

Location Most of the Gulf Coast of TX

Representative Ron Paul (R)

First elected  1996

2006 margin 60-40

2004 margin Unopposed

Bush margin 2004 67-33

Notes on opponents In 2006, Shane Sklar raised $550K to Paul’s $1.5 million

Current opponents No Democrat

Demographics 60th most Latinos (24.9%), 50th most Republican

Assessment Free ride

District: TX-15

Location Southern TX, between the Gulf and Mexico, but bordering neither

Representative Ruben Hinojosa (D)

First elected  1996

2006 margin 62-24-15 (two Republicans)

2004 margin 58-41

Bush margin 2004 51-49

Notes on opponents No money

Current opponents Eddie Zamora has $720 (no K) COH; Hinojosa has $300K

Demographics 6th lowest income (median = $27K), 59th fewest veterans (9.3%), 18th fewest Whites (19.7%), 64th fewest Blacks (1.7%), 2nd most Latinos (77.6%) (only TX-16 is higher), fewest nonBlack, nonWhite, nonLatino (1%)

Assessment Safe

District: TX-16

Location Westernmost TX, bordering NM and Mexico, including El Paso

Representative Silvestre Reyes (D)

First elected  1996

2006 margin 79-21 vs. a Libertarian

2004 margin 68-31

Bush margin 2004 44-56

Notes on opponents No money

Current opponents No Republican

Demographics 43rd lowest income (median = $31K), 13th fewest Whites (17.4%), most Latinos (77.7%)

Assessment Free ride

District: TX-17

Location Another TX district with twists, but it’s south of Dallas and centers on Waco

Representative Chet Edwards (D)

First elected  1990

2006 margin 58-40

2004 margin 51-47

Bush margin 2004 70-30

Notes on opponents In 2004, Arlene Wohlgemuth and Edwards each had about $2.5 million; in 2006, Van Taylor raised $2.5 million to Edwards $3.1 million

Current opponents Rob Curnock (no funding info), Edwards has raised about $1.3 million and has about $1 million COH

Demographics 18th most Republican

Assessment  Vulnerable.  On the DCCC list . Superribbie ranks it the the 18th most vulnerable Democratic seat.  It will be interesting to see Curnock’s fundraising report

District: TX-18

Location Shaped sort of like a Q, in Houston and suburbs

Representative Sheila Jackson Lee (D)

First elected  1994

2006 margin 77-19

2004 margin 89-6-5 vs. minor parties

Bush margin 2004 28-72

Notes on opponents no money

Current opponents John Faulk has only about $5K COH, Lee has over $200K

Demographics 40th lowest income (median = $31K), 41st fewest veterans (8.3%), 17th fewest Whites (19.7%), 32nd most Blacks (40.1%), 43rd most Latinos (35.6%), 37th most Democratic

Assessment safe

District: TX-19

Location Another weird shape…like a W with extra squiggles.  Borders NM in the west, then jiggles around eventually almost reaching the OK border; includes Lubbock

Representative Randy Neugebauer(R)

First elected  2003

2006 margin 68-30

2004 margin 58-40

Bush margin 2004 77-23

Notes on opponents In 2004, Charlie Stenholm raised $2.5 million to Neugebauer’s 3.2 million.  The 2006 opponent raised little

Current opponents Dwight Fullingim (no funding info), Neugebauer has $440K COH

Demographics 46th lowest income (median = $32K), 53rd most Latinos (29%), 4th most Republican

Assessment Long shot

District: TX-20

Location San Antonio and a odd shaped area around it

Representative Charlie Gonzalez (D)

First elected  1998

2006 margin 87-13 against a Libertarian

2004 margin 65-32

Bush margin 2004 45-55

Notes on opponents No money

Current opponents Robert Litoff (no funding info), Gonzalez has about $175 K COH

Demographics 51st lowest income (median = $32K), 31st fewest Whites (23.4%), 9th most Latinos (67.1%)

Assessment Safe

District: TX-21

Location Mostly west of San Antonio, but also north and east of San Antonio, towards Austin

Representative Lamar Smith (R)

First elected  1986

2006 margin 60-25-9 (two Democrats)

2004 margin 61-30

Bush margin 2004 66-34

Notes on opponents In 2006, John Courage raised $350K to Smith’s $1.6 million

Current opponents No Democrat

Demographics 25th most veterans (16.8%), 71st most Latinos (21.3%), 33rd most Republican.

Assessment Free ride

District: TX-22

Location Oh, I dunno…. a bowtie with one strand loose? Mostly south of Houston

Representative Nick Lampson (D)

First elected  2006

2006 margin 52-42

2004 margin NA

Bush margin 2004 64-36

Notes on opponents In 2006, Sekula-Gibbs raised $900K to Lampson’s $3.6 million

Current opponents Pete Olson raised about $810K but has only $114K left, and $170K in debt.  Lampson has about $740K COH

Demographics 48th highest income (median = $58K), 42nd most Republican

Assessment Vulnerable. On the DCCC list .   Superribbie ranks it the the most vulnerable Democratic seat.  This is Tom DeLay’s old seat.  Lampson  has a fundraising edge (as of mid-February) but now that the Republican primary is over, this will get hot

District: TX-23

Location Western TX, except for El Paso, borders Mexico and NM

Representative Ciro Rodriguez (D)

First elected 2006

2006 margin 54-46

2004 margin NA

Bush margin 2004 57-43

Notes on opponents In 2006, Rodriguez ousted Bonilla, although Bonilla had $3.8 million and Rodriguez less than $1 million. This district changed a lot in 2006 and before, and Rodriguez used to represent part of it

Current opponents Lyle T. Larson has $124K COH.  Rodriguez has about $660K.

Demographics 74th lowest income (median = $34K), 47th fewest Whites (30%), 13th most Latinos (65.1%).

Assessment Vulnerable. On the DCCC list

District: TX-24

Location Shaped like a T between Dallas and Ft. Worth

Representative Kenny Marchant (R)

First elected  2004

2006 margin 60-37

2004 margin 64-34

Bush margin 2004 65-35

Notes on opponents No money

Current opponents Tom Love has almost no COH; Marchant has $400K COH and $125K in debt

Demographics 47th highest income (median = $56K), 42nd most Republican

Assessment Long shot

District: TX-25

Location Austin and southern and eastern suburbs

Representative Lloyd Doggett (D)

First elected  1994

2006 margin 67-26

2004 margin 68-31

Bush margin 2004 46-54

Notes on opponents In 2004 Rebecca Armendariz Klein raised $800K to Doggett’s $2 million.  The 2006 opponent raised little

Current opponents George Morovich (no funding info); Doggett has $2.5 million COH

Demographics 94th fewest veterans (10.8%), 98th fewest Whites (52.9%), 45th most Latinos (33.9%)

Assessment Pretty safe

District: TX-26

Location   A square with two sticks, running north from Ft. Worth to the OK border

Representative Michael Burgess (R)

First elected  2002

2006 margin 60-37

2004 margin 66-33

Bush margin 2004 65-35

Notes on opponents Neither raised much

Current opponents Ken Leach , no funding info.  Burgess has only $39K COH.

Demographics 74th most Republican

Assessment Well, we’re not favored….but… Burgess got 75% in 2002, 66% in 2004, 60% in 2006…who knows?

District: TX-27

Location The southern Gulf coast

Representative Solomon Ortiz (D)

First elected  1982

2006 margin 57-39

2004 margin 63-35

Bush margin 2004 55-45

Notes on opponents Willie Vaden ran both times, raising about $50K in 2004 and $100K in 2006. Ortiz got around $700K each time

Current opponents Willie Vaden again (no funding info).  Ortiz has about $250K COH

Demographics 41st lowest income (median = $31K), 34th fewest Whites (27.6%), 8th most Latinos (68.1%)

Assessment Safe

District: TX-28

Location Southern TX along the Mexican border

Representative Henry Cuellar (D)

First elected  2004

2006 margin Unopposed

2004 margin 59-39

Bush margin 2004 54-46

Notes on opponents No money

Current opponents Jim Fish ($150 COH), Cuellar has about $42K COH, but $100K in debt

Demographics 17th lowest income (median = $29K), 49th fewest veterans (8.7%), 20th fewest Whites (20.3%), 36th fewest Blacks (1.1%), 3rd most Latinos (77.5%)

Assessment probably safe

District: TX-29

Location If you can describe this shape, you’re good! East of Houston

Representative Gene Green (D)

First elected  1992

2006 margin 74-24

2004 margin 94-6 against a Libertarian

Bush margin 2004 44-56

Notes on opponents No money

Current opponents Eric Story, who lost in 2006, has $833 COH; Green has $554K

Demographics 48th lowest income (median = $32K), 28th fewest Whites (21.9%), 10th most Latinos (66.1%)

Assessment Safe

District: TX-30

Location Dallas and southern suburbs

Representative Eddie Bernice Johnson (D)

First elected  1992

2006 margin 80-18

2004 margin 93-7 against a Libertarian

Bush margin 2004 25-75

Notes on opponents Little money

Current opponents Fred Wood (no funding info) Johnson has about $150K COH

Demographics 72nd lowest income ($34K), 45th fewest veterans (8.4%), 28th fewest Whites (21.9%), 30th most Blacks (41.4%), 43rd most Latinos (34.2%), 31st most Democratic

Assessment Safe

District: TX-31

Location North and west of Austin

Representative John Carter (R)

First elected  2002

2006 margin 58-39

2004 margin 65-32

Bush margin 2004 67-33

Notes on opponents In 2004, Jon Porter raised little.  In 2006 Mary Beth Harrell raised $207K to Carter’s $900K

Current opponents Brian Ruiz , no funding info.  Carter has about $130 COH

Demographics 29th most veterans (16.4%), 33rd most Republican

Assessment Long shot

District: TX-32

Location Shaped like most of a circle, near Dallas

Representative Pete Sessions (R)

First elected  1996

2006 margin 56-41

2004 margin 54-44

Bush margin 2004 60-40

Notes on opponents In 2004, Martin Frost raised $4.8 million to Sessions’ $4.5 million.  In 2006, Will Pryor raised $500K to Sessions’ $1.8 million

Current opponents Eric Roberson has about $3K COH, Sessions has about $860K COH

Demographics 53rd fewest veterans (8.9%), 90th fewest Whites (50.1%), 40th most Latinos (36.2%), 86th most Republican

Assessment Long shot
Free ride in Congress

The filing deadline has passed in a lot of states.  That leads me to wonder, how many congressional races have no opponent?  Which Democrats? Which Republicans?

More below the fold

Here’s a list of states where the filing deadline has passed:

Alabama

Arkansas

California

Illinois

Indiana

Idaho

Iowa

Kentucky

Maine

Maryland

Mississippi

Nebraska

New Jersey

New Mexico

North Carolina

Ohio

Oregon

Pennsylvania

Missouri

Montana

South Dakota

South Carolina

Tennessee

Texas

Utah

West Virginia

The 29  unopposed Democrats (the results in 2004 presidency and 2006 congressional races

AL-07 Kerry by 33, Davis unopposed.  

AR-01 Bush by 5, Berry by 38

AR-02 , Bush by 4, Snyder by 20

AR-04 Bush by 3, Ross by 50

CA-18, Bush essentially tied with Kerry, but Cardoza won by 30 plus

CA-28, a hugely Democratic district: Kerry won by 44, Berman by 55

CA-30, like CA-28: Kerry by 32, Waxman by 45

CA-31, Kerry by 55, Becerra was unopposed

CA-32, Kerry by 35, Solis unopposed

CA-37, Kerry by 38, Richardson by 42

CA-38 Kerry by 32, Napolitano by 51

IL-02  Kerry by 58, Jackson unopposed

IL-04 Kerry by 54, Gutierrez by 73

IL-05 Kerry by 28, Emanuel by 56

IL-07 Kerry by 67, Davis by 74

MO-01 Kerry by 50, Clay by 49

NJ-01 Kerry by 21, Andrews unopposed

NJ-06 Kerry by 14, Pallone by 39

NJ-08 Kerry by 18, Pascrell by 43

NJ-10 Kerry by 64, Payne unopposed

NJ-12 Kerry by 9, Holt by 31

OR-04 Kerry by 0.3%, DeFazio by 35

PA-14 Kerry by

39, Doyle unopposed

TN-06  Bush by 20, Gordon by 36

TN-08 Bush by 8, Tanner by 46

TN-00 Kerry by 44, Cohen by 43

TX-09 Kerry by 40, Green unopposed

TX-16 Kerry by 13, Reyes unopposed

WV-01 Bush by 16, Mollohan by 29

11 Unopposed Republicans:

AL-06 Bush by 59, Bachus unopposed

AR-03 Bush by 26, Boozman by 25

CA-19 Bush by 23, Radonovich by 21

CA-22 Bush by 38, McCarthy by 41

KY-05 Bush by 21, Rogers by 48

TX-01 Bush by 39, Gohmert by 38

TX-02 Bush by 37,

Poe by 33

TX-05 Bush by 34, Hensarling by 27

TX-11 Bush by 57, Conaway unopposed

TX-14 Bush by 35, Paul by 21

TX-21 Bush by 32, Smith by 36

Given what all these races were like in 2006, it’s likely that none would have been competitive, even if there were opponents.  But it’s still a lot easier to win with no opponent at all.  It’s also interesting that there are quite a few southern seats where Bush won in 2004, but the Democratic congressperson wins easily and has no opposition.  There aren’t any equivalents in the other direction: Where there’s no Democrat running, not only did the Republican congressperson have an easy win in 2006, but so did Bush in 2004

Congressional races round 2: South Carolina, South Dakota, Tennessee

Continuing through the alphabet:

South Carolina has 6 representatives: 4 Republicans and 2 Democrats

Filing deadline was March 31, primary is June 10

South Dakota has 1 representative: A Democrat

Filing deadline was March 25, primary is June 3

Tennessee has 9 representatives: 5 Democrats and 4 Republicans

Filing deadline was April 3, primary is August 7

District: SC-01

Location Almost all of coastal SC, bordering NC and the Atlantic, including Charleston

Representative Henry Brown (R)

First elected 2000

2006 margin 60-38

2004 margin 88-12 (vs. a Green)

Bush margin 2004 61=39

Notes on opponents little money

Current opponents A primary, then either

Linda Ketner or Ben Frasier.  No fundraising info on either Democrat.  Davis has about $1 million COH

Demographics 17th most veterans (17.2%), 78th most Blacks (20.9%)

Assessment

District: SC-02

Location Southern SC, stretching north to the middle of the state, bordering GA and the Atlantic, including Columbia

Representative Joe Wilson (R)

First elected 2001

2006 margin 63-37

2004 margin 65-33

Bush margin 2004 60-39

Notes on opponents Michael Ellisor ran both times and raised little

Current opponents A primary then either Blaine Lotz or Rob Miller . No funding info on either Democrat.  Wilson has about $225K COH

Demographics 70th most veterans (15.1%), 60th most Blacks (26.2%)

Assessment Long shot

District: SC-03

Location Northwestern SC, bordering GA

Representative Gresham Barrett (R)

First elected  2002

2006 margin 63-37

2004 margin Unopposed

Bush margin 2004 66-34

Notes on opponents No money

Current opponents Jane Dyer

Demographics 49th most rural (49.7%), 80th most Blacks (20.5%), 50th most Republican

Assessment Long shot
District: SC-04

Location Northern SC, bordering NC

Representative Bob Inglis (R)

First elected 2004

2006 margin 64-32

2004 margin 70-29

Bush margin 2004 65-34

Notes on opponents Neither raised much

Current opponents Ted Christian ; Paul Corden ; or Bryan McCanless. No fundraising info on the Democrats.  Inglis has about $300K COH

Demographics 42nd most Republican

Assessment  Long shot
District: SC-05

Location Northeastern SC, bordering NC

Representative John Spratt (D)

First elected  1988

2006 margin 57-43

2004 margin 63-37

Bush margin 2004 57-42

Notes on opponents In 2006, Ralph Norman raised $1.4 million to Spratt’s $2.7 million; in 2004, Albert Spencer raised little

Current opponents Albert Spencer (no fundraising info)

Demographics 35h most rural (53.3%), 80th fewest Latinos (1.8%)

Assessment Safe

District: SC-06

Location Southeastern quarter of SC, bordering the Atlantic, excluding Charleston

Representative James Clyburn (D)

First elected  1992

2006 margin 64-34

2004 margin 67-31

Bush margin 2004 39-61

Notes on opponents Gary McLeod ran twice and raised little

Current opponents Nancy Harrelson

Demographics 40th most rural (52.0%), 17th lowest income (median = $29K) 66th fewest Whites (40.3%), 14th most Blacks (56.7%), 58th fewest Latinos (1.5%)

Assessment safe

District: SD-AL

Location You know, South Dakota.

Representative Stephanie Herseth Sandlin (D)

First elected  2004 (in a special election)

2006 margin 69-29

2004 margin 53-46

Bush margin 2004 60-38

Notes on opponents In 2004, Larry Diedrich raised $2.5 million to Sandlin’s $4 million; the 2006 opponent raised little

Current opponents Chris Lien has raised about $119K and has almost all of it as COH; Sandlin has $650K COH

Demographics 58th most rural (48.1%), 18th fewest Blacks (0.6%), 51st fewest Latinos (1.4%), 66th most nonWhite, nonBlack, nonLatino (mostly 8.1% Native Americans), 99th most Republican

Assessment probably safe

District: TN-01

Location Eastern TN, bordering VA and NC

Representative David Davis (R)

First elected  2006

2006 margin 61-37

2004 margin NA

Bush margin 2004 68-31

Notes on opponents Rick Trent raised only $77K to fight for this open seat

Current opponents Rob Russell , Michael Donihe. No funding info on either Democrat.  Davis has about $1 million COH

Demographics 71st most rural (44.6%), 38th lowest income (median = $31K), 16th most White (95%), 83rd fewest Blacks (2.1%), 58th fewest Latinos (1.5%), 50th most Republican

Assessment  Long shot
District: TN-02

Location Eastern TN, including Knoxville.  Borders NC

Representative John Duncan (R)

First elected  1988

2006 margin 78-22

2004 margin 79-19

Bush margin 2004 64-35

Notes on opponents John Greene ran both times, and raised little

Current opponents David Hancock, Robert Scott

Demographics 73rd most White (90.1%), 41st fewest Latinos (1.3%), 86th most Republican

Assessment Long shot
District: TN-03

Location Shaped sort of like a barbell, running from the GA border in the south, then narrowing and running NE to the VA and KY borders, where it widens again

Representative Zach Wamp (R)

First elected  1994

2006 margin 66-34

2004 margin 65-35

Bush margin 2004 61-38

Notes on opponents neither raised much

Current opponents Doug Vandagriff, no funding info.  Wamp has about $900K COH

Demographics 67th fewest Latinos (1.3%)

Assessment Long shot

District: TN-04

Location Shaped like a lopsided U, starting south of Nashville in the middle of the state, south to the AL border, east to the GA border, then north to the KY border

Representative Lincoln Davis (D)

First elected  2002

2006 margin 66-34

2004 margin 55-44

Bush margin 2004 58-41

Notes on opponents  In 2004, Janice Bowling raised $300K to Davis’ $1.1 million; the 2006 opponent raised little

Current opponents Monty Langford, Don Strong. No funding info on the Repubs; Davis has about $240K COH

Demographics 4th most rural (67.9%), 46th lowest income (median = $32K), 48th most Whites (92.6%), 68th fewest Latinos (1.6%)

Assessment Safe

District: TN-05

Location Nashville and suburbs

Representative Jim Cooper (D)

First elected  2002

2006 margin 69-28

2004 margin 69-31

Bush margin 2004 48-52

Notes on opponents Neither raised much

Current opponents Gerard Donovan, Vijay Kumar.  Donovan has $3K COH, no info on Kumar, Cooper raised about $200K and has about $100K COH

Demographics 68th most Blacks (23.4%)

Assessment safe

District: TN-06

Location Central part of northern TN bordering KY

Representative Bart Gordon (D)

First elected  1984

2006 margin 67-31

2004 margin 64-34

Bush margin 2004 60-40

Notes on opponents Neither raised much

Current opponents No Republicans

Demographics 63rd most rural (46.8%)

Assessment Free ride

District: TN-07

Location Another strange shaped district.  Most of it is in southwestern TN, bordering MS and AL, but it stretches north and east to the suburbs of Nashville, then north to the KY border

Representative Marsha Blackburn (R)

First elected  2002

2006 margin 66-32

2004 margin Unopposed

Bush margin 2004 66-33

Notes on opponents Bill Morrison raised less than $100K

Current opponents A primary, and then either Randy Morris or James Tomasik.  No info on either Democrat…Blackburn has about $1 million COH

Demographics 95th most rural (39.0%), 74th most Republican

Assessment long shot

District: TN-08

Location Northwestern TN, bordering AR, MO and KY

Representative John Tanner (D)

First elected  1988

2006 margin 73-27

2004 margin 74-26

Bush margin 2004 53-47

Notes on opponents Neither raised much

Current opponents  James Hart, who lost badly in 2004

Demographics 36th most rural (53.0%), 64th lowest income (median = $33K), 38th most Blacks (22.3%), 67th fewest Latinos (1.6%)

Assessment Safe

District: TN-09

Location Memphis and suburbs, bordering AR and MS

Representative Steve Cohen (D)

First elected  2006

2006 margin 60-22-18 (22 for an Independent)

2004 margin NA

Bush margin 2004 30-70

Notes on opponents Mark White raised $227K to Cohen’s $619K

Current opponents  A big primary battle, but no Republicans

Demographics 76th lowest income (median = $34K), 56th fewest Whites (34.9%), 10th most Blacks (59.5%), 60th most Democratic

Assessment  Safe for a Democrat

Responses to requests from yesterday

Continuing from yesterday’s diary here , I’m going to try to meet some of the requests

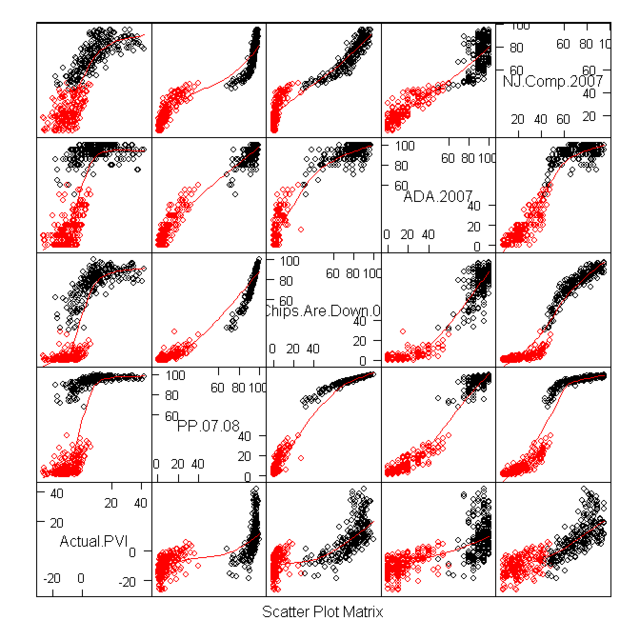
People were interested in the various measures, and how they related.  Here is what’s known as a scatterplot matrix of the various measures:

Photobucket

Each little panel is a scatterplot, consisting of the variable listed in the row, and the column.  All are highly correlated, all show that Republicans are lousy.  But they are different in interesting ways:  The PP Chips are down scale shows a lot of variation within the Democratic part, and little within the Republican.  Let’s take a closer look:

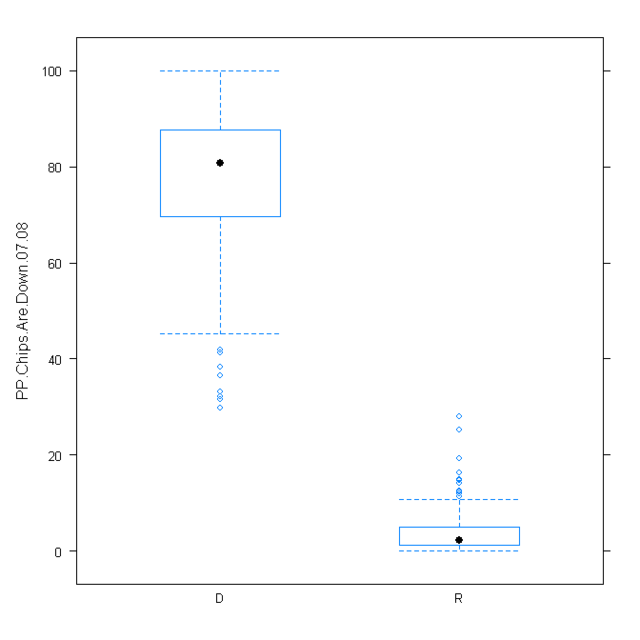
Photobucket

that’s a boxplot of the chips are down scores, by party, and my guess was right: There’s a lot of spread among the Democrats.  Fortunately, there are no outliers at the top – that means that a lot of Democrats get 100 on this measure.  But unfortunately, quite a few get fairly low scores: A quarter or so get under about 70, and more than 10 get under 50. (Note, though, that the lowest Democratic score is about where the highest Republican score is).

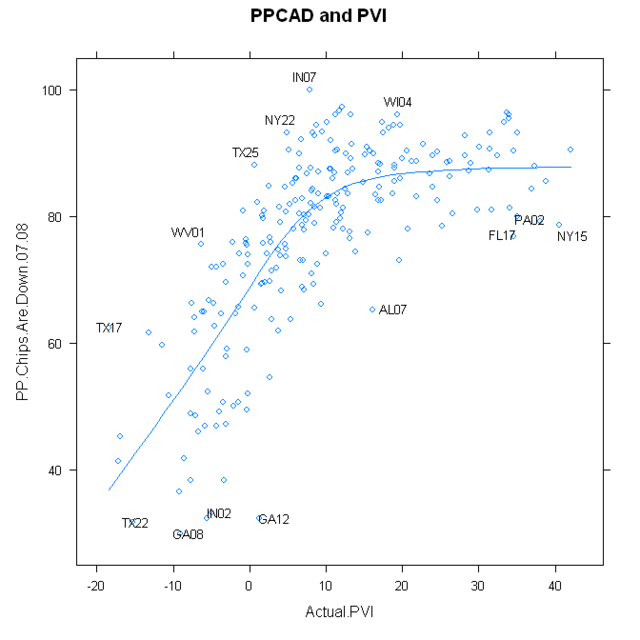
So, that PPCAD might be a good measure to use.  Let’s see how it relates to Cook PVI, among Democrats:

Photobucket

Again, there’s a ceiling effect: You can’t have a PPCAD score over 100.  But, given that, I’ve identified some of the best and worst.

Other people were interested in Republicans who were too conservative for their districts.  Here, we want a measure that shows good spread among the Republicans.  Two stand out: ADA rating and NJ rating.  Since we’ve used NJ rating before, let’s do it again.  Among Republicans, region made very little difference, so using just PVI is okay.  

Here are the 17 Republicans who are 15 or more points more conservative than the model predicts

Here are the ones who are more than 12.5 points too conservative


   District Actual.PVI          Rep. NJ.Comp.2007

10      AZ02    -9.3076    R (Franks)          6.7

11      AZ03    -6.5867   R (Shadegg)          6.7

44      CA24    -5.3747  R (Gallegly)         14.0

77      CO04    -8.8633  R (Musgrave)         11.0

93      FL07    -4.8761      R (Mica)          8.3

98      FL12    -6.0349    R (Putnam)         12.3

110     FL24    -3.8316    R (Feeney)         12.0

161     IA05    -8.9516      R (King)          8.8

215     MN02    -3.3538     R (Kline)          9.3

219     MN06    -5.6477  R (Bachmann)         10.8

227     MO02    -9.4356      R (Akin)         10.0

248     NJ05    -5.0601   R (Garrett)         14.7

303     OH01    -1.2364    R (Chabot)         17.5

310     OH08   -13.0170   R (Boehner)          6.7

353     SC02    -9.4804    R (Wilson)          9.3

365     TN07   -12.3217 R (Blackburn)          8.0

This is fun!  I get to do the analysis, and didn’t have to enter the data

Good Democrats, Better Democrats

(Phenomenal work.  The graphs and analysis below the fold are a must-read. – promoted by James L.)

Crisitunity compiled a whole lot of data, and wrote a diary about the PVI-Voting Pattern Index.  It’s a great piece.  But I thought some graphics would be nice. And some more statistics.  First, go read that diary.  When you get back, I’ll be below the fold.

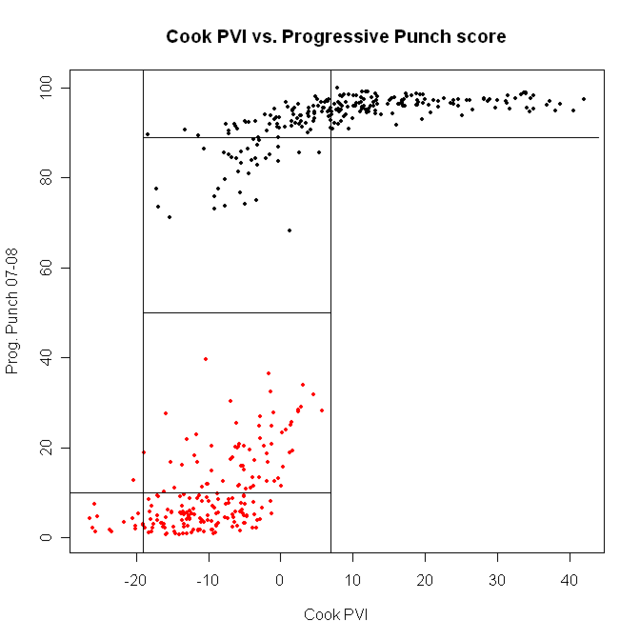
First, let’s look at all 435 representatives.  I’ve plotted each rep’s Progressive Punch score against their district’s Cook PVI.

Repubs in red, Dems in blue

the first point is clear: ALL Democrats are more progressive than ALL Republicans.  We are ALWAYS better.  All the talk about how bad the blue dogs are is….well, wrong.  Democrats are better than Republicans. Period.

Next, look at the lines that divide the plot into boxes.  Here, the point is that, above about Cook PVI of D + 8, every Democrat gets a good PP score.  Every Democrat who got a PP score under 89 came from a district with a Cook score of under D+8.  If we want better Democrats, we need better voters.  Move the population, the reps will follow.

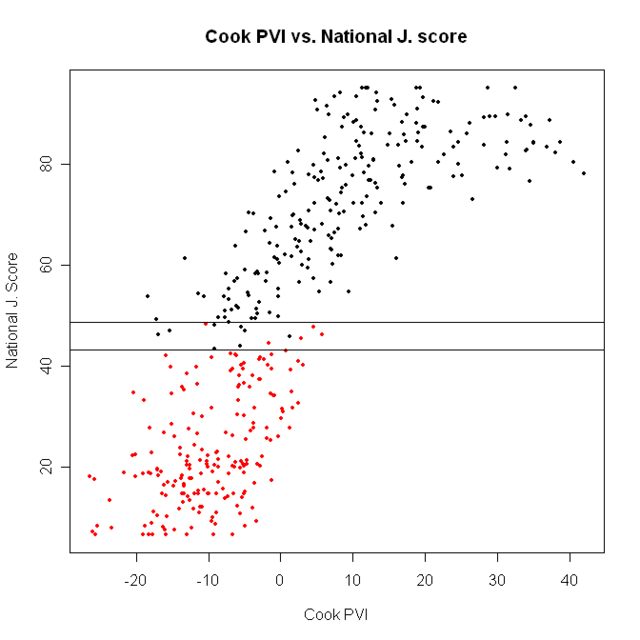
A somewhat different picture comes from using National Journal’s ratings.

There are actually some Democrats who are less liberal than the most liberal Republicans, and vice versa.  They’re between the two vertical lines in the plot; there are 12 such districts:

CT-04    R Shays    

DE-AL    R Castle

GA-12    D Barrow  

IL-10    R Kirk

IN-02    D Donnelly

IN-08    D Ellsworth

LA-03    D Melancon

MD-01    R Gilchrest

MS-04    D Taylor

NJ-04    R Smith  

OK-02    D Boren

TX-22    D Lampson

7 Democrats out of 234 are less liberal than the most liberal Republican.

So, which should we use?  If we went just by better statistical properties, we’d pick the National Journal rankings.  But substance should always trump method. If we look at the graph below, we can see the difference in the two ratings: There are no PP scores between about 40 and 60.  Is this reasonable?  Well, for our purposes, I don’t think it is.  If our aim is particularly to identify the most conservative Democrats and the least conservative Republicans, we want a measure that is sensitive exactly in that middle region.  So, from here, we’ll use NJ ratings

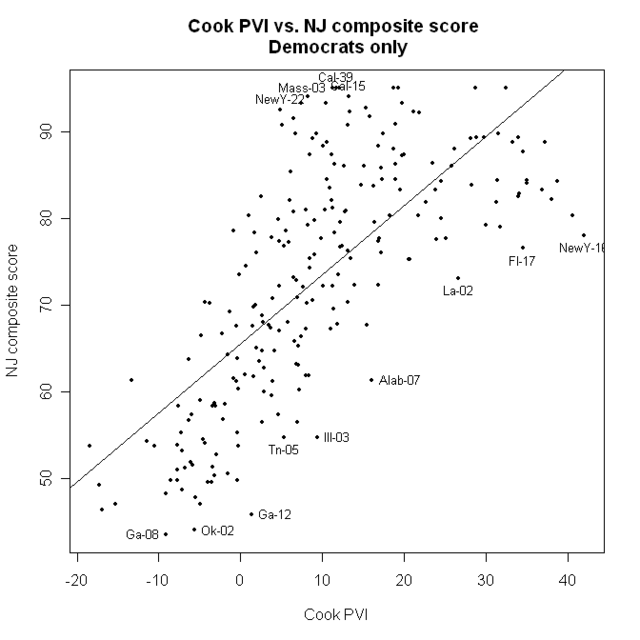
Now, let’s just look at the Democrats

Here, the straight line is not a bad fit.

I’ve identified some of the best and worst, compared to their district’s PVI numbers

What else can we do?  Well, region is always regarded as important.  The census bureau divides the nation into 9 regions.  I’m not saying it’s the greatest division (I may do a diary sometime on other ways to make regions) but it’s not horrible, and it’s standard, if only because the Census says so. here is one map of the regions.

If we attempt to fit a linear model for all 435 districts to NJ numbers from region, we get this:


Coefficients:

                  Estimate Std. Error   t value Pr(>|t|)    

(Intercept)          48.9848     3.1517   15.543  < 2e-16 ***

regionE. Sou Cent  - 11.8008     6.0130  - 1.963  0.05037 .  

regionMid Atl        12.9774     4.5475    2.854  0.00454 **

regionMountain     - 11.4815     5.6379  - 2.037  0.04234 *  

regionNew Eng        31.0437     6.4149    4.839  1.84e-06 ***

regionPacific        10.1898     4.4405    2.295  0.02225 *  

regionSouth Atl     - 4.5797     4.2823  - 1.069  0.28549    

regionW. North Cen  - 0.5241     5.7746  - 0.091  0.92772    

regionW. Sou Cen   - 13.3131     4.9178  - 2.707  0.00707 **

---

Signif. codes:  0 '***' 0.001 '**' 0.01 '*' 0.05 '.' 0.1 ' ' 1

One thing this tells us is the average NJ score from each region.  Across all regions, it’s 48.98 (that’s the intercept).  For East South Central it’s 48.98 – 11.80 = 37.18; for the mid Atlantic, it’s 48.98 + 12.98 = 61.96; and so on.  The most liberal region (no surprise) is New England, where the average representative gets a 48.98 + 31.04 = 80.02; it would be even higher, except for Shays (CT-04), who is the only Republican in the region, and who got a 47.7.

I’m a little surprised that Mountain is just as conservative as East South Central.

Another interesting thing is that region, by itself, only accounts for about 17% of the variance in NJ score.

But what if we combine region and Cook PVI?  Do we do better at predicting NJ scores?  We sure do.  That model accounts for 70% of the variance in NJ scores.  And, if we add party to the model? That model accounts for 89% of the variation in PP scores…. which is pretty amazing.  

Here is a summary of that model


Coefficients:

                    Estimate  Std. Error t value Pr(>|t|)    

(Intercept)          65.21028    1.33998   48.665  < 2e-16 ***

regionE. Sou Cent   - 3.79987    2.20085  - 1.727 0.085000 .  

regionMid Atl         1.40556    1.65805    0.848 0.397087    

regionMountain      - 1.35274    2.05635  - 0.658 0.511012    

regionNew Eng         8.95746    2.35363    3.806 0.000163 ***

regionPacific         2.52476    1.60749    1.571 0.117041    

regionSouth Atl     - 0.68440    1.55044  - 0.441 0.659138    

regionW. North Cen  - 0.29151    2.10166  - 0.139 0.889753    

regionW. Sou Cen    - 3.68887    1.81898  - 2.028 0.043206 *  

repdata$Actual.PVI    0.74017    0.04772   15.512  < 2e-16 ***

partyR             - 34.16677    1.25862 - 27.146  < 2e-16 ***

what’s interesting here is that, after accounting for party and Cook PVI, region doesn’t make much difference.  The region that’s the most different is New England, and that is 8.96 points more liberal on average, than would be predicted from just party and Cook PVI.  But, other than New England, all the regions are just about where the model would predict.

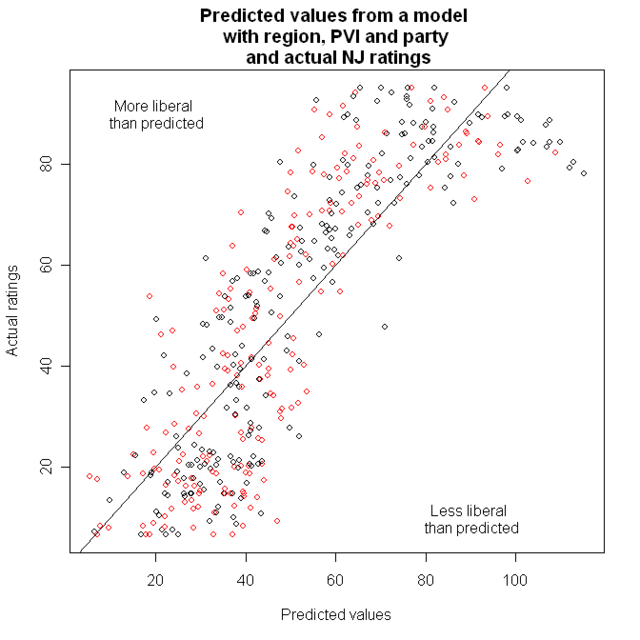
Next is a graph of the predicted values from that model, and the actual NJ ratings

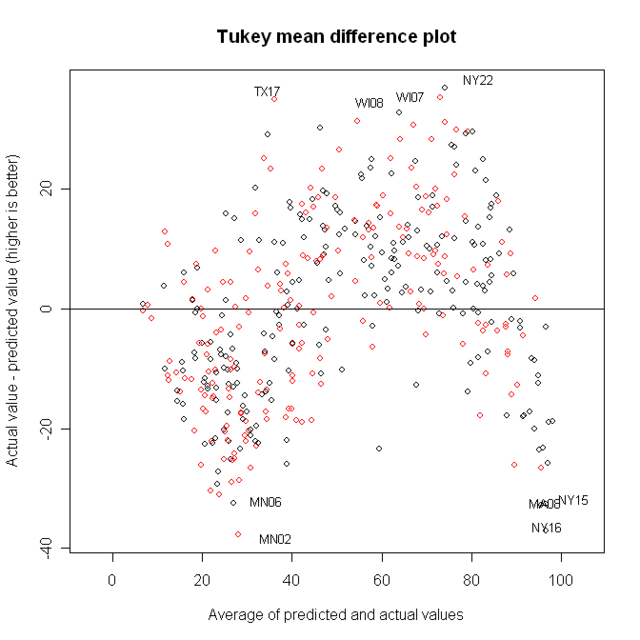
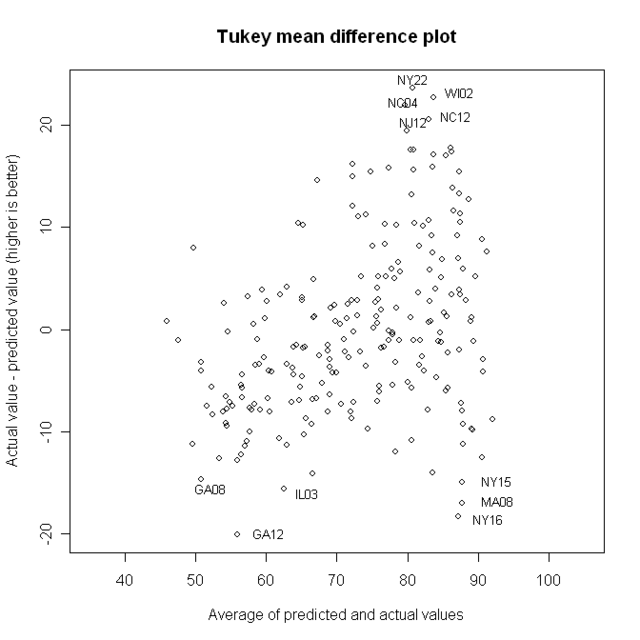
Now, we want to look at points that are far from that line; but it’s easier for people to judge distance from a horizontal line than a diagonal one.  That leads to the Tukey Mean Difference plot.  On the X-axis, we have the average of what was on the X and Y axes before: That is, the predicted value and the actual value.  On the y axis, we now have the difference between them.

I’ve identified four of the best and worst districts.

But if we want to identify good and bad Democrats, we should go back to looking at just Democrats.

A model with region and CookPVI looks like this


                                Estimate  Std. Error  t value Pr(>|t|)  

(Intercept)                        63.3242    1.6443   38.512  < 2e-16 ***

democrats$Actual.PVI                0.7410    0.0502   14.762  < 2e-16 ***

region[party == "D"]E. Sou Cent   - 5.2676    3.1070  - 1.695 0.091432 .  

region[party == "D"]Mid Atl         1.8968    2.0786    0.913 0.362482    

region[party == "D"]Mountain        1.8168    3.0926    0.587 0.557487    

region[party == "D"]New Eng        10.6171    2.5004    4.246 3.22e-05 ***

region[party == "D"]Pacific         7.5039    2.0499    3.661 0.000316 ***

region[party == "D"]South Atl       1.5945    2.1492    0.742 0.458941    

region[party == "D"]W. North Cen    3.8981    2.7225    1.432 0.153630    

region[party == "D"]W. Sou Cen    - 3.9359    2.5680  - 1.533 0.126810    

---

Signif. codes:  0 '***' 0.001 '**' 0.01 '*' 0.05 '.' 0.1 ' ' 1

Residual standard error: 8.772 on 218 degrees of freedom

 (6 observations deleted due to missingness)

Multiple R-Squared: 0.6116,     Adjusted R-squared: 0.5956

A couple interesting things here.  The average Democrat has a NJ score of 63.  Cook PVI score is clearly important: For each point increase in Cook PVI, the predicted NJ score goes up by .74 points.  And New England and the Pacific region are more liberal than the model predicts.

Now, here’s the TMD plot for this model

I’ve identified the best and worst.  Here are their names and districts:

Best:

NY22 Maurice Hinchey – A strong liberal from a district that is D + 6

WI02 Tammy Baldwin – This district is D + 13, but her NJ score is 95

NC04 David Price – NJ score of 91, district is D+6

NC12 Melvin Watt – The district is D +11, NJ score is 93

NJ12 Rush Holt – D + 8, NJ score of 90

notice that the most liberal Democrats, from the most liberal districts, can’t appear here, because the scale simply doesn’t go that high

Worst

GA12 John Barrow.  D +2, NJ = 46

NY16 Jose Serrano  D +43, NJ = 78…this is the most Democratic district in the USA

MA08 Michael Capuano D +33, NJ = 83.5

IL03 Daniel Lipinski D +10, NJ = 55

NY15 Charles Rangel  D +43, NJ = 80, the second most Democratic district

Congressional races round 2: Oregon, Pennsylvania, Rhode Island

Continuing through the alphabet.

Oregon has 5 representatives: 4 Democrats and 1 Republican

Filing deadline was March 11, primary is May 20

Pennsylvania has 19 representatives: 11 Democrats and 8 Republicans

Filing deadline was Feb 12, primary is April 22

Rhode Island has 2 districts, both Democrats

Filing deadline is June 25, primary Sept 9

District: OR-01

Location Northwestern OR, bordering WA and the Pacific, including parts of Portland and its suburbs

Representative David Wu (D)

First elected  1998

2006 margin 63-34

2004 margin 58-38

Bush margin 2004 44-55

Notes on opponents In 2004, Goli Ameri raised $2.3 million to Wu’s $2.7 million.  In 2006, Derrick Kitts raised about $140K to Wu’s $1.1 million

Current opponents Wu is facing a primary, and then either Stephen Brodhead, CW Chappell or Joel Haugan. No fundraising reports from anyone but Wu, who has $600K COH

Demographics 36th fewest Blacks (1.1%)

Assessment  Safe

District: OR-02

Location The eastern 2/3rds of OR, bordering WA, ID, NV, and CA

Representative Greg Walden (R)

First elected  1998

2006 margin 67-30

2004 margin 72-26

Bush margin 2004 61-38

Notes on opponents Neither raised much

Current opponents Noah Lemas (no website, no fundraising report)

Demographics 15th most veterans (17.3%), 6th fewest Blacks (0.4%)

Assessment Long shot

District: OR-03

Location Northern OR, bordering WA, includes Portland and suburbs, and Mt Hood.

Representative Earl Blumenauer (D)

First elected  1996

2006 margin 73-23

2004 margin 71-24

Bush margin 2004 33-67

Notes on opponents Neither raised much

Current opponents A primary and then Delia Lopez. No fundraising reports from anyone but Blumenauer, who has $465 COH

Demographics 60th most Democratic

Assessment safe

District: OR-04

Location Southwestern OR, bordering CA and the Pacific, including Eugene

Representative Peter DeFazio (D)

First elected  1986

2006 margin 62-38

2004 margin 61-38

Bush margin 2004 49-49

Notes on opponents In 2004, Jim Feldekamp raised $600 K to DeFazio’s $900K; he ran again in 2006, raising $500K to DeFazio’s $750K

Current opponents  None. DeFazio has $360K COH….he should share

Demographics 11th fewest Blacks (0.5%), 24th most veterans (16.9%)

Assessment  Free ride.

District: OR-05

Location A T-shaped district in northwestern OR.

Representative Darlene Hooley (D) retiring

First elected  1996

2006 margin 54-43

2004 margin 53-44

Bush margin 2004 50-49

Notes on opponents In 2004, Jim Zupancic raised $1.3 million to Hooley’s $2 million; in 2006, Mike Erickson raised $1.8 million to Hooley’s $2 million

Current opponents Democrats:

Kurt Schrader

Andrew Foster (no web site), Nancy Moran (no web site),

Steve Marks

Richard Nathe (no website) and a bunch of Republicans.   No fundraising reports from the Dems

Demographics 18th fewest Blacks (0.6%)

Assessment Seems vulnerable, but I don’t know

District: PA-01

Location Some of Philadelphia and some suburbs

Representative Robert Brady (D)

First elected  1998

2006 margin unopposed

2004 margin 86-13

Bush margin 2004  15-84

Notes on opponents No money

Current opponents Mike Muhammad. No fundraising report.  Brady has $678,000 COH, he should share

Demographics 14th lowest income (median = $28K), 52nd fewest Whites (33%), 27th most Blacks (45%), 8th most Democratic

Assessment Safe

District: PA-02

Location Philadelphia and suburbs

Representative Chaka Fattah

First elected  1994

2006 margin 89-9

2004 margin 88-12

Bush margin 2004 12-87

Notes on opponents Neither raised much

Current opponents Mike Livingston, no fundraising report.  Fattah has $183 COH.

Demographics 32nd lowest income (median = $31K), 46th fewest Whites (29.9%), 7th most Blacks (60.7%), 4th most Democratic

Assessment Safe

District: PA-03

Location Northwestern PA, bordering Lake Erie, OH, and NY

Representative Phil English (R)

First elected  1994

2006 margin 54-42

2004 margin 60-40

Bush margin 2004 53-47

Notes on opponents Steven Porter ran in 2004 and 2006, raising about $200K each time, English had about $1.5 million each time

Current opponents Kyle Foust $55K raised, $25K COH

Mike Waltner $100K raised, $65K COH

Tom Myers $140K raised, $75K COH

Kathy Dahlkemper $154K raised, $117K COH;

Demographics 33rd most Whites (93.7%), 42nd fewest Latinos (1.3%)

Assessment Superribbie ranks it as the 50th most vulnerable Republican seat.  On the DCCC list .  The fact that all those Democrats are running is a sign that English is vulnerable.

District: PA-04

Location Western PA, bordering OH

Representative Jason Altmire (D)

First elected  2006

2006 margin 52-48

2004 margin NA

Bush margin 2004 54-45

Notes on opponents In 2006, Altmire ousted Melissa Hart, raising $1.1 million, about half what she raised

Current opponents Hart is back for a rematch, but she has a primary challenger (Ron Francis).  Francis has raised $160K, $113 COH; Hart has raised $385K, $332K COH.

Altmire has raised $1.1 million, $911K COH

Demographics 21st most White (94.3%), tied for fewest Latinos (0.6%)

Assessment Superribbie ranks it as the ninth most vulnerable Democratic seat, and it’s on the DCCC list .  While not safe, Altmire beat Hart, with less money than her, when she was an incumbent.  Now he’s got more money, and he’s the incumbent.  I don’t think it’s quite as vulnerable as Superribbie.

District: PA-05

Location Northern PA, bordering NY.

Representative John Peterson (R) retiring

First elected  1996

2006 margin 60-40

2004 margin 88-12 against a Libertarian

Bush margin 2004 61-39

Notes on opponents In 2006, Don Hilliard raised no money and still got 40%

Current opponents Democrats:

Mark McCracken

Bill Cahir

Rick Vilello

Lots of Republicans. No fundraising numbers from anyone

Demographics 32nd most rural (54%), 6th lowest income (median = $33K), 6th most Whites (96%), 47th fewest Blacks (1.3%), 11th fewest Latinos (0.8%), 99th most Republican

Assessment Somewhat vulnerable. Superribbie ranks it as the 58th most vulnerable Republican seat. The fact that we are competitive here, in a naturally Republican seat, is a really good sign

District: PA-06

Location West of Philadelphia

Representative Jim Gerlach (R)

First elected  2002

2006 margin 51-49

2004 margin 51-49

Bush margin 2004 48-51

Notes on opponents Lois Murphy ran in 2004 and 2006, in 2004, she raised $1.9 million to Gerlach’s $2.2 million; in 2006, she raised $4 million to his $3.5 million

Current opponents Bob Roggio no funding info.  Gerlach has $500K COH

Demographics 70th highest income (median = $56K)

Assessment Somewhat vulnerable,   Superribbie ranks it as the 22nd most vulnerable Republican seat.  On the DCCC list .  Not sure why Roggio has no FEC numbers

District: PA-07

Location Southeastern PA, bordering DE, including King of Prussia

Representative Joe Sestak (D)

First elected  2006

2006 margin 56-44

2004 margin NA

Bush margin 2004 47-53

Notes on opponents In 2006, Sestak ousted Curt Weldon; each raised about $3 million

Current opponents Curt Weldon has $90K COH (but, per comments, appears to not be in it), Craig Williams, no info.  Sestak has $1.7 million COH

Demographics 67th highest income (median = $56K), 41st fewest Latinos (1.3%)

Assessment Superribbie ranks it as the 36th most vulnerable Democratic seat; Sestak’s formidable fundraising advantage makes it a little less vulnerable, I  think

District: PA-08

Location The southeast corner of PA, bordering NJ

Representative Patrick Murphy (D)

First elected 2006

2006 margin 1418 votes out of 250,000

2004 margin NA

Bush margin 2004 48-51

Notes on opponents In 2006, Murphy ousted Mike Fitzpatrick; Murphy raised $2.4 million to Fitzpatrick’s $3.2

Current opponents Thomas Manion (no funding info); Murphy has $1.2 million COH

Demographics 44th highest income (median = $59K),

Assessment   Superribbie ranks it as the 22nd most vulnerable Democratic seat. On the DCCC list .  Another potentially close race, where we appear to have a huge lead in fundraising

District: PA-09

Location The central part of southern PA, bordering MD and a little of WV

Representative Bill Shuster (R)

First elected 2001  

2006 margin 60-40

2004 margin 69-30

Bush margin 2004 67-33

Notes on opponents Neither raised much

Current opponents Tony Barr who got 40% with almost no money in 2006, is running again. No funding info on Barr, but Shuster has only $188K COH, not much for an incumbent at this stage

Demographics 19th most rural (59.5%), 3rd most White (96.4%), 60th fewest Blacks (1.6%), 17th fewest Latinos (0.9%), 2nd fewest nonBlack, nonWhite, nonLatino, 42nd most Republican

Assessment  Long shot
District: PA-10

Location Northeastern PA, bordering NY and NJ

Representative Christopher  Carney (D)

First elected  2006

2006 margin 53-47

2004 margin NA

Bush margin 2004 60-40

Notes on opponents In 2006, Carney ousted Don Sherwood, spending $1.5 million to Sherwood’s $3 million

Current opponents  Dan Meuser has raised the most of several Republicans: He has $398 COH; Chris Hackett has $386K; others much less.  Carney has $766K.  

Demographics 27th most rural (55.4%), 9th most White (95.5%), 71st least Black (1.9%), 51st least Latinos (1.4%)

Assessment Very vulnerable Superribbie ranks it as the 5th most vulnerable Democratic seat. On the DCCC list .

District: PA-11

Location Eastern PA, including Scranton and Wilkes-Barre

Representative Paul Kanjorski (D)

First elected  1984

2006 margin 72-28

2004 margin 94-6 against a minor party

Bush margin 2004 47-53

Notes on opponents No money

Current opponents  Lou Barletta has $851 COH and $300K in debt (hmmmm….). Kanjorski has $1.5 million.  He should share

Demographics 97th lowest income (median = $35K)

Assessment  Safe

District: PA-12

Location An odd, thready district in southwest PA

Representative John Murtha (D)

First elected  1974

2006 margin 61-39

2004 margin unopposed

Bush margin 2004 49-51

Notes on opponents In 2006, Diana Irey raised $850K to Murtha’s $3.2 million.

Current opponents William Russell has $25K COH, Murtha has $529K

Demographics 32nd poorest (median income = $31K), 16th most Whites (95.0%).  3rd fewest Latinos (0.6%)

Assessment Safe

District: PA-13

Location Suburbs and exurbs of Philadelphia

Representative Allyson Schwartz (D)

First elected  2004

2006 margin 66-34

2004 margin 56-44

Bush margin 2004 43-56

Notes on opponents In 2004, this seat was open and Schwartz beat Melissa Brown, raising $4.5 million to Brown’s $1.9 million. In 2006, Raj Bhakta raised $400K to Schwartz’ $2.2 million

Current opponents Marina Kats has no fundraising report.  Schwartz has $1.6 million COH, she should share

Demographics Not unusual on what I track

Assessment Safe

District: PA-14

Location Pittsburgh and suburbs

Representative Mike Doyle (D)

First elected  1994

2006 margin 90-10 (against a Green)

2004 margin unopposed

Bush margin 2004 30-69

Notes on opponents NA

Current opponents No Republican; Doyle has $400K COH

Demographics 26th lowest income (median = $30K), 71st most Blacks (22.5%), 41st most Democratic

Assessment  Free ride

District: PA-15

Location Central part of eastern NJ, including Allentown and Bethlehem, bordering NJ

Representative Charlie Dent (R)

First elected  2004

2006 margin 54-43

2004 margin 59-39

Bush margin 2004 Kerry won by 786 votes out of 300,000

Notes on opponents In 2004, this was an open seat, and Dent beat Joe Driscoll, each spending about $2 million.  In 2006, Charles Dertinger raised little

Current opponents Sam Bennett has raised $194K and has $94K COH; Dent has over $500K COH.  Bennett is one of my favorite candidates.

Demographics Not unusual on what I track

Assessment  Vulnerable. Superribbie ranks it as the 32nd most vulnerable Republican seat.

District: PA-16

Location Southeastern PA, centering on Lancaster

Representative Joe Pitts (R)

First elected  1996

2006 margin 57-40

2004 margin 64-34

Bush margin 2004 61-38

Notes on opponents Lois Herr ran both times, raising about $80K the first time and $300K in 2006; Pitts raised just under $500K the first time and just over that in 2006

Current opponents Bruce Slater has just $7K COH, to Pitts’ $175K

Demographics 86th most Republican

Assessment Long shot
District: PA-17

Location South and east of central PA, including Harrisburg

Representative Tim Holden (D)

First elected 1992

2006 margin 65-35

2004 margin 59-39

Bush margin 2004 58-42

Notes on opponents In 2004, Scott Paterno raised $1 million to Holden’s $1.6 million.  The 2006 opponent raised little

Current opponents Toni Gilhooley has $31K COH to Holden’s $780K

Demographics Not unusual on what I track

Assessment Safe

District: PA-18

Location Suburbs of Pittsburgh

Representative Tim Murphy (R)

First elected 2002

2006 margin 58-42

2004 margin 63-37

Bush margin 2004 54-46

Notes on opponents Each raised about $100K, Murphy raised over $1 million each time

Current opponents Beth Hafer $106K raised, $42K COH

Brien Wall $35K raised, $16K COH

Steve O’Donnell $260K raised, $203K COH

Daniel Wholey $56K raised, $45K COH

Demographics 10th most Whites (95.4%), 77th fewest Blacks (2.0%), tied for fewest Latinos (0.6%)

Assessment Vulnerable. Superribbie ranks it as the 60th most vulnerable Republican seat.  On the DCCC list

District: PA-19

Location Southern PA including Gettysburg

Representative Todd Platts (R)

First elected  2000

2006 margin 64-33

2004 margin 91-4 against a Green

Bush margin 2004 64-36

Notes on opponents Phillip Avilo raised $175K against Platts’ $375K

Current opponents Phil Avilo , no fundraising info

Demographics 68th most Whites (92.2%)

Assessment Long shot

District: RI-01

Location Northern and eastern RI, bordering MA and CT

Representative Patrick Kennedy (D)

First elected  1994

2006 margin 62-36

2004 margin 64-36

Bush margin 2004 36-62

Notes on opponents In 2004, David Rogers and Kennedy each raised about $2 million.  In 2006, his opponent raised little

Current opponents None; Kennedy has $700K COH, he should share

Demographics Not unusual on what I track

Assessment safe

District: RI-02

Location Most of the state

Representative Jim Langevin (D)

First elected  2000

2006 margin 73-27 against an Independent

2004 margin 75-21

Bush margin 2004 41-57

Notes on opponents  No money for Republicans

Current opponents None

Demographics Not unusual on what I track

Assessment Safe

Congressional races round 2: Ohio and Oklahoma

Continuing through the alphabet

Ohio has 18 representatives: 11 R, 7 D

Filing deadline was Jan 4, primary was March 4

Oklahoma has 5 representatives: 4 R and 1 D

Filing deadline is June 4, primary is July 29

District: OH-01

Location Southwestern OH, bordering IN and KY, including Cincinnati

Representative Steve Chabot (R)

First elected  1994

2006 margin 52-48

2004 margin 60-40

Bush margin 2004 51-49

Notes on opponents In 2004, his opponent raised little; in 2006, John Cranley raised $2 million to Chabot’s $3 million

Current opponents   Steven Dreihaus . Thru 2/13, Chabot has raised $1.1 million and Dreihaus $516K; COH $1million and $430K

Demographics 27th fewest Latinos (1.1%)

Assessment Vulnerable. Superribbie ranks it the 19th most vulnerable Republican seat; Dreihaus is minority Whip in the State House.

District: OH-02

Location Central part of southern OH, bordering KY

Representative Jean Schmidt (R)

First elected 2005

2006 margin 50-49

2004 margin NA

Bush margin 2004 64-36

Notes on opponents In 2006, Victoria Wulsin raised $1 million to Schmidt’s $2 million

Current opponents Victoria Wulsin has raised $546K, to Schmidt’s $414K; COH is $170K and $102K, respectively.

Demographics 22nd fewest Latinos (1.0%), 61st most Republican

Assessment Highly vulnerable. On DCCC list , Superribbie ranks it 16th most vulnerable Republican seat. How often is a challenger ahead of an incumbent in fundraising?  OTOH, a recent poll showed Schmidt well ahead.

District: OH-03

Location Southwestern OH, including Dayton

Representative Mike Turner (R)

First elected  2002

2006 margin 59-41

2004 margin 62-38

Bush margin 2004 54-45

Notes on opponents each raised about $400K to $500K, Turner about $1 million each time

Current opponents Jane Mitakides has raised $85K to Turner’s $741K; COH is $75K and $483K.

Demographics  26th fewest Latinos (1.1%)

Assessment Slightly vulnerable Superribbie ranks it 74th most vulnerable Republican seat.

District: OH-04

Location Slightly north and west of central OH

Representative Jim Jordan (R)

First elected  2006

2006 margin 60-40

2004 margin NA

Bush margin 2004 65-34

Notes on opponents In 2006, this was an open seat and Rick Seferd raised $161K to Jordan’s $1.3 million

Current opponents Mike Carroll .  No funding data.

Demographics 33rd fewest Latinos (1.2%), 50th most Republican

Assessment Long shot
District: OH-05

Location Northwestern OH, bordering MI and IN

Representative Bob Latta (R)

First elected  Appointed

2006 margin NA

2004 margin NA

Bush margin 2004 61-39

Notes on opponents NA

Current opponents George Mays . No funding data

Demographics 41st most rural (51.1%), 36th fewest Blacks (1.1%)

Assessment Long shot

District: OH-06

Location Southeastern OH, a long narrow strip along the whole of the border with WV

Representative Charlie Wilson (D)

First elected  2006

2006 margin 62-38

2004 margin NA

Bush margin 2004 51-49

Notes on opponents In 2006, this was an open seat, and Wilson spent $1.8 million, his opponent Chuck Blasdell spent $1 million

Current opponents Rich Stobbs, who has an inactive website and has raised no money.

Demographics 47th most rural (50.0%),  62nd poorest (median income = $33K), 11th most White (95.2%), 11th fewest Latinos (0.8%)

Assessment Safe. Although Superribbie ranks it 41st most vulnerable Democratic seat, Stobbs does not appear to be actively running.

District: OH-07

Location Just south of central OH

Representative  David Hobson (R) retiring

First elected  1990

2006 margin 61-39

2004 margin 65-35

Bush margin 2004 57-43

Notes on opponents Neither raised much

Current opponents Sharon Neuhardt has raised $70K; the Republican (Austria) has raised $400K

Demographics 26th fewest Latinos (1.1%)

Assessment Slightly vulnerable. Superribbie ranks it 47th most vulnerable Republican seat

District: OH-08

Location Central part of western OH, bordering IN.

Representative John Boehner (R)

First elected  1990

2006 margin 64-36

2004 margin 69-31

Bush margin 2004 64-35

Notes on opponents Neither raised money

Current opponents Nick von Stein . No funding info.

Demographics 73rd most Whites (91.8%), 42nd fewest Latinos (1.3%), 74th most Republican

Assessment Long shot.

District: OH-09

Location Northern OH, bordering Lake Erie, including Toledo

Representative  Marcy Kaptur (D)

First elected  1982

2006 margin 74-36

2004 margin 68-32

Bush margin 2004 42-58

Notes on opponents In 2004, Larry Kaczala raised $255K to Kaptur’s $615K

Current opponents Bradley Leavitt. No funding info.

Demographics Not unusual on what I track

Assessment Safe

District: OH-10

Location Northern OH, bordering Lake Erie, including part of Cleveland

Representative Dennis Kucinich (D)

First elected  1996

2006 margin 66-34

2004 margin 60-34

Bush margin 2004 41-58

Notes on opponents In 2004, Edward Herman raised $300K to Kucinich’s $400K.  The 2006 opponent raised little

Current opponents  Jim Trakas has raised very little, Kucinich has over $300K COH.

Demographics Not unusual on what I track

Assessment Safe

District: OH-11

Location Cleveland and eastern suburbs

Representative Stephanie Tubbs Jones (D)

First elected  1998

2006 margin 83-17

2004 margin Unopposed

Bush margin 2004 18-81

Notes on opponents No money

Current opponents  Thomas Pekarek, no funding info

Demographics 52nd lowest income (median = $32K), 63rd fewest Whites (38.8%), 18th most Blacks (55.5%), 18th most Democratic

Assessment Safe

District: OH-12

Location Central OH, including part of Columbus

Representative Pat Tiberi (R)

First elected  2000

2006 margin 57-43

2004 margin 62-38

Bush margin 2004 51-49

Notes on opponents In 2006, Bob Shamanasky raised $1.6 million to Tiberi’s $3 million

Current opponents David Robinson has raised about $10K to Tiberi’s $1 million

Demographics Not unusual on what I track

Assessment Long shot

District: OH-13

Location Northern OH, including Akron

Representative Betty Sutton (D)

First elected  2006

2006 margin 61-39

2004 margin NA

Bush margin 2004 44-56

Notes on opponents Craig Foltin raised $600K to Sutton’s $1.3 million

Current opponents David Potter. No funding info.

Demographics Not unusual on what I track

Assessment Safe

District: OH-14

Location Northeastern corner of OH, bordering PA and Lake Erie

Representative Steven LaTourette (R)

First elected  1994

2006 margin 58-39

2004 margin 63-37

Bush margin 2004 53-47

Notes on opponents In 2006, Lewis Katz raised $200K to LaTourette’s $1.4 million.  In 2004, Capri Cafaro raised $2 million to LaTourrette’s $2.4 million

Current opponents William O’Neill has raised $200K ($94K COH) to LaTourrette’s $700K ($570K COH)

Demographics 30th fewest in poverty (5.7%), 30th most Whites (93.8%), 42nd fewest Latinos (1.3%),

Assessment Slightly vulnerable. On DCCC list , Superribbie ranks it 59th most vulnerable Republican seat

District: OH-15

Location Central OH, including Columbus

Representative Deborah Pryce retiring (R)

First elected  1992

2006 margin 1,155 votes out of 220,000

2004 margin 60-40

Bush margin 2004 2,000 votes of 300,000

Notes on opponents In 2006, Mary Jo Kilroy raised $2.7 million to Pryce’s $4.7 million

Current opponents   Mary Jo Kilroy who came so close in 2006, has raised $917K ($713K COH); the Republican, Steve Stivers – $505K raised and $404 COH

Demographics Not unusual on what I track

Assessment Highly vulnerable. On DCCC list . Superribbie ranks it 5th most vulnerable Republican seat

District: OH-16

Location North and east of central OH

Representative Ralph Regula (R) retiring

First elected  1972

2006 margin 58-42

2004 margin 67=33

Bush margin 2004 54-46

Notes on opponents Neither raised much

Current opponents Democrat John Boccieri will run against Republican Kirk Schuring.  Boccieri has raised $467K ($330K COH0; Schuring raised $327K ($84K COH).

Demographics 17th fewest Latinos (0.9%)

Assessment Vulnerable On DCCC list , Superribbie ranks it 18th most vulerable Republican seat; plus Boccieri has a big lead in COH, and is raising more money

District: OH-17

Location  Northeastern OH, bordering PA, including Youngstown

Representative Tim Ryan (D)

First elected  2002

2006 margin 80-20

2004 margin 77-23

Bush margin 2004 33-67

Notes on opponents Neither raised much

Current opponents Duane Grassell. No funding info.

Demographics 67th fewest Latinos (1.6%)

Assessment Safe

District: OH-18

Location South and east of central OH

Representative Zack Space (D)

First elected  2006

2006 margin 62-38

2004 margin NA

Bush margin 2004 57-43

Notes on opponents Joy Padgett raised $850K to Space’s $1.6 million

Current opponents Fred Dailey has raised $111K ($48K COH and $30K in debt).  Space has raised $1.2 million ($811K COH, $11K debt)

Demographics 24th most rural (56.7%), 7th most White (95.9%), tied for least Latinos (0.6%)

Assessment  Slightly vulnerable. It’s on DCCC list , Superribbie ranks it 28th most vulnerable Democratic seat. But Space has a huge fundraising edge, and won easily in 2006

District: OK-01

Location Shaped like a key standing on end, centered on Tulsa in northeast OK, a tiny bit of border with KS

Representative John Sullivan (R)

First elected  2002

2006 margin 64-31

2004 margin 60-38

Bush margin 2004 65-35

Notes on opponents In 2004, Doug Dodd raised $300K to Sullivan’s $1 million.  In 2006, Alan Gentges raised little

Current opponents

Demographics 61st most Republican

Assessment

District: OK-02

Location Eastern OK, bordering MO and AR

Representative Dan Boren (D)

First elected  2004

2006 margin 73-27

2004 margin 66-34

Bush margin 2004 59-41

Notes on opponents Neither raised much

Current opponents None

Demographics 9th most rural (64.4%), 12th lowest income (median = $28K), 11th most nonWhite, nonBlack, NonLatino (mostly 16.8% American Indian)

Assessment Safe.  Boren is rather conservative, but it’s a safe Democratic seat in a Republican district and a Republican state

District: OK-03

Location The panhandle of OK, and east to Oklahoma City suburbs, borders TX, NM, CO, and KS

Representative Frank Lucas (R)

First elected  1994

2006 margin 67-33

2004 margin 82-18 (vs. minor party)

Bush margin 2004 72-28

Notes on opponents No money

Current opponents None

Demographics 54th most rural (49.3%), 53rd lowest income (median = $32K), 18th most Republican

Assessment Long shot
District: OK-04

Location Southwestern OK, bordering TX, including suburbs of Oklahoma City

Representative Tom Cole (R)

First elected  2002

2006 margin 65-35

2004 margin 78-22 (against a minor party)

Bush margin 2004 67-33

Notes on opponents No money

Current opponents None

Demographics 61st most Republican

Assessment Long shot

District: OK-05

Location Oklahoma City and some points southeast of there

Representative Mary Fallin (R)

First elected  2006

2006 margin 60-37

2004 margin NA

Bush margin 2004 64-36

Notes on opponents David Hunter raised $400K to Fallon’s $1.6 million, running for this open seat in 2006

Current opponents Bert Smith . No funding info.  Fallon has about $350K COH

Demographics 78th lowest income (median = $34K), 74th most Republican

Assessment Long shot

Congressional races round 2: North Carolina, North Dakota

Continuing through the alphabet

North Carolina has 13 representatives: 6 Republicans and 7 Democrats

The filing deadline was Feb 29, primary is May 6

North Dakota has 1 representative: A Democrat

Filing deadline is April 11, primary is June 10

District: NC-01

Location Northeast NC, bordering VA and Pimlico Sound

Representative George Butterfield (D)

First elected  2004

2006 margin unopposed

2004 margin 64-36

Bush margin 2004 42-57

Notes on opponents No money

Current opponents  None

Demographics 39th most rural (52.3$), 15th lowest income (median = $28K), 74th fewest Whites (44.4%), 24th most Blacks (50.5%)

Assessment  Unopposed

District: NC-02

Location Central NC, including Raleigh

Representative Bob Etheridge (D)

First elected  1996

2006 margin 67-33

2004 margin 62-38

Bush margin 2004 54-46

Notes on opponents In 2004, Billy Creech raised $130K to Etheridge’s $1 million. In 2006, Dan Mansell raised little

Current opponents None

Demographics 43rd most rural (50.5%)

Assessment Unopposed

District: NC-03

Location Most of the Atlantic coast of NC

Representative Walter Jones (R)

First elected  1994

2006 margin 69-31

2004 margin 71-29

Bush margin 2004 68-32

Notes on opponents Neither raised much

Current opponents   Marshall Adame

Demographics 42nd most Republican

Assessment Long shot

District: NC-04

Location The ‘research triangle’ including Chapel Hill, Durham, and Cary

Representative David Price (D)

First elected  1996

2006 margin 65-35

2004 margin 64-36

Bush margin 2004 44-55

Notes on opponents Neither raised much

Current opponents Augustus Cho

Demographics 67th highest income (median = $54K)

Assessment Safe

District: NC-05

Location Northwest NC, bordering TN and VA

Representative Virginia Foxx (R)

First elected  2004

2006 margin 57-43

2004 margin 59-41

Bush margin 2004 66-33

Notes on opponents In 2004, Jim Harrell raised $400K to Foxx’s $1.2 million.  In 2006, Roger Sharpe raised $100K

Current opponents Roy Carter

Demographics 22nd most rural (57.1%), 42nd most Republican

Assessment Long shot

District: NC-06

Location Central NC

Representative Howard Coble (R)

First elected  1984

2006 margin 71-29

2004 margin 73-27

Bush margin 2004 69-30

Notes on opponents Neither raised much

Current opponents Teresa Sue Bratton

Jay Ovittore and

Johnny Carter

Demographics 56th most rural (48.4%), 25th most Republican

Assessment This is a solidly Republican seat, but Coble is getting old (born 1931) and hasn’t had a serious fight in a while…

District: NC-07

Location Southern NC, bordering SC and the Atlantic

Representative Mike McIntyre (D)

First elected  1996

2006 margin 73-27

2004 margin 73-27

Bush margin 2004 56-44

Notes on opponents Neither raised much

Current opponents Will Breazeale

Demographics 30th most rural (54.9%), 70th most Blacks (23.1%)

Assessment Safe

District: NC-08

Location Central part of southern NC, bordering SC,

Representative Robin Hayes (R)

First elected  1998

2006 margin 329 votes out of 121,000

2004 margin 56-44

Bush margin 2004 54-45

Notes on opponents In 2006, Larry Kissell raised $800K to Hayes’ $2.5 million; in 2004, Beth Troutman raised $200K to Hayes’ $1.6 million

Current opponents Larry Kissell

Demographics 58th most Blacks (26.6%)

Assessment Vulnerable. Superribbie ranks this the 20th most vulnerable Republican seat, and it is on the DCCC list

District: NC-09

Location A strange shaped district in southern NC, bordering SC

Representative Susan Myrick (R)

First elected  1994

2006 margin 67-33

2004 margin 70-30

Bush margin 2004 63-36

Notes on opponents Neither raised much

Current opponents Ross Overby

Harry Taylor , possibly Bill Glass

Demographics 73rd highest income (median = $55K) (3rd highest in the deep south, after GA-06 and GA-07)

Assessment Long shot

District: NC-10

Location Western NC, but east of NC-11, running from TN to SC

Representative Patrick McHenry (R)

First elected  2004

2006 margin 62-38

2004 margin 64-36

Bush margin 2004 67-33

Notes on opponents Neither raised money

Current opponents Steve Ivester

Demographics 46th most rural (50.1%), 42nd most Republican

Assessment  Long shot

District: NC-11

Location Westernmost NC, bordering TN, GA, and SC

Representative Heath Shuler (D)

First elected  2006

2006 margin 54-46

2004 margin NA

Bush margin 2004 57-43

Notes on opponents In 2006, Shuler ousted Charles Taylor, raising $ 1.8 million to Taylor’s $4.4 million

Current opponents John Armor, Carl Mumpower

Demographics 25th most rural (56.1%), 90th lowest income (median = $35K)

Assessment Vulnerable. Superribbie ranks it 14th most vulnerable Democratic seat.

District: NC-12

Location A really weird, snaky district, SC’s “Black” district.  Includes Charlotte and Winston Salem.  It was the subject of 4 Supreme Court cases. Still, it borders the NC5,6,8,9, and 10th

Representative Mel Watt (D)

First elected  1992

2006 margin 67-33

2004 margin 67-33

Bush margin 2004 37-63

Notes on opponents Ada Fisher ran in 2004 and 2006, in 2004 he raised $100K, in 2006, $400K.  Watt raised about $500K each time

Current opponents Ada Fisher again

Demographics 28th most Blacks (44.6%)

Assessment Safe

District: NC-13

Location Central part of northern NC, bordering VA

Representative Brad Miller (D)

First elected  2002

2006 margin 64-36

2004 margin 59-41

Bush margin 2004 47-52

Notes on opponents In 2006, Vernon Robinson raised $2.2 million to Miller’s $1.8 million.  In 2004, Virginia Johnson raised $350K to Johnson’s $1.2 million

Current opponents None declared

Demographics Not unusual on what I track

Assessment  safe

District: ND-AL

Location The whole state

Representative Earl Pomeroy (D)

First elected  1992

2006 margin 66-34

2004 margin 60-40

Bush margin 2004 63-34

Notes on opponents In 2004, Duane Sand raised $1 million to Pomeroy’s $1.8 million; the 2006 opponent raised little

Current opponents None declared

Demographics 73rd most rural (44.2%), 18th fewest Blacks (0.6%), 33rd fewest Latinos (1.2%)

Assessment Safe

Congressional races round 2: New York

continuing through the alphabet

NY has 29 representatives: 23 Democrats and 6 Republicans (5 of whom are on the DCCC list

Filing deadline is July 17, primary is Sept 9

District: NY-01

Location Eastern Long Island

Representative Tim Bishop (D)

First elected  2002

2006 margin 62-38

2004 margin 56-44

Bush margin 2004 2,000 votes out of 300,000

Notes on opponents In 2004, William Manger raised $1.3 million to Bishop’s $1.9 million; in 2006, Italo Zinzi raised $300K to Bishop’s $1.1 million

Current opponents Lee Zeldin

Demographics 32nd highest income (median = $62K),

Assessment Safe

District: NY-02

Location Central Long Island

Representative  Steve Israel (D)

First elected  2000

2006 margin 70-30

2004 margin 67-33

Bush margin 2004 45-53

Notes on opponents Neither raised much

Current opponents None declared

Demographics 11th highest income (median = $71K)

Assessment Safe

District: NY-03

Location More of central Long Island, especially the south shore

Representative Peter King (R)

First elected  1992

2006 margin 56-44

2004 margin 63-37

Bush margin 2004 52-47

Notes on opponents In 2004, Blair Mathies raised $200K to King’s $500K; in 2006, David Meijas raised $900K to King’s $2 million

Current opponents None declared

Demographics 12th highest income (median = $71K), 84th fewest Blacks (2.1%)

Assessment On the DCCC list , but we need a candidate!

District: NY-04

Location Western part of southern Long Island (i.e. close to NYC)

Representative Carolyn McCarthy (D)

First elected  1996

2006 margin 65-35

2004 margin 63-37

Bush margin 2004 44-55

Notes on opponents In 2004, James Garner raised $300K to McCarthy’s $1.7 million.  In 2006, Martin Blessinger raised $100K to McCarthy’s $1.4 million

Current opponents None declared

Demographics 20th highest income (median = $67K)

Assessment Safe

District: NY-05

Location Northern part of western Long Island, and part of Queens

Representative Gary Ackerman (D)

First elected  1983

2006 margin unopposed

2004 margin 71-28

Bush margin 2004 36-63

Notes on opponents No money

Current opponents None declared

Demographics 22nd fewest veterans (6.7%), 7th most nonWhite, nonBlack, nonLatinos (mostly Asians, who are 24.5% of the population)

Assessment Safe

District: NY-06

Location Southeastern part of Queens, NYC

Representative Gregory Meeks (D)

First elected 1998  

2006 margin unopposed

2004 margin unopposed

Bush margin 2004 15-84

Notes on opponents NA

Current opponents None declared

Demographics 17th fewest veterans (6.2%), 5th fewest Whites (12.8%), 12th most Blacks (52.1%), 26th most  most nonWhite, nonBlack, nonLatinos (including 6.1% multiracial), 6th most Democratic

Assessment Safe

District: NY-07

Location Some of Queens, some of Bronx, NYC

Representative Joseph Crowley (D)

First elected  1998

2006 margin 84-16

2004 margin 81-19

Bush margin 2004 25-74

Notes on opponents Neither raised money

Current opponents None declared

Demographics 19th fewest veterans (6.4%), 38th fewest Whites (27.6%), 35th most Latinos (39.5%),  28th most  most nonWhite, nonBlack, nonLatinos (12.8% Asian), 27th most Democratic (tie with NY08)

Assessment Safe

District: NY-08

Location West side of Manhattan, part of lower Manhattan, southern Brooklyn

Representative Jerrold Nadler (D)

First elected 1992

2006 margin 85-14

2004 margin 81-19

Bush margin 2004 27-72

Notes on opponents In 2004, Peter Hort raised $140K to Nadler’s $850K

Current opponents None declared

Demographics 9th fewest veterans (5.1%), 38th most nonWhite, nonBlack, nonLatinos (11% Asian)

Assessment Safe.  

District: NY-09

Location Odd bits of Queens and Brooklyn, NYC

Representative Anthony Weiner (D)

First elected  1998

2006 margin unopposed

2004 margin 71-29

Bush margin 2004 44-56

Notes on opponents No money

Current opponents None declared

Demographics 28th fewest veterans (7.1%), 25th most nonWhite, nonBlack, nonLatinos (14% Asian)

Assessment Safe

District: NY-10

Location A V shaped portion of Brooklyn, NYC

Representative Edolphus Towns (D)

First elected  1982

2006 margin 92-6  (! and his opponent was a Republican!)

2004 margin 91-7 (!)

Bush margin 2004 13-86

Notes on opponents No money

Current opponents None declared, although there is a primary challenger

Demographics 27th lowest income (median = $30K), 11th fewest veterans (5.3%), 8th fewest Whites (16.2%), 9th most Blacks (60.2%), 3rd most Democratic

Assessment You’re kidding, right? He might lose a primary, though

District: NY-11

Location Central Brooklyn, NYC

Representative Yvette Clarke (D)

First elected  2006

2006 margin 90-8

2004 margin NA

Bush margin 2004 13-86

Notes on opponents No money

Current opponents None declared

Demographics 26th most in poverty (23.2%), 4th fewest veterans (4.1%), 25th fewest Whites (21.4%), 12th most Blacks (58.5%), 4th most Democratic

Assessment Safe

District: NY-12

Location Bits of Queens, Manhattan and Brooklyn (this one won a ‘contest’ for most convoluted map of a district)

Representative Nydia Velazquez (D)

First elected  1992

2006 margin 90-10

2004 margin 86-14

Bush margin 2004 19-80

Notes on opponents No money

Current opponents None declared

Demographics 19th lowest income (median = $29K), 3rd fewest veterans (4.0%), 25th fewest Whites (23.3%), 24th most Latinos (48.5%), 18th most nonWhite, nonBlack, nonLatino (15.9% Asian), 15th most Democratic

Assessment Safe

District: NY-13

Location Staten Island and a bit of Brooklyn, NYC

Representative Vito Fosella (R)

First elected  1997

2006 margin 57-43

2004 margin 59-41

Bush margin 2004 55-45

Notes on opponents In 2004, Frank Barbaro raised $400K to Fosella’s $1.1 million; in 2006, Stephen Harrison raised $100K to Fosella’s $1.6 million

Current opponents Steve Harrison , who ran in 2006; Domenic Recchia.

Demographics Not unusual on what I track

Assessment On the DCCC list . superribbie ranks this as the 34th most vulnerable Republican seat.  We can win this one!

District: NY-14

Location East side of Manhattan, and western Queens

Representative  Carolyn  Maloney (D)

First elected  1992

2006 margin 84-16

2004 margin 81-19

Bush margin 2004 24-74

Notes on opponents neither raised much

Current opponents None declared

Demographics 15th fewest veterans (6.0%)

Assessment Safe

District: NY-15

Location Mostly Harlem, NYC, but also bits of Queens

Representative Charles Rangel (D)

First elected 1970

2006 margin 94-6 (! against a Republican)

2004 margin 91-7

Bush margin 2004 9-90

Notes on opponents No money

Current opponents  None declared

Demographics 12th lowest income (median = $28K), 3rd most in poverty (30.5%), 6th fewest veterans (4.6%), 9th fewest Whites (16.4%), 37th most Blacks (30.5%), 25th most Latinos (47.9%), tied for most Democratic

Assessment Safe

District: NY-16

Location South Bronx, NYC

Representative Jose Serrano (D)

First elected  1990

2006 margin 95-5 (!)

2004 margin 95-5 (!)

Bush margin 2004 10-89

Notes on opponents The same guy ran twice, with no money

Current opponents None declared

Demographics Lowest income in the USA (median = $19K), most in poverty (42.2%), 2nd fewest veterans (3.9%), fewest Whites (2.9%), 45th most Blacks (30.3%), 15th most Latinos (62.8%), tied for most Democratic

Assessment Safe

District: NY-17

Location Northern  Bronx, a bit of Westchester, but mostly Rockland county, the part of NY on the west side of the Hudson

Representative Elliot Engel (D)

First elected  1998

2006 margin 76-24

2004 margin 76-22

Bush margin 2004 33-67

Notes on opponents No money

Current opponents  None declared

Demographics 44th most Blacks (30.4%)

Assessment Safe

District: NY-18

Location Southern Westchester (just north of NYC)

Representative Nita Lowey (D)

First elected  1988

2006 margin 71-29

2004 margin 70-30

Bush margin 2004 42-58

Notes on opponents Richard Hoffman ran in 2004 and 2006, and raised less than $100K each time; Lowey raised about $1.5 million each time

Current opponents None declared

Demographics 19th highest income (median = $69K).

Assessment  Safe

District: NY-19

Location Northern suburbs and exurbs of NYC, bordering on NJ, a little of PA, and CT

Representative  John Hall (D)

First elected  2006

2006 margin 51-49

2004 margin NA

Bush margin 2004 54-45

Notes on opponents In 2006, Hall ousted Sue Kelly, with $1.6 million to her $2.5 million

Current opponents Kieran Lalor

Demographics 24th highest income (median = $64K)

Assessment Somewhat vulnerable. On the DCCC list , superribbie ranks this as the 15th most vulnerable Democratic seat.  However, Lalor looks like a nut job, so if there’s no better opponent….Several people have rule out running, see the WIKI

District: NY-20

Location Eastern part of northern NY, mostly around Albany

Representative Kirsten Gillibrand (D)

First elected  2006

2006 margin 53-47

2004 margin NA

Bush margin 2004 54-46

Notes on opponents In 2006, Gillibrand ousted John Sweeney, raising $2.5 million to his $3.5 million

Current opponents Sandy Treadwell, Richard Wager, John Wallace, Michael Rocque, possibly John Sweeney

Demographics 38th most Whites (93.4%)

Assessment Vulnerable.  On the DCCC list , superribbie ranks this as the 8th most vulnerable Democratic seat.

District: NY-21

Location Albany, Troy, Schenectady and points west of there

Representative  Michael McNulty (D) retiring

First elected  1988

2006 margin 72-20

2004 margin 71-29

Bush margin 2004 43-55

Notes on opponents No money

Current opponents The Democrat is Tracey Brooks ; (others, too, please see the Wiki page, which I just updated) no declared Republican

Demographics Not unusual on what I track

Assessment On the DCCC list , superribbie ranks this as the 41st most vulnerable Democratic seat. On the other hand, if no Republicans run, it’s safe

District: NY-22

Location If you picture where NY bends to the west, you’ll have the 22nd. Borders PA, includes Poughkeepsie (NYC exurb) in the east and Binghamton and Ithaca in the west

Representative Maurice Hinchey (D)

First elected  1992

2006 margin unopposed

2004 margin 67-33

Bush margin 2004 45-54

Notes on opponents No money

Current opponents  George Phillips, Bruce Layman

Demographics Not unusual on what I track

Assessment  Safe

District: NY-23

Location Northernmost NY, bordering Canada and VT

Representative John McHugh (R)

First elected  1992

2006 margin 63-37

2004 margin 71-29

Bush margin 2004 51-47

Notes on opponents In 2006, Robert Johnson raised $160K to McHugh’s $750K

Current opponents Mike Oot

Demographics  8th most rural (65.3%),

Assessment Long shot

District: NY-24

Location Rome, Utica, and Geneva, near Lake Ontario

Representative Michael Arcuri (D)

First elected  2006

2006 margin 54-45

2004 margin NA

Bush margin 2004 53-47

Notes on opponents In 2006, this was an open seat; Arcuri raised $2 million and his opponent $1.5 million

Current opponents None declared

Demographics Not unusual on what I track

Assessment Slightly vulnerable. On the DCCC list ; superribbie ranks this as the 38th most vulnerable Democratic seat. Of course, with no opponent, it’s safe

District: NY-25

Location From Lake Ontario east to Syracuse

Representative  Jim Walsh (R) retiring

First elected  1988

2006 margin 51-49

2004 margin Unopposed by Democrats

Bush margin 2004 48-50

Notes on opponents In 2006, Dan Maffei raised $900K to $1.8 million for Walsh

Current opponents Dan Maffei is the Democrat, no announced Republicans

Demographics Not unusual on what I track

Assessment Highly vulnerable.  On the DCCC list . superribbie ranks this as the second most vulnerable Republican seat. And, if no one runs….it’s a gimmee!

District: NY-26

Location Just south of Lake Ontario, east of Lake Erie

Representative  Tom Reynolds retiring

First elected  1998

2006 margin 52-48

2004 margin 56-44

Bush margin 2004 55-43

Notes on opponents Jack Davis ran in 2004 and 2006. In 2006, he raised $2.4 million to Reynolds’ $5 million; in 2004, $1.4 million to $2.5 million

Current opponents Democrats: Jon Powers

Alice Kryzan .  Reynolds just announced his retirement, and Davis is considering running again, as well

Demographics 55th most Whites (92.3%)

Assessment On the DCCC list ; superribbie ranks this as the 27th most vulnerable Republican seat

District: NY-27

Location South and east of Lake Erie, including Buffalo

Representative Brian Higgins (D)

First elected  2004

2006 margin 79-21

2004 margin 51-49

Bush margin 2004 45-54

Notes on opponents In 2004, this was an open seat and Higgins beat Nancy Naples, each raising about $1.5 million.  In 2006, Michael McHale raised little

Current opponents None declared

Demographics Not unusual on what I track

Assessment Somewhat vulnerable. On the DCCC list .  But, again, no opponent, so….

District: NY-28

Location The shores of Lake Ontario, a long, narrow strip

Representative Louise Slaughter (D)

First elected  1986

2006 margin 73-27

2004 margin 73-25

Bush margin 2004 36-63

Notes on opponents Neither raised money

Current opponents None declared

Demographics 48th lowest income (median = $32K)

Assessment Safe

District: NY-29

Location Most of the part of NY that borders PA

Representative Randy Kuhl (R)

First elected  2004

2006 margin 51-49

2004 margin 51-41

Bush margin 2004 56-42

Notes on opponents In 2006, Eric Massa raised about $1.5 million, as did Kuhl

Current opponents Eric Massa

Demographics 30th most Whites (92.5%), 51st fewest Latinos (1.4%)

Assessment Vulnerable. superribbie ranks this as the 14th most vulnerable Republican seat

Congressional races round 2: New Jersey and New Mexico

Continuing through the alphabet

NJ has 13 representatives: 7 Democrats and 6 Republicans

Filing deadline April 7, primary June 3

NM has 3 representatives: 2 Republicans and 1 Democrat

Filing deadline was Feb 12, primary is June 3

District: NJ-01

Location A T shaped district in southwestern NJ, bordering PA and a tiny bit of DE

Representative Robert Andrews (D) may retire to run for senate

First elected 1990

2006 margin unopposed

2004 margin 75-25

Bush margin 2004 39-61

Notes on opponents In 2004, Daniel Hutchison raised $200K to Andrews $800K

Current opponents No declared Republicans

Demographics Not unusual on what I track

Assessment Safe for Democrats

District: NJ-02

Location Southernmost NJ, on the Delaware Bay and Atlantic

Representative Frank LoBiondo (R)

First elected  1994

2006 margin 62-36

2004 margin 65-33

Bush margin 2004 50-49

Notes on opponents neither raised money

Current opponents None declared

Demographics Not unusual on what I track

Assessment Long shot

District: NJ-03

Location The southernmost of several CDs that stretch east-west across NJ, this one from the Atlantic to PA.

Representative Jim Saxton (R) retiring

First elected  1984

2006 margin 58-41

2004 margin 63-35

Bush margin 2004 51-49

Notes on opponents In 2006, Rich Sexton raised $161K to Saxton’s $1.3 million

Current opponents John Adler

Demographics 20th fewest in poverty (5.1%)

Assessment Vulnerable.  With Saxton out, this swing district is prime pickup territory.  It’s on the DCCC list , and superribbie ranks it the most vulnerable seat.

District: NJ-04

Location Another east west strip, more or less in the middle of the state, including Trenton.  Bordering PA and the Atlantic

Representative Christopher Smith (R)

First elected  1980

2006 margin 66-33

2004 margin 67-32

Bush margin 2004 56-44

Notes on opponents Neither raised much

Current opponents Josh Zeitz

Demographics 63rd highest income (median = $54K)

Assessment Slightly vulnerable superribbie ranks this 77 of all Republican seats

District: NJ-05

Location Northernmost NJ, bordering PA and NY, including NYC suburbs

Representative Scott Garrett (R)

First elected  2002

2006 margin 55-44

2004 margin 58-41

Bush margin 2004 57-43

Notes on opponents Each raised about $500K, Garrett about $1 million in each

Current opponents Dennis Shulman and

Camille Abate

Demographics 6th highest income (median = $73K), 55th fewest Blacks (1.5%)

Assessment Somewhat vulnerable. superribbie ranks this 55th of all Republican seats.  Garrett’s winning percentage is shrinking, he did no better than Bush in 04, and that won’t be enough in ’08.

District: NJ-06

Location A strange, thready district, running from a NYC suburb (Plainfield) south and east to Long Beach and then south to Asbury Park

Representative Frank Pallone (D)

First elected  1988

2006 margin 69-30

2004 margin 67-31

Bush margin 2004 43-57

Notes on opponents Neither raised money

Current opponents None declared

Demographics 67th highest income (median = $56K)

Assessment Safe

District: NJ-07

Location Another strange shape, running east west, but shaped like the Greek letter ?.

Representative Michael Ferguson (R) retiring

First elected  2000

2006 margin 49-48

2004 margin 57-42

Bush margin 2004 53-47

Notes on opponents In 2006, Linda Stender raised $1.9 million to Ferguson’s $3 million; in 2004, Steve Brozak raised $800K to Ferguson’s $2.8 million

Current opponents Linda Stender is running again, as is Upendra Chivakula and a few Republicans

Demographics 4th wealthiest (median income = $75K)

Assessment Vulnerable. superribbie ranks this 8th of all Republican seats, and it’s on the DCCC list .  This is a competitive race near NYC, so all you NYC kossacks with time on your hands… this is a spot (but don’t ignore our own Vito Fosella, NY-13). Prime pickup material – Stender almost beat a fairly moderate Republican incumbent.  

District: NJ-08

Location More NYC suburbs, including Wayne, Patterson, and West Orange

Representative Bill Pascrell (D)

First elected   1996

2006 margin 71-28

2004 margin 69-29

Bush margin 2004 41-59

Notes on opponents In 2006, Jose Sandoval raised $200K to Pascrell’s $1 million; in 2004, George Aijan raised $100K to Pascrell’s $900K

Current opponents None declared

Demographics 41st fewest veterans 8.3%)

Assessment Safe

District: NJ-09

Location Close NYC suburbs

Representative Steve Rothman (D)

First elected  1996

2006 margin 71-28

2004 margin 68-32

Bush margin 2004 41-59

Notes on opponents Neither raised much

Current opponents None declared

Demographics 48th fewest veterans (8.6%)

Assessment safe

District: NJ-10

Location Newark, and some NYC suburbs

Representative Donald Payne (D)

First elected  1988

2006 margin unopposed

2004 margin No major party opposition

Bush margin 2004 18-82

Notes on opponents NA

Current opponents None declared

Demographics 25th fewest Whites (56.4%), 16th most Blacks (21.4%), 15th most Democratic

Assessment Safe

District: NJ-11

Location Central northern NJ, including Dover

Representative Rodney Freylinghuysen (R)

First elected  1994

2006 margin 62-37

2004 margin 68-31

Bush margin 2004 58-42

Notes on opponents Neither raised money

Current opponents Tom Wyka , who lost in 2006

Demographics 2nd highest income (median = $79K)

Assessment Long shot

District: NJ-12

Location Another east west strip, from north of Trenton (on the PA border) to NYC suburbs in the east, and almost to the Atlantic

Representative Rush Holt (D)

First elected 1998

2006 margin 66-34

2004 margin 59-40

Bush margin 2004 46-54

Notes on opponents In 2004, Bill Spadea raised $350K to Holt’s $1.6 million.  In 2006, Joseph Sinagra raised little

Current opponents None declared

Demographics 15th highest median income ($70K)

Assessment Almost totally safe

District: NJ-13

Location Yet another strange shaped district, this one runs north-south along the Hudson River and the Atlantic, with a gap

Representative Albio Sires (D)

First elected  2006 (special election to replace Menendez, who became Senator)

2006 margin 78-19 (regular election)

2004 margin NA

Bush margin 2004 31-69

Notes on opponents None raised money

Current opponents None declared

Demographics 12th fewest veterans (5.4%), 51st fewest Whites (32.3%), 26th most Latinos (47.6%), 27th most Democratic

Assessment Safe

District: NM-01

Location Albuquerque and suburbs, and some desert

Representative Heather Wilson (R) probably retiring to run for Senate

First elected  1998

2006 margin 861 votes out of 211,000

2004 margin 54-46

Bush margin 2004 48-51

Notes on opponents In 2004, Richard Romero raised $2 million to Wilson’s $3.4 million; in 2006, Patricia Madrid raised $3.3 million to Wilson’s $5 million

Current opponents Martin Heinrich ; Rebecca Vigil-Giron ; Jessica Wolfe ; Robert Pidcock are the Democrats

Demographics 86th fewest Whites (48.5%),  92nd fewest Blacks (2.3%), 32nd most Latinos (42.6%)

Assessment Very vulnerable. superribbie  ranks it the 4th most vulnerable Republican seat, and it’s on the DCCC list .

District: NM-02

Location The southern half of NM, bordering AZ, TX, and Mexico

Representative Steve Pearce (R) probably retiring to run for Senate

First elected  2002

2006 margin 59-40

2004 margin 60-40

Bush margin 2004 58-41

Notes on opponents In 2004, Gary King raised $1.1 million to Pearce’s $2 million; in 2006, Albert Kissling raised $180K to Pearce’s $1.3 million

Current opponents Bill McCamley who wrote on Daily Kos

Albert Kissling , the 2006 candidate, and  

Frank McKinnon are the Democrats

Demographics 20th lowest income (median = $29K), 73rd fewest Whites (44.3%), 60th fewest Blacks (1.6%), 29th most Latinos (47.3%)

Assessment Vulnerable, superribbie ranks it the 28th most vulnerable Republican seat, and it’s on the DCCC list

District: NM-03

Location Northern half of NM, including Santa Fe, bordering AZ, CO, OK, and TX, and touching corners with UT.

Representative Tom Udall (D) retiring to run for Senate

First elected  1998

2006 margin 75-25

2004 margin 69-31

Bush margin 2004 45-54

Notes on opponents Neither raised money

Current opponents Don Wiviott

Benny Shendo

Harry Montoya

Ben Lujan

and

Rudy Martin

are the Democrats

Demographics 68th fewest Whites (41.4%), 36th fewest Blacks (1.1%), 38th most Latinos (36.3%), 14th most nonWhite, nonBlack, nonLatino (mostly 18.9% Native American)

Assessment Slightly vulnerable. superribbie ranks it the 30th most vulnerable Democratic seat