Florida, Part 1

In 2008, Illinois Senator Barack Obama won Colorado by 9.0%, Florida by 2.8%, and Indiana by 1.0%. Guess which one was the “swing state” in 2004.

The answer is Florida, and if that seems strange in light of the above – it is. In fairness, one might counter that Obama did relatively poorly in Florida (where he didn’t campaign in the primaries) and relatively well in Colorado (where the Democratic convention was held).

Here’s another question. Colorado, Florida, Indiana. Only one of these three sends a majority-Republican delegation to the House of Representatives. Which one is it? (A hint: it’s not Indiana.)

It turns out that Florida elects 15 Republican congressmen and 10 Democratic congressmen. Again, to be fair, one might note that Florida’s Republican-controlled state legislature gerrymandered Florida’s congressional districts to achieve an unbalanced result. This is relatively easy – most Democrats live in tightly clustered South Florida.

But that’s just it: Florida’s state legislature is Republican-controlled. In fact, Republicans have 60%+ majorities in both chambers. Florida’s governor is Republican Charlie Crist. Florida was voted Democratic in only two of the last eight presidential elections. John Kerry’s campaign was shocked by the margin he lost by in Florida. Bill Clinton won Georgia, of all states, while losing Florida in1992.

To be fair, I’m picking and choosing my numbers. If you go back to the past nine presidential elections, you’ll find Democrats batting three for nine, not two for eight. And three of those eight elections were big Republican victories.

But there’s only so many times one can say “to be fair.” There’s only so many excuses one can make for yet another indication of Republican dominance in Florida.

Because the closer one inspects as Florida, the more it begins to look less like a swing state than a conservative state with an unusually big Democratic base – which the media happens to call a swing state.

In the next section, I’ll be analyzing why exactly this is so.

–Inoljt, http://thepolitikalblog.wordpr…

PBI (Party Brand Index) Part 6: West Virginia & New Hampshire

PBI or Party Brand Index is a concept I developed (with some much appreciated help from pl515) as a replacement for PVI.  PVI (Partisan Voting Index), which is measured by averaging the percentage of the vote from the last two presidential elections in each house district, and comparing it to the nation as a whole, is a useful shorthand for understanding the liberal v. conservative dynamics of a district. But PVI in my opinion it falls short in a number of areas. First it doesn’t explain states like Arkansas or West Virginia. These states have districts who’s PVIs indicates a Democrat shouldn’t win, yet Democrats (outside of the presidency) win quite handily. Secondly why is this the case in Arkansas but not Oklahoma with similar PVI rated districts?

Lastly PVI can miss trends as it takes 4 years to readjust. The purpose of Party Brand Index is to give a better idea of how a candidate does not relative to how the presidential candidate did, but compared to how their generic PARTY should be expected to perform. I’ve tackled IN, NC, CO, VA, MO, OK, AR, now I will look at the swing states of West Virginia and New Hampshire.

First like always I would like to post the data, then I will offer some analysis. My basic pattern is to work my way “out” from the “Purple States” to the more Blue and Red ones. Once in a while I like to skip my normal pattern of working out from purple states.  I’m often curious on how my model would work in states like that are deeply blue at the local level, but deeply red at the presidential level. I will offer a refresher on them later. But first let’s examine the swings state of New Hampshire and the “split” state of West Virginia.

WEST VIRGINIA

NEW HAMPSHIRE

Although PBI shows some level of pessimism for Carol Shea-Porter in the NH 1st, the trend in her district is truly astounding. From -26% to a +6% Democratic in 2 election cycles. Also during that time NH has seen a 5% rise in the percentage of the electorate that calls itself liberal (conservatives fell 2%) and the party split went from 32:25 Republican to 29:27 Democrat. Although this district isn’t completely safe the trend is good for Team Blue. She is still the top GOP target in the New England.

After I come across a few “conservative” Democrats, I run a “correction” factor to account for them being Blue dogs. The general idea is that the distance they are able to maintain from the national party may help them win over voters who are more reluctant to vote for Democrats. Interestingly enough both West Virginian Democratic Reps despite coming from a Red, Socially conservative state are not members of the Blue Dog caucus. I never the less ran there data to see how my model would respond. I actually was surprised where they fell on the partisan and ideological scale. As I explained a few diaries ago I will use ADJUSTMENT FACTOR 2 in all subsequent corrections.

THREE BLUE DOGS

As a recap, here is the first “batch” of Blue Dogs that I examined correcting for partisanship and ideology. Notice the differences in both partisanship and ideology between the West Virginian congressman, and the AK and OK ones.  Nate Silver has been hopeful that Obama could recapture West Virgina for the Democrats. This data shows West Virgina although often lumped in with the other highland/Appalachia region that turned most heavily against Obama is quite a bit more progressive then other states in that area.  If they become comfortable with Obama’s race he could maybe overcome the recent red-tide there.

FOUR BLUE DOGS

As a reminder ranking a members ideology is a somewhat subjective decision. Potentially what’s one person “liberal” position, is another person “conservative” ones, remember the wingers developed a model that ranked the Sen. Obama as more liberal than Bernie Sanders or Russ Feingold. But partisanship, how often a member votes with their party is an absolute number. A Democrat who represents a “republican district” would be expected to “break with their party” on votes that don’t reflect their districts values.

I couldn’t find a website that ranks all the districts based on their PVI (I only could find list of them by state not rank, help please anyone), therefor I substituted a PVI ranking with where each member ranked in the Democratic caucus. In the 110th Congress the average Democrat had an ideological ranking of 170 (by the way this is a result of several members being tied, this is the medium not the midpoint). The average of members towards the center was 191, former Daily Kos celeb Ciro Rodriguez fell at exactly 191. The average of members towards the liberal side was 121, which falls between Rep. Larson of Conn. and Rep. Eshoo of CA. As or partisanship in the 110th Congress the average Democrat voted with their party 92.3% of the time.

As a clarification in Adjustment #1, I used a deviation factor based on how far each member was from the center of the Democratic caucus. Adjustment #2 was based on how far each member was from outside the standard deviation of the caucus. In Adjustment #3 I removed the partisanship factor to see what effect it would have. As I explained a few diaries ago I will use ADJUSTMENT FACTOR 2 in all subsequent corrections.

Because there are “only” 50 states (as opposed to evaluating 435 house members), I will at a later date have all the states ranked by PVI so I can adjust the Senator’s rankings. I developed Senate factors for the four states the four blue dogs came from. In the interest of full disclosure, my source for ideological rankings is Voteview, and for partisanship it was the Washington Post. This is still a work in progress, I’m making adjustments, and continuing to crunch numbers for more states. I also will use the adjustment factor on a liberal member of congress to see what effect that will have.

Redistricting MS (and AL) for +2 Majority African American Districts

When Congressional districts are redistricted after the 2010 Census, it will be possible to redistrict both the States of Alabama and Mississippi so that each has an additional reasonably compact Black majority congressional district. As you can see in the table below, Alabama most definitely has a high enough African American population for 2 of its 7 Congressional districts to be Black opportunity districts. Anything less than that would pretty clearly constitute the dilution of Black voting power in Alabama. Mississippi is a closer case, but between 2000 and the 2010 census, it will have passed the point at which it is more proportional to have 2 African American opportunity districts than to have only 1. It is also less of a sure thing that two African American Representatives could actually be elected, because the Black majorities in the two African American districts cannot be too large.


AL and MS Demographics, 2000 and 2008
State Year % Black % White Proportional Majority-Minority Districts Total Congressional Districts
MS 2000 36.7% 62.4% 1.48 4
MS 2008 37.2% 58.7% 1.55 4
AL 2000 26.3% 70.3% 1.91 7
AL 2008 26.4% 68.4% 1.95 7

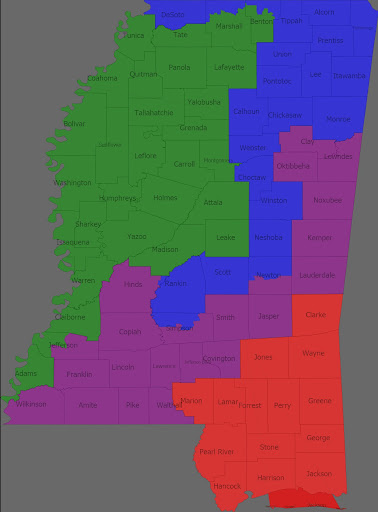
Here is what I came up with for Mississippi:


Redistricted Congressional District Data
District Obama McCain Other Total Obama % McCain % White % Black %
1 95078 224861 3263 323202 29.42% 69.57% 73% 20%
2 182986 146763 2219 331968 55.12% 44.21% 43% 52%
3 184268 150996 2252 337516 54.60% 44.74% 45% 51%
4 92330 201977 2872 297179 31.07% 67.96% 71% 22%

The 2nd and 3rd Districts are Majority Black and should lean Democratic, while the 1st and 4th Districts only have about 20% African American population each and are very, very Republican. I did not have to radically change the general shapes and geographic characteristics of Mississippi’s Congressional districts in order to achieve this. Nor did I have to cross county lines willy-nilly, although with some trading around of territory, it would almost certainly be possible to increase the African American % of either or both the 2nd and 3rd districts by a couple of points.

The Obama/McCain numbers are presumably a pretty good guide of whether or not Black candidates have a shot at getting elected in these districts. Voting was extraordinarily polarized by race – if you can believe the exit polls, Obama got 98% of the Black vote and only 11% of the White vote in Mississippi. In the 2nd and 3rd, the answer is yes – Obama won with about 55% in both. But this is probably not so safe that it is inconceivable that a White/Republican candidate could win under some circumstances, but it should be more difficult for a White or Republican candidate to win these particular 55% Obama seats than most other 55% Obama seats.

It was easy to calculate the vote when counties were not split. In the few cases where they were, I made rough estimates (except for in Jackson, where I maintained the existing CD lines, so that was easy to calculate). So don’t treat those splits as exact numbers, but they won’t be so far enough off that they actually alter the partisanship of the districts as a whole.

MS-1 (Blue)


MS-1 Demographics/2008 Data
District Obama McCain Other Total Obama % McCain % White % Black %
1 95078 224861 3263 323202 29.42% 69.57% 73% 20%


District County Obama McCain Others Total Obama % McCain %
1 Alcorn 4,130 10,805 247 15,182 27.20% 71.17%
1 Benton (pt.) 664 449 20 1,133 58.61% 39.63%
1 Calhoun 2,522 4,467 45 7,034 35.85% 63.51%
1 Choctaw 1,459 2,624 45 4,128 35.34% 63.57%
1 DeSoto 19,627 44,222 474 64,323 30.51% 68.75%
1 Hinds (pt.) 6,050 9,392 122 15,564 38.87% 60.34%
1 Itawamba 2,084 7,663 204 9,951 20.94% 77.01%
1 Lee 12,021 22,694 245 34,960 34.39% 64.91%
1 Marshall 2,602 3,147 39 5,788 44.96% 54.37%
1 Neshoba 3,114 8,209 79 11,402 27.31% 72.00%
1 Newton (pt.) 322 3,400 22 3,744 8.60% 90.81%
1 Pontotoc 2,982 9,727 159 12,868 23.17% 75.59%
1 Prentiss 3,020 7,703 221 10,944 27.60% 70.39%
1 Rankin 14,372 48,140 591 63,103 22.78% 76.29%
1 Scott 5,025 6,584 62 11,671 43.06% 56.41%
1 Simpson (pt.) 1,512 3,808 70 5,390 28.05% 70.65%
1 Tippah 2,623 6,937 165 9,725 26.97% 71.33%
1 Tishomingo 1,962 6,249 208 8,419 23.30% 74.22%
1 Union 2,985 9,072 138 12,195 24.48% 74.39%
1 Webster 1,349 4,072 36 5,457 24.72% 74.62%
1 Winston 4,653 5,497 71 10,221 45.52% 53.78%

MS-1 drops from 27% Black to 20% Black, as it ditches a few counties with reasonably high Black populations and stretches south to pick up Rankin County, next to Jackson. If Travis Childers can manage to survive in 2010, he would have an even tougher time winning this district in 2012. But 2/3 of his current district remains, so maybe he would have some sort of shot. If he did achieve the impossible, and Gene Taylor stays in Congress, MS could potentially have a 4-0 Dem delegation, at least for a while.

MS-2 (Green)


MS-2 Demographics/2008 Data
District Obama McCain Other Total Obama % McCain % White % Black %
2 182986 146763 2219 331968 55.12% 44.21% 43% 52%


District County Obama McCain Others Total Obama % McCain %
2 Adams 9,021 6,566 109 15,696 57.47% 41.83%
2 Amite (pt.) 632 1,481 16 2,129 29.69% 69.56%
2 Attala 3,849 5,273 61 9,183 41.91% 57.42%
2 Benton (pt.) 1,563 1,880 62 3,505 44.59% 53.64%
2 Bolivar 10,334 4,891 156 15,381 67.19% 31.80%
2 Carroll 2,037 3,902 26 5,965 34.15% 65.41%
2 Claiborne 4,682 748 23 5,453 85.86% 13.72%
2 Coahoma 7,597 2,917 54 10,568 71.89% 27.60%
2 Franklin 1,733 2,909 43 4,685 36.99% 62.09%
2 Grenada 5,029 6,234 58 11,321 44.42% 55.07%
2 Holmes 7,765 1,714 64 9,543 81.37% 17.96%
2 Humphreys 3,634 1,462 30 5,126 70.89% 28.52%
2 Issaquena 579 364 7 950 60.95% 38.32%
2 Jefferson 3,883 551 44 4,478 86.71% 12.30%
2 Lafayette 7,997 10,278 185 18,460 43.32% 55.68%
2 Leake 4,151 5,148 60 9,359 44.35% 55.01%
2 Leflore 8,914 4,105 62 13,081 68.14% 31.38%
2 Madison 19,831 27,203 235 47,269 41.95% 57.55%
2 Marshall 7,083 3,536 71 10,690 66.26% 33.08%
2 Montgomery 2,609 3,071 32 5,712 45.68% 53.76%
2 Panola 8,690 7,620 106 16,416 52.94% 46.42%
2 Quitman 2,803 1,334 31 4,168 67.25% 32.01%
2 Sharkey 1,907 873 15 2,795 68.23% 31.23%
2 Sunflower 7,838 3,245 110 11,193 70.03% 28.99%
2 Tallahatchie 4,105 2,786 52 6,943 59.12% 40.13%
2 Tate 5,003 7,678 97 12,778 39.15% 60.09%
2 Tunica 3,279 1,017 36 4,332 75.69% 23.48%
2 Warren 10,489 11,152 123 21,764 48.19% 51.24%
2 Washington 13,148 6,347 88 19,583 67.14% 32.41%
2 Wilkinson 3,534 1,560 45 5,139 68.77% 30.36%
2 Yalobusha 3,151 3,628 47 6,826 46.16% 53.15%
2 Yazoo 6,116 5,290 71 11,477 53.29% 46.09%

MS-2 is Bennie Thompson’s seat, and it remains majority Black, but it drops from 63% African American down to 52%. The main change is that it loses Jackson, which goes to the third district, and it gains population spreading out to the North and the East of its current lines.

This could be a small problem, because Thompson lives in Jackson. A tentacle could be drawn in to Jacskon to take in his home. He could either run in the 3rd district, which will include a substantial amount of new constituents, move to the 2nd. The division of territory between the 2nd and 3rd could also be reconfigured – I would have done that, except it would have looked odd for the 3rd to stretch way up the Mississippi river. One solution might be to use Winston County as a bridge connecting Attala and Noxubee/Oktibbeha/Kemper. Anyone have a good idea of how to do this? Of course, Thompson also just stay where he is and run in the 2nd anyway. Given his longstanding ties to the district, it is not like it would be a major political problem for him not to live in his district.

MS-3 (Purple)


MS-3 Demographics/2008 Data
District Obama McCain Other Total Obama % McCain % White % Black %
3 184268 150996 2252 337516 54.60% 44.74% 45% 51%


District County Obama McCain Others Total Obama % McCain %
3 Amite (pt.) 2,716 2,764 41 5,521 49.19% 50.06%
3 Chickasaw 4,588 4,395 75 9,058 50.65% 48.52%
3 Clay 6,558 4,466 68 11,092 59.12% 40.26%
3 Copiah 7,710 6,701 91 14,502 53.17% 46.21%
3 Covington 3,852 5,523 86 9,461 40.71% 58.38%
3 Hinds (pt.) 69,351 23,557 430 93,338 74.30% 25.24%
3 Jasper (pt.) 4,724 2,848 41 7,613 62.05% 37.41%
3 Jefferson Davis 4,454 2,871 45 7,370 60.43% 38.96%
3 Kemper 3,256 1,935 32 5,223 62.34% 37.05%
3 Lauderdale 13,332 19,582 200 33,114 40.26% 59.14%
3 Lawrence 2,587 4,369 53 7,009 36.91% 62.33%
3 Lincoln 5,505 10,781 116 16,402 33.56% 65.73%
3 Lowndes 13,209 13,994 262 27,465 48.09% 50.95%
3 Monroe 7,169 10,184 143 17,496 40.98% 58.21%
3 Newton (pt.) 2,896 3,179 36 6,111 47.39% 52.02%
3 Noxubee 5,030 1,525 34 6,589 76.34% 23.14%
3 Oktibbeha 9,326 9,320 146 18,792 49.63% 49.60%
3 Pike 9,276 8,651 128 18,055 51.38% 47.91%
3 Simpson (pt.) 3,305 3,833 82 7,220 45.78% 53.09%
3 Smith 1,968 6,265 72 8,305 23.70% 75.44%
3 Walthall 3,456 4,253 71 7,780 44.42% 54.67%

It turns out that with only relatively minor adjustments, the 3rd District can be given an African American majority. The 3rd district currently stretches from the Southwestern corner of Mississippi up North-East to Starkville. Along the way, it picks up heavily the heavily white Jackson-Suburban Rankin County.

Instead, I now have it picking up Jackson proper, which makes a world of difference. It also extends further northward to pick up areas of Mississippi’s black belt agricultural region around Columbus/West Point. Combined with Jackson, that gives you a high enough African American population to be majority black, even though many counties in between have smaller black populations.

Gregg Harper would most likely be doomed, either against Bennie Thompson or someone else. While it might be possible for a Republican who can appeal to both Black and White voters (is there such a thing in Mississippi???) to win, I have a hard time believing that Gregg Harper is that person. He also no longer lives in the district, because he lives in the ever mentioned Rankin County.

MS-4 (Red)


MS-4 Demographics/2008 Data
District Obama McCain Other Total Obama % McCain % White % Black %
4 92330 201977 2872 297179 31.07% 67.96% 71% 22%


District County Obama McCain Others Total Obama % McCain %
4 Clarke 3,121 5,229 47 8,397 37.17% 62.27%
4 Forrest 11,622 15,296 266 27,184 42.75% 56.27%
4 George 1,532 7,700 103 9,335 16.41% 82.49%
4 Greene 1,366 4,361 62 5,789 23.60% 75.33%
4 Hancock 3,768 13,020 268 17,056 22.09% 76.34%
4 Harrison 22,673 38,757 527 61,957 36.59% 62.55%
4 Jackson 17,781 35,993 522 54,296 32.75% 66.29%
4 Jasper (pt.) 301 1,287 9 1,597 18.85% 80.59%
4 Jones 8,846 20,157 270 29,273 30.22% 68.86%
4 Lamar 5,159 18,497 254 23,910 21.58% 77.36%
4 Marion 4,422 8,513 75 13,010 33.99% 65.43%
4 Pearl River 4,320 17,881 242 22,443 19.25% 79.67%
4 Perry 1,533 4,067 64 5,664 27.07% 71.80%
4 Stone 1,996 5,149 101 7,246 27.55% 71.06%
4 Wayne 3,890 6,070 62 10,022 38.81% 60.57%

I kept Gene Taylor’s district almost exactly as it is now, because it already has a very small African American population (23%). The only changes are that it gets all rather than part of Jones and Marion counties, and loses its piece of Jasper County. This reduces the Black population 3%, to 20%. This combination of counties meets the population requirements almost exactly.

This doesn’t do anything to affect Gene Taylor at all. He will continue to hold his R+20 district until he decides to retire, at which point a Republican is guaranteed to win it.

MS-4 could also donate some African American voters to the third if it were necessary, with potential tendrils reaching into Hattiesburg and a few other places.

I also made a map for Alabama, but I won’t bother going into detail with that one because Johnny Longtorso has already posted a map that is basically identical to what I had made.

Mine is basically the same, except it does not cross county lines as frequently. The result is a map that looks less gerrymandered, but on the other hand my 7th District is 1% less African American than his, and my 2nd District is 3% less African American than his. That doesn’t really make much difference, as both seats should be pretty safely Democratic regardless, and more Democratic than the two Mississippi seats I drew.

Electoral politics of the public option

I’m quite prepared to delete this if I’m breaking site policy but the topic seems relavant to me.

I’ve been fighting something of a lonely battle at Daily Kos arguing with people over the health care debate and real possibility of the Obama administration dropping the so called ‘public option’ in order to bring conservative Democrats in congress onboard in order to pass a bill.

Most have drawn their proverbial line in the sand and are committed to opposing any bill that does not include a robust public option. I have no doubt that many posters here at SSP also hold this position. I respect it but cannot agree.

This mcjoan diary from earlier today seemed to be totally off base and I said so.

http://www.dailykos.com/story/…

They are fixated on the polls that show support for the public option in theory but refuse to even acknowledge the existence of the polling that indicates the electorate has turned against the plans that are actually under discussion. As we all know perception is reality in politics.

http://www.pollster.com/polls/…

The reason I believe we can and should discuss this here is because of the real paradox that this has created. On the one hand Democrats in conservative districts won by John McCain or narrowly won by the president last year are clearly concerned about supporting a bill that is unpopular among their constituents. Their rationale is to remove the public option. But of course this is a sticking point for progressives particularly in the House.

I think this impass is a recipe for disaster. Though I don’t think the health care failure in 1994 was the only factor in the Republican Revolution it was clearly the coup de grace after all the scandals and the contentious votes taken that cycle particularly on the budget and on the assault weapons ban. There is clear evidence that Dems in conservative districts that year who voted for those bills were likely to go down to defeat while those who voted no all survived.

Though the author is a bit of a winger and RCP in general leans conservative this article is quite persuasive.

http://www.realclearpolitics.c…

I know Dave Wasserman at The Cook Political Report has come to the same conclusion and Nate Silver posted a link to the article yesterday and made many of the same points.

http://www.fivethirtyeight.com…

It is clear to me the pragmatic solution would be to find a compromise that can find the necessary votes in both chambers. Kossacks seem determined though to stand their ground even if it means no bill at all. What do y’all think?

Redistricting Alabama: I’ll trade you a DINO for a decent Democrat

Click to embiggen.

My intention here was to draw two majority-minority districts, and I was able to succeed rather well. The map has a lot of diagonals, but that’s what you get when your population is so polarized. Here’s the breakdown:

AL-01 (purple, Jo Bonner – R) – Removing Mobile and adding the heavily-Republican southern counties has probably made this one of the most Republican districts in the country.

AL-02 (blue, Bobby Bright – “D”) – Added all of Montgomery and stretched it west in order to make this district the primary majority-black district in the state. It is 56% black, 39% white. Bright would almost assuredly get knocked out in the primary by a black Democrat, who might actually vote with the Democrats sometimes.

AL-03 (yellow, Mike Rogers – R) – Of course, the sacrifice here is that Rogers’ district is pretty much unwinnable for the Dems now. Removing the parts of Montgomery in the district has dropped the black population from about 32% to 24%.

AL-04 (teal, Robert Aderholt – R) – This district didn’t change very much, although it did take in the northern hook of AL-06. Very, very, very safe Republican.

AL-05 (grey, Parker Griffith – “D”) – Also didn’t change this one much. Can’t say I care what happens to Griffith at this point.

AL-06 (red, Spencer Bachus – R) – Loses the aforementioned northern hook around Birmingham and moves a bit to the southeast, which is not going to hurt Bachus any.

AL-07 (green, open) – This is what remains of Artur Davis’s seat after giving a lot of it to AL-02. Takes in more of the Birmingham area to compensate, but remains 52% black, 43% white.

Florida, Part 1

In 2008, Illinois Senator Barack Obama won Colorado by 9.0%, Florida by 2.8%, and Indiana by 1.0%. Guess which one was the “swing state” in 2004.

The answer is Florida, and if that seems strange in light of the above – it is. In fairness, one might counter that Obama did relatively poorly in Florida (where he didn’t campaign in the primaries) and relatively well in Colorado (where the Democratic convention was held).

Here’s another question. Colorado, Florida, Indiana. Only one of these three sends a majority-Republican delegation to the House of Representatives. Which one is it? (A hint: it’s not Indiana.)

It turns out that Florida elects 15 Republican congressmen and 10 Democratic congressmen. Again, to be fair, one might note that Florida’s Republican-controlled state legislature gerrymandered Florida’s congressional districts to achieve an unbalanced result. This is relatively easy – most Democrats live in tightly clustered South Florida.

But that’s just it: Florida’s state legislature is Republican-controlled. In fact, Republicans have 60%+ majorities in both chambers. Florida’s governor is Republican Charlie Crist. Florida was voted Democratic in only two of the last eight presidential elections. John Kerry’s campaign was shocked by the margin he lost by in Florida. Bill Clinton won Georgia, of all states, while losing Florida in1992.

To be fair, I’m picking and choosing my numbers. If you go back to the past nine presidential elections, you’ll find Democrats batting three for nine, not two for eight. And three of those eight elections were big Republican victories.

But there’s only so many times one can say “to be fair.” There’s only so many excuses one can make for yet another indication of Republican dominance in Florida.

Because the closer one inspects as Florida, the more it begins to look less like a swing state than a conservative state with an unusually big Democratic base – which the media happens to call a swing state.

In the next section, I’ll be analyzing why exactly this is so.

SSP Daily Digest: 9/4

CO-Sen: The Denver Post does some interesting digging into how former House speaker Andrew Romanoff wound up in the Senate Democratic primary against Michael Bennet after all. Governor Bill Ritter tried to give the Lt. Gov. spot to Romanoff after Barbara O’Brien left the position in January, but the deal collapsed, leaving Romanoff to decide on the primary instead this summer.

IL-Sen: Chicago’s city treasurer, Stephanie Neely, has decided not to run in the Senate primary. However, Chicago’s inspector general David Hoffman seems to be taking tangible steps to get into the race, saying he’ll make a formal announcement after Labor Day.

MA-Sen: Rep. Stephen Lynch picked up filing papers for the Senate special election in Massachusetts, indicating he’s likely to soon join Martha Coakley. Lynch, who represents a heavily blue-collar Catholic district based in south Boston, would likely be the only anti-abortion Democratic in the race, but he has strong ties with organized labor.

MD-Gov: While most of the question marks surrounding the Maryland governor’s race involve whether or not GOP ex-Gov. Bob Ehrlich wants a rematch with current Democratic Gov. Martin O’Malley, now some are wondering if O’Malley will face a primary challenge from former Prince George’s Co. Executive Wayne Curry. Speculation centers on how O’Malley has nailed down endorsements from Dems all over the state but is missing some key endorsements from PG County.

NJ-Gov: Wow, what is it with this guy? So it turns out that back in 2002, Chris Christie turned his sail barge the wrong way down a one-way street, struck a motorcyclist (who was taken to the hospital)… and didn’t get a ticket. No claims about a tow-truck driver recognizing Christie this time – here, we know he identified himself to the officer on the scene. When he was asked if Christie’s title affected the officer’s decision not to issue a summons, the police director said “I don’t think I want to make that kind of deduction, but I think the facts speak for themselves.” Ouch. (D)

OR-Gov: Lots of movement in the Oregon governor’s race now that John Kitzhaber is in. Democratic state Rep. Brian Clem (who had set up an exploratory committee a few months ago) quickly moved to endorse Kitzhaber and not just get out of the way but join Kitz’s campaign as a director. Meanwhile, Republican state Senator Jason Atkinson — who finished third in the GOP primary in 2006 and has “next in line” status — informally told his hometown paper, the Medford Mail-Tribune, that “he’s running,” although the formal announcement won’t happen for a while. Finally, it sounds like Rep. Peter DeFazio is making a move to… do something. He’s still considering the race, but will make a decision “around Labor Day,” which is soon.

SC-Gov: Here’s a tea leaf that Jim Rex, who’d be the Dems’s strongest candidate, seems likely to get in the gubernatorial race. In the midst of touring the state and raising money, he says he won’t run for another term as Superintendent of Education.

AZ-01: It sounds like the GOP has a candidate lined up in the 1st, to against freshman Dem Ann Kirkpatrick, who’s a definite improvement over the sad Sydney Hay from last time. Former state Senate majority leader Russell “Rusty” Bowers (also a former state Rep., and now a sand-and-gravel industry lobbyist) seems like he’s set to run.

IN-08: The NRCC, however, wasn’t able to pin down a challenger to Brad Ellsworth in the 8th. Former Vandenburgh County Commissioner and county assessor Cheryl Musgrave decided not to run against Ellsworth, although she is considering a state House run instead against incumbent Dem Gail Riecken.

PA-03: The GOP had been previously struggling to find anyone at all to go against freshman Dem Kathy Dahlkemper, but now they’ve landed someone fairly impressive sounding. John Onorato (not to be confused with Dem gubernatorial candidate Dan Onorato) is the former Erie County Solicitor (analogous to DA in most states), giving him a large constituency to build on.

SD-AL: State Rep. Shantel Krebs of Sioux Falls said that she’s considering challenging Stephanie Herseth Sandlin in 2010. Krebs would likely need to get past Chris Nelson, the state’s two-term Secretary of State, in the GOP primary though; he’s also in the “considering” phase. (Remember that South Dakota House districts are teeny constituencies, with only 22,000 residents each.)

NYC-Mayor: One more SurveyUSA poll of the Dem primary in the Big Apple. William Thompson and Mark Green have pretty clear paths in the Mayor and Public Advocate primaries (Thompson leads Tony Avella 52-14), but check out the Comptroller’s race. It’s a three-way slugfest between three city councilors: 25% for John Liu, 24% for Melinda Katz, and 21% for David Yassky.

Ads: The DNC, via Organizing for America, is running cable TV spots for four potentially vulnerable House Dems, thanking them for their pro-stimulus votes: Ben Chandler, Martin Heinrich, Travis Childers, and Zack Space.

Polling: The Masters of the Crosstabs were all on hand to do a panel on polling at Netroots Nation last month: Charlie Cook, Mark Blumenthal, Nate Silver, and Charles Franklin, moderated by Greg Dworkin (aka DemFromCT). At the link, you’ll find a video of their session. (Charlie gives a nice shout-out to SSP at about 7:40, and again at 80:20, where he talks about the “growing sophistication of the blogosphere.”) (D)

Humor: Autotune the News 8 is out, in case you’ve ever wanted Joe Biden to sing you a slow jam.

Iowa HD 90: Department of unconvincing spin

For those who aren’t tired of celebrating Curt Hanson’s win in the Iowa House district 90 special election, this article by Jason Clayworth in Thursday’s Des Moines Register should be good for a few laughs.

Link:

A group opposed to same-sex marriages failed to secure victory for Republicans in Iowa this week, but the massive injection of out-of-state money on the issue foreshadows what’s to come in next year’s elections, political scholars said Wednesday.

Despite the loss, the National Organization for Marriage succeeded in making gay marriage an issue, the head of the group said Wednesday. He vowed that its “Reclaim Iowa Project” will remain active in the 2010 state elections.

I’m sure “making gay marriage an issue” was just the kind of success the NOM’s generous donors (whoever they are) were looking for. Why, Iowans in House district 90 might never have realized same-sex couples could marry if not for the NOM’s major ad campaign.

Back to that Register article:

Jeff Boeyink, executive director of the Iowa Republican Party, said many no-party voters Tuesday supported [Stephen] Burgmeier. That was a victory itself, he said.

Voters want the opportunity to vote on the gay marriage issue, he said.

“We moved the needle a lot,” Boeyink said. “We didn’t get the victory, but we take away some real positives out of this.”

Sure, Mr. Boeyink, you “moved the needle a lot.” Your candidate, elected three times as a Jefferson County supervisor, lost his own county by more than 600 votes.

The marriage group did not lose the race for Burgmeier, said Chuck Hurley, a former Republican legislator and now president of the Iowa Family Policy Center, a group against gay marriage. He said the issue will be a major topic in the 2010 elections.

“Marriage won the day,” Hurley said of the election. “I think it was a huge issue in the campaign.”

Yes, Republicans tried to make marriage a huge issue in the campaign while Curt Hanson talked about jobs, economic development and renewable energy. The National Organization for Marriage’s television ad used the same kind of rhetoric as the Iowa Family Policy Center’s “Let Us Vote” campaign: instead of advocating discrimination against same-sex couples, the ads supported Burgmeier as someone who would “let voters have a say.” Well, voters in House district 90 had their say.

I don’t want to get too cocky. Tuesday’s election could have gone the other way if not for the outstanding GOTV effort by organizers supporting Hanson. But the fact is, a special election a few months after the Iowa Supreme Court ruling went into effect is exactly the kind of race likely to be disproportionately influenced by same-sex marriage. In Vermont and Massachusetts, the electoral backlash against supporters of marriage equality was short-lived. If the Iowa Family Policy Center (which designated a staffer to work on Burgmeier’s campaign) and nearly $90,000 worth of NOM tv ads couldn’t leverage this issue into a victory on Tuesday, I don’t think Republicans will get far running against gay marriage 14 months from now.

For a more honest Republican assessment of Tuesday’s special election results, read this post by Craig Robinson at The Iowa Republican.

Will Richard Burr win in 2010? Mr. Burr, meet Cal Cunningham

Back in 2004, North Carolina preferred a potted plant (err..Richard Burr) over an uncharismatic, aloof candidate (Erskine Bowles).  Although trailing in the polls during the 2004 Summer, Burr caught on fire and defeated Bowles 52-47.

How did Burr win?  Well, it wasn’t for his charisma, and it wasn’t because of name recognition.  It wasn’t for his progressive ideas or his brain power.  Burr won because (a) the GOP brand was hot in 2004, (b) the Democrat was a crummy candidate, and (c) Bush ignited the Republican base.

Going forward today, let me list Richard Burr’s accomplishments during his tenure in the US Senate.  Well, let me think…oh yeah, he told his wife during the financial meltdown to withdraw as much as humanly possible out of the ATM that night (and every other day afterward).

I’m being sarcastic..I’m sure he has some sort of record that he can promote, but he’s not too good about communicating them to the folks in NC.

Going to the 2010 election, what plan does Burr have to win re-election?  He doesn’t have Dubya running, and the GOP brand is not as hot in NC as it was in 2004.  His only hope is that the Democrats nominate an uncharismatic candidate and that the Obama administration has some severe stumbling blocks.

I don’t see Burr winning re-election unless the GOP name catches on fire again to the 2004 level.  I also don’t see the Democrats nominating a boring candidate like Erskine Bowles again.

My preferred candidate is Cal Cunningham.  He’s young, attractive, and a progressive.  He’s a Captain in the U.S Army reserves.  He has charisma.  He could be the next John Edwards (the 1998 version) to sweep NC.

Okay, everyone is thinking of “name recognition”.  In NC, name recognition of new candidates don’t mean much.  John Edwards wasn’t a true “name candidate” in 1998.  He was a high-profile attorney in Raliegh, but most of the state had no idea what John Edwards was about.  Kay Hagan was not well-known, either.

What did Hagan and Edwards have in common?  They were both young candidates that represented the ideas and beliefs better than the incumbent.  In addition, both were much younger than the incumbent Senator.  Cunningham also is considerably younger than Burr, and he is also a better fit for the NC electorate than the very conservative Richard Burr.

Don’t dismiss Cunningham because of his lack of name recognition.  Name recognition should be Burr’s problem (a third of the electorate has no idea that he is their Senator).


By what margin will Bob Shamansky win?

View Results

Loading ... Loading ...