Previewing Senate Elections: California, Section 1

This is the third part of a series of posts analyzing competitive Senate elections in blue states. It will focus on California. Because California is such a big and complicated state, it will have two sections – of which this is the first. The second part can be found here.

California, Section 1

In the greatest state of the union, a fierce senatorial battle is brewing. Former HP executive Carly Fiorina is mounting a tough challenge to incumbent Democrat Barbara Boxer. In an anti-Democratic national environment, polls show the race close and competitive. This post will examine the obstacles Ms. Fiorina will face as she seeks to overcome California’s formidable Democratic geography.

CA 2008

As America’s most populous state, California contains a number of distinct regions. This post, and the one following, will examine each.

More below.

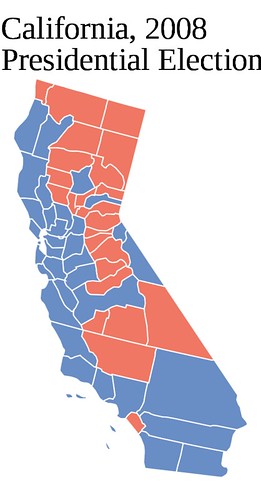
Upper California and the Sierra Nevada

When people think of California, the northern forests and year-round snow of the Sierra Nevada generally do not come into mind. These regions, geographically expansive yet thinly populated, tend to vote loyally Republican (although until the 1970s Democrats had a base of support in several northeastern counties).

Not all of this region is Republican-voting, unpopulated wilderness. Exurban Placer County, for instance, contained 173,812 voters in 2008. Other parts – especially the liberal coast – tend to vote Democratic, eating in to Republican strength.

Ms. Fiorina will probably need something like 70% of the vote in places like Placer County to win. Strong margins from this Republican stronghold constitute the first, easiest step to a Republican victory.

The Bay Area

In many ways, the Bay Area is what makes California a blue state. Without the Bay Area, for instance, President George W. Bush would – almost – have won California in 2004, losing by a mere 0.7%.

Previewing Senate Elections: California,Section 1

Unfortunately for Republicans, the Bay Area – one of the richest, most diverse, and most liberal places in the country – does indeed exist, and it votes strongly Democratic. A popular attack against Senator Boxer is to call her a San Francisco liberal; this generally works less well in San Francisco.

In addition, voting habits in the Bay Area tend to be “sticky.” If the rest of California moves ten points more Republican, the Bay Area will tend to move only five points right. San Francisco and Alameda counties are sometimes the last two counties standing during Republican landslides.

There is a glimmer of hope for Republicans, however. The counties surrounding San Francisco and Berkeley tend to be one degree less intense in their liberalism. Ms. Fiorina will not win them, but a well-run campaign can reduce Democratic margins somewhat.

Central Valley

Home to some of the richest farmland in America, the counties composing Central Valley once leaned Democratic but now vote Republican in all but Democratic landslides. Conservative and heavily populated – although not by California standards – Central Valley provides somewhat of a reservoir to offset the enormous Democratic margins radiating from the Bay Area.

There is, however, one important exception: Sacramento, a populous county whose Democratic leanings deny Republicans a vast store of potential votes.

In the long run, Central Valley is a ticking time bomb. Democratic-voting Latinos compose 30-50% of the population in many of these counties, and their numbers will only increase. For now Ms. Fiorina is safe – Latinos do not vote their numbers, especially in mid-terms – but future Republicans cannot take Central Valley for granted.

The Challenge of Southern California

Previewing Senate Elections: California,Section 1

It is in the urban sprawl of SoCal, however, where Republicans face their greatest challenge. Ms. Fiorina has two tasks here. The first is to win the counties outside Los Angeles, and win them big. The second is to keep Los Angeles itself within single digits.

The next post will expand upon SoCal and offer a conclusion on Republican prospects of winning California.

–Inoljt, http://mypolitikal.com/

Analyzing Swing States: Virginia, Conclusions

This is the last part of a series of posts analyzing the swing state Virginia, which aims to offer some concluding thoughts. The previous parts can be found starting here.

Conclusions

As a state, Virginia’s population has always been located in three metropolitan areas: the Northern Virginia suburbs south of Washington D.C., Richmond and its suburbs, and the communities surrounding Hampton Roads. Together these three places compose more than half of Virginia’s electorate:

Analyzing Swing States: Virginia,Conclusions

In all three metropolitan areas, Democrats have been improving their margins.

More below.

Virginia’s suburbs, expansive and traditionally Republican, have shifted leftwards with startling quickness. This movement has been most apparent in the largest of its suburbs, rich and diverse Northern Virginia. The addition of NoVa to Virginia’s heavily Democratic, heavily black cities has given the Democratic Party a coalition that has won a number of recent elections.

Not everything has gone badly for the Republican Party. They have captured a formerly loyal Democratic constituency – the Appalachian west, which voted Democratic based on economic appeals. Moreover, they still dominate the rural whites who in bygone days voted Democratic:

Analyzing Swing States: Virginia,Conclusions

Thus, Virginia today is a state in change, like most states. Parts of it are shifting left and parts of it are shifting right; in aggregate, the effect has been to change it from a solidly Republican to swing state. Undoubtedly, other states will and are moving in the opposite direction.

Colorado, the next state in this series, is probably not one of those Republican-shifting states.

–Inoljt, http://mypolitikal.com/

Analyzing Swing States: Pennsylvania, Conclusions

This is the last part of a series of posts analyzing the swing state Pennsylvania. The previous parts can be found here.

Conclusions

For many decades, Pennsylvania constituted model of Democratic strength based upon working-class votes. Today that is changing, especially in the southwest. For the moment, nevertheless, the swing state Pennsylvania remains Democratic-leaning. This is more because of an unusually strong Democratic machine than any natural liberalism in Pennsylvania.

In 2008 Democrats won Pennsylvania by double-digits, amassing a coalition based upon poor blacks in Philadelphia and Pittsburgh, rich whites in the Philadelphia suburbs, and working-class votes outside Appalachia. It is a strange-looking combination, but it works.

More below.

Republicans built their strength upon small towns and exurban communities in “the T,” along with working-class votes in the southwest.

For decades, Republicans have been strengthening in western Pennsylvania, while weakening in eastern Pennsylvania. This map indicates these changes.

Pennsylvania,Conclusions

Although it doesn’t look like it, the 2008 Democratic candidate (who won by 10.32%) actually did better than the 1992 candidate (who won by 9.02%).

From all this, the best news for Democrats would be the blue shift Philadelphia’s suburbs have undergone. Republicans will take heart in the Appalachan southwest’s even stronger movement right.

I have previously opined that these changes benefit Democrats on the whole. Indeed, this whole series of posts has inclined toward a theory of continuing Democratic strength in Pennsylvania. I will conclude this chain of posts, therefore, with a map Republicans will like – the 2008 Pennsylvania results by municipality. This illustrates how President George W. Bush almost won Pennsylvania in 2004.

Pennsylvania,Conclusions

Note: Several months ago I posted several diaries analyzing the swing state Pennsylvania. In a search of my posting archives, I just found out that I’d apparently forgotten to post this final part – so here it is.

–Inoljt, http://mypolitikal.com/

Previewing Senate Elections: New York

This is the first part of a series of posts analyzing competitive Senate elections in blue states. The first part, which analyzes Illinois can be found here.

Out of the three heavily Democratic states being analyzed, Republicans probably have the least chance of winning New York. A serious Republican challenger to Senator Kristen Gillibrand has yet to emerge. Moreover, Ms. Gillibrand has proven an adept politician willing to campaign hard.

Nevertheless, in a bad national environment with low name recognition, victory for Democrats is not assured. Under the right circumstances (perhaps a Gillibrand scandal), Republicans may be able to pull off a shocker.

Previewing Senate Elections: New York

Like Illinois, New York can be divided into three sections: upstate, the suburbs downstate, and New York City. A New York Republican must win upstate and the suburbs by substantial margins – and perform extremely well in New York City.

More below.

Upstate New York

Like Illinois, the first step on the Republican road to victory lies with here. A Republican candidate must win strong margins upstate; a strong performance here is embedded with a double-digit loss.

Unfortunately for Republicans, upstate New York and downstate Illinois are not the same. Unlike Illinois, upstate New York is home to four major cities: Buffalo, Rochester, Albany, and Syracuse. In a normal election – i.e. a double-digit Democratic victory – these cities will vote Democratic, some by substantial margins.

There are several more wrinkles for a Republican candidate. Like much of the rural northeast, upstate New York has been trending Democratic. Despite the conservative national mood, Democrats last year won two special elections upstate. Moreover, Senator Kristen Gillibrand has roots there; she represented an upstate congressional district before becoming Senator.

Nevertheless, the majority of this region still votes loyally Republican; a competitive candidate can rely upon it to help counter New York City. In a close election a Republican ought to win almost every county in upstate New York.


The Suburbs Downstate

This region can be defined as the suburbs surrounding New York City: Long Island and the communities around Yonkers. A Republican’s task here is similar to that upstate: win, and win big.

Historically this was not too difficult; New York City’s suburbs regularly voted Republican, although never by enough to overcome Democratic margins in the city itself. Like many other suburbs, this changed with President Bill Clinton: since his time they have generally voted Democratic.

Today things are changing once more. Since the events of 9/11, downstate’s suburbs (especially Long Island) have been trending Republican. This was one of the few regions Senator John McCain did well in (as opposed to President Barack Obama doing poorly in); his national security credentials appealed to a number of downstate suburban voters.

A strong Republican must capitalize on this trend, changing New York’s suburbs back into Republican territory. This strength, added to margins from upstate, makes for a 5% Republican loss. Republican candidates have achieved this combination many times in the state’s electoral history. Take 1968, when President Richard Nixon lost New York by 5.46%:

Previewing Senate Elections: New York

The problem is the last 5%, to  which a Republican must look to New York City for.


New York City

To make up the last 5%, a Republican candidate must do well in New York City, that great metropolis of the United States. The Big Apple composes an astounding 43% of the state’s population, the largest proportion in the country. It also votes extremely Democratic; in 2008 four out of five voters turned the lever for President Barack Obama.

The Republican facing Ms. Gillibrand will have to substantially improve upon this number. This is not as hard as it first sounds. New York City, after all, has had a non-Democratic mayor for more than a decade. Low minority turn-out looks likely to bedevil Democrats during this off-year election. Moreover, Republicans retain a base in Staten Island and southern Brooklyn. Even in 2008 these places voted Republican:

Previewing Senate Elections: New York

(Note: Image courtesy of a very old post from jeffmd.)

Finally, some regional complexities come into play. Although almost all of New York City voted for Mr. Obama, some parts are more less loyally Democratic than others (as was the case in Massachusetts). White liberals and impoverished minorities in Manhattan and the Bronx almost never vote Republican; suburbanites in Brooklyn and Queens, on the other hand, are more perceptible to Republican appeals. Winning Republicans generally tie or win the Queens borough and hold Democrats below 60% in the Kings borough.


Conclusions

If New York is close next November, it will probably look something like this:

Previewing Senate Elections: New York

This map can indicate anything from a 5% Democratic victory to a 5% Republican victory, depending on turn-out. Perhaps the best barometer will be the Queens borough in New York City. Look to it next November – it might literally determine the fate of the Democratic Senate majority.

Analyzing Obama’s Weak Spots – Part 2: The Northeast

This is the second part of three posts analyzing the congressional districts President Barack Obama underperformed in. It will focus on his relative weakness in the northeast. The third part can be found here.

The Northeast

In my previous post I created a map of congressional districts in which Mr. Obama performed worse than Senator John Kerry:

Analyzing Obama's Weak Spots

In this map the most obvious pattern is a roughly diagonal corridor of Republican-shifting congressional districts, stretching from Oklahoma and Louisiana through the Appalachians. This area has long been seen as a place in which the electorate is moving away from the Democratic Party.

The post then looked at the Northeast, another region in which Mr. Kerry did better than Mr. Obama.

More below.

Unlike Applachia and the Mississippi Delta, the conventional wisdom characterizes the Northeast as a stable Democratic stronghold. Yet, as the map below indicates, six northeastern congressional districts shifted Republican in 2008:

Analyzing Obama's Weak Spots - Part 1

Much of the movement in Massachusetts, of course, occurs due to the loss of Mr. Kerry’s home-state advantage. Yet the districts in Massachusetts (MA-4, MA-6, MA-7, MA-9, and MA-10) also share a number of commonalities. All are quite suburban, quite wealthy, and quite white. Unlike the Appalachian districts above, these places vote substantially Democratic. Neither Mr. McCain nor former President George W. Bush came within single-digits in any of these districts (I suspect 1988 was the last time a Republican presidential candidate did so). Yet this is also Scott Brown territory; the Republican candidate won four of these  districts.

Notice, too, the highlighted New York district (NY-9). Like those in Massachusetts, this district is inhabited mainly by middle-class, Democratic-voting whites. The effect of 9/11, which convinced many New Yorkers to vote Republican, was particularly strong in places like these (in fact, it was probably greater here than anywhere else in the nation). Orthodox  Jews, an increasingly Republican demographic heavily represented in this district, have shifted strongly Republican since then.

Indeed, Long Island as a whole was relatively lukewarm towards Obama. Apart from the fighting ninth, Republicans did respectably in NY-3 and NY-5, holding Obama’s improvement to less than 1% in both districts. Like NY-9, these places are wealthy and suburban.

One wonders whether this change is merely a temporary blip or the start of something more worrisome for Democrats.  The case of Florida is probably not reassuring:

Photobucket

This is Florida’s Gold Coast – a Democratic stronghold – and three districts here (FL-19, FL-20, FL-22) voted more Republican than in 2004. Mr. McCain’s age probably helped him along here; the large population of retirees may have empathized with one of their own.

Ironically, a large number of these retirees probably came from NY-9 or eastern Massachusetts. Like both areas, these districts vote Democratic but have been slowly moving Republican. FL-22 is the exception, having been not very Democratic to begin with. In FL-19 and FL-20, on the other hand, Democratic candidate Al Gore did substantially better than both Obama and Kerry. This was a function of the substantial Jewish population in these districts; Jews strongly supported Joe Lieberman, his Jewish nominee for Vice President.

Fortunately for Democrats, almost none of the Florida or northeast districts represent a 2010 pick-up opportunity for Republicans. Except for FL-22, all have voted Democratic by double-digits for at least three consecutive presidential elections. A few weeks ago a special election in FL-19 resulted in a 27% Democratic margin victory. It is the long-term that is worth concern for Democrats.

In the short term, Democrats must worry about Appalachia and the Mississippi Delta. There Democrats are in deep, deep trouble for 2010. There are a surprising amount of Democratic representatives in these Appalachian seats where Mr. McCain did better than Mr. Bush. Their predicament will be the subject of the next post.

The Meaning of PA-12

By: Inoljt, http://mypolitikal.com/

On Tuesday night Pennsylvania’s 12th congressional district held a special election, pitting Democratic candidate Mark Critz against Republican Tim Burns.

The Meaning of PA-12

Mr. Critz won solidly: a nine percent margin of victory off 53.4% of the vote. Several polls had predicted a very close, photo-finish election; this result contradicted that assumption.

This victory constitutes good – very good – news for Democrats.

More below.

His district, PA-12, was one of the few countrywide that voted more Republican from 2004 to 2008, as the rest of the nation shifted substantially left. Districts such as these are prime targets for Republicans in 2010.

Indeed, PA-12 constituted the only seat in the entire nation that supported Senator John Kerry and then switched its vote to Senator John McCain. For reasons such as this, I wrote a week ago that:

It will be a minor miracle if Democratic candidate Mark Critz wins.  [Almost] no Democratic candidate has ever done better than Mr. Obama since his  election. Mr. Critz will have to do that, given that the president lost  PA-12 (the only seat in the nation to support Kerry and the McCain). In a  district with double-digit disapproval ratings of Mr. Obama, this  constitutes an arduous task.

As it turned out, Mr. Critz did far better than Mr. Obama. Indeed, his victory constitutes the first time a Democratic candidate has improved on the president’s performance since December of 2008, when Democrat Paul Carmouche barely lost LA-4 to Congressman John Fleming.

The Meaning of PA-12

Mr. Critz won by appealing to local issues, emphasizing his independence from the president, and sounding like a fiscally liberal, socially conservative Democrat – the type of Democrat places like PA-12 have traditionally voted for.

This is a strategy that Democrats have long used, to great success, in winning congressional districts that they should not be winning. It is how both Mississippi and Arkansas elect three Democratic versus one Republican congressional representative, and how Texas elected more Democratic than Republican congressman right until 2004. It is partly how the party won such great congressional victories in 2006 and 2008.

There has been much fear amongst Democrats that, in light of Mr. Obama’s presidency, this strategy will no longer work. State Senator Creigh Deeds tried running a rural-style candidacy for Virginia’s governorship; he failed quite miserably.

Mark Critz, on the other hand, succeeded where many – including this individual – thought for sure he would fail. His performance certainly does not mean that Democrats are in for an easy time come November, but it does give the party something to work with in the tough days ahead.

Maps of Virginia Elections

By: Inoljt, http://mypolitikal.com/

To follow up the series on Virginia, I’ve posted a few recent presidential elections in the state (courtesy of the New York Times). Each map comes with some brief analysis.

Maps of Virginia Elections

Capitalizing on a decade of Democratic movement, Senator Barack Obama becomes the first Democratic presidential candidate to win Virginia since 1964. The Senator performs best in eastern Virginia, especially the fast-growing northern Virginia metropolis. Western Virginia is not as enamored; parts of it even vote more Republican.

More below.

______________________________________________________

Maps of Virginia Elections

Nobody pays attention to Virginia in 2004, and for good reason: incumbent George W. Bush cruises along to a comfortable victory. Amid all the hoopla in Ohio, Republicans fail to notice a disquieting trend. Fairfax County, the populous heart of Northern Virginia, goes blue in the first time for decades.

______________________________________________________

Maps of Virginia Elections

Governor George W. Bush sails to an 8% victory. He artfully weaves together a classic Republican coalition: wealthy suburbs combined with Republican-trending rural Virginia.

______________________________________________________

Maps of Virginia Elections

Expecting to win the state, incumbent Bill Clinton is surprised to see Virginia slip from his grasp. He does better than in 1992 – performing well amongst Democratic constituencies in the Appalachian west, the black southeast, and the rich inner-core suburbs of Northern Virginia. But it’s not enough: a strong Republican vote in Richmond’s suburbs denies Mr. Clinton his victory.

______________________________________________________

Maps of Virginia Elections

Another presidential election, another Republican victory in Virginia powered by suburbs and small towns. Yet Governor Bill Clinton does relatively well. Compared to the 20.5% beating George H.W. Bush gave to Democratic nominee Mike Dukakis in 1988, a 4.4% loss ain’t nothing.

Analyzing Swing States: Virginia, Part 5

This is the fifth part of a series of posts analyzing the swing state Virginia. It focuses on the traditional Democratic base and its decline. The last part can be found here.

In the days of the Solid South, Democrats worried more about primary elections than Republican challengers. The party, under the sway of the Byrd machine, dominated almost every part of the state – as it did throughout the South.

Civil rights and suburban growth broke the back of this coalition. In 1952 Virginia voted for Republican candidate Dwight Eisenhower. By the 1970s Virginia had elected its first Republican governor, senator, and attorney general in nearly a century.

Democrats were left with strength in two reliable regions – the southeast and the western panhandle. These places constituted the traditional Democratic base, which Democrats relied on for a number of decades.

The 1996 presidential election provides an excellent illustration of this base:

Analyzing Swing States: Virginia,Part 5

More below.

With his rare ability to command support among both poor Appalachian whites and poor Southern blacks, Mr. Clinton performed powerfully with the traditional Democratic coalition. As the map indicates, the incumbent president dominated the southeast, while winning a number of counties in the panhandle. It is an illustration of the traditional base at a strong point.

Clinton also lost Virginia by two percentage points. This indicates something else: it is actually very difficult to win the state with the traditional Democratic base. There are just not enough Appalachian whites and blacks (20% of the population) in Virginia. Take mostly black, heavily Democratic  Richmond. In 2008 a little more than 90,000 votes were cast in the city. A respectable number – but barely more than half the 162,088 votes cast in  neighboring, suburban Chesterfield County.

Richmond also constitutes an important part of the Virginia’s Democratic-voting southeast – the first prong of the classical Democratic coalition. Democratic strength in this region can be explained through demographics; the region is home to much of the state’s black population:

Analyzing Swing States: Virginia,Part 5

Black voters, grateful for its passage of Civil Rights, remain a vital constituency of the Democratic coalition. They constitute a  stable block of voters  for a Democratic candidate to build upon.

Geographically, Democrats usually win a few rural, majority-black counties in the southeast. In addition, black votes give Democrats sizable margins coming out of Richmond and four Hampton Roads cities – Norfolk (the largest), Portsmouth, Hampton, and Newport News. In 2008 Senator Barack Obama’s vote ranged from 64% (Newport News) to 79% (Richmond) in each of these cities.

Unfortunately for Democrats, the second prong of their traditional base – the Appalachian panhandle – is quickly moving away from them. This area is fairly rural and somewhat poor; as the map above indicates, its population is fairly homogeneously white. Until recently, Democrats could rely on panhandle votes even in the event of a double-digit loss. Its residents voted Democratic based off a combination of economic interests and tradition.

As the party becomes more metropolitan-based and liberal, however, the panhandle has been drifting away. The election of President Barack Obama, an ill-fit with Appalachian America, has accelerated the rightward movement. In 2009, Democratic candidate Creigh Deeds lost the panhandle by a landslide.

Analyzing Swing States: Virginia,Part 5

Even in the days in which the panhandle voted loyally Democratic, the base – as has been noted before – was insufficient for statewide victory. Democrats needed to add another prong to their coalition. Mr. Clinton attempted to do so by reviving support amongst the rural whites who’d long ago abandoned the Democratic Party; he mostly failed in his endeavor. In 1976, President Jimmy Carter did much better with rural whites but much worse with their suburban counterparts; Mr. Carter also barely lost Virginia.

Statewide Democratic candidates, on the other hand, have been able to win the state through a combination of the traditional base and a respectable suburban showing. Indeed, no Democratic presidential, senatorial, or gubernatorial candidate has won Virginia, for at least two decades, while losing suburban Fairfax County.

In recent years Democrats have traded the Appalachian panhandle for these NoVa suburbs. This switch has, in the aggregate, been to their benefit. The old Democratic base was rarely enough to win Virginia. With the addition of NoVa, Democrats have won three out of four past statewide elections. Virginia has moved from a red state to a purple one.

–Inoljt, http://mypolitikal.com/

Maps of Pennsylvania Elections

By: Inoljt, http://mypolitikal.com/

A few maps of Pennsylvania’s presidential elections are posted below, for your enjoyment. Each map comes with some brief analysis. Note how in each succeeding election, Democratic margins in the Philadelphia metropolis increase, while their margins in the Pittsburgh corridor decrease.

(Note: Because the Times stopped updating before all absentee/provisional ballots were counted, this map does not fully reflect the actual results. I have corrected the discrepancy.)

Maps of Pennsylvania Elections

As the national tide increasingly turns in Senator Barack Obama’s favor, Senator John McCain mounts a quixotic attempt to win Pennsylvania. While Mr. McCain improves in the southeastern rustbelt, Democratic dominance in eastern Pennsylvania ensures a double-digit blue margin.

More below.

Maps of Pennsylvania Elections

President George W. Bush mounts a determined attack on Pennsylvania, coming within 2.5% of Senator John Kerry. Mr. Bush does quite well in the traditionally Democratic Pittsburgh corridor and Republican strongholds throughout the “T.” But double-digit losses in Philadelphia’s suburbs (and a 400,000 vote deficit coming out of the city itself) prevent Mr. Bush from victory.

______________________________________________________

Maps of Pennsylvania Elections

Without President Bubba holding the line, Republican margins in Pennsyltucky are much higher. Nevertheless, Al Gore closely carries Pennsylvania based on Democratic strongholds in the Philadelphia and Pittsburgh metropolises.

_____________________________________________________

Maps of Pennsylvania Elections

With incumbent Bill Clinton poised to win comfortably weeks before election day, Senator Bob Dole does not seriously contest Pennsylvania. Democrats improve in the east and weaken in the west, while Mr. Clinton sails to a comfortable victory.

______________________________________________________

Maps of Pennsylvania Elections

Governor Bill Clinton romps to a nine-point margin, following three straight Republican victories in the state. Mr. Clinton milks Democratic strength in the industrial southwest for everything it’s worth, winning 2-1 margins in a number of counties. More ominously for Republicans, President George H. W. Bush barely loses the Philadelphia suburbs – the first Republican to do so since Senator Barry Goldwater (and before him President William Taft, in 1912).

(Note: Credit goes to the NYT for these amazing images.)

Analyzing Swing States: Virginia, Part 4

This is the fourth part of a series of posts analyzing the swing state Virginia. It is the second section of two focusing on Northern Virginia, and focuses on analyzing the structural foundation behind NoVa’s Democratic shift. The fifth part can be found here.

Analyzing Swing States: Virginia,Part 4

Demographics

In many ways, Northern Virginia represents the best America has to offer. As wealthy, diverse, and rapidly growing suburb, it offers the very essence of the American Dream.

More below.

Demographically, Northern Virginia is one of those rare places whose racial composition is representative of America as a whole. In Fairfax County today blacks constitute 9.4% of the population, Hispanics 13.5% (nationally the numbers are 12.3% and 15.1%, respectively). Asians come in at 15.8%, a higher number than the national average.

As has been much noted, Northern Virginia is getting more diverse. In Fairfax County, for instance, the numbers of blacks, Hispanics, and Asians have all increased since the 2000 census – which counted blacks as 8.6%, Hispanics as 11.0%, and Asians as 13.0% of the population.

These changes are especially striking in exurban NoVa. Loudoun County, 2000 was 5.9% Asian and 5.3% Hispanic. Since then those numbers have more than doubled; from 2006-2008, the census estimated Loudoun as 12.3% Asian and 10.1% Hispanic (blacks constituted 7.8% of the county’s population).

Finally, Northern Virginia is very, very, very rich. The median household income in both Fairfax and Loudoun exceeds $100,000; a 2008 census study estimated them as the two wealthiest counties in America (see page 13). More than one-third of individuals over 25 in Arlington County hold graduate degrees, compared with less than 10% of Americans at large. Life expectancy is the highest in the nation.

The Future

Although Northern Virginia continues become more diverse, it is unclear how much more Democratic it can get. Suburbs rarely give a party more than 60% of the vote, and 65% seems to be the upper limit for Democrats. Given that President Barack Obama won 60.12% in Fairfax County, Democrats appear to be near this line.

Analyzing Swing States: Virginia,Part 4

On the other hand, the suburban metropolis that does break this rule (the Bay Area) has a lot in common with Northern Virginia. Like NoVa, the Bay Area is rich, diverse, and growing. But the Bay is also composed of a majority of minorities; this will not happen anytime soon in Northern Virginia.

Moreover, Virginia is missing the one piece that would truly make it a Democratic stronghold. Democratic suburbs like NoVa often surround poor, astonishingly Democratic cities. The good news is that NoVa does surround such a city – and that city gave Democrats 92.46% of its vote in 2008. The bad news is that the city’s name is Washington D.C.

All this may not matter, however, if Northern Virginia continues its rapid growth. Today the exurbs in Loudoun and Prince Williams are the main sites of development, while Fairfax County’s growth appears to have slowed down. This translates into many more voters:

Analyzing Swing States: Virginia,Part 4

As Loudoun and Prince Williams become more diverse, moreover, they are been voting ever more Democratic. In 2000 Loudoun voted Republican by a 8.25% margin; in 2008 it voted Democratic by a 15.22% margin.

If Northern Virginia continues growing at this rate – and voting Democratic by a 3-2 margin – Virginia may eventually change into a Democratic-leaning state. This will probably be balanced out as other Democratic states naturally turn Republican-leaning. Nevertheless, adding NoVa to the old Democratic base leaves the Democratic Party in strong shape. That traditional base will be the subject of the next post.