Analyzing Swing States: Virginia, Part 3

This is the third part of a series of posts analyzing the swing state Virginia. It is the first section of two focusing on Northern Virginia. The fourth part can be found here.


NoVa

A vast and growing suburban metropolis, Northern Virginia has become increasingly important in Virginia politics. There, demographic changes have imperiled Republican dominance of Virginia.

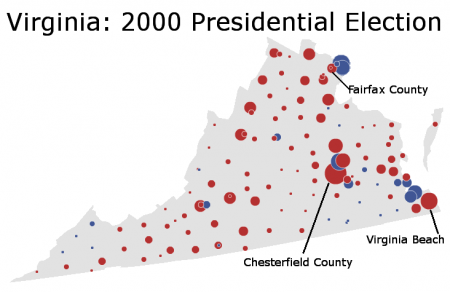
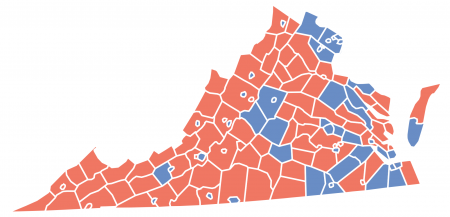
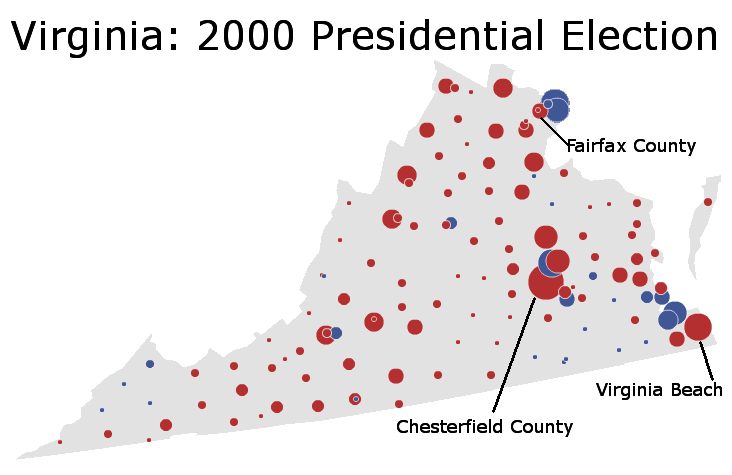
To illustrate the exceptional nature of this movement, compare the two elections below. Here is 2000:

Photobucket

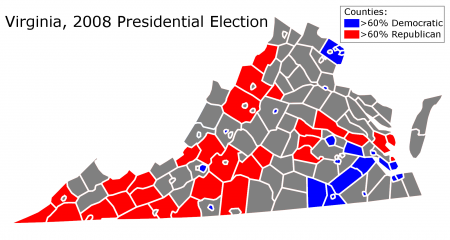
Eight years later, Northern Virginia has transformed:

Photobucket

More below.

In 2000, Governor George W. Bush had won Virginia by a comfortable 8.1% margin, carving out the traditional Republican coalition of rural and suburban Virginia. As this picture indicates, Virginia Democrats in 2000 really don’t have a base of support, except perhaps the heavily black southeast parts of the state. By 2008 Senator Barack Obama won the state by an equally comfortable 6.30% – a 14.3% shift in support.

Before digging into the dynamics of modern NoVa, it is worth exploring its past behavior to gain a sense of context.

A History

Northern Virginia was not always as populous as it is today; well into the twentieth century, it remained a rural (and heavily Democratic) backwater. In the 1940 presidential election, for instance, less than 10,000 people voted in Arlington County.

Growth began in the 1940s, however, driven by an ever-expanding federal government. The inner-ring suburbs in Arlington started expanding first, followed by Fairfax County in the 1950s. Like many other white and wealthy suburbs, Northern Virginia leaned Republican during this era.

Photobucket

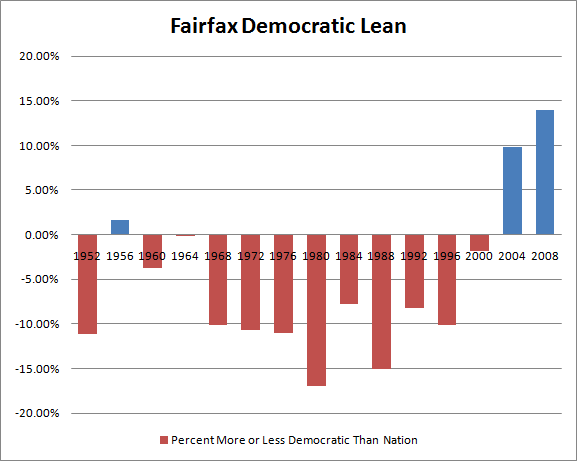
Unlike some suburbs, however, Northern Virginia never fell in love with Republicanism. In Fairfax County, Republican presidential candidates only once took more than 65% of the vote (in 1972) – something which would regularly happen in a place like Chesterfield County, a suburb of Richmond.

Change first began in the 1980s, when inner-ring suburbs such as Arlington started voting Democratic. In the 2000 map, one sees Arlington County as the lonely blue bubble to the right of Fairfax County.

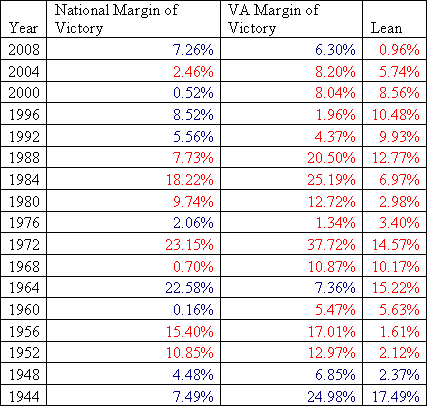
By 2000, as the graph above indicates, change was coming to the suburban communities in Fairfax. In 2004 the county voted Democratic by a 7.30% margin, which should have been a warning sign to Republicans. A mere two years later, it powered Democratic candidate Jim Webb to a narrow victory over incumbent Senator George Allen (he won the county by 18.9%). In 2008 Fairfax – well, just look at the map to see what happened in 2008.

In just eight short years, Northern Virginia has turned from a Republican-leaning suburb into a fundamental part of the Democratic base. Virginia has changed from a red state into a purple one, due mainly (but not entirely) to Northern Virginia.

The next post will explore Northern Virginia today – in order to get a sense of how this has happened.

–Inoljt, http://mypolitikal.com/
Polarization: Past and Present

A number of commentators have lamented increasing polarization in Washington. Conventional wisdom has it that America is as divided and partisan as it ever has been. Sectional divisions are tearing this country apart and preventing problems such as the deficit from being addressed; the differences between blue America and red America, in this view, are rapidly approaching crisis point.

There is some justice to this view. Polarization has probably increased, by a number of metrics, over the past few elections. Indeed, I previously noted something to this exact effect.

Let’s take another look, however, at the hypothesis, using a different type of measurement. Do blue states elect Republican representatives, and vice versa? In a polarized nation, this would probably not be the case.

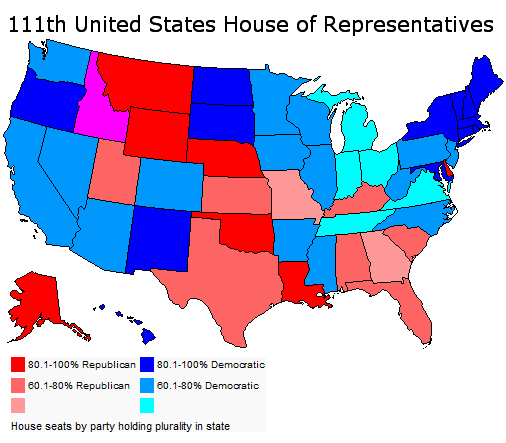
Here is the House today:

Polarization: Past and Present

Here is 1894:

Polarization: Past and Present

As this stark contrast illustrates, perhaps polarization ain’t so bad as it used to be.

More below.

The 2008 image is a fascinating map in that it almost perfectly matches the 2008 electoral college. One sees the Republican corridor of strength in the South and Mountain West. Most of the map is blue since Democrats have a 255-178 majority, the result of two previous Democratic landslides.

Here is a map of a House with a Republican majority:

Polarization: Past and Present

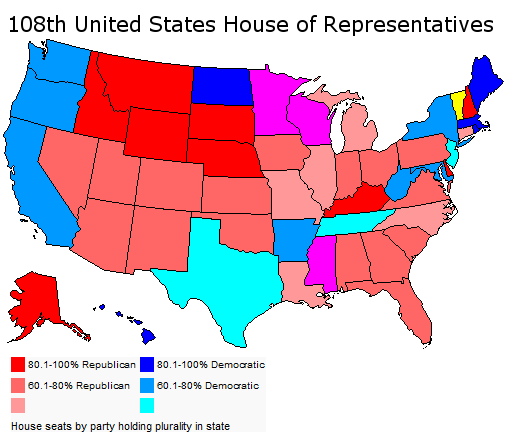
This House was the result of 2002 congressional elections. Republicans had done well in the wake of 9/11, and they had a 232-201 majority.

In the map there are relatively few states with 80-100% of representatives from one party. Blue states elect Republicans; red states elect Democrats. Moreover; for some states (e.g. Delaware, the Dakotas) it is mathematically impossible to be less than 100% Democratic or Republican.

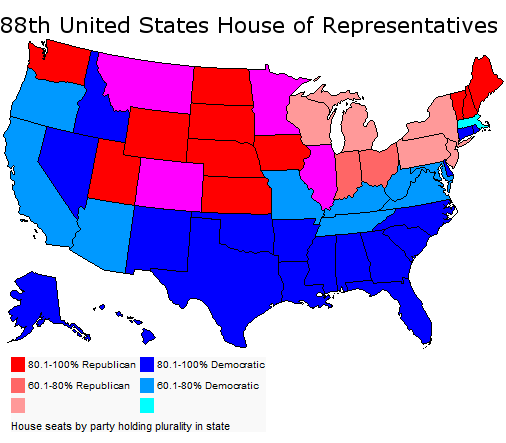
Let’s move back several decades:

Polarization: Past and Present

The date is 1960; President John Kennedy has just been elected. Democrats hold a 258-177 majority, almost identical to that today.

There are a lot more “one-party states” compared to the current map. Sectional division is far more pronounced; there is a line between North and South that simply does not exist in today’s House. In 1960 – especially in the still-standing Solid South – blue states generally did not elect Republicans, and vice versa.

Polarization grows even worse if one goes back further. Here is 2002, once again:

Polarization: Past and Present

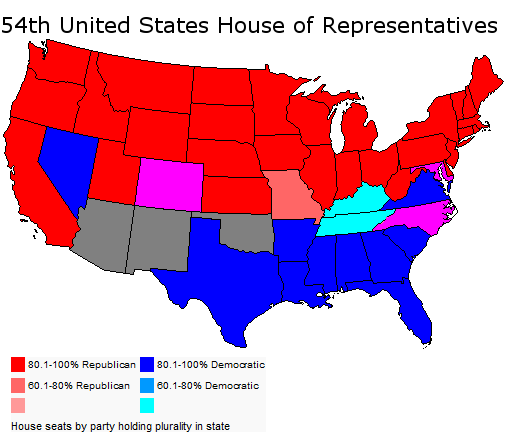
Here is 1894:

Polarization: Past and Present

Republicans have just won 130(!) seats. They hold a 254 to 93 majority.

In this incredible map, there are only six states with congressional delegations less than 80-100% from one party. In it one can literally trace the battlefields of the Civil War.

This is real polarization, the results of a nation so divided it had literally torn itself in two. This is the type of polarization that results from scars so deep that they took more than a century to heal.

Perhaps today America is indeed growing more polarized, more divided into red states and blue states. But when one compares the present situation to past ones, there is literally no comparison. The United States has a long way to go before it gets as polarized as it did during the latter half of the 19th century.

–Inoljt, http://mypolitikal.com/
Analyzing Swing States: Virginia, Part 2

This is the second part of a series of posts analyzing the swing state Virginia. It will focus on Republican Virginia. The third part can be found here.

Analyzing Swing States: Virginia,Part 2

History

After the Civil War, Virginia constituted a reliable Democratic stronghold. Conservative Democrats such as Harry F. Byrd, who controlled the state’s politics for decades, typified the state’s politicians.

Like many southern states, Virginia enacted a strict set of voting restrictions which successfully disenfranchised blacks. However, it never voted as overwhelmingly Democratic as the Deep South; only one Democrat (FDR) ever won more than 70% of the vote.

Earlier than most Southern states, Virginia began moving Republican, beginning in 1952 (when it cast the ballot for General Dwight Eisenhower). Republican strength rested upon the mountainous west (Republican even in the days of the Solid South) and the fast-growing, Republican-leaning suburbs. The west still votes Republican, but the suburbs are changing fast.

More below.

Republican Virginia

Analyzing Swing States: Virginia,Part 2

Like many states in the South – and, in fact, like America itself – the “normal” voter usually leans Republican. When one imagines a Virginian (perhaps a hard-scrabble Appalachian type or a white suburban businessman), one is usually looking at a conservative. It is the growing numbers of “other” voters in the state that are making it competitive today.

These Republicans have several factors in common. Exit polls of the 2008 presidential election provide an interesting but incomplete picture of who they are. As is true of the United States in general, Virginia Republicans are predominately white (60% voted for Senator John McCain, versus 55% nationwide). White college graduates are substantially more Democratic than white non-graduates, but polling did not reveal an income gap. Evangelism Evangelicalism constituted a major factor: white evangelicals voted for McCain by a 4-1 margin. Interestingly, white women did not vote much more Democratic than white men; Virginia’s gender gap was quite narrow relative to the nation at large.

As the map above indicates, the Republicans do best in the western reaches of Virginia. Partly this is because Democratic-voting minorities – mostly blacks – generally live in the east. The quick rightward drift of Appalachian America also accounts for Republican strength, which is growing in the region.

Republicans also retain strength in Virginia’s suburbs and exurbs. Specifically, suburban Richmond and Hampton Roads used to vote Republican quite strongly, ensuring Republican victories even when Democrats undercut their margins in rural Virginia. President Bill Clinton, for instance, did quite well in rural Virginia; it was his losses in these places (Chesterfield and Virginia Beach counties) that kept the state red.

The 2000 presidential election provides an illuminating illustration of Republican Virginia at a strong point:

Analyzing Swing States: Virginia,Part 2

In that election, Vice President Al Gore lost the state by 8.04% while barely winning the nationwide popular vote. Unlike Mr. Clinton, he was crushed in both rural and suburban Virginia. The former was quickly drifting right, while the suburb’s movement left had yet to materialize.

Since that time, of course, things have changed. While Democratic candidates previously – and mostly unsuccessfully – attacked the rural component of Republican Virginia, they have since switched their focus to populous, wealthy, and diverse suburban Virginia. In particular, Democrats have been appealing quite effectively to the suburban NoVa metropolis, which never really fell in love with Republicanism.

–Inoljt, http://mypolitikal.com/
Previewing Senate Elections: Illinois

This is the first part of a series of posts analyzing competitive Senate elections in blue states. The second part, which analyzes New York, can be found here.

Illinois

In November 2010, Democratic State Treasurer Alexi Giannoulias will face off against Republican Congressman Mark Kirk, in what looks to be a competitive Senate race. A heavily blue state, Democrats have been hurt by a bad national environment coupled with continuing fall-out from the Rod Blagojevich scandals.

Out of the three states being analyzed (the other two being California and New York), Illinois is the state in which Republicans are strongest. Out of the three, it is also the state with the most competitive forthcoming election. This post will analyze the political contours of the state, and the long and difficult path Mr. Kirk must tread for victory.

Previewing Senate Elections: Illinois

With respect to demographics, Illinois is structured very simply. It has three parts: Chicago, its suburban metropolis, and the mostly rural downstate.

To win, Congressman Mark Kirk will need to run a gauntlet of challenges in each of section of the state. He must capitalize on Republican strength downstate, revive it in the suburbs, and hope that Chicago turn-out is depressed. If done properly, this will result in a close-run, Scott-Brown type victory.

More below.


Downstate Illinois

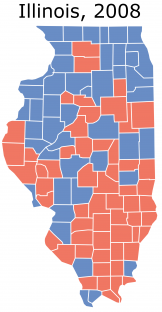
Mr. Kirk’s easiest task should be here.  Much of downstate Illinois has more in common with Kentucky and Missouri than far-north Chicago. Like these two states, the region has been trending Republican: Bill Clinton did far better than Barack Obama here.

There are several complicating factors. Downstate Illinois has several population centers – but these cities tend to vote less Republican (they all voted for Obama, for instance). Moreover, Mr. Kirk hails from the Chicago metropolis and has a reputation as a moderate congressman; he may not play too well with rural conservatives.

Nevertheless, the region constitutes the Republican base, and Mr. Kirk will need every vote he can get. He should be able to win downstate Illinois quite comfortably. He will have to. After all, President George W. Bush won practically every single county here – and he lost Illinois by double-digits.

Chicago’s Suburbs

The true test of Mark Kirk’s candidacy will come in the Chicago suburbs. His task is doable, but not exactly easy.

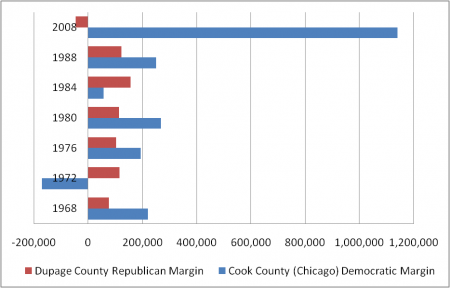
There is good news and bad news for Republicans. First the good news: unlike other solidly blue states, the Chicago suburbs still vote Republican. Like Orange County, for years their strength kept Republicans competitive in Illinois. Take a look at suburban DuPage County:

Previewing Senate Elections: Illinois

(Note: A negative margin indicates that Democrats lost Cook County, or that Republicans lost DuPage County.)

Even after Democrats started winning suburbs, during President Bill Clinton’s time, Chicago’s suburbs continued voting Republican. In 2004, for instance, George Bush won DuPage county by a little less than 10%.

The bad news for Republicans is that each election, they win the suburbs by a little less. In 2008 President Barack Obama swept DuPage County and the rest of Chicago’s suburbs by double-digits. This victory constituted the culmulation of decades of leftward movement.

The test for Mr. Kirk is the extent to which he can reverse this trend. He will not just have to win the suburbs, but turn the clock back two decades – back to the glory years in which Republicans won around 70% of the vote in DuPage County. (Mr. Kirk will probably not have to do that well, given rising Republican strength downstate.)

Is this doable? Given that Republicans seem to be winning suburbs everywhere this year, it is certainly possible. Mr. Kirk, moreover, has spent a decade representing a Chicago suburb congressional district; this is why Republicans have nominated him.

Chicago

43.3% of Illinois residents live in Cook County, home to America’s third-largest city. Of these, half call Chicago home; the other half live in an inner ring of suburbs.

If God decided to create the ideal Democratic stronghold, he would get something like Chicago. The city is heavily populated by black and Latino minorities, mixed together with a dollop of white liberals. As a cherry on top, it is also home to President Barack Obama – and Chicagoans are highly aware of this fact.

Whether he loses or wins by a landslide, Mark Kirk will not win Cook County. He will just have to take the blow, cross his fingers, and pray that minority turn-out is low (as it has been, this year). That is not a good strategy, but it is the best Republicans can do when 89% of them are white, and they are competing in a minority-majority city.

Conclusions

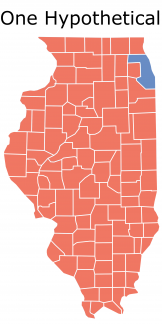
So what does Mr. Kirk have to do? Say that he gets 35% of the vote in Cook County – propelled by inner-ring suburban strength and minority apathy – and wins a landslide everywhere else in the state (for instance, a 3:2 margin). This gives him 50.3% of the vote in the 2008 Illinois electorate. If white Republicans downstate turn out, and minorities in Chicago do not, Mr. Kirk may get bumped up to a 2-3% victory.

Previewing Senate Elections: Illinois

As we will see, this task is easier compared to the challenges Republicans face in California and New York. In Illinois they can (barely) get away with a white-only coalition. In California Republicans absolutely must win minorities – a novel challenge. As for New York – it is similar to Illinois, except that New York City is double the size of Chicago. And upstate New York is trending Democratic.

–Inoljt, http://mypolitikal.com/  
Maps of Ohio Elections

By: Inoljt, http://mypolitikal.com/
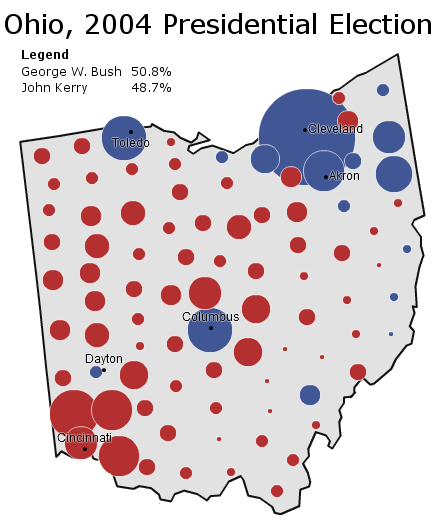
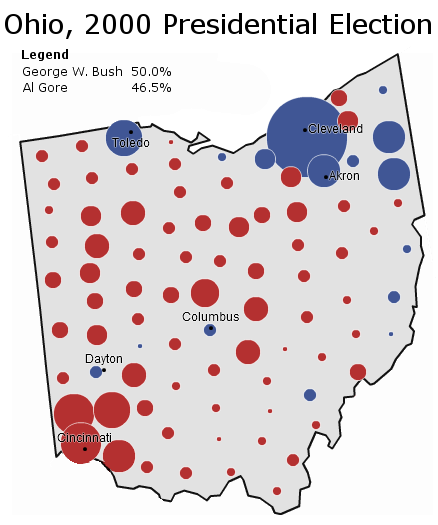
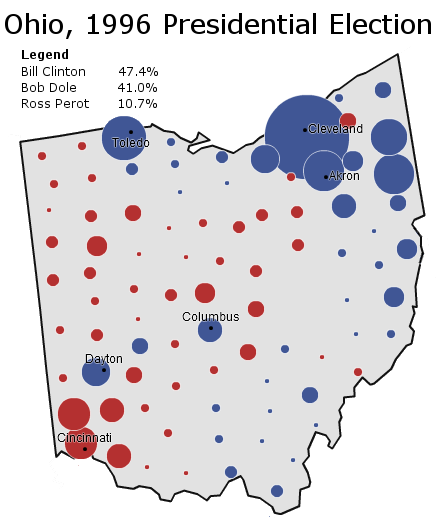
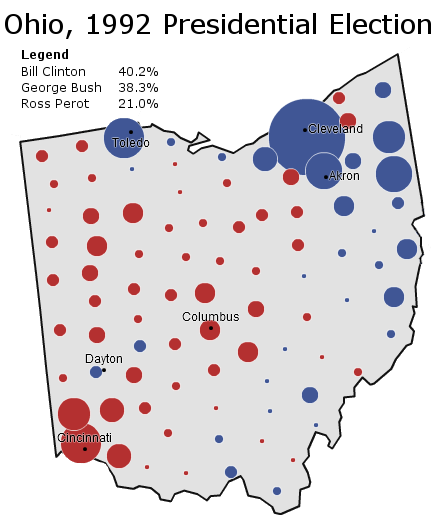
A few maps of Ohio’s presidential elections are posted below, for your enjoyment. Each map comes with some brief analysis.

Maps of Ohio Elections

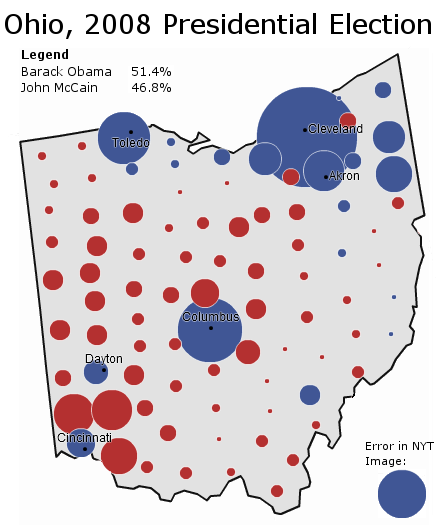
(Note: Because the Times stopped updating before all absentee/provisional ballots were counted, this map does not fully reflect the actual results. I have corrected the discrepancy.)

Senator Barack Obama wins Ohio by 4.6%, a solid but unimpressive victory. Mr. Obama performs poorly in traditional Democratic areas – the northeast and even Cleveland – but offsets this with unique strength in Columbus and Cincinnati. Senator McCain runs strongly in the Republican base.

More below.

Maps of Ohio Elections

President George W. Bush wins Ohio by a close but decisive margin. Senator John Kerry does extremely well – winning Columbus and Cleveland by what his campaign wants – but Mr. Bush’s exurban strength famously overwhelms this strength. Nevertheless, Ohio votes more Democratic than the nation, the first time since 1972.

______________________________________________________

Maps of Ohio Elections

Vice President Al Gore gives up Ohio before election-day; Governor George W. Bush wins the state by 3.5%. Perhaps, campaign strategists later muse, they should not have abandoned the state.

______________________________________________________

Maps of Ohio Elections

Incumbent Bill Clinton cruises to a comfortable victory – the best Democratic performance since LBJ (and before that, FDR). The former Arkansas governor runs strong in the industrial northeast and the Appalachian southwest, while severely undercutting Senator Bob Dole’s margins in Republican territory. It’s a classic Democratic victory.

______________________________________________________

Maps of Ohio Elections

It’s an exact replica of the 1996 map – except this time the Democratic strongholds are a bit less blue, the Republican strongholds a bit more red, and Ross Perot is running strong. Governor Clinton wins by a mere 1.8%.

The Massachusetts Special Senate Election: Aftermath

It’s been a bit since the Massachusetts election, in which unknown Republican Scott Brown emerged to upset the favored Democrat Martha Coakley in one of union’s deepest-blue states. Since then, Democrats have been recalibrating their strategy.

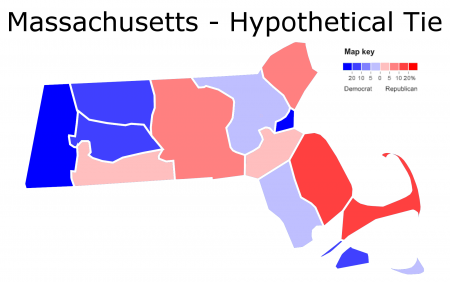
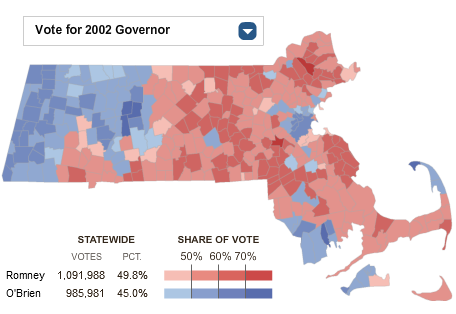
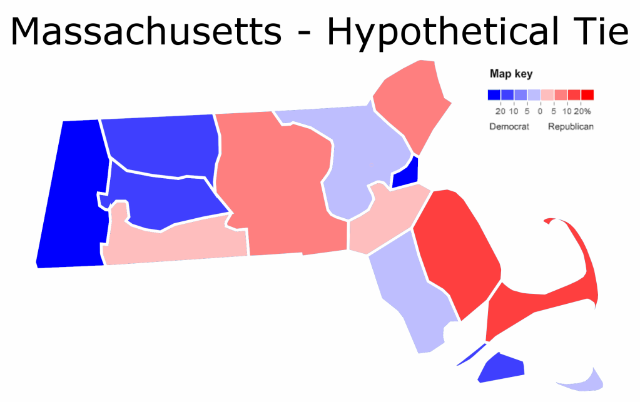
In a previous post, I outlined the results of how a tied election might look like. Let’s take a look at the prediction:

Photobucket

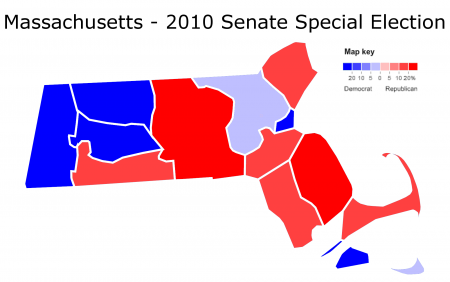
Now let’s see the actual results:

Photobucket

More below.

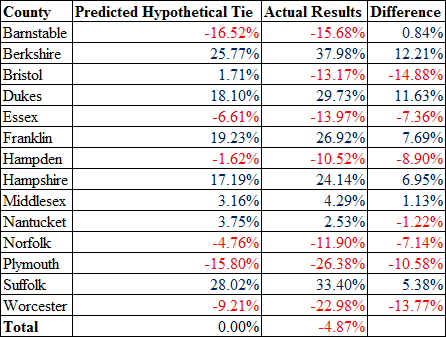
A clear pattern emerges: counties that the model forecast Ms. Coakley to win turned out more Democratic than expected, while counties that the model forecast Mr. Brown to win turned out more Republican than expected. The model, in predicting results, relied – incorrectly – on a uniform Republican shift from previous elections which Democrats won. The actual deviations indicate that Massachusetts shifted in a polarized manner: Democratic strongholds shifted Republican to a lesser extent than the state at large, independent areas shifted far more.

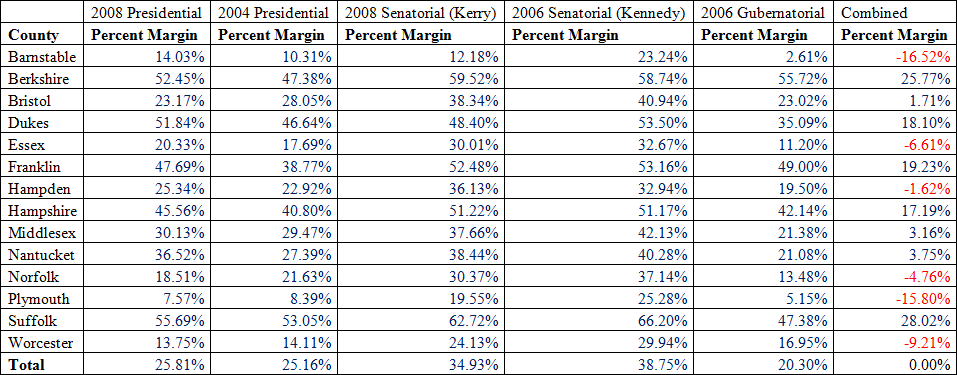
Here is a table of the results:

Photobucket

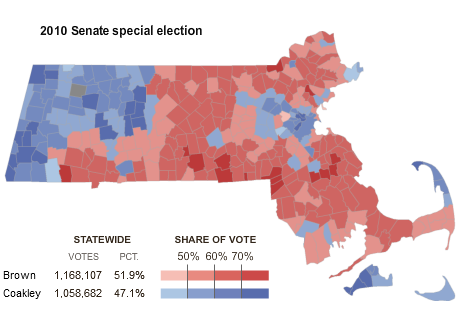
A number of outlets – especially us folks at swingstateproject – have gone even further, taking a look at the results by town. Here is the NYT:

Photobucket

The red areas constitute suburban Massachusetts, home to many of the white working-class Catholics that supported for Senator Hillary Clinton. These areas usually almost always vote Democratic, but they do so based off economic appeals rather than any innate liberalism (much like how West Virginia used to vote).

Republicans generally win Massachusetts by taking away suburban Massachusetts. Mr. Brown’s coalition replicated previous Republican victories:

Photobucket

Interestingly, President Barack Obama did relatively poorly in these suburbs – his performance was the worst since President Bill Clinton’s first run in ’92. He still won them, of course (Massachusetts, lest people forget, is a Democratic stronghold), but by less than previous Democratic candidates. In fact, Mr. Obama underperformed throughout the Northeast, which is something few people know.

The areas Ms. Coakley won generally constitute the “liberal Massachusetts” Republicans love to insult. They are college towns and generally well-off, liberal places.

On the other hand, a number of  towns do not fit these stereotypes. Minorities in Boston, for instance, are responsible for it being a Democratic stronghold (unfortunately for Ms. Coakley, they did not turn out). Much of the rural west, which supported Ms. Coakley by a wide margin, is very white and not that wealthy.

If there is any good news from this election for Massachusetts Democrats, it is that they now have this information. The data provided by Mr. Brown’s surprise victory should prove useful for redistricting, future campaigns, and even predicting the future of Massachusetts politics. Hopefully they will not be caught off guard a second time.

–Inoljt, http://mypolitikal.com/
Analyzing Swing States: Virginia, Part 1

This is the first part of a series of posts analyzing the swing state Virginia. The second part can be found here.

Analyzing Swing States: Virginia,Part 1

During the ’08 campaign, the political beltway famously defined Virginia as a Republican stronghold gone Democratic. For ten straight presidential elections, the state had reliably turned up in the Republican column. President Barack Obama, however, promised to change that – and he did.

More below.

Virginia indeed is becoming bluer – but not as much as one might think. The state moved Republican sooner than the rest of the South, but never became as deep red as places like Alabama. The actual trend from ’04 to ’08 is less prominent than one might think:

Analyzing Swing States: Virginia,Part 1

I think this in fact slightly understates Republican strength. Mr. Obama, after all, fit extremely well with Virginia’s Democratic base – blacks and rich NoVa residents. He might have overperformed. In many ways, Virginia still constitutes a purple state, perhaps even a red-leaning one. Democrats must run competent candidates and/or do this in favorable national environments; if both conditions are missing, they may get pummeled ala Creigh Deeds.

This may change in the future. As its wealthy, diverse, and Democratic-leaning NoVa suburbs continue growing; Virginia may soon become more Democratic than even Pennsylvania. This trend was much noted in 2008.

What is less noted is the degree to which the media has overstated this change. These demographic shifts are the work of decades, not one election; they occur very gradually. Moreover, even as bluing NoVa expands, Virginia’s western regions continue to redden – especially the once Democratic-leaning panhandle. This blunts the NoVa effect. Virginia may be turning Democratic, but Democrats should not underestimate continued Republican strength.

–Inoljt, http://mypolitikal.com/
Analyzing Virginia’s 2009 Gubernatorial Election, Part 2

This is the second part of two posts analyzing Virginia’s 2009 gubernatorial election. The previous part can be found here.

When Democrats nominated State Senator Creigh Deeds, they nominated a rural, moderate Democrat designed to win the small towns and rural regions of western Virginia. In an ideal situation, Mr. Deeds would have carved out a coalition similar to former Governor Mark Warner’s.

Photobucket

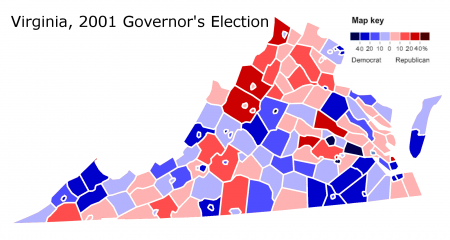
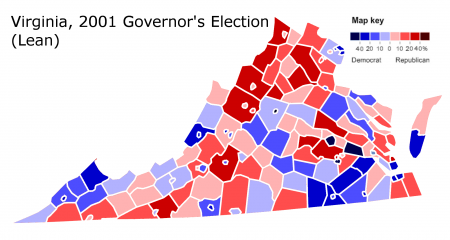
In 2001, Mr. Warner won a 5.13% victory over Attorney General Mark Earley, based largely upon rural support in western Virginia.

Mr. Warner is famous among Democrats for this achievement (remember, this was just two months after 9/11). He went on to become a successful and very popular governor; in 2008, Mr. Warner ran for Senate and won double his opponent’s vote. Since Mr. Warner, no other Democratic candidate has ever built a coalition similar to his.

More below.

Below is Virginia’s political lean during the 2001 gubernatorial election:

Photobucket

These maps indicate the results of a hypothetically tied election, which is useful to determine the political lean of each county (i.e. whether a certain place voted more Democratic or Republican than the state as a whole). For example, last year Indiana voted for President Barack Obama – but relative to the country as a whole, it leaned Republican.

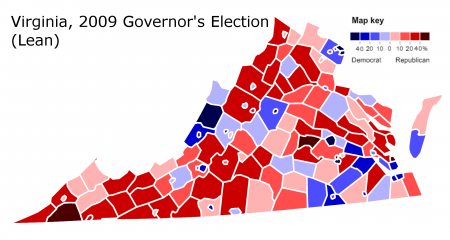
For comparison, here is the correlating map for Creigh Deeds (if Mr. Deeds had tied Mr. McDonnell), which I mapped in my last post:

Photobucket

As the maps indicate, Creigh Deeds failed miserably at recreating the rural Warner coalition. Despite being a rural candidate, Mr. Deeds did far worse in rural western Virginia.

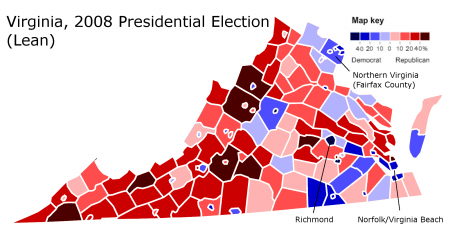
Instead, Mr. Deeds appears to have done best in urban Virginia: Northern Virginia, Richmond, and the Norfolk-Virginia Beach metropolitan area. Rather than repeating Mark Warner’s coalition, the performance of Creigh Deeds appears far closer to that of President Barack Obama’s:

Photobucket

Mr. Obama won through a urban-suburban alliance, compared to the urban-rural alliance of Mr. Warner.

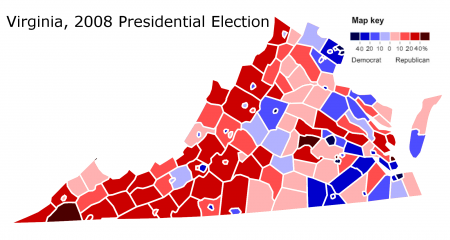
Here is Mr. Obama’s performance without the lean:

Photobucket

To be fair, I would prefer the Obama coalition to the Warner coalition: suburban strength is more lasting than votes built upon dying small towns.

Nevertheless, it is discomfiting to note the extent to which a candidate like Creigh Deeds – a rural, moderate Democrat who distanced himself from Mr. Obama – replicated the president’s performance. For better or for worse, it seems, Democratic candidates will from now on be attached hip-to-hip with Mr. Obama.

(Note: All statistics are derived from http://www.uselectionatlas.org/ ).

–Inoljt, http://mypolitikal.com/
What to Look For in the Massachusetts Special Election

By: Inoljt, http://mypolitikal.com/
Results are soon pending in the special election to replace Senator Ted Kennedy. Once a guaranteed Democratic victory, the race has become surprisingly competitive due to a bad national environment and a lackluster campaign run by Democrat Martha Coakley. In fact, several polls have put Republican Scott Brown in the lead, striking panic amongst the Democratic establishment.

Interpreting incomplete results can be difficult if one is not familiar with how different areas in a state vote. Senator John McCain, for instance, led the vote in Virginia during much of election night; this was because deep-red rural Virginia reported first. After Democratic strongholds in Northern Virginia began posting, Barack Obama quickly pulled away (he ultimately won by 6.30%). Because Massachusetts is rarely competitive outside of gubernatorial elections, geographic unfamiliarity probably extends to even most politically active folk.

I have therefore created a map indicating what a tied election would probably look like:Photobucket

More below.

Interpreting incomplete results can be difficult if one is not familiar with how different areas in a state vote. Senator John McCain, for instance, led the vote in Virginia during much of election night; this was because deep-red rural Virginia reported first. After Democratic strongholds in Northern Virginia began posting, Barack Obama quickly pulled away (he ultimately won by 6.30%). Because Massachusetts is rarely competitive outside of gubernatorial elections, geographic unfamiliarity probably extends to even most politically active folk.

This map takes data from all statewide elections since 2004, derives the electoral lean of each county, and then averages these results to produce the picture. Here is the data by county:

Photobucket

Ironically, Republicans do better in the most populous counties – the opposite case for the nation in general. Republicans are strongest in the state’s suburbs; Scott Brown will need to win all of them to take the state (on the other hand, these wins need not be exceptionally large). On the other hand, Democrats do best in the city Boston and the more rural western reaches of the state.

Thus on election day when the results start coming in, take a look at the above table and compare it to the actual performances each candidate is posting. Whichever candidate is generally outperforming the table will likely win the election. Finally, look at who is winning Hampden and Bristol counties – the two places that vote closest to the state as a whole. If Martha Coakley is winning them, expect a Democratic victory. If Scott Brown is, then a Republican shocker is in the works. If the two are split, it will a nail-biter that goes deep into the night. There have been not many of those lately.

Whatever the case, tomorrow Tuesday ought be an exciting day for politics buffs. There are not many races where the result has been so uncertain – where practically anything can happen and it would not be surprising for the polls to be completely off. It will be quite interesting to watch.

Analyzing Virginia’s 2009 Gubernatorial Election, Part 1

This is the first part of two posts analyzing Virginia’s 2009 gubernatorial election. The second part can be found here.

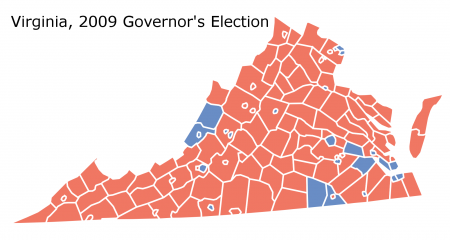
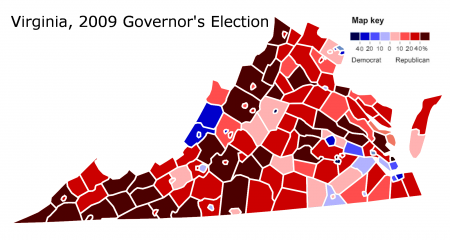
Photobucket

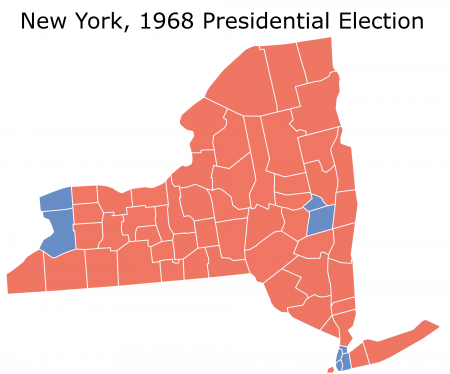
A normal observer might see the above map and naturally conclude that the Democratic candidate lost a landslide election. This is not always the case. In the 1968 presidential election, for instance, the state of New York looked like this:

Photobucket

Although it does not look like it, Democratic candidate Hubert Humphrey won the state: 49.76% to 44.30%.

In November 2009, however, State Senator Creigh Deeds did in fact receive a thorough pummeling from Attorney General Bob McDonnell. An unappealing candidate running in a tough national climate, Mr. Deeds lost the race 41.25% to 58.61%.

More below.

Creigh Deeds only won two types of counties: his home district and Democratic strongholds. The former include the two blue counties along the state’s eastern border. The latter are populated by two Democratic constituencies: firstly, blacks in Virginia’s 3rd congressional district and secondly, wealthy suburbanites south of Washington (Virginia’s 8th congressional district).

Surprisingly (and disturbingly) Mr. Deeds lost Fairfax County, the key to recent Democratic success in Virginia. Rich, diverse, and heavily populated – Northern Virginia suburban voters were largely responsible for Democratic victories by Governor Tim Kaine, Senator Jim Webb and President Barack Obama.

Mr. McDonnell’s victory in Fairfax indicates one of two things. Either the Democratic Party has not entrenched itself in NoVa – or it is moving back to the Republicans. The latter possibility is highly worrisome and not simply confined to Virginia.

There is little more that the above map indicates – one cannot tell much from a map that just shows red counties. Differentiating the mass of red reveals more:

Photobucket

This image maps the results based on degree of support. It shows a substantial east-west divide hidden in the first map. Western Virginia voted Republican with far more intensity; eastern Virginia tended to be more moderate in its support of Mr. McDonnell.

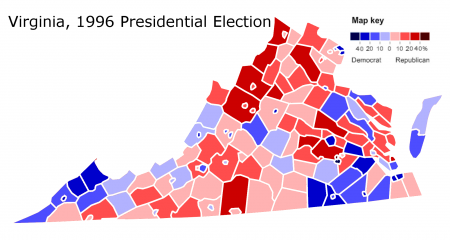
Notice how intensely Republican the western panhandle is voting. These voters – poor, white, rural Appalachian folk – used to vote Democratic based on economic appeals. This trend subsisted even in fairly recent times: John Kerry won a couple counties; Senator Jim Webb took three. Former president Bill Clinton did even better (he lost the state by 1.96%):

Photobucket

Creigh Deeds, a moderate politician representing an Appalachian district, was supposed to appeal to the rural voters populating western Virginia; as the map makes evident, he failed to do so (outside his home districts). I suspect Barack Obama  may have something to do with this; his poor performance amongst Appalachian voters may be affecting Democratic candidates everywhere. Given the many Democratic politicians elected from Appalachia, this – if true – would definitely be a bad thing for Democrats.

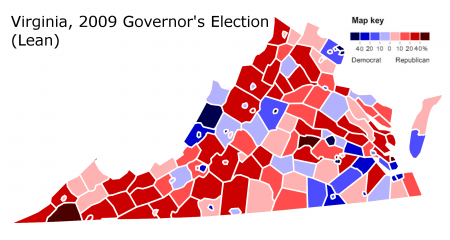
Finally, it is possible to map the results if Mr. Deeds had tied Mr. McDonnell:

Photobucket

This indicates the relative Democratic or Republican lean of each county – a county may vote Republican but still lean Democratic compared to the overall result, and vice versa. Massachusetts, for example, voted Republican in Ronald Reagan’s 1984 landslide – but nobody would accuse it of being a Republican state. It went red, but relative to the rest of the nation was more Democratic.

The next section will compare this map with similar images derived from previous Democratic coalitions.

(Note: All statistics are derived from http://www.uselectionatlas.org/).

–Inoljt, http://mypolitikal.com/