I Know What the Beltway Pundits Are Missing (NV-Sen, NV-03)

(Also at Nevada Progressive)

It seems whenever I see the DC pundits on TV, I get frustrated. I keep hearing about some massive “Red Tide” coming. I keep hearing about how much “momentum” Republicans have. And I keep hearing about all this money Sharron Angle is raising from other parts of the country.

So is it time to call it quits and give into “The Red Tide”? Not really. I know something that you may not…

Public Policy Polling just released its latest Nevada Senate poll. In their official numbers, Harry Reid gets 47% while Sharron Angle gets 45%. OK, so Reid is barely ahead… What’s the big deal? It’s basically a tie race… Or is it?

In an earlier post on their blog, they admitted that they may be missing something quite big.


Usually the conventional wisdom is that a tie race means the incumbent will lose but in the case of Nevada there are a couple big reasons why the tie might go to Harry Reid.

The first is that the polling in Nevada was the worst of any swing state in 2008 (well actually it turned out Nevada wasn’t a swing state but everyone thought it was because the polling showed a close race.) And the polling was all off in the same direction- underestimating Barack Obama’s margin of victory. Obama won the state by 12 points: our final poll had him up by only 4, Mason Dixon had him up by only 4, Rasmussen had him up by only 4, and CNN had him up by only 7. Some pollsters did do a better job- Suffolk showed a 10 point lead, Zogby an 11 point one, and AP a 12 point one.

So the precedent is there for pollsters- especially the ones who have been doing most of the polling for this year’s race- to underestimate Democratic performance in the state. […]

The second is that those below the radar in 2008 voters may now be included in pollsters’ samples- I can only speak for what we do but we’re calling folks who voted in the 2004 general, 2006 general, or 2008 general so we should have a lot of the people we missed last time in our samples this time. Still it strikes me as much more likely that the polls are systematically underestimating Harry Reid than the other way around.

The other reason the tie might go to Reid is that the polling in Nevada is assuming a much larger gap between Democratic and Republican turnout compared to 2008 than we’re seeing most places. In our poll tomorrow the sample reports having voted for Barack Obama by only 2 points, compared to his actual 12 point victory in the state. Even with that big dropoff in turnout from Democrats the race is still very close- but if even half of that enthusiasm gap was chopped between now and November Reid would be in a very strong position. And we have seen indication already this cycle that Democratic interest perks up as election day gets closer.

I certainly think Angle can win by a small amount but if you asked me who has the better chance of winning this by 5 or 6 points I definitely think it’s Reid.

Again, this is Tom Jensen of Public Policy Polling, a very respectable polling outfit, admitting that his own poll may be missing quite a few Democratic voters here in Nevada. And I can attest, he may very well be right.

Don’t believe me? Believe all the support I’m finding around “my ‘hood” in Henderson!

And take a look at these supposedly “unenthusiastic” Nevada Democrats getting out the vote!

It’s all at my Twitpic!

This is the secret to our success, the secret that you don’t hear about from the national media hyping Angle’s out-of-state fundraising and generic ballot numbers all over the place.

And there’s something else you don’t see. You don’t see the (lack of) quality of the Republicans’ top candidates.

I mean, come on, Angle runs AWAY from the local press! She won’t answer any voters’ questions on anything, especially if one’s not a hand-picked tea-nut.

That’s why even prominent Nevada REPUBLICANS are supporting Harry Reid.

And again, I can tell you that this is no myth. I talk to them often, long time Republicans and Indpendents who often vote for Republicans have come to me and told me they’re voting for Harry Reid and Dina Titus because they know these people are working hard to do what’s best for Nevada.

Heck, even Joe Heck himself was caught flip-flopping yesterday on whether he will be voting for Reid or Angle!


Republican Congressional candidate Joe Heck appears to be having second thoughts about his support for Republican U.S. Senate candidate Sharron Angle.

When asked by a Nevada resident whether he plans to vote for Angle or Democratic Senate Majority Leader Harry Reid, Heck was quoted by Slate as saying: “I’m waiting to see all of the evidence before I make my choice.”

That’s very different from what Heck said before. He previously endorsed Angle.

In a speech at the Nevada Republican Convention, Heck urged Republicans to rally around Angle to “bring a new direction to Washington, D.C.” He called her work in the state Assembly “exemplary.”

Heck also noted in a campaign email that “Team Heck is taking a leadership role in uniting the party.”

Just like Sharron Angle, Joe Heck has been all over the place on all the issues while hiding from Nevada voters with real questions about what he intends to do on job creation, health care reform, housing, and so much more. Yesterday, we had a Congressional debate at the local synagogue here in Henderson. Watch for yourself how Heck flipped and flopped on so many issues.

Or if you can’t sit through this much video, look at my handy, dandy condensed Twitter debate notes. 😉

Basically, Joe Heck likes to tell teabaggers he’s one of them and he’s just as extreme right radical as Sharron Angle while he tells us he doesn’t know if he’ll even vote for Angle himself! Which one is it, Joe?

Heck told us last night he supports “infrastructure projects” to put people back to work, but he also said he opposed the very Recovery Act that included all those billions of dollars in infrastructure projects that are putting Nevada back to work. Which one is it, Joe?

Heck told us last night he supports some aspects of health care reform, but he’s said many times before he wants to repeal the entire bill. Which one is it, Joe?

And Heck told us last night how important jobs are to him, but he’s also said he doesn’t think it’s his job to create jobs. Which one is it, Joe?

Heck keeps saying all sorts of things out of different sides of his mouth. And while the tea-nuts may not care, a whole lot of voters do. They’re looking for someone who provides real solutions, not another pretty face with nothing to offer but hot air.

And look who is providing real solutions.

Dina explained quite well last night how she’s worked to bring jobs back to Southern Nevada, as well prepare us for the new clean, green economy of the future by investing in green collar jobs and good education. And it’s not just at these debates. I see Dina Titus just about everywhere. She’s meeting with constituents every time she’s back here in the district. Even when Congress is in session, she’s back here every weekend to meet with Nevadans.

And her office is always open to constituents who have questions about their health care. And constituents who need help negotiating with the banks to avoid foreclosure on their homes. And constituents who have all sorts of other issues.

Dina is the kind of representative that many Nevadans aren’t used to, and that’s a good thing. She listens to us the local voters. And she provides real answers, not hot air or prepared, scripted remarks directly from national party offices. The Beltway pundits may not care so much about that, but we the Nevada voters do.

So this is what the Beltway pundits are missing. They’re missing me. They’re missing my Republican neighbors who are fed up with typical politicians like Joe Heck and Sharron Angle, who say one thing but do something else entirely different. They’re missing all my Democratic friends who they don’t expect to vote, but are actually not just voting, but also volunteering to get out the vote! They’re missing a whole lot, so don’t be surprised if a whole lot of what they say about the elections here are proven wrong next month.

Take it from this local. 😉

atdleft’s Nevada Legislature Forecast

OK, OK, here’s what I know you’ve been waiting for. I teased some of these last month, but now you can see my full Senate and Assembly reports after the flip.

I only listed competitive races below, as the rest probably won’t see too much actions. Click here for Nevada Legislative Districts, here for the latest voter registration statistics from the Nevada Secretary of State, here for a list of the candidates in Washoe County, and here for a list of candidates in Clark County.

Key:

County District Number: Which county the district is based in

(Area: Neighborhood): self explanatory

Incumbent: who’s in office now (if someone’s retiring, I list it as “Open Seat”)

atdleft’s Impartial Rating: how I rank this race, based on voter registration statistics, quality of the candidates, who won where when, and who’s organizing where right now

And I rank the races from highest to lowest on likelihood of flipping.

Senate:

Overall Rating: Likely Democratic Retention

Republicans have been hoping to retake the Legislature, but the numbers just don’t agree with them in either house. The Senate seems to be the more vulnerable chamber for Democrats, but they’ve worked hard to recruit solid candidates and put together a stellar field operation. While there were plenty of jitters at first over how major weakness at the top of the ticket could hurt, it now looks like the state party’s field efforts for Harry Reid and Dina Titus may turn out to help a number of candidates down the ballot. And Republicans’ lack of field campaigning and abundance of controversial candidates only add to their woes.

Clark District 8 (Las Vegas: Summerlin)

Incumbent: Barbara Cegavske (R)

atdleft’s Impartial Ranking: Tossup/Tilts Republican

Cegavske must be thanking her lucky stars that she’s running this year instead of 2008. Next door in District 6, long time GOP stalwart Bob Beers famously lost to political neophyte/local business owner Alison Copening over his polarizing hard-core conservatism and not realizing Obama’s campaign drove Nevada Democrats into overdrive. But even though 2010 may not be as scary of a cycle for Republicans this year, Cegavske still must deal with her own polarizing hard-core conservatism in a district where Democrats have a slight 0.9% registration edge. And Democrats got an all star recruit of a candidate with legal maven Tammy Peterson. And with Harry Reid and Dina Titus both counting on the party to pump up Democratic turnout for them, th GOP can’t count on an “enthusiasm gap” to save Cegavske (but maybe a “voting gap” if some Dems undervote).

Clark District 9 (Las Vegas: Summerlin/Mountain’s Edge/Southern Highlands/Primm)

Open (R) Seat

atdleft’s Impartial Ranking: Tossup/Tilts Democratic

This is probably the Democrats’ best chance of a Senate pickup this year. Incumbent moderate Republican Dennis Nolan was “tea partied” out by a primary challenge by super neophyte 27 year old no-name secretary “office manager” and teabagger darling Elizabeth Halseth. So all of a sudden, what had been a likely GOP hold is now fully in play and a young newcomer by the name of Benny Yerushalmi all of a sudden has a great chance at joining “The Gang of 63”. This will definitely be a hard fought race until the very end, but Benny does have the advantage of a 2.4% Dem registration edge and a strong Dem field operation.

Clark District 12 (Mesquite/Henderson/Boulder City/Laughlin)

Open (R) Seat

atdleft’s Impartial Ranking: Leans Republican

This is without a doubt the most stretched district, bordering Arizona all the way from Mesquite to Laughlin! And there are plenty of rural areas here that strongly favor Republicans, so Assembly Member Joe “Doc” Hardy (R-Boulder City) has a natural advantage here. However this district also contains many Vegas suburbs, from Henderson’s fringes to North Las Vegas’ Aliante master planned community, so all in all the GOP only has a slight 1.2% registration edge here AND Obama carried this district in 2008. Plus, Democrats recruited a top-notch legal eagle Aaron Ford to run here. Still, Ford has to deal with Hardy’s entrenched status in Boulder City and the rurals’ seething hatred of all things Reid and Titus. But if the Dem Machine can whip out enough Reid & Titus voters in this district to keep voting down the ballot, Ford may have a chance.

Clark District 5 (Henderson/Las Vegas: Green Valley, MacDonald Ranch, Old Henderson, Silverado Ranch)

Incumbent: Joyce Woodhouse (D)

atdleft’s Impartial Ranking: Leans Democratic

This is the one Senate race where Democrats have to play defense. The Republicans are pouring money into attacking Woodhouse as a “loony liberal” in this closely divided suburban district (Dems have about a 1.3% registration advantage) and promoting slick lawyer Michael Roberson. One would think Joyce would be a goner in this type of environment, but she has a few trump cards to play here. Dems have a far better field operation than the GOP, Joyce has a good reputation as a “grassroots person” and a long time teacher, and Roberson has what may be the ugliest skeleton to hide in the closet this campaign cycle (he’s worked on kicking homeowners out of foreclosed homes). This won’t be easy, but Woodhouse most certainly has a path to victory here.

Washoe District 2 (Sparks/Pyramid Lake)

Open (R) Seat

atdleft’s Impartial Ranking: Leans Republican

Again, the GOP lucked out with this seat. If perennial religious right bomb thrower Maurice Washington had faced reelection in 2008, he would have likely lost in this closely divided district that spans from the Reno suburbs to the California and Oregon borders. (Republicans only have a 2.2% registration edge here.) But because Washington is termed out and the seat is open this year, they may get a reprieve. Still, they may not be completely out of the woods yet. Democrats recruited yet another star candidate in nonprofit consultant Allison Edwards, but GOP Assembly Member Don Gustavson (R-Sparks) probably still has the advantage here.

Assembly:

Overall Rating: Safe Democratic Retention

Let’s be real. Republicans need to pick up eight seats to take control of the Assembly. That just isn’t happening. There just aren’t enough seats in play for them, and there are even a handful of seats where they have to play defense. The best they can hope for is denying Democrats a 2/3 supermajority, but not even that is a given for them.

Washoe District 40 (Carson City/Rural Washoe)

Open (D) Seat

atdleft’s Impartial Ranking: Tossup/Tilts Republican

Ironically enough, the race that could really tip the scale in Carson City happens to be IN Carson City! But unfortunately for Democrats, this is a seat that could cost them the 2/3 supermajority they just reached in The Assembly. Incumbent Bonnie Parnell announced late last year that she would not seek another term, so Democrats scrambled to figure out how to possibly hold this seat that usually isn’t too Dem friendly. (The GOP has a somewhat hefty 8.5% registration edge here.) Fortunately, Democrats found a top-notch candidate in Carson City Supervisor Robin Williamson. Unfortunately, the GOP tapped into the same pool in recruiting fellow Carson City Supervisor Pete Livermore to run. This could be a real barn burner of a race, with Livermore benefitting from the natural Republican lean of this district. However, don’t forget that this district also has a high concentration of state workers, so union and environmentalist mobilization for Williamson may yet keep this seat in Dem hands.

Clark District 13 (Las Vegas: Centennial Hills, Summerlin)

Open (R) Seat

atdleft’s Impartial Ranking: Tossup/Tilts Democratic

In 2008, incumbent Republican Chad Christensen came shockingly close to losing this long GOP held seat to Democrat Andrew Martin, a candidate who worked quite hard but didn’t get too much party support. However in 2010, Democrats aren’t making the same mistake. They’re all in for Building Trades (union) trainer Lou DeSalvio. Still, Republicans aren’t giving this up without a fight, and they’ve recruited UNLV Political Science Professor Scott Hammond to be their fighter. This should be another hard fought race, but Democrats do have the advantage of a slight 1.6% registration edge and a mobilized turnout operation (for Harry Reid and Dina Titus that may also help lift DeSalvio to victory).

Clark District 21 (Henderson: Green Valley, MacDonald Ranch)

Incumbent: Ellen Spiegel (D)

atdleft’s Impartial Ranking: Leans Democratic

In 2008, everyone was shocked when Republicans lost this long-time GOP stronghold to web-based small business owner Ellen Spiegel. Now NO ONE has held this seat for more than one term (Republicans kept primary-ing each other!), but funny enough a Democrat is now looking to break “The One Term Wonder Curse” of AD 21. Now usually in a year like this Spiegel would be hopeless, but she’s built a surprisingly good field operation and earned the endorsements of both the Las Vegas AND Henderson Chambers of Commerce, which usually do NOT endorse Democrats. And unfortunately for the GOP, this year’s primary was quite tumultuous and Mark Sherwood, who emerged victorious in the primary, has alienated both moderates with his religious right fervor and some local “Tea Party” groups by not signing their anti-tax pledge. If it weren’t for the Republicans’ 2.4% registration edge in this district, they’d have to completely write off this seat. But as it is, they have a real uphill battle to reclaim it.

Clark District 23 (Henderson: Old Henderson)

Incumbent: Melissa Woodbury (R)

atdleft’s Impartial Ranking: Leans Republican

In some ways, AD 23 is AD 21 in reverse. This was the seat of Former Assembly Speaker Richard Perkins (D). Democrats simply didn’t expect to lose this seat in 2008, but lose it they did… And to local educator Melissa Woodbury, daughter of legendary Clark County Supervisor Bruce Woodbury (R). It was probably the Dems’ biggest mistake of 2008, and it looks like they may be repeating it by backing Monica Lejia Bean, a candidate who’s hardly visible at all. Woodbury looks to have lucked out, but she’s not out of the woods yet… Not when there’s an 8.8% Dem registration edge AND major Democratic and union GOTV operations working against her. But if she could get some Obama ticket-splitters in 2008, she may very well get enough Reid/Titus ticket-splitters in 2010 to keep her in office.

Clark District 29 (Henderson: Green Valley, Whitney Ranch)

Incumbent: April Mastroluca (D)

atdleft’s Impartial Ranking: Leans Democratic

In 2008, the GOP finally lost this seat, which has been trending away from them for some time. And while Freshman Dem April Mastroluca at times doesn’t seem to be the strongest campaigner, she most certainly benefits from a very strong Democratic field operation, plenty of union support, and a comfy 5.3% Dem registration edge. Openly gay Republican challenger Dan Hill flew under the radar in the primary, but he can’t expect to keep doing so in the general. (I have a feeling Sharron Angle won’t be doing him any favors any time soon…)

Clark District 22 (Henderson/Las Vegas: Black Mountain, MacDonald Ranch, Anthem, Southern Highlands, Mountain’s Edge)

Incumbent: Lynn Stewart (R)

atdleft’s Impartial Ranking: Leans Republican

Lynn Stewart really lucked out in 2008. No Democrat emerged to challenge him, so he coasted to reelection while other GOP incumbents fell. And this year, he looks to have lucked out again. Local “Tea Party” groups didn’t find him “conservative enough”, so they waged a primary coup against him… But problem was, so many candidates filed against Stewart that he was able to win the GOP Primary with 47%. But this time, several Democrats did file and soon-to-open Cosmopolitan Casino accountant Kevinn Donovan emerged out of the primary. Still, even with the state Democratic Party organizing hard for the top of the ticket here, Donovan nonetheless has a major uphill battle against Stewart.

Washoe District 30 (Reno/Sparks)

Incumbent: Debbie Smith (D)

atdleft’s Impartial Ranking: Likely Democratic

Debbie Smith has certainly had her ups and downs. A few years back, she lost her race here… But she came back and she had an easy ride in 2008 with “The Obama Wave”. But this time around, Republicans are targeting her yet again, and even Sharron Angle has personally endorsed her opponent, Kathy Martin. However the Reno/Sparks Chamber of Commerce, which usually doesn’t endorse Democrats, endorsed Smith, mainly because she stands to Chair the nearly omnipotent Appropriations Committee and provide plenty more “juice” for Northern Nevada if she wins reelection. And with a whopping 16.3% Democratic registration advantage here, Smith may have all that she needs to weather the storm this time.

NV-03: Life Inside a “Swing District”

(Also at Nevada Progressive)

All too often, I hear the Beltway pundits chatter away over national poll numbers, party fundraising, who’s hiring which lobbyists, what the strategists at The White House must REALLY be thinking, and so much more.

But you know what? Here in what may be one of the districts that determines who will control Congress next year, none of that really matters. People here are asking who has solutions to the actual problems that plague us.

“For Sale” signs hang in front of houses on most blocks. Apartment buildings fly banners advertising discounted rent and free Internet to lure tenants into vacant units. Businesses are closing, and the ones staying open are cutting employees’ hours. The district leads the nation in unemployment and the state in foreclosures.

In interviews with the Sun, the overwhelming sentiment among voters of all political persuasions is that government is not working.

How to fix it? That’s the debate that will decide this congressional race – and the races for U.S. Senate and governor.

And I know all about these real problems, as my own friends and family here have suffered in this economy. They’ve lost jobs. They’ve come dangerously close to foreclosure. And I’ve felt scared.

No, most of my fellow voters in Nevada’s 3rd Congressional District aren’t paying too much attention to the DC chatter. They just want solutions to the problems we’re facing here.

And one of the biggest problems here is home foreclosures, and Dina Titus has had to fact this head on. Dina’s district office is constantly working on helping distressed homeowners avoid foreclosure. I have spoken with people whose homes were saved thanks to the help they got from Dina and her staffers. While she’s just one representative in the US House, she just happens to represent one of the hardest hit districts in the country and her office has had to rise to this occasion.

Over the past year, her office estimates Titus has saved constituents $2.4 million, most of it by reworking mortgages. (Some of the savings is from unrelated help, including securing veterans’ or Social Security benefits.)

Five staffers in Titus’ district office in Las Vegas now handle housing problems, in addition to the jobs they were hired to do. They have no formal training in real estate or mortgage finance. Each carries about 100 cases at a time. One staffer has personally handled 300 cases.

The group started out rescuing homes from foreclosure in much the same way homeowners facing foreclosure do, dialing up the banks’ call centers and asking for help. They got put on hold, transferred, disconnected.

They learned by “trial and error.” Each time they found a bank staffer who seemed competent, they jotted down the name and number, and returned with new cases. They built relationships.

Of course, the other big concern here is jobs.

And of course, Joe Heck, the Republican running against Dina Titus, is trying to make this into an issue that hurts her. And yes, people here are very frustrated over the economy here and the need for more and better jobs. However, Heck seems to forget what he has said about jobs in contrast to what Dina Titus has done to bring jobs here. And by the way, guess who he agrees with on this?

Dr. Heck even used the same wording as Angle, “the role of Congress is not to create jobs”, and he also wants to privatize Social Security and Medicare, just as Sharron Angle wants to do. In fact,Dr. Heck took $5000.00 dollars for signing a pledge to privatize Social Security and Medicare.

For more than 200 years, voters in every State have sent their elected officials to DC to help bring money back to their States for all kinds of special projects that create jobs.

There are thousands of special projects across the country and most of them are worthy projects and deserving of our federal dollars, not all special projects are pork.

Because of Nevada’s Democratic delegation of Dina Titus, Shelly Berkley, and Harry Reid, new jobs are being created for Nevada.

Solar plants, wind turbines, and geothermal are all being expanded in our State, and with that expansion comes jobs. A new high speed train system from Southern California to Las Vegas will be built, which will bring more tourists to our State, which will create new jobs. A new VA hospital, more jobs, etc. You get the idea.

None of those special projects could have happened without the help of the federal government and the federal dollars that our elected officials help to secure for those special projects.

What, you thought we could talk about Nevada politics without bringing up Sharron Angle??!!

But seriously, compare this…

To this…

Remember, they are both Republicans running for Congress on the same platform here in Nevada… And Heck wholeheartedly endorsed Angle in July at the Nevada GOP Convention!

“The primary’s over. We now have to rally around a slate of candidates up and down the ticket — Sharron Angle all the way down the ticket.” [Emphasis mine.]

So while Joe Heck tries to “hedge his bets” these days, he can’t take back his doubling down on Sharron Angle’s extreme agenda.

But of course, there’s a flip to this. What about this guy?

Yep, Harry Reid factors very much into this as well. Not that long ago, when Reid was considered “a goner”, many pundits were also quick to write off Titus. However, I had thought otherwise for some time… And now, I’m hoping and doing whatever I can to ensure I’ll be proven right in November.

For one, it’s not like everyone here is ignorant as to who’s been working hard to deliver some much needed help.

In addition, Angle and Heck are doing themselves (and each other) no favors in refusing to offer any help and skewing so far to the right.

Phil Esser, 68, a music minister in Boulder City, said he voted for Porter two years ago because he trusted him. This year, Esser will vote for Titus.

“I think she’s doing a good job.”

For Esser, it comes down to the approach. The Tea Party, with its aggressive anti-establishment campaign, turns him off. He sees local Republicans, including Heck, as sharing the Tea Party vision.

“It’s kind of like the old Ross Perot party, but with torches,” Esser said. “Ross Perot wanted change and accountability in government. I thought that was healthy for our political system. But I don’t see that now with the Tea Party people insisting our president is a Muslim.”

In the U.S. Senate race, Esser plans to vote for Senate Majority Leader Harry Reid for the same reasons. Two years ago, Esser was unsure whether he would vote to re-elect Reid.

And here’s another thing that the pundits don’t see, but I do. I see Dina Titus out in the community all the time, whether it’s at festive events like the Boulder City Damboree Parade

Or at a BBQ by my house in Henderson with our local LGBTQ community

Or at all the “Congress on the Corner” open house days with constituents and other events throughout the community where she just takes time to listen to us and whatever concerns we have to share with her. Honestly, I really can’t think of any representative I’ve had to deal with before who was more available and more accessible than Dina is. If I had to grade Dina on constituent service, she’d easily get an A+!

(And for the record, I still haven’t seen Heck anywhere around here…)

And finally, there’s a little something I consider to be Nevada Democrats‘ “secret weapon” in winning this election. No, I’m not really about EMILY’s List or President Obama coming to town, though both will certainly be helpful in keeping NV-03 and the entire state blue. No, I’m talking about something that I saw being built up in 2008, and is now operating in full force.

The state party has been very wise in investing in a strong party structure and strong field operation designed to turn out votes for Reid, and for Titus here in NV-03. Whenever I stop by my local office in Henderson, I always see volunteers on the phones and field organizers at work planning walks and other events. Even while we may be freaking out over poll numbers and White House rumors and lobbyist chatter online, they’re laying the essential groundwork for any kind of Democratic win here in November. And most importantly, the base is busy at work here.

Now don’t get me wrong, we can’t take anything for granted here. Times are turbulent, people are restless, and there’s still so much more to do to get our state and our country back on track.

However, I feel a sense of zen calm when I think about what might happen in November. I listen to what my neighbors have to say at our “poolside chats”. (Yes, I’m fortunate enough to have two lovely pools in my suburban gated community in Henderson.) I always let them start the discussion, and they tell me about how Sharron Angle scares them or how Dina Titus had a card table outside the grocery store or how Harry Reid brought home more funds for UNLV. As long as they, and all the other sane folks here vote, we’ll win. 😉

AR, CA, IA, ME & NV Results Thread

4:00am: Props 16 and 17 look like they’ll fail tonight, 51.8% No on 16 and 50.7% No on 17. If they follow the trajectory they’ve been taking over the course of the night, expect those numbers to go up. Harmer’s still nursing his 10 point lead over Goehring in CA-11. After nine hours, SSP is signing off!

3:51am: Fortunately for Gary Miller, California’s not a runoff state! He’s now just under 50%! Both props continue to slip now at over 2/3rd reporting; our punch cards say 51.7% No on 16, 50.6% No on 17.

3:45am: Have we crossed the Rubicon? Prop 16 looking headed towards failure with 51.4% opposed. No’s running ahead of yes by 107,000 right now, which in light of what we’re estimating to be 600,000 or so votes left isn’t trivial to overcome. Prop 17 has tipped the balance and is now projected to fail by 0.2%, but No’s 25,000 lead is much more tenuous.

3:30am: No love for Prop 15 (public financing of SoS campaigns); the AP’s finally called ‘No’ with 57%.

3:25am: Looking at Props 16 and 17 now with 57% reporting, both Props’ support continue to weaken. Prop 16 is now on track for 51.2% opposed, and Prop 17 passing by 0.5%. There are a few Prop 16 strongholds left, notably, San Bernardino, San Diego, Riverside and Orange Counties, but there are plenty of smaller NorCal counties there to offset – half of Santa Clara, Yolo, and Alameda; three-fourths of Santa Cruz, and a third of Sonoma. Even Placer’s contributing to the No-on-16 effort,  where it’s failing 53-47 right now.

3:10am: It’s now past midnight Pacific Time, and the big action is left in Props 16 and 17. (Prop 15 hasn’t been called yet, but looks well on target for failure). Prop 16’s fate has changed quite a bit since an hour and a half ago, now looking on track for failure with 50.9% against. What’s changed? More anti-Prop 16 areas in Southern California are reporting: LA County, which had been supporting Prop 16 with 56%, is now down to 52% in support; Santa Barbara which was in support is now against. Prop 17 is doing better, looking on track for passage with about 50.4%.

3:00am: Is Busby the new Sodrel? Busby declared the winner in CA-50, setting up Busby v. Bilbray round 3.

2:56am: In an odd show of moderation by the California GOP, appointed incumbent Lt. Gov Abel Maldonado gets the nod for re-election over conservative challenger State Senator Sam Aanestad.

2:53am: CA-36 (D): Jane Harman has fended off Marcy Winograd for the second time with about 61% of the vote.

2:47am: Gary Miller’s 53% is good enough for the AP to declare him the winner. It’s better than Bob “28%” Inglis, but still weak.

2:45am: CA-36 (D) is looking similar to 2006 at 62-38 for Harman. Laura Richardson was also declared the winner next door in CA-37 with a surprisingly weak 65%.

2:41am: CA-19 (R) called for Denham. Marsden still trailing Goodwin 53-47 on the (D) side.

2:39am: Few more precincts rolled through in CA-42, Gary Miller is now to 53%, in one of tonight’s worst incumbent showings.

2:37am: Kamala Harris gets the Dem nod for Attorney General; matchup will be SF DA Harris vs. LA DA Cooley.

2:32am: Mary Mary quite contrary, how does your garden grow? More quickly now, it seems, enough that the AP has called the Dem Lt. Gov nod for Gavin Newsom and the GOP Att. Gen nod for Steve Cooley.

2:30am: The statewide races aren’t the only thing seemingly standing still. CA-11 is still 35-28 for Harmer, while CA-19 has moved a bit to 37-30 Denham over Patterson, with the odious Dick Pombo back at 20. Gary Miller continues to underwhelm in CA-42 at 54%. Also in a bit of a surprise, California Democratic Party-endorsed candidate Les Marsden is down 47-53 to Some Dude Loraine Goodwin. The only major movement is on the Prop 16 side, which is now slated to fail narrowly with 50.12% against.

2:10am: The sky is still blue, as well, it seems! 36% in now, same holding pattern: 57-31 Newsom for LG (D), 47-28 Maldonado for LG (R); 33-17 Harris for AG (D), and 49-32 Cooley for AG (R). Here at SSP Labs, we are now taking bets over whether Kamala Harris will clear the one-third mark. (Signs pointing to no and a finish around 32%). Prop 16 is now looking at a 50.4% passage.

1:58am: Things are looking a little comfier for David Harmer in CA-11, much to the NRCC’s pleasure, I’m sure. He’s at 36, with Brad Goehring at 27. Amador’s at 19 and Emken at 18.

1:55am: Watching California’s been like watching grass grow, but bring on the Miracle Gro! A cool 1,000 precincts just rolled in, bringing us to 29% reporting. But, alas, grass is still green, 58-30 Newsom for LG (D); 47-28 Maldonado for LG (R); 33-18 Harris for AG (D); and 50-31 Cooley for AG (R). Prop 16 still on track to pass with 51.8%.

1:47am: Prop 16’s back down narrowly in California by less than 2,000 votes. For what was assumed to be a Democrat-Republican issue, this is seriously breaking the usual patterns: the “new Orange County” of Placer County and conservative Kern County (Bakersfield) are voting this down, while normally Democratic SoCal areas like LA and Imperial County are voting yes. Some good old back-of-the-envelope math says passage is likely with 51.8%.

1:42am: Here’s an odd tidbit I missed: the SC-03 Republican runoff is going to be between state Rep. Jeff Duncan (as expected) and businessman Richard Cash (totally unexpected, with state Rep. Rex Rice finishing 3rd), but Cash actually wound up pulling ahead at the end. It was 25 Cash, 23 Duncan, 19 Rice, and 19 for John Grimaud (who’d planned to challenge Joe Wilson in the 2nd, but decided at the last minute that the 3rd would be better).

1:40am: Two special elections in CA today. One for Assembly District 43 (Glendale, Burbank) to replace now-LA City Councilman Paul Krekorian (D), where after 6 precincts, the Dem is up 54-46. AD-43 went for Obama 70-28. The other’s in Senate District 37 to replace now-Riverside Co. Supervisor John Benoit (R). Dems didn’t expect to have a shot, but the Dem nominee’s losing 57-32 in an SD that gave Obama 50.3%. The more exciting special election – to replace now Lt. Gov Abel Maldonado is in two weeks.

1:30am: Still a holding pattern in the four big CA statewide races left, though we’re at 22% reporting now. Newsom still up on Hahn 57-30 for Dem Lt. Gov; Maldonado up 47-28 though Aanestad’s doing well in Orange County. Dem AG remains 33-18-15-12, Harris-Kelly-Torrico-Lieu, and Rep AG is also still at 50-31-19 Cooley/Eastman/Harman. Prop 16 is leading narrowly now and could be extrapolated to it passing 52-48.

1:20am: Things are still a little slow in CA-42; with 6% reporting, Gary Miller’s at 55%, which I think is the 2nd most underwhelming House incumbent performance tonight (ahead of only Bob Inglis). Phil Liberatore is at 32.

1:10am: The last outstanding race in Arkansas looks like it’s been put to bed. In the R primary runoff in AR-03, the AP has called it for Steve Womack, 52-48, over Cecile Bledsoe. Another endorsement fail for Sarah Palin. At least Terry Branstad’s keeping her percentage up.

1:00am: In CA-47, it looks the Vietnamese vote splitting problem never materialized. Van Tran leads the GOP primary at 52, with Kathy Smith at 29 and Tan Nguyen at 19.

12:57am: The Cal SoS seems to be further along than the AP (up to 15% in), and they have a whole different take on CA-11. They have Harmer at 34, not that far ahead of Goehring at 30, with Amador at 18 and Emken at 17.

12:55am: Geez, add even another one to the list. In CA-41, Jerry Lewis (rounding out the trio of Inland Empire GOPers under ethical clouds for weird real estate deals) leads his opposition 66-34.

12:52am: In CA-44, Ken Calvert also looks poised to join the very large club of incumbents not breaking 70% in their primaries. He leads his opposition 69-31. Up in CA-11, establishment pick David Harmer has gained more ground; he’s at 48, with 21 for Emken, 20 for Amador, and 10 for Goehring. And in CA-19, establishment guy Jeff Denham also leads 41, with Patterson at 25 and Pombo at 20, with about 40% reporting.

12:46am: The four Lt. Gov and Attorney General races are still uncalled. For LG (D), Newsom’s up 57-31 on Hahn winning plenty of SoCal locales like San Diego. In the Republican primary, Maldonado’s keeping his edge over Sam Aanestad, who’s even losing stalwart conservative areas like Placer County. For Atty Gen (D), Kamala Harris is keeping a narrow 32-18 lead over Chris Kelly; Torrico in 3rd at 15 and Lieu in 4th at 12. Not enough cat fud in GOP primary; moderate Steve Cooley still up 50-31 on Eastman with Tom Harman back at 19.

12:44am: Former Assembly Speaker Karen Bass wins her primary in CA-33 with 85%, will likely be the next congresswoman from this D+35 district.

12:36am: Sue Lowden can now set up that bartering post she’s always wanted; NV-Sen called for Angle by the AP.

12:33am: No, rly. AP calls the Republican SoS primary for Damon Dunn. Orly Taitz can go back to filing groundless lawsuits as a private citizen. In between pulling teeth.

12:32am: AP has called Proposition 14 (top two primary system) as a ‘yes.’ Take that, third parties!

12:29am: Here’s one GOP moderate who survived a teabagger challenge with little trouble. Mary Bono Mack leads Clayton Thibodeau 74-26 with more than half in, in CA-45. In CA-42, only about 1% is in, but it points to Gary Miller — who we’d thought was most vulnerable to his teabagging opponent, seeing as how he (Liberatore) actually had some money — surviving, albeit unimpressively. Miller leads 58-28.

12:28am: In CA-50, it looks like it’ll be Francine Busby 3.0. With more than 10% in, she’s leading Tracy Emblem 64-36.

12:25am: Switching back to the East coast, there’s one New Jersey race still uncalled. In the GOP primary in NJ-06, 99.6% are in, and Little leads Gooch (the moneybags lady who was On the Radar) by about 100 votes.

12:22am: Joe Heck easily dispensed with the teabag remnants he faced in the GOP primary in NV-03, winning with 70%. There is, however, a barnburner between two guys I don’t know in the Dem primary in NV-02, for the booby prize of going up against Dean Heller: K. McKenna and N. Price are both at 45.

12:19am: Since we last looked, Sharron Angle really turned on the afterburners. Now she’s at 38, with Sue Lowden at 29 and Tark at 22 (oh, and carpetbagging investment banker John Chachas at 4). We’re closing on on half reporting. Angle has pulled into the lead (36-33) in Clark County, where over half the votes are.

12:16am: Bass masters her opposition. Karen Bass, former state Speaker, is at a whopping 85% against minor opposition to succeed Diane Watson in CA-33.

12:14am: In CA-26, David Dreier’s at 78% against minor opposition, much better than a lot of other insider Reps tonight. If anyone knows how to survive a teabagging, it’s him.

12:10am: AP calls CA-Sen for Carly Fiorina. 54 for her, to 26 for Campbell for 17 for DeVore. Campbell heads back to the pasture to resume frightening sheep.

12:09am: Only 2% in in CA-11, but David Harmer is breaking away. He’s at 39, with Tony Amador and Elizabeth Emken both at 24, and liberal huntin’ vintner Brad Goehring at 12.

12:07am: Here’s one more totally unexpected teabagging underway in dark red CA-02. With 10% in, Wally Herger (R) is at only 62% against Some Dude.

12:05am: Holy crap! CA-Sen (D) has been called for Barbara Boxer. The ghost of Paul Wellstone has struck down Mickey Kaus.

12:02am: Here’s a race that was on nobody’s radar screen: Laura Richardson (D in a safe blue district, but associated with foreclosures and a general sense of being out-to-lunch), is at only 65%, although against scattered opposition.

12:01am: Less than 5% reporting, but CA-36 (D) may turn out to be something of a non-event; Jane Harman leads Marcy Winograd 65-35.

12:00am: Onto the Cali House races. In CA-19 (R), with about 23% reporting, Jeff Denham leads Jim Patterson and Richard Pombo 44-23-20. Looks like that poll surge for Patterson didn’t pan out.

11:58pm: Back to South Carolina for a minute, where it’s been confirmed that in SC-01, we’re headed to a GOP runoff between CfG protege Tim Scott and legacy candidate Paul Thurmond. Sorry, “Tumpy.”

11:55pm: Initiatives! Prop 14 (top two primary) passing, 60-40. Peace & Freedom Party heads for dustbin of history. Prop 15 (public financing of elections) failing, 43-57. Prop 16 (electric company tyranny) passing, 53-47. And Prop 17 (auto insurance) also passing 55-45.

11:53pm: AP calls CA-Gov (R) for Meg Whitman. $80-odd million and counting; how much will she spend by November?

11:50pm: For LG, it’s Newsom 52, Hahn 35, and for the GOP, it’s Maldonado 48, Aanestad 28. For AG, Harris leads at 28, with Kelly at 19, Torrico at 15, Lieu at 14, Delgadillo way back at 8. And among GOPer AGers, Cooley 52, Eastman 30.

11:48pm: And in the Senate, Carly Fiorina is leading Tom Campbell and Chuck DeVore 58-23-17. Barbara Boxer leading Mickey Kaus (does that rhyme with Mickey Mouse? never noticed that till now) 78-5.

11:46pm: Quick non-California update: AR-01 called for Chad Causey. Not much love for public hanging, even in West Memphis (home of the West Memphis 3!).

11:45pm: We’re getting close to 5% reporting in California statewide, so let’s turn our attention to the Golden State. Meg Whitman is beating Steve Poizner 64-26, outpacing the polls a bit. Y’know, Jerry Brown is too, actually; he leads Richard Aguirre 83-4.

11:40pm: This may turn out to be the weirdest story of the night, about Alvin Greene, the 32-year-old unemployed ex-military guy who lives with his dad and who now happens to be the Dem nominee for Senate in South Carolina (instead of expected candidate Vic Rawl, a Charleston Co. Commissioner). Somehow he came across $10K to file, and has seemed to have run a phantom campaign ever since then. How did he get here? We’ll no doubt hear more in coming days.

11:35pm: And now the news that’ll have everyone saying “Who?” AP calls ME-Gov (D) for Libby Mitchell. She’ll face Paul LePage in the duel of the unknowns.

11:34pm: We’ll start with the bad news; AP calls IA-Gov (R) for Terry Branstad. But only 50-40 over Vander Plaats.

11:24pm: The night is winding down, but CA and NV are just getting cranked up.


AR, CA, IA, ME, NJ, NV, SC & SD Results Thread

11:33pm: Party’s moved next door.

11:31pm: AR-02 has been called by AP for Elliott, now 54-46. She’ll face Tim Griffin… probably not as good a matchup for Dems as Wills.

11:29pm: Angle’s back in the lead in NV-Sen! 35, to Lowden’s 33, with 21 for Tarkanian. 14% in. I’m sure we’ll see lots of back and forth gyrations in this one as different counties report. Lowden has small lead in Clark, while Angle has a much bigger lead in Washoe.

11:27pm: AP has called GOP primary in NJ-12 for Scott Sipprelle, rich guy, over teabagger opposition, but only 54-46. Rush Holt probably not very scared. GOP primary in NJ-06 is still 50-50, with Diane Gooch trailing by 100.

11:25pm: Add a couple more New Jersey races to the list of races where no-name teabaggers held moderates down to so-so numbers. Leonard Lance only racked up 56% in NJ-07, and Chris Smith in NJ-04 held to 69%. Both were ‘yes’ votes on cap & trade.

11:21pm: All the Arkansas House races are super close. In AR-01, it’s Causey 51, Wooldridge 49, with 94% in. In AR-02, it’s Elliot 52, Wills 48, with 91% in. And in AR-03, it’s Womack 50, Bledsoe 50, with Womack up by about 200, although that’s only with 75% in.

11:15pm: ME-Gov (R) called for Paul LePage. Looking like he’ll take on Libby Mitchell in the fall.

11:12pm: Only 1% reporting, but the AP has already called NV-Gov (R) for ex-judge Brian Sandoval. Even the RGA supported him over Jim Gibbons.

11:10pm: Oh yeah, poll closed in California ten minutes ago.

11:01pm: In Iowa, the AP calls IA-03 (R) for Brad Zaun, who will take on Leonard Boswell. In IA-02, Mariannette Miller-Meeks of the dreaded ophthalmologists will rematch against Dave Loebsack.

11:00pm: The AP calls AR-Sen for Blanche Lincoln.

10:51pm: A smattering of precincts and early votes coming in from Nevada, including Clark County (Las Vegas). Gibbons is losing big time to Sandoval in NV-Gov, 57-23. Chicken Lady ahead of Angle 36-33 with Tarkanian at 20.

10:48pm: Ganja break OVER! Maine is now up to 38% in. Libby Mitchell has extended her lead to 34-26 over Rowe, and Paul LePage is cruising.

10:43pm: How baked must they be in Maine right about now? Been at 12% since… whoa… are those Cool Ranch Doritos?

10:40pm: Chad Causey looks like he might hold out over Tim “The Hangman” Wooldridge in AR-01. Meanwhile, Joyce Elliott now has a lead over Robbie Wills in AR-02. And in AR-03, teabagger fave Cecile Bledsoe is beating Steve Womack 54-46. Bledsoe is both a teabagger queen and sort of the establishment choice – I dunno, though, it was a weird race.

10:37pm: We’re pretty confident in calling ND-AL for state Rep. Kristi Noem, who beat the more-or-less establishment choice, SoS Chris Nelson. You only need 35% to avoid a runoff in SD, and Noem has a 41-36 lead with most of the votes in.

10:32pm: Halter took a brief lead for a moment there, but it’s back to where it was.

10:27pm: AR-Sen is 51-49 Blanche, but Halter is still behind where he needs to be, according to our model. If you want a fuller explanation of how our model works, click here.

10:23pm: With 12% reporting, Terry Branstad is up just 51-40 over Bob Vander Plaats in IA-Gov (R).

10:13pm: Can’t wait to see those NV-Sen results start to roll in (soon, I hope). Meanwhile, our friends up in Maine seem to be on the first ganja break of the evening.


RESULTS:

Nevada County Baselines: Reid vs. “the Chicken Lady”

This diary has the baselines for the Nevada Senate race this time. Reid is currently unpopular because the Senate is unpopular and Reid is the Senate Majority Leader. Also, the economy in Nevada is bad after the foreclosure crisis and the decrease in tourists so Nevadans will be blaming the incumbent. About 20 candidates are running against Reid in the Republican primary. Since the primary does not occur until June 8th, I do not know who the Republican nominee will be. Most polls suggest Sue Lowden (R), a former State Senator from  Clark County will be the nominee. Recently, she damaged her chances by talking about bartering healthcare for chickens. Still, a recent poll showed her with a lead of 17 points in the primary. Another recent poll showed her lead by 10 points drop to 4. She has not even faced Reid’s 25 million dollars in a state where 1 million is enough to run a credible campaign. This race should turn around faster as soon as every voter knows about Lowden’s chicken comment and anything else Reid can find. Lowden benefits however from the fact that Clark County will not see a high African American turnout or Hispanic turnout (which definitely will change if the immigration bill gets the Hispanic community active.)

A bit about Reid’s past elections: in 2004, he won 61%-35% against Richard Ziser, a real estate investor from Las Vegas. Reid even won the majority of voters outside of Clark County (Las Vegas.) Being a Mormon may have helped in rural areas but now that the rural areas are prime teabagger territory, Reid may face very large Republicans margins there. In 1998, it was not as easy. John Ensign (R), the now disgraced Republican Junior Senator of Nevada ran against Harry Reid. Ensign lost by only 100 votes while losing Clark County by nine but barely winning Washoe County (Reno).

About the baselines: the baselines show the candidates’ percentages for each county if the race were a tie. I found them by adding percentages from Reid’s 2004 Senatorial election and the 2008 presidential election by county. Then I divided the result by two, giving me the baselines. I am sorry that the baselines are not in a straight line. After some links, you will see them.

Link for 2004 Senatorial election: http://www.uselectionatlas.org…

Link for 2008 Presidential election: http://www.uselectionatlas.org…

County Name Reid Republican Other

Carson City  45% 54% 1%

Churchill   29% 70% 1%

Clark   54% 45% 1%

Douglas  35% 64% 1%

Elko   27% 72% 1%

Esmerelda 23% 76% 1%

Eureka 21% 78% 1%

Humboldt 34% 65% 1%

Lander 29% 70% 1%

Lincoln 24% 75% 1%

Lyon 35% 64% 1%

Mineral 52% 47% 1%

Nye 41% 58% 1%

Pershing 37% 62% 1%

Storey 42% 57% 1%

Washoe 49% 50% 1%

White Pine 38% 61% 1%

For those of us who like visual aides like myself, here is a map:

Nevada Baseline Map

Dark Red: Republican 70%+

Red: Republican 60%-69%

Light Red: Republican 50%-59%

Light Blue: Reid 50%-54%

The baselines do not show too many surprises for me. It shows Reid winning Clark County in the high single digits which he needs to do to win. Also, the only other county he wins is Mineral County which McCain won by six points in 2008. Reid also loses Washoe County by one point which makes sense because Washoe County recently votes in line with the candidates’ statewide percentages. A difference with the baselines is that I expect Reid to win Washoe County by a few hundred votes if the race ties because Washoe County is trending Democratic quickly.

Just in case you were wondering, I will do Florida’s Gubernatorial race next. Do you have any suggestions for statewide races after that?

By what margin will Bob Shamansky win?

View Results

Loading ... Loading ...

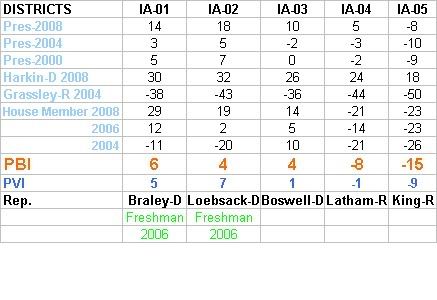
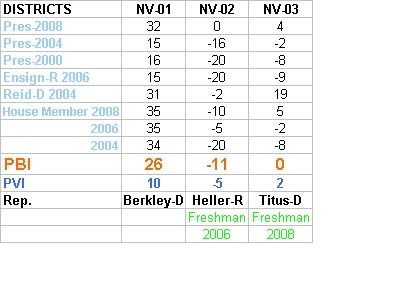
PBI (Party Brand Index) Part 5: Nevada & Iowa

PBI or Party Brand Index is a concept I developed (with some much appreciated help from pl515) as a replacement for PVI.  PVI (Partisan Voting Index), which is measured by averaging the percentage of the vote from the last two presidential elections in each house district, and comparing it to the nation as a whole, is a useful shorthand for understanding the liberal v. conservative dynamics of a district. But PVI in my opinion it falls short in a number of areas. First it doesn’t explain states like Arkansas or West Virginia. These states have districts who’s PVIs indicates a Democrat shouldn’t win, yet Democrats (outside of the presidency) win quite handily. Secondly why is this the case in Arkansas but not Oklahoma with similar PVI rated districts?

Lastly PVI can miss trends as it takes 4 years to readjust. The purpose of Party Brand Index is to give a better idea of how a candidate does not relative to how the presidential candidate did, but compared to how their generic PARTY should be expected to perform. I’ve tackled IN, NC, CO, VA, MO, OK, AR, now I will look at the swing states of Nevada and Iowa.

First I would like to post the data, then I will offer some analysis. My basic pattern is to work my way “out” from the “Purple States” to the more Blue and Red ones. Two weeks ago (I took one week off for Netroots Nation) I skipped my normal pattern of working out from purple states.  I became curious on how my model would work in states like Arkansas that are deeply blue at the local level, but deeply red at the presidential level. I will offer a refresher on them later. But first let’s examine the swings states of Iowa and Nevada.

IOWA


NEVADA

Both of these states have fairly “straightforward” Democratic or Republican leaning districts, only Iowa Rep. Boswell is a Blue Dog. Rep. Titus in Nevada’s 3rd district was designed as a swing district where there would be a equal number of Democrats and Republicans. PBI maintains this is still the case, while PVI suggest a slight Democratic lean. Also Republican Rep. Lantham of Iowa who is frequently mention as a target of Democrats because of his district’s PVI of only +1 Republican, is actually much safer based on PBI -8 (the equivalent of a PVI of 8), which is much closer to his winning margins.

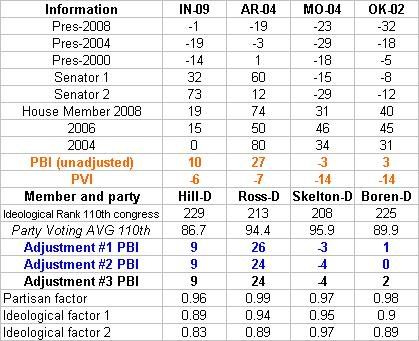
Just a quick note as a reminder on Blue Dogs like Boswell, I developed a “correction factor” that allows for a better “explanation” for congresspersons who win districts that are a “mismatch” for their party’s majority ideology.  I would prefer to run a “batch” of these at a time. So I will simply republish the results for the four Blue Dogs I have encountered since I started this research.

FOUR BLUE DOGS

I developed a formula based on standard deviations. Basically I can figure out how much the average rep deviates from their district.  If I then compare where a reps voting pattern falls (in what percentile) and compare it to their district’s PVI, I can develop a “standard deviation factor”. Inside the standard deviation will get a bonus, outside a negative. The idea is that if a Blue Dog has a very conservative record, they may be surviving not because of a districts Democratic leanings but because they deviate from Democratic policies.  I showed all three variation of my formula but for future examples I will stick to ADJUSTMENT FACTOR #2.

For example, if Rep X is the 42 most conservative rep, that would place her in the 90th percentile. But if her district’s PVI was “only” the in the 60th, their is a good chance her margins would be effected. Using a few random samples I found most reps lie within 12% of their district’s PVI.

Using these dummy numbers I then came up with this.  


   SQRT[(30-12)^2 /2] = about 13%

    Her factor would then be 100 – 13 = 0.87.

So her victory margin would be weighted by 0.87 because she is more than 12% beyond her acceptable percentile range it making the victories in her district approximate 13% less “representative”.

    My theory yields the following formula:

        If rep’s voting record is > PVI then

            100 – SQRT[({Record percentile – PVI} – Standard PVI Sigma)^2 /2] = factor

        else if rep’s voting record < PVI

             100 + SQRT[({Record percentile – PVI} – Standard PVI Sigma)^2 /2] = factor

I then repeated this formula to calculate a partisanship correction factor. Ranking a members ideology is a subjective decision. Potentially what’s one person “liberal” position, is another person “conservative” ones, remember the wingers developed a model that ranked the Sen. Obama as more liberal than Bernie Sanders or Russ Feingold. But partisanship, how often a member votes with their party is an absolute number. A Democrat who represents a “republican district” would be expected to “break with their party” on votes that don’t reflect their districts values.

I couldn’t find a website that ranks all the districts based on their PVI (I only could find list of them by state not rank, help please anyone), therefor I substituted a PVI ranking with where each member ranked in the Democratic caucus. In the 110th Congress the average Democrat had an ideological ranking of 170 (by the way this is a result of several members being tied, this is the medium not the midpoint). The average of members towards the center was 191, former Daily Kos celeb Ciro Rodriguez fell at exactly 191. The average of members towards the liberal side was 121, which falls between Rep. Larson of Conn. and Rep. Eshoo of CA. As or partisanship in the 110th Congress the average Democrat voted with their party 92.3% of the time.

As a clarification in Adjustment #1, I used a deviation factor based on how far each member was from the center of the Democratic caucus. Adjustment #2 was based on how far each member was from outside the standard deviation of the caucus. In Adjustment #3 I removed the partisanship factor to see what effect it would have.

Because there are “only” 50 states (as opposed to evaluating 435 house members), I will at a later date have all the states ranked by PVI so I can adjust the Senator’s rankings. I developed Senate factors for the four states the four blue dogs came from. In the interest of full disclosure, my source for ideological rankings is Voteview, and for partisanship it was the Washington Post. This is still a work in progress, I’m making adjustments, and continuing to crunch numbers for more states. I also will use the adjustment factor on a liberal member of congress to see what effect that will have.

Wakin’ Up in Vegas: Redistricting Nevada

(From the diaries – promoted by DavidNYC)

Redistricting is popular around here, so I really don’t need to explain this any more. Here’s a plan for Nevada that’s 3-1. I wanted to protect Berkley and Titus, and create a 3rd Democratic district.

I crunched population data by census block for Clark County into precincts, and by census VTDs for Douglas, Lyon, and Nye Counties.

So here’s the map:

Data (both political and population) after the flip.

Here’s are closeups of Douglas and Clark/Southern Nye Counties:


And closeups of the Las Vegas area, the first with precincts and the second with incorporated cities and CDPs labelled.


County 2010 Pop Obama McCain Total Obama% McCain%
1st 670,860 129,024 73,473 206,859 62.40% 35.53%
Clark 670,860 129,024 73,473 206,859 62.40% 35.53%

The 1st (in red), this was designed to be Shelley Berkley’s. It captures a big chunk of Las Vegas, with parts of North Las Vegas, Paradise, Enterprise, and the majority of Spring Valley. At 62.4% Obama, not much has changed, about, only down a point or two. McCarran Airport and the Strip are in this district.


County 2010 Pop Obama McCain Total Obama% McCain%
2nd 670,894 148,278 105,987 259,926 57.06% 40.78%
Carson City 54,952 11,623 11,419 23,680 49.08% 48.22%
Clark 161,041 31,008 9,668 41,413 74.98% 23.38%
Douglas 18,566 4,031 4,894 9,127 44.17% 53.62%
Esmeralda 631 104 303 439 23.69% 69.02%
Lyon 4,809 463 1,223 1,732 26.73% 70.61%
Mineral 4,575 1,082 1,131 2,307 46.90% 49.02%
Nye 3,452 296 469 814 36.36% 57.62%
Washoe 422,868 99,671 76,880 180,414 55.25% 42.61%

This is the new Washoe-Clark district, in green. Starting in Washoe, it goes south, taking in as Lyon and Nye Counties as possible. It also takes in the better part of Douglas County and what it needs to connect to the south (44% Obama compared to 40% in the remainder). This district then goes into Clark County, taking the most Democratic precincts possible (74% Obama), including the majority-African-American parts of North Las Vegas (24% of the Clark part is Black). This district is 63% Washoe and another 24% more Clark, making for a 57% Obama district. This should be winnable for a Democrat, especially one from Washoe/Douglas like Jill Derby (who likely lives in this district, or just a bit outside it).


County 2010 Pop Obama McCain Total Obama% McCain%
3rd 670,842 120,321 67,581 192,355 62.56% 35.14%
Clark 670,842 120,321 67,581 192,355 62.56% 35.14%

This is Dina Titus’ district, in blue. It retains most of the population of Henderson and other suburbs of Las Vegas, like the vast majority of Sunrise Manor, and Paradise (not including the part with the Strip though). At 62.56% Obama, this is up 7%. This should set this district firmly out of reach for any comeback attempt by Jon Porter (or for any Republican, really).


County 2010 Pop Obama McCain Total Obama% McCain%
4th 670,832 133,939 164,642 305,560 43.84% 53.89%
Churchill 25,147 3,494 6,832 10,605 32.95% 64.42%
Clark 425,579 98,318 105,326 207,592 47.38% 50.75%
Douglas 26,336 6,641 9,754 16,777 39.58% 58.14%
Elko 48,011 4,541 10,969 16,019 28.35% 68.47%
Eureka 1,775 144 564 745 19.33% 75.70%
Humboldt 18,306 1,909 3,586 5,664 33.70% 63.31%
Lander 5,140 577 1,466 2,102 27.45% 69.74%
Lincoln 5,260 518 1,498 2,107 24.58% 71.10%
Lyon 50,239 7,934 10,927 19,359 40.98% 56.44%
Nye 44,835 6,858 8,958 16,494 41.58% 54.31%
Pershing 6,212 673 1,075 1,836 36.66% 58.55%
Storey 4,638 1,102 1,247 2,418 45.57% 51.57%
White Pine 9,354 1,230 2,440 3,842 32.01% 63.51%

All the Republicans have to go somewhere, and this is where they go. Taking in the remaining parts of Clark County (mostly empty desert except for the western parts of Las Vegas proper), this district grabs most of Nye, Eastern Douglas, and Northern Lyon counties and the remaining counties. Clark does still make up 63% of the district though. Perhaps in a testament to how much Clark County has changed, the Clark part is still 47% Obama. Overall, it’s 43.84% Obama. 4-0 would have been doable, but pushing it, in my mind.

Redistricting Maps for Nevada

Nevada Redistricting

According to the population estimates, I decided that Nevada would get a new congressional district even though it was hard hit by the foreclosure crisis. My goal was to create a new Democratic district while protecting newly elected Democrat Dina Titus in the 3rd Congressional district. I believe I succeeded  in packing most of the Republican areas into one district. I made the map with Dave’s Redistricting App which is really fantastic. My next map should be either Louisiana or New Jersey. Enough talk, here is the link to my maps: http://frogandturtle.blogspot….

District 1 Shelly Barkely (D) (Blue)

I gave Barkley a strong Democratic district containing much of Las Vegas and neighborhoods in North Las Vegas with high minority populations. Still, I believe I kept enough heavily Democratic areas out of the 1st to protect Titus and strengthen the 2nd. The district is still minority majority and I believe Barkley or any Democrat will have no trouble winning this district. It probably voted about 66% for Obama. The racial stats are 12% Black, 31% Hispanic, 8% Asian and 46% White. Status is Safe Democrat.

District 2 No Incumbent (Green)

This was the new district I created that I hope will vote Democratic. The current representative is Dean Heller and I put his home in Carson City outside of the district. I hope that will deter him from running here. Even though most of his district is here, it is the more Democratic parts. The district stretches from the northern border, through Reno, along the western border and finally goes to take in some Democratic neighborhoods in Clark County (Las Vegas.) I think 20% of the district is in Clark County and 60% is in Reno. This would almost ensure that if a Democrat is elected, he or she will be from Reno. Looking at the numbers, Obama won the northern part of the district by about 13,000 votes but I am not sure of his margin in the Clark County portion. I estimate that he still won about 53%-55% of the vote in this district. That percentage should be enough to elect a Democrat. The racial stats for this district are 3% Black, 24% Hispanic, 6% Asian and 64% White. Status is Lean Democrat.

District 3 Dina Titus (D) (Purple)

I definitely strengthened Dina Titus enough by giving her some precincts that were formerly in the 1st district and by taking out Republican parts of Henderson and the outer Las Vegas suburbs. I believe the district is too Democratic for Jon Porter. He will probably run for the Republican 4th district. Dina Titus should worry about nothing except that she might face a minority candidate in the primary. Whatever way it goes, this district is in Democratic hands for the foreseeable future. It probably voted around 61% for Obama. The racial stats are 10% Black, 31% Hispanic, 8% Asian and 49% White. Status is Safe Democrat.

District 4 Dean Heller (R) (Red)

This district is where I put most of the Republicans. It looks like it is centered in the “Cow Counties” or the counties outside of Clark and Reno Counties. Actually, it is based in Clark County and takes in Republican parts of Henderson. Even though I put Dean Heller’s home in the 4th district, I believe that Jon Porter or another Clark County Republican would run for this district. Dean Heller is a relatively new representative and he would definitely face trouble. Since most of the constituents live in Clark County, Heller will have to struggle to introduce himself to the people there. Still, I think it would be easy for a Clark County Republican to brand Heller as a Republican from the far corner of the state. Heller will probably lose but the district will most likely remain Republican. It probably voted about 56% to 59% for McCain. Racial stats are 4% Black, 18% Hispanic, 5% Asian and 70% White. Status is Safe Republican

By what margin will Bob Shamansky win?

View Results

Loading ... Loading ...

GE 2008, the Democratic pick up states: an exhaustive summary analysis

Now that all 9 Democratic pick-up states plus NE-02 have been analysed, I have also provided an exhaustive and most unique non-partisan summary of the pick-up states. I can guarantee you that there is information in this summary that you will not find anywhere else in this quality, clarity or combination.

There are a number of side-documents that go with the summary, plus links to all of the nine analyses and the GE 2008 final analysis for the entire Union.

I want to explain again that I have farmed this kind of thing out to Google Docs as it makes it easier for me to publish charts, tables and graphics. It is my hope that you will read the summary in it’s entirety. There are surprises all over the place that only become apparent when one scratches under the surface and researches the GE 2008 at the county level, county for county. In the case of the 9.25 pick-ups, we are talking about 696 counties.

The summary is divided into 2 parts and all of this information is after the jump.

Part I of the summary contains:

– links for the individual analyses for all the pick-up states plus the links for the GE 2008 analysis for the entire Union are given again. They will be reproduced at the bottom of this diary entry.

– an overview of the raw vote and percentage totals for the pick-ups states, first for 2008 only and then a comparison to 2004.

– three maps. One shows the geographic position of the pick-ups within the USA. The second shows the geographical relationship between the pick-ups and the Democratic retentions from 2004. The third shows the Democratic states from 2008 plus the 5 leanest GOP wins from 2008.

– a question: “How does this compare on a historical level?”

The question is referring to the number of electoral votes that changed parties in 2008, namely, 113 EV. I then provide a table showing each general election back to 1948 and how many electors changed parties, and in which direction. The answer to the question is that Obama’s EC shift is on par with the last election cycle, but less than in the 1980s.

Afterward, there is an introduction to the county-level analysis, including an exact numeric count of counties per state: Democratic retentions, Democratic pick-ups, Republican retentions and Republican pick-ups.

Quote:

“In the pick-up states, the Democratic party retained 146 of 148 Democratic counties from 2004 and then picked-up an additional 89 counties, for a total of 235 counties (33.76%). The Republican party lost 89 counties from 2004, retaining 459 counties and then picked-up 2 counties, for a total of 461 (66.24%). 235 + 461 = 696 counties.”

“Nationally, all 9 states trended Democratic as Obama won them and their electors according to the WTA (winner-takes-all) system, but when we look at the inner details, the picture is much clearer: 642 of 696 counties in the pick-up states (92.24%) swung Democratic. The remaining 54 counties (7.76%) swing Republican. This indicates a statistical grand sweep for the Democratic party in the pick-up states.

In 4 states, the ENTIRE state trended Democratic: Colorado, New Mexico, Nevada (all three western pick-ups) and Indiana.The pick-up in Indiana is historic not only because this is the first time since 1964 that a Democrat has won the state, but it also had the largest partisan shift of all 50 states in the GE 2008: +21.71%

The state with the largest contra-trend (Republican) against the national trend: Florida.”

Part I ends with maps of Ohio, Virginia and North Carolina, showing the geographic position of the 28 counties that swung Republican, showing their proximity to Appalachia.

You can link to Part I via Google Docs.

Part II starts with an extensive study of the 39 largest counties out of the 9.25 pick-ups states, plus Durham County (NC) as honorable mention.

Quote:

“I have done a statistical analysis of the 39 largest counties of the 9.25 pick-ups. These are all counties that had a total vote of more than 170,000 and at least one candidate should have also gotten at least 100,000 of those votes or very,very close to it. All of those counties meet both criteria. Two counties (Stark County / OH, Washoe County / NV) had no candidate with 100,000 votes or more, but in both cases one candidate was very close to 100,000 and the countwide total vote was well over 170,000.  Those 39 counties accounted for 44.49% of the total popular vote of the pick-up states, which is actually slightly LESS than it was in 2004 for the same states: 44.91%. Nonetheless, when only 39 of 696 analysed counties (5.60%, numerically) have almost half the electoral firepower of the region, then it is statistically very clear that the large urban areas have the real electoral firepower in presidential elections. The candidate who sweeps the urban areas has a far better chance of winning the presidency.

Of these 39 counties, there were 21 Democratic retentions, 8 Democratic pick-ups and 10 Republican retentions. This means that of the same 39 counties in 2004, the picture was much more even: in 2004, there were 21 Democratic counties of these 39 and 18 Republican counties.

The Democratic party picked up Hillsborough (Tampa) and Pinellas (Clearwater) counties in Florida, Wake (Raleigh) county in North Carolina, Washoe (Reno) County in Nevada, Hamilton (Cincinnati) County in Ohio, Jefferson (Golden) and Arahapoe (Littleton) counties in Colorado and Douglas (Omaha) County in Nebraska.”

The important thing about this study is it’s depth and breadth: each of the 39 (40) counties are analysed comparing 2008 to 2004, measuring raw vote and margin differences, also the counties’ percentual take of their respective states’ popular vote and also their take of the pick-up states combined. But the counties are also each given a spreadsheet to trace their voting history back to 1960 and the results are nothing less than amazing!

Next, from the analysis in Part II:

Superlatives:

– the largest raw vote total of all 39 counties: Miami-Dade County, FL: 864,636 votes

– the largest Democratic winning raw vote total: Miami-Dade County, FL: 499,831 votes

– the largest Democratic raw-vote margin of the pick-ups: Cuyahoga County, OH (Cleveland): +258,542 vote margin

– the three highest Democratic winning percentages: Denver- CO,  Boulder, CO and Cuyahoga- OH: 75.45%, 72.29% and 68.70%, respectively.

– the three largest Democratic winning margins (by percent): Denver- CO,  Boulder- CO and Cuyahoga- OH: +52.41%, +46.14% and +38.74%, respectively

– the highest democratic margin-shift (swing): Marion County, IN: +26.40% margin shift. This is especially impressive, as this shift was not from a pick-up, but rather, a Democratic retention county.

– the largest Republican winning raw vote total: Duval County, FL: 210,537 votes

– the largest Republican raw-vote margin of the pick-ups: El Paso County, CO: +51,419 vote margin

– the three highest Republican winning percentages: Butler – OH, El Paso- Co and Lee- FL:  60.52%, 58.69% and 54.67%, respectively

– the three largest Republican winning margins (by percent): Butler – OH, El Paso- CO and Brevard- FL: +22.58%, +18.82% and +10.37%, respectively

– the lowest negative Republican margin-shift (swing): Brevard County, FL: -5.73% margin shift

All of the Democratic retentions and pick-ups showed raw vote, percentual and margin GAINS.

All of the Republican retentions showed percentual and margin LOSSES.

4 of the Republican retentions showed raw-vote gains: Brevard, Lee, Polk and Pasco counties, all in Florida. The other 6 Republican retentions showed raw-vote losses.

9 Republican or Democratic tipping-point (margin = less than 4%) counties from 2004 became solid Democratic wins in 2008: Pinellas, Volusia and Orange Counties-FL, Wake, Guilford and Mecklenburg Counties- NC, Montgomery and Stark Counties – OH, Arapahoe County- CO

5 Republican retentions have become tipping point counties for 2012: Sarasota (+0.10%), Virginia Beach (+0.71%), Duval (+1.90), Seminole (+2.70%) and Pasco (+3.75%) . Statistically this means that 1/2 of the Republican retentions studied here are endangered territory for 2012 and (this has been proven historically many times over) in the case of a sucessful re-election campaign for the Democratic party in 2012, these five counties are the most likely candidates to become Democratic pick-ups in 2012.

O Democratic retentions or pick-ups are tipping-point counties for 2012.

Here is the EXCEL SPREADSHEET that has all of the raw calculations for the 39 (40) largest counties.

In order to simplify the look of the table and make the information easier to see, I created a table to show the chronological progression of each county from 1960 to 2008. For each county and year, I have assigned either a D, R or an I, depending on which party won the county in that year. And then I have shaded each cell according to winning party. I then organized the table in order from CORE GOP counties to CORE DEM counties. Take a good, hard look at the table when you read Part II, it is most enlightening.

You can link to Part II via Google Docs.

Quotes:

“In the case of some counties that visually look as if they should be core GOP counties there is instead the marking steady; these are GOP counties that should be core counties, but which almost flipped in 2008, so their status is now uncertain. And some Democratic counties are marked as steady as the margins are very lean.

But the table makes it very easy to see which years are landslide years: 1972 and 1984, to a smaller extent 1992 and 2008. In 1972, we see a sea of red go through all counties except Lucas County, OH. In 1984, we see a sea of red go through all counties except the bottom 5. At the top we see 3 core GOP counties that also resisted the Johnson landslide of 1964. Notice that all three counties are in Florida.

Starting in 1988, the Democratic party started re-building in the urban areas:

3 counties were added to the Democratic column in 1988, resisting the GOP pull in that year: Boulder, Summit and Lucas counties. And those counties have become core DEM counties since then.

8 counties joined the Democratic column in 1992 and have stayed there since then: Palm Beach, Broward, Volusia, Bernalillo, Franklin, Montgomery, Clark, Miami-Dade. They are mostly strong DEM counties, save for Montgomery and Volusia, which tend to go with leans margins. There are 4 more counties that joined the Democratic column in 1992, but were reclaimed by the GOP in either 1996 or 2000: Pasco, Wake, Stark, Guilford. Pasco returned to the GOP in 2004 and has stayed there. It is therefore the only county to complete buck the blue trend, in spite of reduced margins in 2008.

Mecklenburg and Pinellas counties joined the Democratic column in 1996, were reclaimed by the GOP in 2000 or 2004 and were reclaimed by the Democratic party in 2004 or 2008.

Fairfax joined the Democratic column in 2000 and has stayed there since, with ever increasing margins.

Orange and Marion counties joined in 2004 and were retained in 2008. Both of these retentions had massive margin shifts toward the Democratic party in 2008: +18.41 and +26.40%, respectively.

The 8 counties that Obama picked-up are clear to see in the middle of the table. Six of those counties have one thing in common: this is the first time they have gone Democratic since 1964, statistical evidence of a sweep similar to but not as extreme as Johnson in 1964: Hamilton, Douglas, Jefferson, Wake, Hillsborough and Pinellas counties were slightly smaller wins for the Democratic party than in 1964. However, Washoe and Arapahoe counties were larger wins for the Democratic party than in 1964, thus breaking a 44 year record. Notice that both of those counties are in the west.

We can see clearly from the table that the last time a party had flipped 8 counties or more was in 1992, when Bill Clinton picked-up 12 counties. George W. Bush, Jr. picked up 3 counties in 2000 and 1 more in 2004. Those counties returned to the Democratic party in 2000 or 2004.

In 1988- just analyzing these 40 counties- there were 8 Democratic counties and 32 Republican counties. In 1992, out of the same mix of 40 counties, there were 20 Republican counties and 20 Democratic counties, an even split. In 2000, there were 21 Republican counties and 19 Democratic counties. But in 2004, in spite of a republican re-election, the Democrats had 22 counties, the Republicans 18. And now in 2008, it’s 30 Democratic, 10 Republican. There can be no doubt about it: statistically, the urban areas in the Union have moved decisively to the Democratic party in 47 of 50 states (the evidence for which I will present before the end of 2009). This example from the 9.25 Democratic pick-ups is mild in comparison to the statistical data that came out of cities in core Democratic territory: Philadelphia (83% for Obama), Detroit (74% for Obama), New York (86% for Obama), Los Angeles (69% for Obama), Seattle (70% for Obama), Portland (77% for Obama) Chicago (76% for Obama), Boston (64% for Obama), Honolulu (70% for Obama), Milwaukee (67% for Obama), Madison (73% for Obama), New Orleans (79%), Baton Rouge, Dallas (deep in GOP territory: 57% for Obama), St. Louis (60% for Obama) etc, etc, etc.”

Conclusion:

“The Democratic wins in the pick-up states, as in the retentions, was not the example of the Democratic party barely holding on the to so-called “blue” states plus one “red” state or getting to one vote over 50%. The sweep through the pick-ups is statistically clear. The last time a sweep like this happened in the Republican party, it held the white house for 12 years. On the other hand, Johnson and Nixon had massive sweeps in 1964 and 1972 and in spite of this,the White House switched hands in the following cycles. So, though such a sweep is no forecast for the future, the data tells us quite clearly where the new battle lines will form in these nine states for the 2012 General Election. And both parties will be targeting key counties in key districts in 2010 in order to sway the affected area to their side before 2012 even gets off the ground.”

————————————————————–

Here the links to the individual analyses, with a detailed description afterwards:

Mid-west:

OHIO – Part I, Part II, Part III , raw data / INDIANA – Part I, Part II and Part III, raw data

IOWA – Part I, Part II, Part III, raw data / NEBRASKA CD-02 – raw data

South:

VIRGINIA – Part I, Part II, Part III, raw data / NORTH CAROLINA – Part I, Part II, Part III, raw data  

FLORIDA – Part I, Part II, Part III, raw data

West:  

COLORADO – Part I , Part II , Part III , raw data, special 9-county 48-year voting history study

Supplemental to Colorado: DEMOGRAPHIC and ECONOMIC profile of Colorado (p.4, hispanic population)

NEW MEXICO – Part I, Part II, Part III, raw data, special 12 county 48-year voting history study   Supplemental to Nevada: DEMOGRAPHIC and ECONOMIC profile of New Mexico (p.4, hispanic population)  

NEVADA – Part I, Part II , Part III, raw data, special 6 county 48-year voting history study  

Supplemental to Nevada: DEMOGRAPHIC and ECONOMIC profile of Nevada (p.4, hispanic population)   Quick Census facts on Nevada  

An analysis for NE-02 (which is the „.25″ part of „9.25″) will be published when I have received the complete precinct data for Douglas and (part of) Sarpy counties from election officials who are willing to dig up the data over 48 years for me. But a comparison 2008 to 2004 is already possible and here is the raw-data.

Links to the large analysis for the entire Union

Full analysis Part I

Full analysis Part II  

Full analysis Part III

Full analysis Part IV  

Full analysis Part V

raw-vote total data  

Obama’s standing in the national rankings since 1824  

Obama’s standing in the rankings, per state