Analyzing Swing States: Colorado, Part 1

This is the first part of a series of posts analyzing the swing state Colorado. The second part can be found here.

Analyzing Swing States: Colorado,Part 1

Starting six years ago, a massive Democratic wave swept through the state of Colorado. Starting with the election of former Senator Ken Salazar, the Democratic Party took control of almost every state office there was to take. The results of this transformation are pictured in the table above.

More below.

At the time, Democrats crowed that Colorado was undergoing a fundamental political transformation. A flood of liberal migrants from California, along with steady growth in Colorado’s Latino population, was supposedly moving the state left from its decades-old conservative roots.

These conservative roots can be seen by taking a look at Colorado’s electoral history:

Analyzing Swing States: Colorado,Part 1

Six years later, however, Democrats are not so confident. Polls show that Colorado has swung as quickly Republican as it went Democratic after 2004. Democrats are facing tough elections in Colorado’s senatorial and house races; until the Republican candidate became engulfed in scandal, they were also polling weakly in the gubernatorial race.

Whatever the future of Colorado, for the past decade the state has done a perfect job of reflecting the national mood. This is perhaps the ultimate attribute of a swing state.

–Inoljt, http://mypolitikal.com/

The White Vote in Washington D.C.

By: Inoljt, http://mypolitikal.com/

When Republicans attack American liberalism, they prefer to use San Francisco as a punch bag. Indeed, San Francisco does constitute quite a liberal city; in the 2008 presidential election, 84.0% of the good folk of San Francisco preferred Democratic candidate Barack Obama over Senator John McCain.

San Francisco was far from the most Democratic-voting city in 2008, however. Mr. Obama’s percentage total was greater in several places; Washington D.C., for instance, pummeled San Francisco in the contest of who votes more loyally Democratic. In the capital of America, an astonishing 92.5% of voters supported the Illinois senator.

Most people who will hear this will probably start thinking something quite politically incorrect. The line of thought goes that “Washington is full of black people, all the blacks voted for Obama, so of course it voted that way.”

This is half true and half false.

More below.

It is true that the capital’s black population voted uniformly for the president – something that occurs with almost all Democratic candidates. The census, however, estimates that blacks compose only 54.4% of Washington’s overall population. This may surprise a lot of Americans who think the city is all-black. Even if every single black person in Washington voted Democratic, Mr. Obama still is quite a ways off from 92.5%.

Let’s look at another place with similar demographics to Washington D.C. – Montgomery County, Alabama where the Civil Rights movement started. Like Washington, Montgomery’s population is 52.9% black. Unlike Washington (where Mr. Obama won 92.5% of the vote), however, Montgomery only gave Mr. Obama 59.3% of the vote. Blacks are not responsible for this 33% difference; there is not much variation in how African-Americans voted in both cities.

The trick is with the white population. According to exit polls, Mr. Obama won 10% of whites in the state of Alabama. The results from Montgomery County reflect this low level of support.

In Washington, however, Mr. Obama won an astounding 86% of the white vote, according to exit polls. This is how the Illinois senator was able to get up to 92.5% of the vote in Washington, which is about one-third white. If white people alone had voted in Washington, Mr. Obama would still have done better than he did in San Francisco.

It would be quite interesting to explore why whites in the capital vote so loyally Democratic. Washington, of course, constitutes the center of the federal government; it would not be unusual for much of the white population to work for the government and thus vote more Democratic. But what type of work do they do – do they deliver the mail for the Post Office, or do they run the Post Office? Is Washington’s white population composed of  mostly working-class, union-type Democrats? Or is it composed mostly of  “wine-track” liberals, the type that populate cities like San  Francisco and Seattle?

Whatever the answer, this statistic remains one of the most curious and interesting ones to come out of the 2008 presidential election. Indeed, until now this blogger  was unaware that such one-sided Democratic voting patterns existed among  whites anywhere in the nation. To get 86% of the vote anywhere is a burdensome feat. For a Democrat to get that support from whites is something that one does not see often in the United States.

(NV-Sen) Sharron Angle’s Downfall: REPUBLICANS

(Originally from Nevada Progressive)

Not that long ago, the Nevada Republican Party truly was a “big tent”, one that could fit the more traditional “libertarian conservatives” that once dominated, pragmatic conservatives, moderates, and others. But these days, it seems to be dominated by “Tea Party, Inc.” and the radical religious right. And no one better demonstrates this better than Sharron Angle and her ascendancy in the Nevada GOP.

Perhaps this is why we’re seeing more and more “Republicans for Reid” speaking out?

Former Clark County (Las Vegas Metro) Sheriff Bill Young spoke about how Harry Reid has delivered in keeping Nevada safe.

And Former Nevada First Lady Dawn Gibbons spoke about Reid’s commitment to education, reminded us of all her work on education reform, and made sure we didn’t forget about Sharrontology’s desire to starve it to death.

Republican former First Lady Dawn Gibbons said today that she supports Democratic Senate Majority Leader Harry Reid because of his diligence and hard work, not because she wants to spite her Republican ex-husband, Gov. Jim Gibbons, who she said cheated on her and who has been a frequent Reid critic.

“I’ve known Harry Reid for a long time,” Dawn Gibbons said today during an endorsement event at UNLV. “He’s a strong advocate and a strong voice — someone we need in these trying times.”

Gibbons also noted that Reid is a good husband to his wife Landra and calls his kids daily. […]

Taking a page right out of Reid’s playbook, Gibbons criticized Reid’s Republican opponent Sharron Angle, accusing her of having an “extreme and dangerous” policy on education.

During the 15-minute event, Gibbons said the words “extreme and dangerous” four times. Students who have benefited from government grants and scholarships and spoke with Gibbons to lend their support to Reid repeated the phrase another four times.

Interesting enough, John L. Smith wrote in his column this morning about what may be a larger trend of prominent Republicans coming out to endorse Reid. Why? Well, they’ve been here in Nevada for quite some time, they understand the strong relationship Harry Reid has with our state. Plus, they’ve also seen with their own eyes Sharron Angle, her dangerous extremism, and how detrimental a “Senator Angle” would really be to our state.

No wonder why more and more Republicans, whether they be traditional “paleo-conservatives”, pragmatic business folks, or middle-of-the-road moderates, are speaking out and speaking up for Reid.

Remember that this used to be the party of Abraham Lincoln, the party of Teddy Roosevelt, the party of Dwight Eisenhower, the party of Barry Goldwater, and the party of Former Nevada Governor Kenny Guinn. This used to be a big tent for civil rights advocates, environmentalists, libertarians, old-school conservatives, rural interests, urban interests, and more. But now? Now it’s this?

Perhaps it’s the reverse of what Ronald Reagan used to say. These people haven’t left the Republican Party. The Republican Party has left them by veering so extremely to the right and nominating people like Sharron Angle who care more about getting praise from outside interests than doing what’s right for Nevada.

Sure, there have been many times when progressive Democrats were irritated by Reid. He’s certainly no progressive icon, and there have been many times I’ve taken Reid to the woodshed for not being more progressive.

But you know what? At the end of the day, Reid is not in the Senate to be some progressive icon. He’s there to serve ALL OF US in Nevada. Perhaps that’s why all of these Republicans can join Democrats, even “dirty fucking hippie” progressives like moi, in supporting Harry Reid. That’s something Sharrontology doesn’t get, and I guess that’s why she can’t win here.

Comparing the White Vote and the General Vote

By: Inoljt, http://mypolitikal.com/

On November 4, 2008 Senator Barack Obama was elected president, winning a substantial margin over Republican candidate John McCain. In the popular vote, Mr. Obama won 52.9% of the electorate to Mr. McCain’s 45.7%; he thus took a 7.2% margin.

Mr. Obama, however, did not do so well with white, non-Hispanic voters. According to exit polls, the newly elected president lost whites by double-digits; taking 43% of the white vote to Mr. McCain’s 55% support.

This is not anything new; for decades now, the Democratic Party has been losing the white vote. Indeed, the last time a Democratic presidential candidate actually won whites was in 1964, when Texan Lyndon Johnson delivered a landslide pummeling to Senator Barry Goldwater.

Ever since then Democrats have been in a bad way with whites:

Comparing the White Vote and the General Vote

More below.

This graph compares the Democratic share of the white vote (as found by exit polls) to their share of the total vote. The top line indicates the former; the bottom indicates the latter. The three Democrats who did relatively well with whites were Democratic  candidates Hubert Humphrey, Jimmy Carter, and Bill Clinton.

As the graph shows, the white vote generally follows the popular vote (not a surprise, given that it composes the majority of the popular vote). Nevertheless the gap between the two has been steadily widening; in the past three elections, Democrats lost whites by double-digits yet still remained competitive in the general election.

This trend can be more accurately pictured by graphing the relative “swing” of the white vote compared to the overall election:

Comparing the White Vote and the General Vote

This measurement indicates how the white electorate would have voted if an election had been tied; it is more useful than looking at the absolute vote. A candidate who lost the white vote by 40%, for instance, would generally be said to have done poorly with whites. If, however, we found out that the candidate had done even worse with the general electorate – say, losing by 45% – one could very well say that he or she did relatively well with whites.

In the last presidential election, for instance, Mr. Obama lost whites by twelve points, according to exit polls. However, Mr. Obama also won the overall electorate by seven points. Whites were therefore nineteen points more Republican than the average voter – as the graph indicates. In a hypothetically tied election, they would have voted Republican by nineteen percentage points (or a Democratic margin of negative nineteen points, according to the graph.)

This graph paints a slightly different picture of Democratic performances amongst whites. The adjustment makes Mr. Clinton and Mr. Obama look less impressive (Mr. Obama, especially), while making Mr. Humphrey look really good. To be fair, the 2008 election probably constitutes more of an outlier than the start of a trend for Democrats, given Mr. Obama’s unique strength amongst minorities. Expect the white “swing” to return to a more Kerryesque point in 2016.

Finally, one must note the degree to which the white vote is influenced by patterns in the South. Mr. Obama took less than 30% of the white vote in seven states: Alabama, Georgia, Louisiana, Mississippi, Oklahoma, South Carolina, and Texas. This low degree of white support is not unusual for Democrats. One-sided, racialized voting patterns in this region undoubtedly skew the overall white vote to be more Republican than would otherwise be the case.

P.S. For those interested, here is a table of the white vote over time, according to exit polls.

Previewing Senate Elections: California, Section 2

This is the last part of a series of posts analyzing competitive Senate  elections in blue states. It is the second section of two posts focusing on the greatest state in the union (otherwise known as California). The first part of the series can be found here.

Previewing Senate Elections: California,Section 1

Suburban SoCal

Southern California (SoCal, in short) is where the battle for California will be won or lost. Ms. Fiorina must accomplish two tasks in the region.

First, she must clean the clock in the suburban counties outside Los Angeles.

More below.

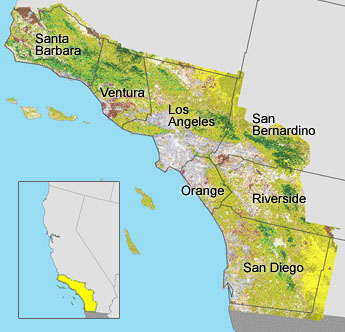
It is in places like Orange County, San Diego, and the Inland Empire that the votes to counter the Democratic bases in the Bay Area can be found. In the 2008 presidential election, there were one million more votes cast in the six SoCal counties above (excluding Los Angeles) than in the entire Bay Area.

This task is not too difficult. Unlike liberal NorCal, the suburbs in this region are more like the rest of the United States in their political leanings; in fact, they are probably more conservative than the median. Orange County and San Diego County are nationally known as conservative bastions (although they are not as red as in the past). Ms. Fioina probably needs to win above 60% of the vote in both counties. Historically, Republicans have often done this. The trouble is with Los Angeles.

Los Angeles

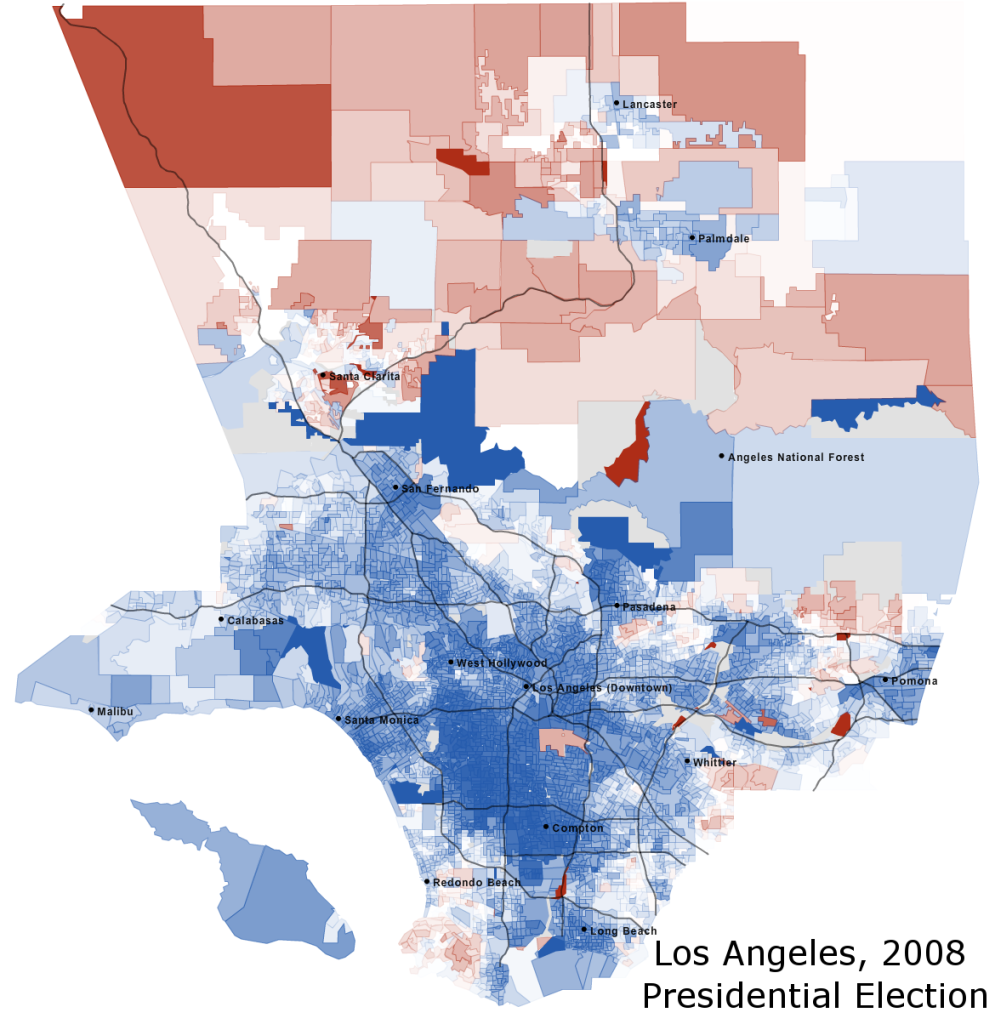
Ms. Fiorina’s second task is to run closely in Los Angeles. It is here that Republicans face their greatest challenge. Los Angeles – sprawled, extremely populous, and arguably more diverse than even the Bay Area – constitutes a Democratic stronghold. President Barack Obama ran off with 69.2% of the vote here; Senator John Kerry took 63.1%. Ms. Fiorina must reduce this Democratic margin to within the single-digits.

Previewing Senate Elections: California,Section 2

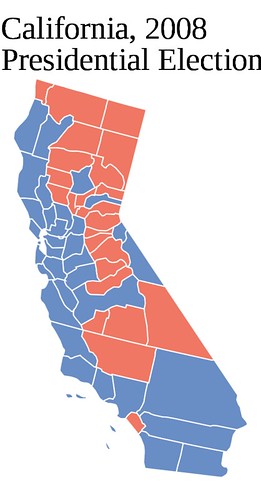
The math here is simple.  There are just not enough Republican votes in Central Valley, the Orange County-San Diego metropolis, and the Inland Empire to offset the Democratic bastions of the Bay Area and Los Angeles. Republicans must therefore break one of the two strongholds. It is impossible to do this in the Bay. So the choice must be Los Angeles.

The key are the outer, wealthier suburbs within Los Angeles county. Some are liberal Hollywood areas, typified by Congressman Henry Waxman’s 30th congressional district. Republicans probably cannot win these. Others are more conservative and even voted for Senator John McCain (see, for instance, the patches of red north of Pomona and south of Redondo Beach). Ms. Fiorina will have to expand upon this core and win places like the San Fernando Valley and Pasadena – suburbs which rarely vote Republican.

Conclusion

When the voting booths close and the precinct results start pouring in, look at Los Angeles County. Ms. Fiorina’s performance there will be most indicative of her overall strength. If Democrats are winning the county by double-digits, then she is in trouble. Conversely, if their margin is less than five percent – or if Republicans are winning the county – then Republicans are in good shape. A Democratic margin between five and ten percent signifies that a long night is ahead.

On a state-level basis, modeling a close Republican victory is somewhat difficult; Republican candidates haven’t won a close race for a long time in California. There is, however, a substitute that fits well:

Previewing Senate Elections: California,Section 2

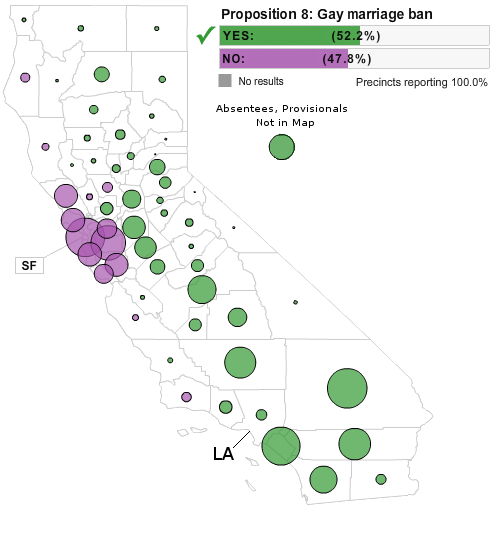
These are the results of the famous Proposition 8, which passed by a 4.5% margin. On a county-by-county basis, a Fiorina victory will probably look quite similar to this. There are minor differences; the margins in Orange and San Diego Counties would probably be greater; Republicans probably wouldn’t win Los Angeles County.

Overall, however, the picture would not be too different. Heavy margins from the SoCal suburbs and Central Valley counter Democratic strength in NorCal, while a strong Republican performance in Los Angeles dilutes Democratic margins there.

There is one final complication for Republicans. California constitutes the most diverse state in the country; winning minorities is a must. The Republican Party is not very good at this, which why California is a blue state today. It must change this, if candidates like Ms. Fiorina are to win the state.

Some minorities are easier to win than others. Blacks are most loyal to the Democratic Party, but they number only 6.2% of the state’s population. While more numerous Asians and Latinos do not vote their numbers (their share in the voting electorate is slightly more than half their share of the overall population), their votes are easier to get.

Here Proposition 8 is less useful as a guide. In Los Angeles County, for instance, all of South Central voted for the proposition. Unless Republicans start winning Compton and Watts, they will have to find support from a different section of California’s majority-minorities.

Winning minorities constitutes a novel challenge to the Republican Party; until now it has drawn an ever-increasing percentage of the white vote to offset increasing numbers of minorities. This is no longer possible in places like California. If Republican candidates like Carly Fiorina and Meg Whitman are to win the state, they will need to envision a new strategy.

(Note: Credit for several edited images goes to the LA Times).

–Inoljt, http://mypolitikal.com/

Previewing Senate Elections: California, Section 1

This is the third part of a series of posts analyzing competitive Senate elections in blue states. It will focus on California. Because California is such a big and complicated state, it will have two sections – of which this is the first. The second part can be found here.

California, Section 1

In the greatest state of the union, a fierce senatorial battle is brewing. Former HP executive Carly Fiorina is mounting a tough challenge to incumbent Democrat Barbara Boxer. In an anti-Democratic national environment, polls show the race close and competitive. This post will examine the obstacles Ms. Fiorina will face as she seeks to overcome California’s formidable Democratic geography.

CA 2008

As America’s most populous state, California contains a number of distinct regions. This post, and the one following, will examine each.

More below.

Upper California and the Sierra Nevada

When people think of California, the northern forests and year-round snow of the Sierra Nevada generally do not come into mind. These regions, geographically expansive yet thinly populated, tend to vote loyally Republican (although until the 1970s Democrats had a base of support in several northeastern counties).

Not all of this region is Republican-voting, unpopulated wilderness. Exurban Placer County, for instance, contained 173,812 voters in 2008. Other parts – especially the liberal coast – tend to vote Democratic, eating in to Republican strength.

Ms. Fiorina will probably need something like 70% of the vote in places like Placer County to win. Strong margins from this Republican stronghold constitute the first, easiest step to a Republican victory.

The Bay Area

In many ways, the Bay Area is what makes California a blue state. Without the Bay Area, for instance, President George W. Bush would – almost – have won California in 2004, losing by a mere 0.7%.

Previewing Senate Elections: California,Section 1

Unfortunately for Republicans, the Bay Area – one of the richest, most diverse, and most liberal places in the country – does indeed exist, and it votes strongly Democratic. A popular attack against Senator Boxer is to call her a San Francisco liberal; this generally works less well in San Francisco.

In addition, voting habits in the Bay Area tend to be “sticky.” If the rest of California moves ten points more Republican, the Bay Area will tend to move only five points right. San Francisco and Alameda counties are sometimes the last two counties standing during Republican landslides.

There is a glimmer of hope for Republicans, however. The counties surrounding San Francisco and Berkeley tend to be one degree less intense in their liberalism. Ms. Fiorina will not win them, but a well-run campaign can reduce Democratic margins somewhat.

Central Valley

Home to some of the richest farmland in America, the counties composing Central Valley once leaned Democratic but now vote Republican in all but Democratic landslides. Conservative and heavily populated – although not by California standards – Central Valley provides somewhat of a reservoir to offset the enormous Democratic margins radiating from the Bay Area.

There is, however, one important exception: Sacramento, a populous county whose Democratic leanings deny Republicans a vast store of potential votes.

In the long run, Central Valley is a ticking time bomb. Democratic-voting Latinos compose 30-50% of the population in many of these counties, and their numbers will only increase. For now Ms. Fiorina is safe – Latinos do not vote their numbers, especially in mid-terms – but future Republicans cannot take Central Valley for granted.

The Challenge of Southern California

Previewing Senate Elections: California,Section 1

It is in the urban sprawl of SoCal, however, where Republicans face their greatest challenge. Ms. Fiorina has two tasks here. The first is to win the counties outside Los Angeles, and win them big. The second is to keep Los Angeles itself within single digits.

The next post will expand upon SoCal and offer a conclusion on Republican prospects of winning California.

–Inoljt, http://mypolitikal.com/

Bobby Jindal’s Strange 2003 Coalition, Part 2

This is the second part of two posts analyzing Louisiana’s 2003  gubernatorial election, in which Republican candidate Bobby Jindal  narrowly lost to lieutenant governor Kathleen Blanco. It will focus on racial dynamics in the 2003 election. The previous part can be found here.

Race and Bobby Jindal’s 2003 Run

In my previous post, I began analyzing the electoral coalition that voted for Mr. Jindal. As a map of the election below indicates, he drew support heavily from the New Orleans suburbs, while doing extremely poorly in the rural north:

Bobby Jindal's Strange 2003 Coalition,Part 2

More below.

Discomfort with Mr. Jindal’s race probably accounted for most his underperformance in the rural north. Take La Salle Parish, for instance. Located in the northern stretches of Louisiana, the parish constitutes a typical example of the rural conservatism that backs much of the Republican Party. The district is very thinly populated; in 2003 less than 5,000 people voted in total. It is also quite poor; 2000 census figures indicate that per capita income was only two-thirds of the American average. And it is 86% white.

Like many of its rural peers, La Salle Parish usually votes Republican. It gave Senator John McCain 85.5% of the vote – which probably means that every single white person voted for Mr. McCain, and that every single black person voted for Mr. Obama. Mr. Jindal, however, received less than 40% of the vote in this staunch Republican district.

Interestingly enough, Mr. Jindal also did unremarkably with black voters. Exit polls indicated that he drew about 9% of the black vote in 2003. This was better than most Louisiana Republicans, but not exactly an impressive performance (reaching more than 20%, or even 15%, of black support is considered an extremely strong performance for a Republican politician – especially in the Deep South). African-Americans, it appeared, did not seem to view Mr. Jindal much differently from a typical white Republican in Louisiana.

White voters in rural Louisiana apparently did. A look at white supremacist David Duke’s 1991 run for governor provides a revealing context:

Bobby Jindal's Strange 2003 Coalition,Part 2

Of the 19 deeply conservative, mostly rural parishes that voted for Mr. Duke, only four could bring themselves to vote for a deeply conservative but non-white Republican. Mr. Duke won two-thirds of the vote in La Salle Parish.

On the other hand, Mr. Duke lost almost all of Louisiana’s conservative southeast; he only managed to win one of the suburban New Orleans parishes Mr. Jindal dominated. These parishes vote equally Republican, if not more so, as places like La Salle Parish.

The disparate supporters of Mr. Jindal and Mr. Duke point to an interesting division in the Republican coalition of Louisiana. Usually this division is not noticed, since Republicans generally hold it together well; only rarely does one leg of the coalition bolt altogether, as in the gubernatorial elections of 1991 and 2003.

Nevertheless, there are indeed two parts of Louisiana’s Republican base. One part, represented by northern Louisiana, is largely rural and poor; in bygone days it formed the core of both Huey Long’s support and the Solid South. The other, located largely in the suburbs surrounding New Orleans, is mostly suburban and relatively wealthy; it will vote for a Bobby Jindal but not a David Duke.

Indeed, these two strands of Republicanism are present not just in Louisiana but throughout the nation. Which strand the Republican Party decides to model itself after in the future will play a great deal in shaping the future of the party, as well as that of the nation.

Post-mortem: Following his 2003 defeat, Mr. Jindal campaigned heavily in the rural regions that had voted against him. In 2007, the Republican was elected governor with 54.3% of the vote; his next closest opponent won 17.6%. Mr. Jindal won almost every parish in the state, including many of the rural, conservative parishes that had voted against him in 2003 – proving that racism is not an impossible obstacle to surmount.

–Inoljt, http://mypolitikal.com/

Analyzing Swing States: Virginia, Conclusions

This is the last part of a series of posts analyzing the swing state Virginia, which aims to offer some concluding thoughts. The previous parts can be found starting here.

Conclusions

As a state, Virginia’s population has always been located in three metropolitan areas: the Northern Virginia suburbs south of Washington D.C., Richmond and its suburbs, and the communities surrounding Hampton Roads. Together these three places compose more than half of Virginia’s electorate:

Analyzing Swing States: Virginia,Conclusions

In all three metropolitan areas, Democrats have been improving their margins.

More below.

Virginia’s suburbs, expansive and traditionally Republican, have shifted leftwards with startling quickness. This movement has been most apparent in the largest of its suburbs, rich and diverse Northern Virginia. The addition of NoVa to Virginia’s heavily Democratic, heavily black cities has given the Democratic Party a coalition that has won a number of recent elections.

Not everything has gone badly for the Republican Party. They have captured a formerly loyal Democratic constituency – the Appalachian west, which voted Democratic based on economic appeals. Moreover, they still dominate the rural whites who in bygone days voted Democratic:

Analyzing Swing States: Virginia,Conclusions

Thus, Virginia today is a state in change, like most states. Parts of it are shifting left and parts of it are shifting right; in aggregate, the effect has been to change it from a solidly Republican to swing state. Undoubtedly, other states will and are moving in the opposite direction.

Colorado, the next state in this series, is probably not one of those Republican-shifting states.

–Inoljt, http://mypolitikal.com/

Bobby Jindal’s Strange 2003 Coalition, Part 1

By: Inoljt, http://mypolitikal.com/

This is the first part of two posts analyzing Louisiana’s 2003 gubernatorial election, in which Republican candidate Bobby Jindal narrowly lost to lieutenant governor Kathleen Blanco. The second part can be found here.

Bobby Jindal’s Strange Coalition

In 2003, an ambitious Bobby Jindal ran for Louisiana governor against Democratic candidate Kathleen Blanco. Despite holding a narrow polling lead throughout most of the campaign, Mr. Jindal ended up losing by a three-point margin.

The story of the coalition that voted for Mr. Jindal constitutes quite the interesting tale. It is much different from the Republican base as commonly envisioned in the Deep South.

To begin, let’s take a look at a map of the election – which is substantially different from most modern electoral maps. Here it is:

Bobby Jindal's Strange 2003 Coalition,Part 1

More below.

The first thing that strikes the eye is the sheer number of parishes Mr. Jindal lost. He was absolutely crushed in rural Louisiana.

This is a remarkable thing. In the United States of today, it is usually an accomplishment for a Democrat to win a state’s rural counties, even in a landslide. Democrats almost never win the rural vote when the election is close.

Mr. Jindal, of course, got 48% of the vote somewhere. As it turns out, these votes came mainly from the state’s most populous parishes. The state’s most populous parish – Jefferson Parish – voted for Mr. Jindal by more than a 3-to-2 margin. In New Orleans, with the endorsement of Mayor Ray Nagin, Mr. Jindal did as well as possible for a Republican, winning almost one-third of the vote.

In other words, Mr. Jindal used strong margins from metropolitan, suburban Louisiana to counter Ms. Blanco’s rural strength and New Orleans – a strategy more familiar to Democrats than Republicans.

Here is a more “normal” election in Louisiana:

Bobby Jindal's Strange 2003 Coalition,Part 1

Although it does not look like it, Republican candidate Suzanne Terrell did only one point better than Mr. Jindal.

There are substantial differences in their coalitions, however. Ms. Terrell did worse in the populous southeast, although the map does not show it well. She lost Baton Rouge (which Mr. Jindal won) and took only one-fifth of the vote in New Orleans, compared to the one-third Mr. Jindall racked up.

On the other hand, Ms. Terrell performed far better in rural, northern Louisiana – winning a number of thinly populated, poor parishes that Mr. Jindal lost. It was Mr. Jindal’s performance that constituted the aberration; deeply conservative, these parishes are a core part of the Republican base.

The next section will focus on the racial dynamics that caused this effect.

Why Wisconsin Votes As It Does

By: Inoljt, http://mypolitikal.com/

Wisconsin, the badger state, constitutes a perennial battleground state. Like many of its Midwestern neighbors, the state leans Democratic but remains readily willing to vote Republican. While voting for Presidents Bill Clinton and Barack Obama by double-digit margins, the state also came within one percent – twice – of voting for Republican candidate George W. Bush.

These voting patterns have quite interesting historical roots. Indeed, they stretch back for more than a century.

To examine these roots, let’s first take a look at a map of German immigration patterns in 1890:

Wisconsin German Immigrants Flickr

More below.

This map, derived from the New York Times, graphs the percentage of German-born immigrants in each Wisconsin county from the 1890 census. There is a striking correlation between this map and Wisconsin in the 2004 presidential election:

Wisconsin 2004 Flickr

In that election, Senator John Kerry clung to Wisconsin by a razor-thin 0.4% margin, winning 49.7% of the vote to Mr. Bush’s 49.3%. As this map indicates, counties heavily settled by Germans form the Republican voting base which Mr. Bush relied upon. This pattern persists even more than a century after the height of German immigration.

It is also still quite powerful. Out of the twelve counties with greater than 20% German-born immigrants in 1890, only one (Milwaukee) voted for Mr. Kerry.

There are exceptions, of course – and German settlement patterns do not form the entire picture of Wisconsin’s electoral demography. Milwaukee, for instance, gave 61.7% of its vote to the Massachusetts senator, despite being composed of 38.9% German immigrants in 1890. This is due to its relatively high black population today and corresponding white flight, which depleted the city of its German-American population. Scandinavian settlement patterns in non-German rural Wisconsin, to use another example, account for their Democratic vote today (interestingly, rural Wisconsin constitutes one of the last Democratic bastions in rural America).

Nevertheless, the overall pattern is still quite striking. A more detailed look at Wisconsin in 2004 only strengthens the link:

Why Wisconsin Votes As It Does

As is evident, the correlation between German immigration and Wisconsin’s electoral geography finds a resemblance in both degree and strength. The most Republican-voting regions, located along the southeastern portion of the state, also counted themselves highest in German immigrants in 1890.

Finally, this type of demographic analysis can be used to explain why states vote as they do in far more than just Wisconsin. From Democratic strongholds in former cotton-growing areas of the Deep South to South Dakota’s Native-American and Democratic-voting reservations, history offers a fascinating insight into contemporary politics.