PA-Sen: Casey Continues to Lead All Comers

Public Policy Polling (PDF) (4/7-10, Pennsylvania voters, 1/3-5 in parens):

Bob Casey, Jr. (D-inc): 51 (51)

Charlie Dent (R): 31 (31)

Undecided: 18 (18)

Bob Casey, Jr. (D-inc): 50 (49)

Jim Gerlach (R): 32 (33)

Undecided: 19 (18)

Bob Casey, Jr. (D-inc): 49 (48)

Rick Santorum (R): 37 (41)

Undecided: 13 (10)

Bob Casey, Jr. (D-inc): 51 (50)

Marc Scaringi (R): 28 (27)

Undecided: 21 (22)

Bob Casey, Jr. (D-inc): 51

Jake Corman (R): 35

Undecided: 14

Bob Casey, Jr. (D-inc): 51

Laureen Cummings (R): 32

Undecided: 17

Bob Casey, Jr. (D-inc): 50

Kim Ward (R): 29

Undecided: 21

(MoE: ±4.0%)

What to say here? As you can see, Casey’s numbers are little changed from January, when PPP first tested the race. He’s at almost exactly 50% against everyone he faces, and no one does better than 37%. But that figure is misleadingly high: If the universally-known Rick Santorum is only at 37 right now, how can he expect to go much higher? His favorable rating (you’ll need to check PPP’s presidential poll, since they tested him there) is just 37-47, which is pretty ugly. In any event, Santorum seems pretty committed to a pointless presidential run; I’d be surprised to see him go for a rematch.

Every other potential candidate is entirely unknown, with anywhere from 75 to 84% of respondents expressing no opinion on this batch of Republicans (and among those who do know this crowd, all have negative ratings). Of course, that means someone like state Sen. Jake Corman has proverbial “room to grow,” but with Casey already at 50, he’d need to pull away people who are already willing to support the incumbent.

So my money is on Casey, despite his relatively soft job approval numbers. I think Tom Jensen has it right:

On one hand, he has weak approval numbers-only 39% of voters approve of the job he’s doing to 35% who disapprove-you can certainly get defeated with those kinds of numbers. On the other hand he leads seven potential opponents for next year that we tested against him by anywhere from 12 to 23 points-you’ll pretty much never get defeated with those kinds of numbers.

My sense is that Casey is not terribly vulnerable. Here’s the thing about his low approval numbers-Democrats aren’t in love with him. Just 55% approve of him and 22% disapprove. Generally you’ll see a Senator closer to the 70% or 80% mark within his own party so his lack of approval from the party base is what’s keeping Casey’s approval number under 40%. But even though they don’t necessarily like Casey, Democrats are still perfectly willing to vote for him-he gets 78-80% of the Democratic vote in head to head match ups against the seven Republicans we tested. And his 19% approval number with Republicans, although it may not sound like much, is actually a pretty decent amount of crossover support in this highly polarized political climate.

The GOP has had a hard time recruiting any big names, and these numbers help explain why. The biggest note of caution, I think, is the very Dem lean of this sample: 51 D, 38 R, 11 I. It was 44-37-18 in 2008. It’s hard to imagine Democrats having such a big advantage on election day next year. Nonetheless, even if you reallocated those “extra” Ds to the independent column, Casey would still out ahead, since he holds sizeable leads with indies against every candidate (except, oddly, Santorum). This is a race where you’d simply rather be Team Blue than Team Red.

The 38 states of America – Part 1

A few weeks ago on Swing State Project, somebody posted a map of the United States if the states were based on communities of interest and like-minded metropolitan areas.  The result was what is referred as the “38 states of America.”  Not surprisingly, the discussion turned to what each party’s electoral chances would be like in each of the new states.  So in this series of diaries, I will be looking into how each party did during the 2008 presidential election, and what the recent changes in population, demographics, and partisanship mean for 2012.  

The Map:

url=”Link to the Map[/url]

In this first installment I will look at the Northeast Region.  The Midwest, Southeast, and West Regions will come later, as well as the final electoral vote roundup at the end.  I’m counting Alaska as one state, so there’s only going to be 37 states in this countdown, somehow I don’t think the northern Alaska state would have enough population for inclusion on it’s own.

Northeast Region:

Kennebec – (Northern New England) – Total vote 1,578,414

Obama – 943,160 (59.8%)

McCain – 635,254 (40.2%)

PVI – D+7

2012 Rating – Solid Democratic

Kennebec is the furthest northeastern state, consisting of Maine, Vermont, and most of New Hampshire.  This area used to be very republican but ever since the 90s has been a democratic stronghold.  It’s hard to imagine the Republicans ever being competitive here without a major blowout win nationally.  

Plymouth – (Southeast New England) – Total vote 2,889,035

Obama – 1,805,754 (62.5%)

McCain – 1,083,281 (37.5%)

PVI – D+10

2012 Rating – Solid Democratic

Plymouth state consists of the greater Boston area, and stretches from Manchester to Providence to Worcester, essentially.  It’s the smallest state in the union area wise, and it’s also one of the most democratic states in the nation.  Safe D.

Mohawk – (Upstate NY) – Total vote 2,403,469

Obama – 1,295,120 (53.9%)

McCain – 1,108,349 (46.1%)

PVI – D+1

2012 Rating – Toss Up

Mohawk is a state that essentially covers most of Upstate New York.  This is an area that is republican on the local level and used to be much more republican nationally as well.  Obama got 54% here, and Kerry ran nearly even with Bush in 2004, which tells me that this would be a pre-eminent swing state that would get a lot of media coverage and trips from the candidates in 2012.  The key for the Democratic candidate is to ring up a big margin in the cities like Buffalo, Syracuse, Rochester, and Albany, as well as carry the upper St Lawrence Valley.  For the republican, it is the rural areas of western new York and the lower Hudson valley that are the real zones to score well.  Definitely one to watch.  

Hudson – (NYC Metropolis) – Total vote 9,473,464

Obama – 5,976,369 (63.1%)

McCain – 3,497,095 (36.9%)

PVI – D+10

Rating – Safe Democratic

Hudson state consists of the greater NYC area and its sphere of influence, stretching from Connecticut through northern New Jersey.  I don’t think Democrats would have anything to worry about here, it’s one of the most democratic states in the nation.  

Susquehanna – (Eastern PA/South NJ) – Total vote 4,303,560

Obama – 2,658,358 (61.8%)

McCain – 1,645,202 (38.2%)

PVI – D+9

Rating – Safe Democratic

This state covers eastern Pennsylvania and southern New Jersey.  With Philadelphia being the dominant metro area here and with other democratic bastions within like Scranton, Allentown, and Atlantic City, there really isn’t much room for a republican candidate to do well.  Safe D.

Chesapeake – (Mid-Atlantic) – Total vote 6,145,671

Obama – 3,614,839 (58.8%)

McCain – 2,530,832 (41.2%)

PVI – D+6

Rating – Likely Democratic

Chesapeake state is fairly polarized politically.  There are actually some hugely republican regions in the state, such as south central Pennsylvania and upper Maryland, as well as parts of central and western Virginia.  The problem for the Republicans is that the democrats have a major base in the metropolitan corridor, stretching from Wilmington to Baltimore/DC to Richmond.  For the republican to win here he would have to do extremely well in the suburbs of Baltimore and in northern Virginia and hold down margins in the cities while cleaning up in the rural reaches.  Obama got 59% here, so that’s a tough task.

Allegheny – (West PA/East OH) – Total vote 3,938,362

Obama – 2,159,289 (54.8%)

McCain – 1,779,073 (45.2%)

PVI – D+2

Rating – Leans Democratic

Now here’s a state that I didn’t think would be so competitive.  Allegheny state, which covers the eastern portion of the Rust Belt, was carried by Kerry in 2004 but barely moved at all toward Obama in 2008 as many areas of western Pennsylvania and northern West Virginia actually moved rightward.  The district’s rightward trend leads me to believe that it could be a candidate to flip red in 2012, but to win, the republican candidate would have to avoid getting killed in Cleveland and Pittsburgh, the former being especially problematic as Obama took 70% in Cuyahoga County.  You’d definitely see big money dropped in this area and many visits, just as you do in today’s presidential elections.

Appalachia – (WV/East KY/West VA) – Total vote 1,436,350

Obama – 595,855 (41.5%)

McCain – 840,495 (58.5%)

PVI – R+12

Rating – Solid Republican

I didn’t know where to put this state geographically, it’s right at the bend of the northeast, south, and Midwest.  What I do know is that this state, much of which is locally democratic, is hugely republican at the national level.  Obama would have no chance here, and really even a democrat like Joe Manchin would struggle because of the inclusion of uber-red parts of eastern Kentucky and northeastern Tennessee to go with most of West Virginia.  For 2012 purposes, definitely Safe R.

Colorado Redistricting: Maps from the “Kumbaya Committee”

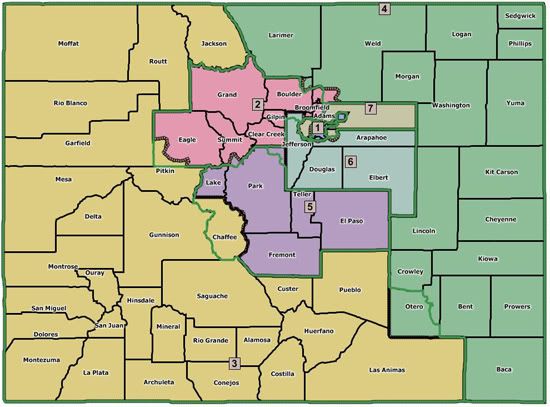
Yesterday afternoon the 12 maps were released by the Joint Committee on Redistricting.  The committee has also been tagged as the “Kumbaya Committee” for it’s attempt to bring bipartisanshippyness to the most partisan issue possible.

Of the 12 maps, 6 were brought forward by the Democrats on the Committee and 6 from the Republicans.  All 6 Democratic maps followed a similar pattern of keeping whole cities intact as well as entire rural counties and were appropriately named “city integrity”.  The Republican maps all stayed close to the current map, probably realizing that’s the best deal they could get at this point.  

Several of the changes from both maps incorporated the wishes of different constituencies in the hearings the committee held all over the state.  The biggest wish “Keep us separate from Boulder.”  Other major wishes included putting Grand and Chaffee counties in the 3rd (or at least not in their current 2nd and 5th CDs) and keeping the city and county of Denver whole (which is a shame).  

I’ve only included 1 map from each side as the other 5 on both sides are similar to them and change only a county or city here and there.  

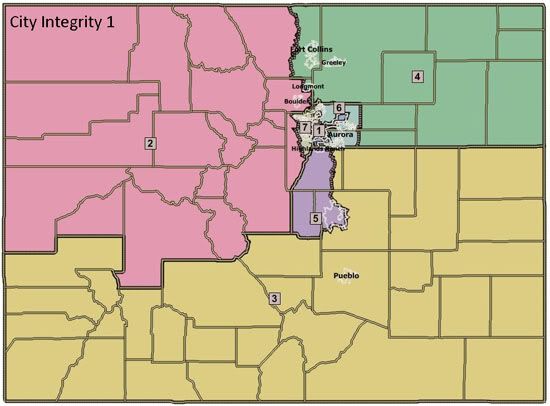
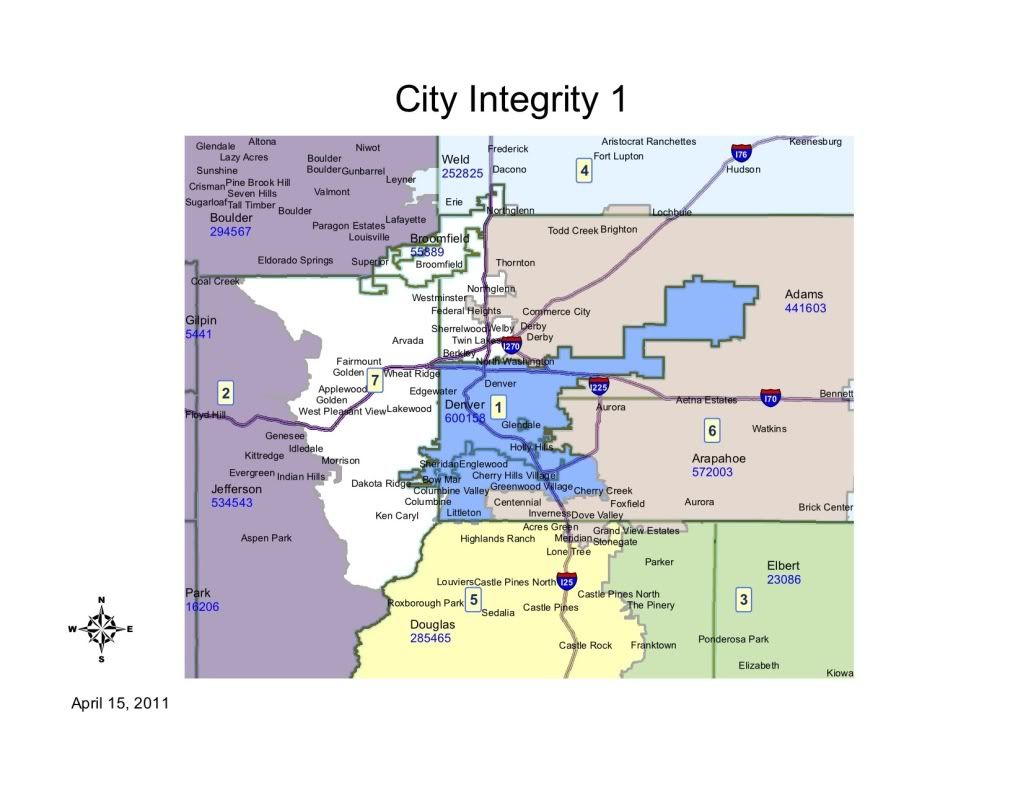
City Integrity 1

First, the Democrats map, known as “City Integrity 1.”  This is my personal favorite of all the Democratic maps and it’s also the “cleanest map” according to Sen. Rollie Heath (D-Boulder), co-chair of the committee.  All of the “City Integrity” maps strived to follow transportation corridors as well as striving for competitiveness.  The 1st, 2nd and 7th CDs are consistent throughout all the Democratic maps.

Photobucket

Photobucket

1st CD:  The 1st CD probably has the fewest changes.  It contains all of Denver County, Englewood, Cherry Hills Village, and Sheridan as before.  It adds Littleton, Greenwood Village, Bowmar, Cherry Creek Reservoir and some surrounding unincorporated areas of Arapahoe County.  The additions to the district are more Republican than the district as a whole, but the changes should be minimal, just making the district somewhat whiter than before.

2nd CD: The 2nd CD has some radical changes, going from it’s base in Boulder County (minus Longmont and Erie) west to take in all the north-west corner of the state.  The biggest new addition is Mesa County, one of the most Republican counties in the state and now the 2nd largest county in the district.  Chaffee, Lake and Park were taken from the 5th (as requested by the residents of Lake and Chaffee.  The district now includes all the major ski towns, Aspen, the oil and gas counties and the foothills towns in western Jefferson County.  If nothing else the district is now much more diverse in it’s interests and much more Republican.  The party break down is now 31 D, 31 R and 26 U, much more similar to the 7th CD when it was drawn a decade ago to be the most competitive.  We should be thankful Polis has more money than God and can probably hold this district in a non-2010 year.

3rd CD: The biggest disappointment of this map (especially to House Minority Leader Sal Pace of Pueblo) is the new 3rd CD.  It does a great job of keeping together the communities of interest in southern Colorado (despite what Republicans say, the south has more in common than the western slope and eastern plains as a whole).  It still contains all of Pueblo, but also adds Fremont, the rest of Otero, all the rural plains counties south of I-70 and the non-Colorado Springs portions of El Paso county, as well Parker and rural parts of Douglas county.  Overall this makes for a much more Republican district, probably out of reach for Democrats, but if you had to cut one loose, this was probably the district to do it with as several of the blue areas are shifting more and more R every year (San Luis Valley, Pueblo, Las Animas, Huerfano).  It still keeps Rep. Tipton’s home in Montrose so he can’t be too disappointed.

4th CD: The 4th CD needed to lose population and it did it with the most Republican parts of the district, now ending at Arapahoe/Washington/Yuma rather than taking in all the eastern plains down to the New Mexico Border.  It also loses the western half of Larimer County to the 2nd.  Most of the population lives in eastern Larimer so not much change other than shedding many republican precincts.  It then adds Erie and the eastern portions of Adams and Arapahoe counties, which are republican but not nearly as much as the counties given up.  These changes probably produce a district Obama and McCain were even in, if not a slight Obama win.  It becomes more winnable for Democrats, but still very competitive.  Sen. President Brandon Shaffer (D-Longmont) has to be pleased with this map as it keeps him in the district for a potential run.  Rep. Cory Gardner would not be happy at all with this district, but definitely still won it in it’s new configuration and the district keeps his home in Yuma.

5th CD:  Officially the southern I-25 corridor district, the 5th probably becomes even more Republican, adding most of Douglas, while shedding the swingier Chaffee and the blue Lake County.  Maintaining the home of Rep. Lamborn and also maintaing the districts center of gravity in Colorado Springs, the district will be to his liking (except for the absence of Fort Carson, which is now in the 3rd).  This is the beginning of the screwing-over of Rep. Coffman by taking out his best area in Douglas.  

6th CD:  The best change this map makes is the changing of the 6th from a suburban-Republican stronghold to a swingy eastern-suburban district.  While it keeps Coffman’s home in Aurora, he’s basically screwed in this district.  The extent to which this district takes in parts of Douglas and/or Weld changes between maps, but the heart of the district is the Arapahoe suburbs not in the 1st and most of the Adams Co. suburbs, including all the most hispanic areas.  Obama certainly won this district and in any normal year it would elect a solid Dem candidate.  This is probably the biggest reason this map will never be acceptable to the Republican House (while they have no love for Coffman I can’t see them being this willing to give up a safe seat).

7th CD: Another great change is in the 7th CD.  Keeping it’s base in Jefferson County, it sheds most of it’s Adams Co. areas and all of Aurora.  It then adds all of Arvada, Westminster, Northglenn and Broomfield (formerly in the 2nd).  It also takes in the Ken Caryl and unincorporated Jeffco (sometimes referred to as part of Littleton).  The district probably doesn’t change much in it’s tilt (maybe a very slight shift to the right), but it does remove the possibility of a Ryan Frasier challenge as he lives in Aurora.  This district makes more sense, while also maintaining it’s competitiveness.

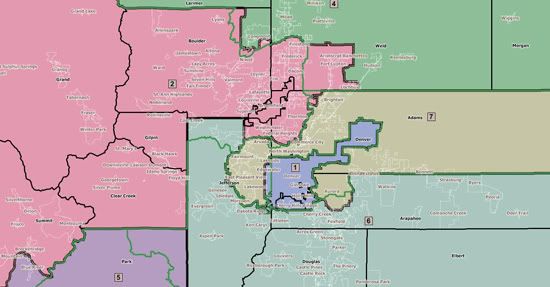
Balmer Map 1

The first Republican Map, known as “Balmer Map 1” for it’s author Rep. Balmer (R-Foxfield).  It is typical of all the Republican maps, keeping to the current boundaries as much as possible.  The biggest changes are the removal of Chaffee county from the 5th, the rest of Otero county in the 4th and more of Weld into the 2nd and southern Aurora into the 7th.  

The map below has helpful green lines where the current districts are so you can track the changes.

Photobucket

Photobucket

1st CD: Few changes here, but to add population the lines were moved from the county line between Denver to Jefferson (Sheridan Blvd.) to Wadsworth Blvd., all the precincts in between include parts Wheat Ridge and Lakewood and are probably some of the most Democratic precincts in Jefferson county.  The district remains as Democratic as before.

2nd CD: Biggest changes here were putting south-west Eagle County into the 3rd, a sliver of summit into the 5th to balance population there and the addition of Fort Lupton in Weld County.  The meter will be moved very little here either.  

3rd CD: The addition of Chaffee county is the biggest change along with the removal of the rest of Otero.  Little change here, but maybe a smidge in the Democratic direction.  

4th CD: Only the addition of the rest of Otero and the removal of Fort Lupton, doubtful to have much impact on the partisan make up.

5th CD: Removal of Chaffee county and the addition of the rest of Park and the Summit County Sliver, making it just a point or 2 more Republican.

6th CD: While appearing to have little change, the 6th actually has the most radical change in that it removed Rep. Coffman’s home in southern Aurora and puts it in the 7th!  Coffman has already reacted to the maps, lashing out at the Democratic maps for not including his home in his current district, when in fact they do…  But he plans to move to Greenwood Village, so he is actually angry at his future home being removed from the district and isn’t mad at the Republicans at all for screwing out of a district in their maps.  Gotta love that!

7th CD: Almost no change, except now being the home to Rep. Coffman!  

Likely result

Unless the “Kumbaya Committee” suddenly has a desire to actually work together, looks like neither of these maps or any of the other 10 maps will make it.  The rural Republicans are already screaming about the dividing of the eastern plains and western slope, which they consider to be “communities of interest.”  So we’re more likely than not to have the issue before the courts.  Lucky for Dems the Colorado Supreme Court is packed with Democratic-appointed Justices and in 2000 they chose the current map, which was proposed by Democrats.  

Illinois Downstate

So, I’ve decided to post the following partial map of Illinois just to get some opinions on how viable this seems.

My primary goal so far has been to create three Democratic districts in downstate Illinois. By my calculation, the IL-12, IL-15, and IL-17 districts on this map are each 53% Kerry districts. That means that the Democratic performance of IL-12 and IL-17 has been nudged up (they were 52% and 51% Kerry respectively) and a new, equally Democratic mid-cities district has been created (the orange IL-15 district).

Drawing three Democratic districts outside Chicagoland is obviously one lynchpin to a 14-4 Illinois map.

Meanwhile, I’m unsure when I’ll get the chance to work on Chicago & the collar counties some more (I’ve actually drawn them out in part, but I removed it from this map). My main priority has been collecting the Obama/McCain data for the entire state so that it can be uploaded to Dave’s App. I expect to have that done by the end of the upcoming week.

Note that the green districts on this map (IL-11 & IL-16) are just partially drawn. They are meant to ultimately be two of four GOP votesinks, the others being the yellow & tan districts on this map.

So, please give me feedback! Maybe it’ll inspire me to finish my map. 🙂

Apportioning the US Senate: A Weekend Fantasia

This diary explores the following alternate reality: What if the US Senate was apportioned like the US House? One hundred members, single-member districts, distributed just like House seats (ie, every state gets one seat and then the rest are apportioned using the rule of equal proportions.)

Using 2010 data, the map would look like this:
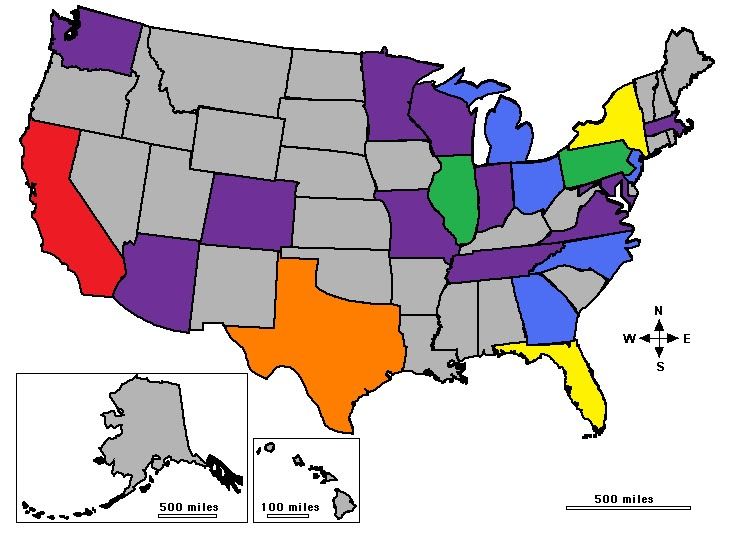
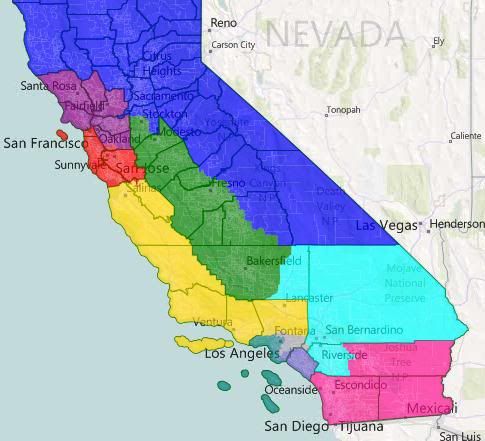
California, in red, would have 10 seats. Texas, in orange, would have 7. New York and Florida, in yellow, would have 5. Illinois and Pennsylvania, in green, would have 4. Georgia, North Carolina, Ohio, New Jersey, and Michigan – all in blue – would have 3. Eleven other states, in purple, would have their current 2. And the remaining twenty-eight states, in grey, would be down to 1.

Two seats would have moved as a result of the 2010 Senate reapportionment, with Texas and Colorado gaining at the expense of Ohio and New York.

(Figures are from the Census Bureau. Since we’re doing this just like the House, all you have to do is look at the House priority lists and cut it off at 100 instead of 435. See here for the 2010 data and here for the 2000 data.)

After the jump, I have maps for the 22 states that would have more than one senator in this alternate universe. Please feel free to post your own.

I’d also be very interested to hear who you all think would be in the senate in this alternate universe. I’m having a hard time figuring out how the one-third-at-time-up-for-election rule would work in a reapportioned body, so perhaps in the alternate universe, senators have four year terms and are elected at presidential midterm? That’s not a fixed rule for this hypothetical, just a guess.

Notes: The presentation of maps for states with more than one senator is sorted according to number of senators, then alphabetically. There’s a brief round up of the one-senator states at then end.

I’ve used the default colors throughout, so blue = CD-1, green = CD-2 purple = CD-3, red = CD-4, yellow = CD-5, teal = CD-6, grey = CD-7, slate blue = CD-8, cyan = CD-9 and pink = CD-10.

I’ve assumed that a compactionist ethic would be at play, and that minority opportunity districts would be favored, even if they’re not 50%+. Obviously, that’s another part of the alternate universe.

States with 3 or more senators

AKA those disadvantaged by the current system

California


Overview


LA Detail

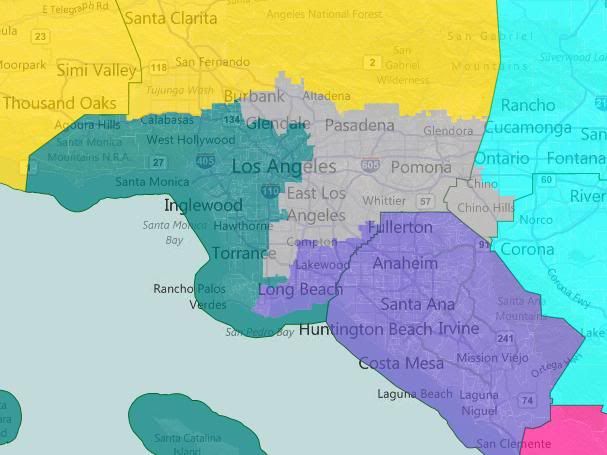
California has ten districts: (CD-1) North CA/Sacramento/Sierra Nevada, (CD-2) Central Valley, (CD-3) North Bay, (CD-4) South Bay, (CD-5) Central Coast, (CD-6) East LA County, (CD-7) West LA County, (CD-8) Orange County/Long Beach,

(CD-9) Inland Empire, and (CD-10) San Diego/Salton Sea.

CD-1 is the only one that’s majority-white by total population. CD-2, CD-5, CD-6, and CD-9 are plurality Hispanic. CD-07 is majority Hispanic.

My guess is that CD-3, CD-4, CD-6, and CD-7 would be safe Democratic, with the rest being some form of competitive (ie, between lean Dem and lean Rep). Say for the sake of argument that we would be holding two of them right now. That starts our running total at 6 D – 4 R.

Note: the voting block shapes for CA can be pretty large right now in Dave’s App. CD-6 is about 50k under populated with CD-07 about 50k over populated. If I swap the LA proper parts of CD-8 back to CD-6, that swaps to CD-8 being 30k under and CD-6 being 30k over. So, about half of that southern part of LA proper needs to go back to CD-6. For a fictional scenario, I figure this was an ok kludge.

Texas
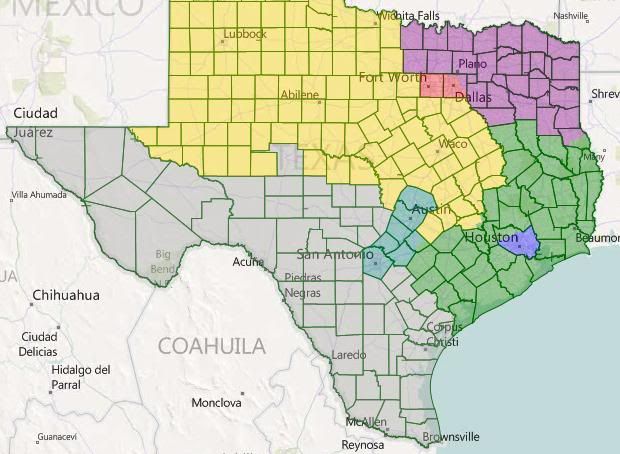
Texas has seven seats: (CD-1) Harris, (CD-2)Southeast Texas, (CD-3) Northeast Texas, (CD-4) Metroplex, (CD-5) North and Central Texas, (CD-6) San Antonio/Austin, and (CD-7) South Texas.

CD-7, of course, is heavily Hispanic. CD-1 is plurality Hispanic, and CD-4 and CD-6 are only plurality white.

I would think that CD-1 and CD-6 are easy gets for us, with CD-4 and CD-7 leaning our way. The other three are ubersafe for the GOP. Running total: Dem 10, Rep 7.

Florida
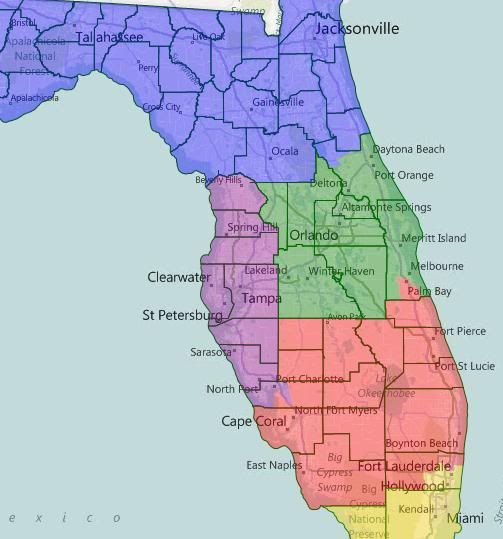
Five districts: CD-01 North Florida, CD-02 North Central Florida, CD-03 West Central Florida, CD-04 South Central Florida, CD-05 South Florida.

CD-05 is majority Hispanic, the rest majority white.

I’d like to think that these are all at least potentially competitive, but I’m going to be conservative here and say that we only hold one of these (Nelson in Orlando?). Running total: Dem 11, Rep 11.

New York


Overview


NYC Detail

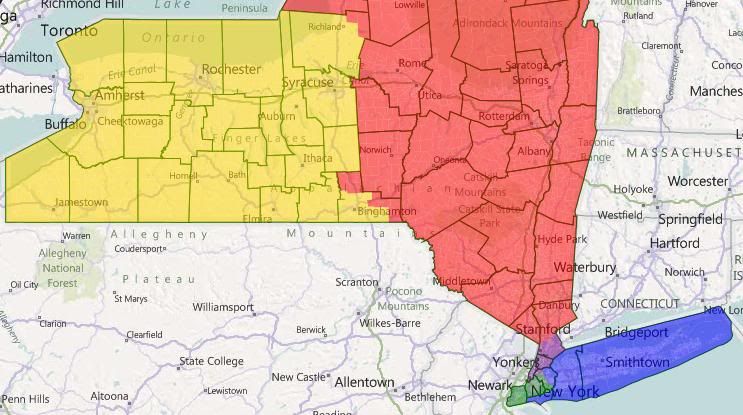
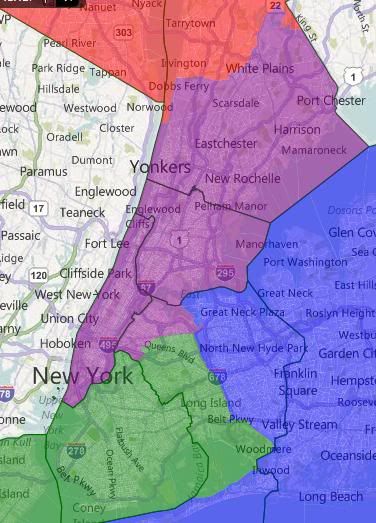
Five districts: CD-01 Suffolk/Nassau/NW Queens, CD-02 Brooklyn/Staten Island/South Queens, CD-03 Manhatten/Bronx/Northwest Queens/South Westchester, CD-04 East Upstate, CD-05 West Upstate.

I forgot to save this map, so I don’t have racial stats. CD-02 and CD-03 were majority minority, I think.

Partisan breakdown here depends on whether 2010 factors into the equation. In a normal environment, I think CD-04 is the only truly vulnerable district, but we’ll spot the GOP CD-05 as well. Running total: Dem 14, Rep 13.

Illinois
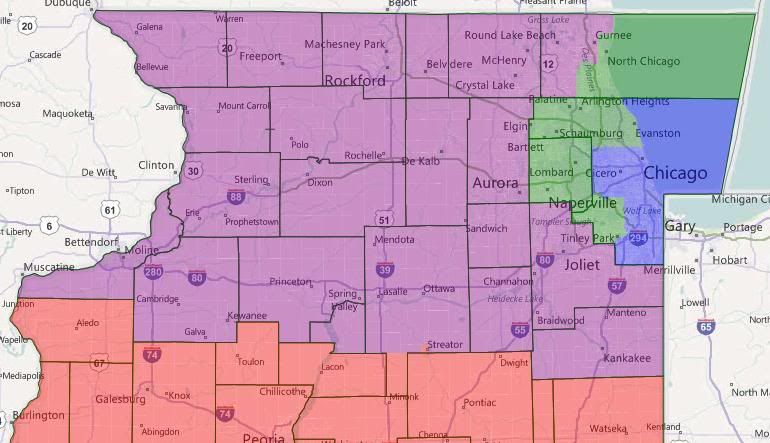
CD-01 Chicago, CD-02 Suburban Chicago, CD-03 Northern Illinois, CD-04 Southern Illinois. CD-01 is plurality black at 35% or so. The rest majority white. I’m going to call this a 2-2 split, so running total: Dem 16, Rep 15.

Pennsylvania
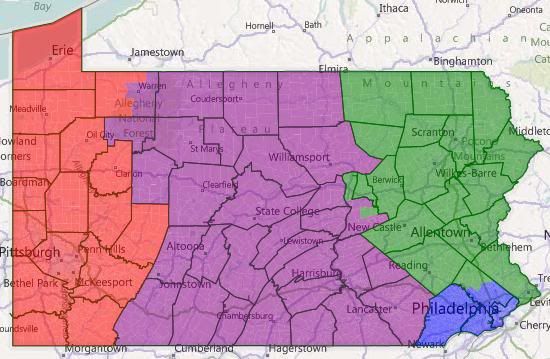
CD-01 Philadelphia, CD-02 Northeast PA, CD-03 Central Pa, CD-04 West PA. All majority white. I’m going to call this one a 2-2 split also, so running total Dem 18, Rep 17.

Georgia
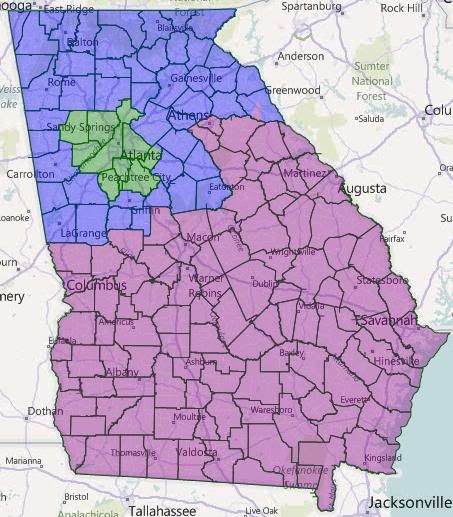
Three districts: CD-01 North Georgia, CD-02 Atlanta, CD-03 South Georgia.

Atlanta is plurality white and about 40% black, the rest are majority white.

I assume we’d take Atlanta and Republicans would get the other two. Running total: Dem 19, GOP 19.

Michigan
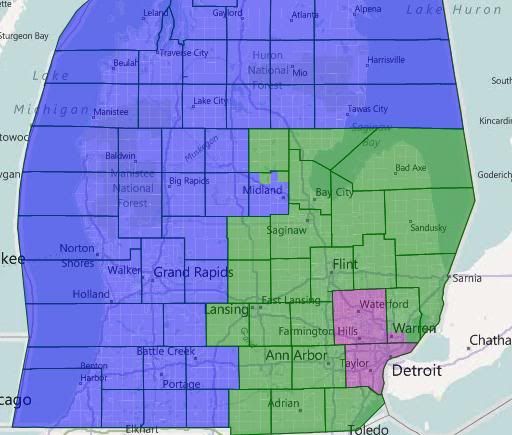
Three districts: CD-01 North and West Michigan, CD-02 Southeast Michigan, CD-03 Wayne/Oakland/South Macomb.

Looks like I forgot to save this map too. I’m pretty sure they’re all majority white.

CD-02 and CD-03 are safe Democratic (and would probably be represented by Stabenow and Levin, respectively.) CD-01 is likely Republican. Running total: Dem 21, GOP 20.

New Jersey
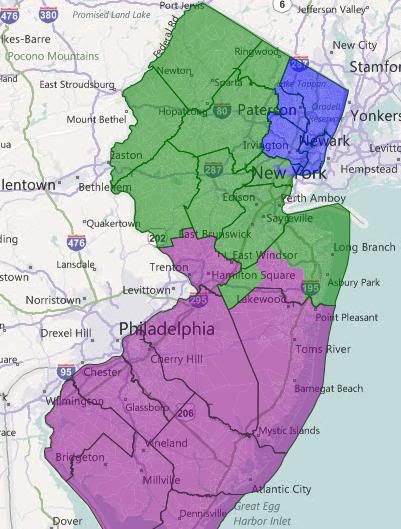
Three districts: CD-01 Greater Newark, CD-02 North Jersey, CD-03 South Jersey.

CD-01 is white plurality, the other two white majority.

I know a lot of Democratic strength is locked-up in CD-01, but we’d still be likely to hold at least two of these, right? Running total: Dem 23, GOP 21.

North Carolina
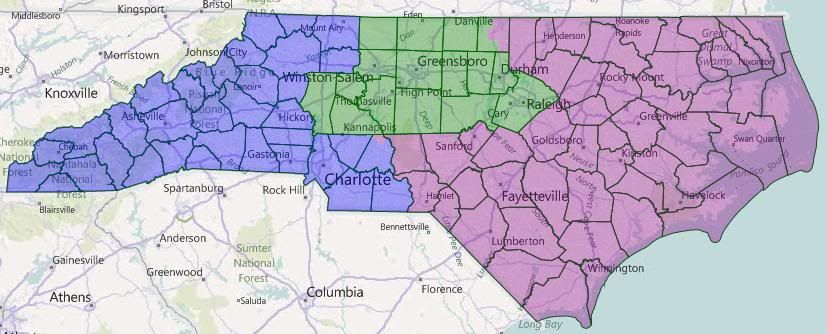
CD-01 Charlotte/West Carolina – Likely Republican?

CD-02 Triangle and Triad – Likely Dem

CD-03 East Carolina – Toss-up?

All are majority white; CD-03 has the highest black percentage at 27%. I’m going to give us a Blue Dog-ish Dem in the east, so running total: Dem 25, Rep 22.

Ohio
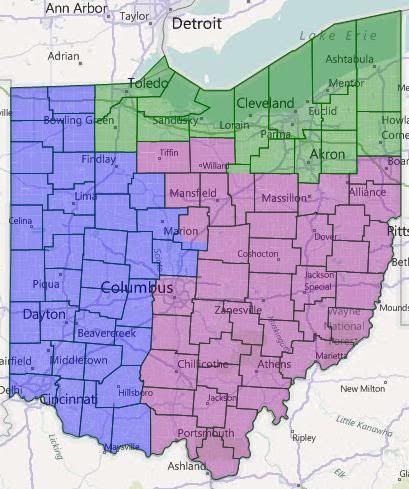
CD-01 West Ohio, Likely R

CD-02 North Ohio, Safe D

CD-03 Central and SE Ohio, Tossup?

All majority white. I’ll throw the R’s a bone here and call the running total: Dem 26, Rep 24.

Note that these eleven states account for half the senators in the alternate universe.

States with Two Senators

AKA the status quo

No geographic breakdowns anymore, I’m too tired. Remember, Blue = 1 and Green = 2.

Arizona
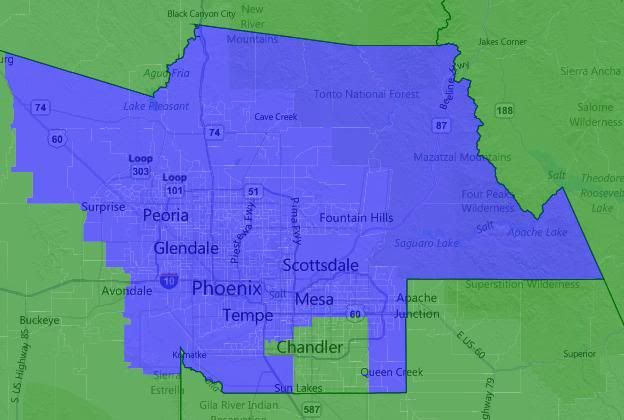
Both majority white at 58%. I have no idea if splitting Arizona between Maricopa and outstate helps us. I’ll assume not. Running total: Dem 26, Rep 26.

Colorado
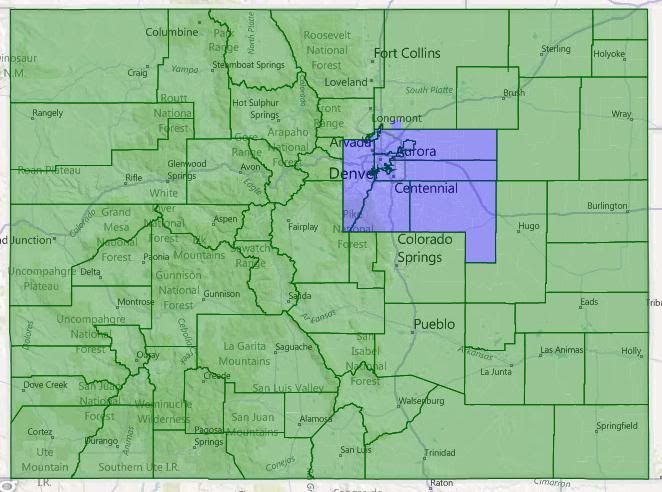
I assume that cutting out Denver is bad for us. Running total: Dem 27, Rep 27.

Indiana
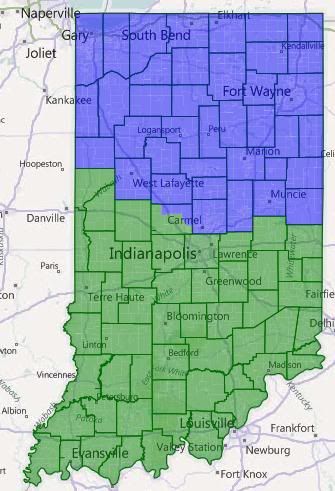
I could see both of these being competitive under the right circumstances. I’m going to give us the northern one. Running total: Dem 28, Rep 28.

Maryland
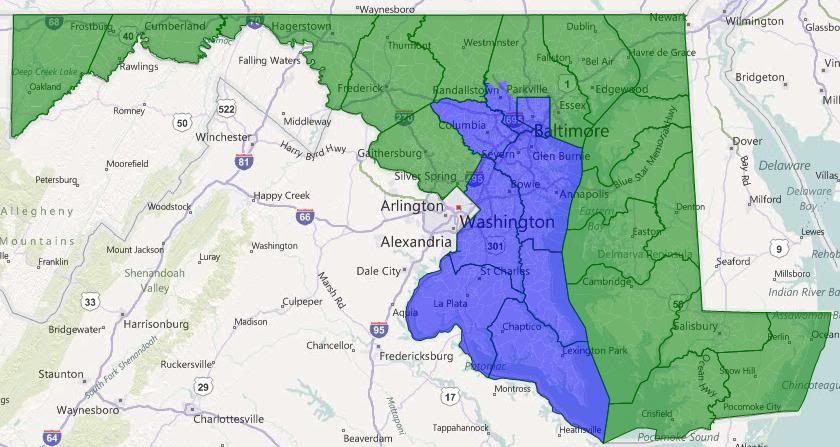
CD-01 is plurality black at 45%; this makes the other district more competitive than it ought to be. I still think we take both. Running total: Dem 30, Rep 28.

Massachusetts
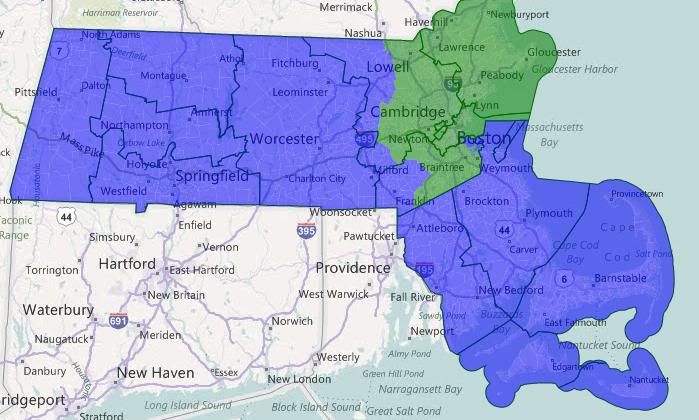
Let’s go ahead and assume Scott Brown. Running total: Dem 31, Rep 29.

Missouri
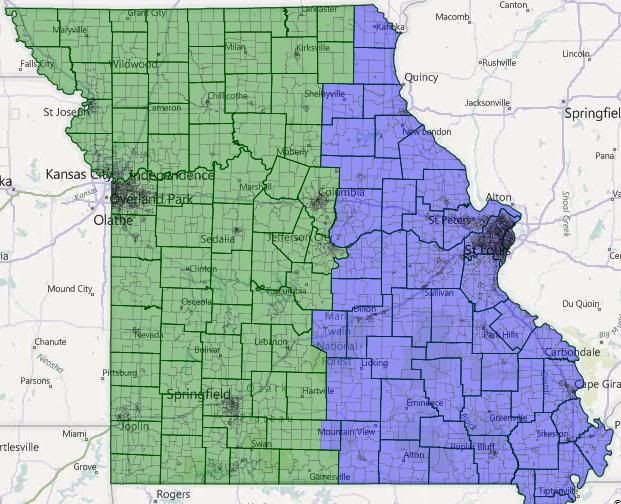
No idea what the ramifications of splitting Missouri are. I’m calling it split. Running total: Dem 32, Rep 30.

Minnesota
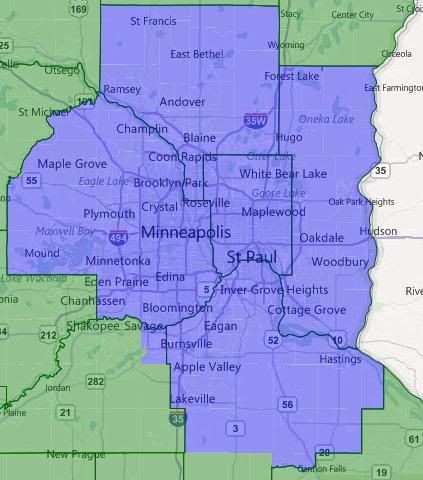
I assume we can hold both of these? Running total: Dem 34, Rep 30.

Tennesee

CD-01 is safe GOP. I could see us competing in CD-02. But running total: Dem 34, Rep 32.

Virginia
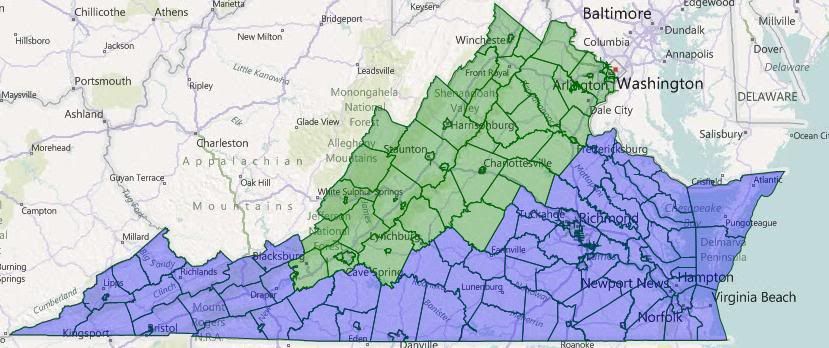
I’m not happy with this division, but everything else looked worse. Both districts should still be winnable for us, so running total: Dem 36, Rep 32.

Washington
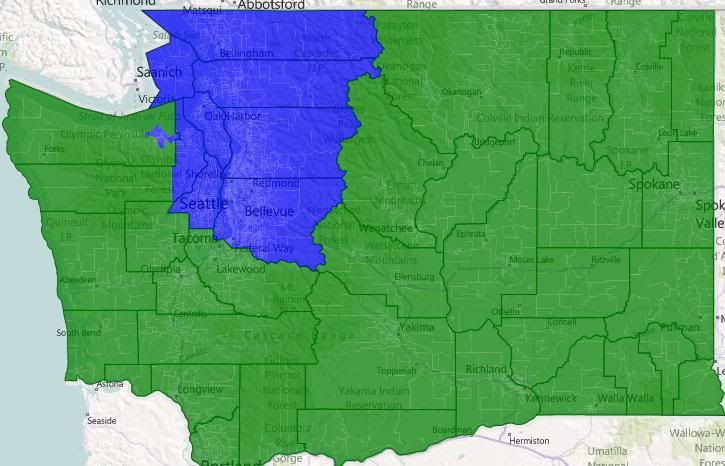
Probably the state where the split harms us most, unless Tacoma and Olympia can outweigh the rest of the state. I’m calling it split, so running total: Dem 37, Rep 33.

Wisconsin
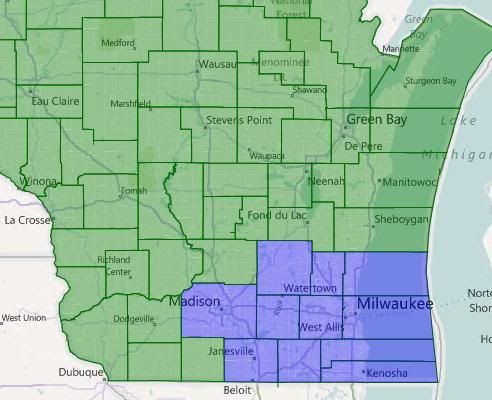
Madison and Milwaukee versus the Circle of Ignorance! The rest of Wisconsin looks on… I’m giving us both, so running total Dem 39, Rep 33.

The Single Senator States

AKA The unfairly advantaged

The remaining 28 states currently have almost enough votes to sustain a filibuster; in the alternate universe, they don’t even have enough to block one.

Northeast

I’d give us Delaware, Vermont, Connecticut, and Rhode Island. Maine and New Hampshire are probably toss-ups, so I’ll get us one of them. Running total: Dem 44, Rep 34.

South

They get Alabama, Mississippi, Kentucky, Oklahoma, and South Carolina. We get West Virginia. And I’ll split Arkansas and Louisiana. Running total: Dem 46, Rep 40.

Midwest

They get Kansas. I’ll split Iowa, Nebraska, and the Dakotas. Running total: Dem 48, Rep 43.

West

We get Oregon, New Mexico, Hawaii and Montana. They get Wyoming, Idaho, and Utah. That leaves splitting Nevada and Alaska. Final total: Dem 53, Rep 47.

Conclusion

Ok, that’s bizarre. I totally didn’t set out to end up where we actually are, it’s just where my guesses lead. Even if my take on this particular exercise didn’t show any partisan bias to the set-up of the Senate, it does highlight just how undemocratic that body is.

Again, please feel free to chime in about who you think would be in office in the alternate universe or to show off your (more gerrymandered?) versions of the alternate universe’s Senate districts.
Louisiana with 2 “VRA” districts?

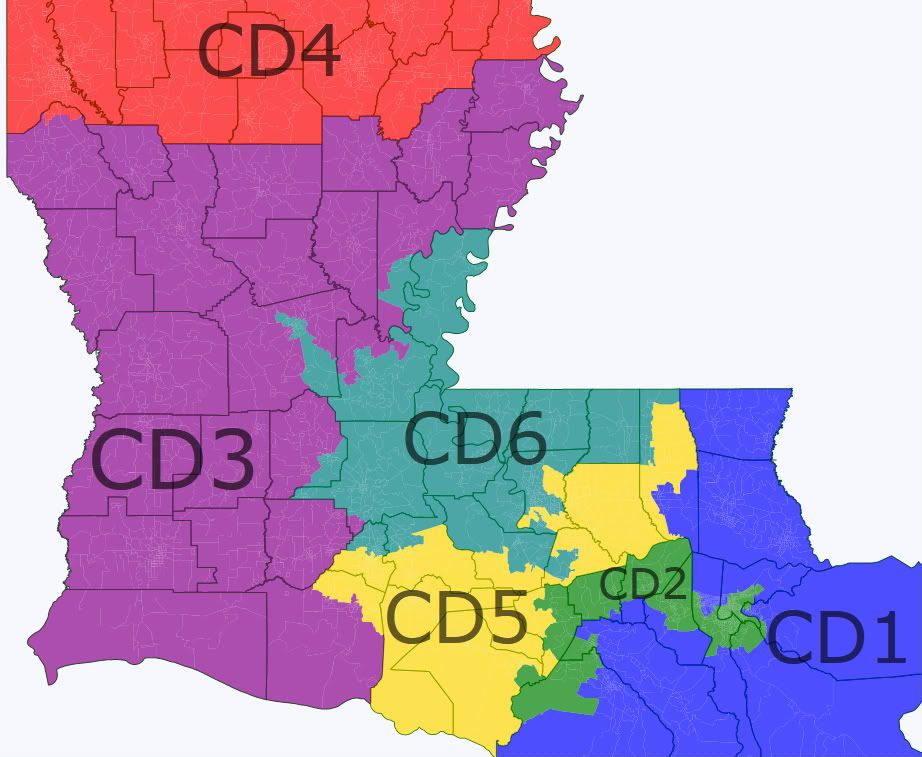
A few days ago in the discussion of the proposed Louisiana map someone drew a map with two majority-black districts but nothing else filled in. I drew this map to see (a) if I could get the New Orleans district to be more compact and (b) what the other districts would look like. As it turns out, the answer to (a) is yes, but it’s plurality black as opposed to majority black, and the answer to (b) is ugly.

Here’s the map.

louisiana

In district descriptions, the percentages are for voting age population. w is non-Hispanic white, b is black, h is Hispanic, and a is Asian.

LA1 (blue): 77.6w-12.3b-6.0h-1.7a. Still mostly a suburban New Orleans seat, but it was forced to move into the Thibodaux-Houma area by the positions of the VRA districts. Safe R.

LA2 (green): 41.7w-46.5b-7.3h-3.0a. Because of the depopulation of New Orleans, this district has to extend west and then south to pick up some heavily black areas. Probably likely D to safe D, as it’s still 58% minority and its white population is probably relatively moderate compared to the rest of the state. While less compact than a typical district, it’s far more compact than either its current or proposed versions.

LA3 (purple): 74.0w-20.7b-2.4h-0.9a. Ugh. It’s geographically impossible for it to take all of Cajun country, so it has to extend much further north. It wasn’t possible for it to take everything along the west side of the state up to and including Shreveport so I had to take it practically to the northeast corner of the state to avoid splitting up the Shreveport area. The result is a sprawling, incoherent mess that takes up maybe 40% of the state’s land area. Safe R.

LA4 (red): 59.8w-35.6b-2.4h-1.0a. The one clean district, the I-20 district. Likely R.

LA5 (yellow): 79.6w-13.9b-3.5h-1.7a. This ugly district with nodes in Baton Rouge and Cajun country connected by a narrow strip was necessary because the two VRA districts pass so close to each other. Safe R.

LA6 (teal): 44.6w-50.2b-2.6h-1.3a. The Baton Rouge-based majority-black district is nice and compact, but it has some community-of-interest issues as it takes pieces of Lafayette, Ville Platte, and Alexandria in addition to part of the capital city. Probably close to safe D even though it’s likely only D+6 or so: it looks like it would be easy for a Republican to get to 40% but nearly impossible to get over the hump. Compare it to Sanford Bishop’s current district, which is probably about as polarized as this LA6 would be but has black-white percentages that are basically the reverse of what this district has. It’s D+1.

I’m pretty sure that a court would accept this proposed LA6 if the state submitted it, as courts have accepted some really ugly and incoherent districts.  But here’s the question: would a court compel a state to draw something like the proposed LA6–which looks ok but slices and dices some widely separated cities–if the state isn’t inclined to draw it in the first place? Perhaps someone with a better understanding of the VRA can weigh in on this. Thoughts?

By what margin will Bob Shamansky win?

View Results

Loading ... Loading ...

IA-04: Christie Vilsack May Challenge King

This report from Nathan Gonzales is pretty interesting — and surprising:

Former Iowa First Lady Christie Vilsack (D) is likely to take on Cong. Steve King (R) in Iowa’s new 4th Congressional District, according to a Democratic source in the Hawkeye State. Vilsack, however, has not yet made a final decision.

Vilsack hails from Mount Pleasant, which is right in the heart of the new second district, where she was rumored to be interested in running for Congress. But with Loebsack staking his claim in the 2nd CD, it looks like she’s trying to avoid yet another tragic incident of Sack-on-Sack violence by exploring other options.

The 4th CD, as it stands today, is pretty tough territory: Obama lost it by 44-54, and Kerry got stomped by 39-60 back in 2004. Under the proposed lines, however, it’s now a district that Obama lost by only 48-50, and even John “Who Among Us Does Not Love NASCAR?” Kerry held down 44% under these lines. In short, that’s still tough terrain for a Democrat, but it’s significantly more fertile than before; with King’s penchant for letting his freak flag fly and a credible opponent working against him, this could be an interesting race.

WI Sup. Ct.: Prosser Declared Winner

Via the Milwaukee Journal Sentinel:

State Supreme Court Justice David Prosser emerged as the winner Friday over challenger JoAnne Kloppenburg in a heated election that drew national attention because of the fight over collective bargaining and a ballot reporting error in Waukesha County, following initial results that showed Kloppenburg leading the race.

A canvass of vote totals from the state’s 72 counties finalized Friday afternoon shows Prosser beating Kloppenburg, an assistant attorney general, by 7,316 votes. The final canvass of the April 5 vote was completed 10 days after the election, the maximum allowed by state law.

The margin – 0.488% – is within the 0.5% limit that would allow Kloppenburg to request a statewide recount at taxpayers’ expense.

Following the announcement, Prosser declared victory, but Kloppenburg did not concede. She has until Wednesday to request a recount, though obviously with a margin this wide, such an effort would almost certainly not change the outcome.

Also worth checking out is this analysis from the Brennan Center, which shows that conservative groups spent $2.22 million on the race, compared to $1.37 million from the lone progressive group, the Greater Wisconsin Committee. (For some reason, the Journal Sentinel calls the former figure “37% more” than the latter, but they simply have it backwards – the GWC spent 37% less than the conservative groups, which is still a pretty misleading way of putting, since the right-wing orgs spent over half-again as much as our side did.)

MI-Sen: Pete Hoekstra Won’t Run

I can’t say I’m terribly surprised:

Former U.S. Rep. Pete Hoekstra said today he won’t challenge Sen. Debbie Stabenow next year for her U.S. Senate seat.

“After serious consideration and many discussions with friends and supporters, Diane and I have made the decision that I will not be a candidate for the United States Senate in 2012,” Hoekstra said in a morning email to supporters. “We agreed that it was not in the best interest of our family at this time to enter the race.”

I guess this congressman from Michigan’s finally gonna go back home and build that turtle fence. In his honor, I have to post it one final time:

The Republicans don’t have a lot of good potential candidates waiting in the wings (not that Hoekstra was particularly great shakes). Of course, at this time last year, we were taking a lot of comfort in facts like that – but then absolute nobodies like Ron Johnson in Wisconsin went on to post wins. So while I don’t expect 2012 to wind up like 2010, recent events definitely inspire me to be more cautious when writing off Republican chances due to ostensibly poor benches. After all, at this point in 2009, I didn’t expect 2010 to wind up like 2010, either.