Let’s do this “weekend” thing.
Month: June 2009
Taking Another Swing at New Jersey
The last time I redistricted NJ, I started from the north. That made for a messy 12th district that I wasn’t happy with. This time I started in the south, and came up with what I feel is a better map, especially because it isolates Ocean County in a Republican district.
District numbers are again the same, with the old 13th renumbered the 11th.
On to the maps!
Newark Enlargement:
North Jersey:
Central Jersey:
South Jersey 1:
South Jersey 2:
NormDollar.com: Provide Norm Coleman with the Knock-Out Punch
{First, a cheap plug for my blog Senate Guru.}
This past Monday, the Minnesota Supreme Court heard oral arguments in Republican Norm Coleman’s appeal of Senator-elect Al Franken‘s victory. Some estimates put the release of the Court’s decision at around two weeks from now. Election law experts are unanimous in their expectation that the Court will affirm Senator-elect Franken’s victory, as the state Canvassing Board and the three-judge panel both have previously.
| What is unclear is whether Coleman will appeal to a federal court after losing at the state level for the third time – and whether the federal appeal would or could delay the seating of Senator-elect Franken. No doubt that Coleman would need to rely on funds from Washington D.C. Republicans to keep his appeal going to the federal level. Republicans have to decide whether it is financially and politically worth it to continue funding Coleman’s appeals. With the state Supreme Court’s decision expected soon, we can provide a knock-out punch.
Thanks to the “One Dollar a Day to Make Norm Coleman Go Away” effort at NormDollar.com, progressives across the country have provided Republicans with disincentive from funding Coleman’s endless appeals. Due to Coleman’s obstinance, progressives have raised over $140,000 to put toward assisting progressive candidates for Congress against the very Republicans whose Party leaders and funders are keeping Coleman’s appeals going. |
 |
Getting the NormDollar.com effort over the $150,000 mark in advance of the Court’s decision would provide a nice exclamation mark on Republicans’ hesitation to continue financial support for Coleman’s appeals.
If Republicans tell Coleman that they will not fund his appeals any longer, Coleman will be unable to continue his appeals, and we can finally get Senator-elect Franken seated. A contribution to the “One Dollar a Day to Make Norm Coleman Go Away” effort will encourage Republicans to send that very message to Coleman. (Adam Green offers further thoughts on the topic.)
FL-Sen, FL-Gov: Crist Still Dominating
Strategic Vision (R) (5/29-31, likely voters, 2/6-8 in parens):
Kendrick Meek (D): 29 (26)
Charlie Crist (R): 59 (60)Kendrick Meek (D): 30 (24)
Marco Rubio (R): 31 (26)
(MoE: ±2.8%)Charlie Crist (R): 59 (54)
Marco Rubio (R): 22 (4)
Other: NA (33)
(MoE: ±4.5%)
Alex Sink (D): 39
Bill McCollum (R): 41Alex Sink (D): 40
Paula Dockery (R): 34
(MoE: ±2.8%)Bill McCollum (R): 44
Paula Dockery (R): 28
(MoE: ±4.5%)
Republican polling firm Strategic Vision takes a look at both the Senate and Governor’s races in Florida. They also polled the Senate race in February, including a Crist/Meek matchup back when the notion of Charlie Crist actually switching over to Senate seemed rather fanciful. However, the numbers haven’t really budged much since then, even though the field has started to solidify.
Rep. Kendrick Meek has made up a few points on Crist, but is still trailing Crist by 30, looking pretty insurmountable at this point. On the other hand, Meek vs. former state House speaker Marco Rubio is a dead heat (although the undecideds on that race are still tremendously high). In the GOP primary, Rubio has shot up, but not at Crist’s expense. Instead, Rubio seems to have cornered most of the former “Other” vote, as the previous poll included Reps. Vern Buchanan and Connie Mack, and movement conservative voters seem to have dutifully gravitated to Rubio now that he’s the right-wing’s horse in the race. Rubio can expect to further improve as he gets better-known, but with Crist near 60%, that’s an incredibly steep hill to climb.
There aren’t any trendlines on the governor’s race (which only recently became clear it would be CFO Alex Sink vs. AG Bill McCollum), but the 2-point lead for McCollum is very consistent with previous Sink/McCollum matchups, going all the way back to when it was assumed these two would be squaring off for the Senate instead. Strategic Vision also polls state Senator Paula Dockery, who’s been making some noise this week about running in the primary that the state GOP thought they’d already cleared. Dockery doesn’t turn out to be much of a factor right now, losing badly in the primary against McCollum and trailing Sink by 6 in the general, although her position might improve as her name recognition improves outside the I-4 corridor.
My brief take on TX redistricting (since all the cool kids are doing it)
Apologies for the lack of maps – I’ve been having untold issues attempting to save and recover images using Dave’s Redistricting App. For the time being, my summary will have to suffice.
In short, as many have rightly observed, the prospect of Texas potentially gaining four additional House seats needn’t be a frightening one. To be sure, it seems almost invariable that the new configuration will be more favorable to Democrats than the current DeLay gerrymander.
The map I created naturally aimed to maximize the strength of the ever-growing Latino vote, particularly in Houston, San Antonio, the Rio Grande Valley, and the DFW Metroplex. I also sought to contain districts within county boundaries wherever possible. Having put it through several permutations, I found it possible – if not probable, were politics somehow removed from the redistricting process – that an 18R/18D map could easily be created, and that the potential even exists, without too much re-jiggering, for a Dem-majority delegation.
>CD-12 would be contained completely within Tarrant County, taking in most of Ft. Worth and Arlington and thusly creating a majority-minority district.
>CD-14 would lose Galveston and take in most of Corpus Christie, thus giving it a narrow Latino majority.
>CD-15 would be compacted entirely within Hidalgo County in the Rio Grande Valley, where there has been massive Hispanic population growth.
>CD-16 would remain largely intact within greater El Paso.
>CD-23 would relinquish its share of Bexar County and expand Northward, taking in Odessa, Midland, and/or San Angelo currently in CD-11 – it would do this and still maintain a Latino majority.
>CD-27 would give up most of its share of Corpus Christie and expand Westward, taking in Duval, Jim Wells, and Brooks Counties, all currently in CD-15 and all heavily Latino.
>Democratic Travis County would anchor two separate CD’s.
>Bexar County would wholly contain two majority Latino CD’s.
>Harris County alone could accommodate as many as five Latino plurality districts. They would vary in range of competitiveness depending upon their remaining demographic composition.
>Dallas County could similarly accommodate three Latino plurality districts (one of which could instead be African-American plurality if most of CD-30 is kept intact).
As always, please feel free to comment and critique.
SSP Daily Digest: 6/5
• NY-Sen-B: The speculation about a primary challenge had in the last month mostly shifted over from Rep. Carolyn McCarthy to Rep. Steve Israel and now Rep. Carolyn Maloney, but in case there was still any doubt, McCarthy made it official yesterday that she won’t be challenging Kirsten Gillibrand in the Senate primary. Is this another tea leaf that Maloney is, in fact, running? (McCarthy said she’d stand down if someone younger ran, and although it may not be what McCarthy had in mind, Maloney, at 60, is 4 years younger.) Maloney did confirm her phone chat with Joe Biden, but said he didn’t try to push her out of the race. Meanwhile, Gillibrand got two endorsements that are important in the African-American community: Al Sharpton and Rep. Greg Meeks. (All three are key David Paterson allies, so perhaps not too surprising.)
• NC-Sen: Elaine Marshall, who’s been Secretary of State since 1996, hasn’t been the subject of much Senate speculation. However, she just publicly expressed her interest (while saying that she’s not actively testing the waters). Marshall ran for Senate once before, finishing third in the 2002 Democratic primary behind Erskine Bowles and Dan Blue.
• CO-Gov: Bill Ritter may be facing a tough re-election bid, so the last thing he needs to be doing is turning friends into enemies… so it’s strange to see him so frequently ticking off labor, most recently the firefighters’ union by vetoing a bill that would have given them collective bargaining rights. And on top of that, he’s a terrorist sympathizer… at least according to Rep. Mike Coffman, who doesn’t like that Ritter blocked expansion of a local Army training site.
• OR-Gov: Although he’s been reluctant to show any interest in the race, don’t fully rule out Rep. Peter DeFazio yet. Hot on the heels of ex-Gov. John Kitzhaber having his coming-back-out party in front of the state movers-and-shakers at Portland’s City Club, now DeFazio will have his turn addressing them in two weeks. Hmmm… after several months worrying that neither DeFazio nor Kitzhaber would get into the race, now I’m left wondering what happens if both of them get in?
• VT-Gov: Democrats have seemed lukewarm about taking on Gov. Jim Douglas the last few cycles, but there seems to be more optimism this time, and it’s attracting more contenders. State Senator Susan Bartlett (who chairs Appropriations) announced her candidacy, joining ex-Lt. Gov. Doug Racine and possibly SoS Deb Markowitz. One item of note that Steve catches: Douglas, who’s been in office since Howard Dean’s 2002 retirement, hasn’t yet announced that he’s running for re-election. There may be a growing sense that the seat could be open.
• VA-St. House: Josh Grossman from Progressive Punch, guest blogging at 538, takes an interesting look at Democratic chances for flipping Virginia’s House of Delegates in the 2009 election (the last one prior to Virginia redistricting). It includes a nice chart ranking the swing districts according to 2008 presidential percentage… although it’s dismaying to see how many don’t have a Democratic candidate yet.
• WA-Wahkiakum County Clerk: A never-before-elected retired musician by the name of Krist Novoselic has filed to run for the position of county clerk in Wahkiakum County (approx. population 4,000) in the fall 2009 election. Although he’s been involved in Democratic Party politics as a committeman, he’s running as “prefers Grange Party” rather than as a Dem, probably because of his appreciation of the Grange, a populist movement from the turn of the previous century (or else he just misspelled “Grunge Party”).
VA-Gov: The Swing State Project Poll
No, we haven’t hired R2K. Rather, we’re curious to know who folks here would vote for if given the opportunity this Tuesday. So whether you live in Virginia or not, please let us know who you’d support in this SSP poll. And feel free to elaborate in comments!
FL and GA on Dave’s App.
Having mapped most of the country in my absurdly low-tech fashion, the release of Dave’s redistricting application (and bandwagon appeal) compels me to revisit some of these states with better data. I’ll start with Florida and Georgia, two states covered by recent diaries but for which my approach is decidedly different.
These maps resemble what I drew on Paint, but not exactly.
Below the fold…
Florida
Like my Paint-generated Florida map, this is based on the assumption of a Republican plan, and more or less consists of incumbent protection with few exceptions (since it does generally protect incumbents, the map wouldn’t be dramatically different if Alex Sink was elected). Re: the Voting Rights Act, I was not able to preserve a black majority in Corrine Brown’s district; 47% was as close as I could seem to get, but with the white population at 40%, other minority groups would seem to make FL-3 VRA-protected.
The new 26th, as in my original iteration, is a modestly GOP-leaning Central Florida seat between the Ocala area and Lake Okeechobee.
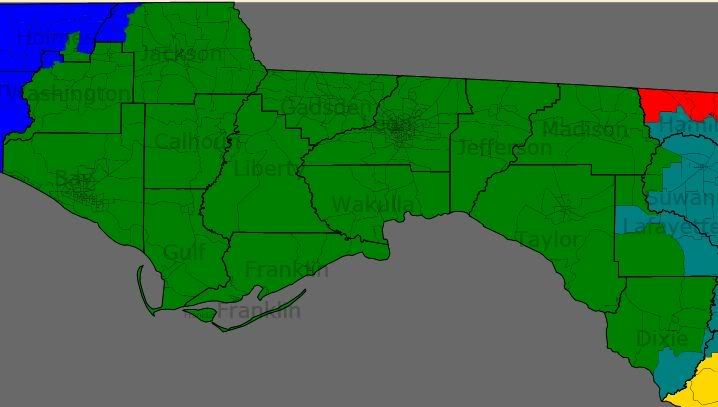
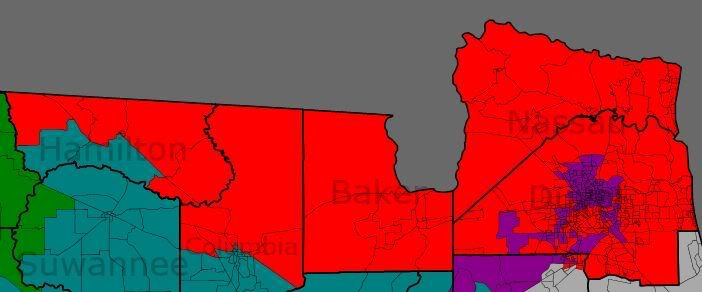
The northern half of the state:
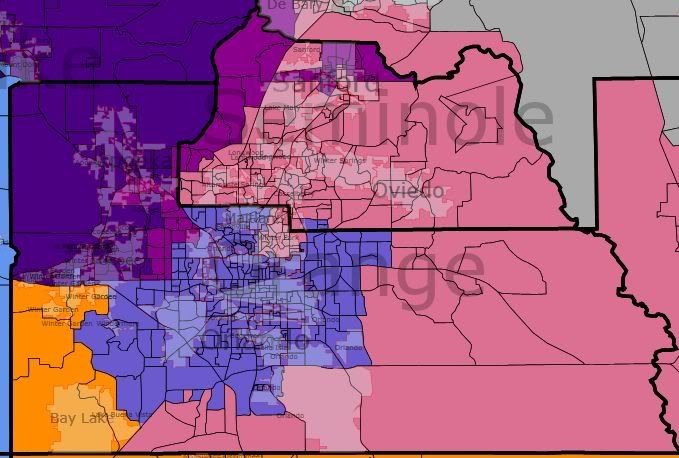
The southern half of the state:
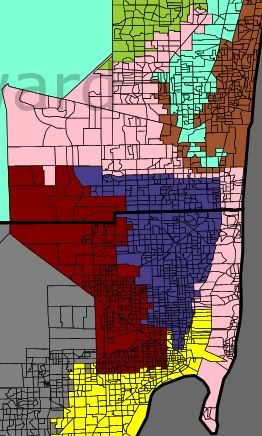
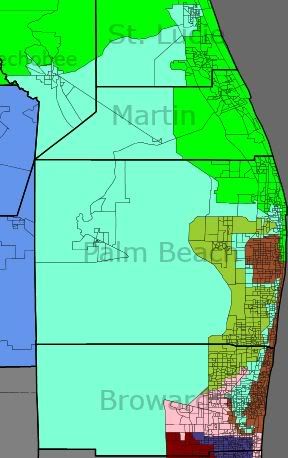
Focus on South Florida:
District 1 (blue) – Jeff Miller (R-Chumuckla)
Counties: Escambia, Holmes, Okaloosa, Santa Rosa, Walton
Large minorities: 14% black
Politics: strong Republican
District 2 (dark green) – Allen Boyd (D-Monticello)
Counties: Bay, Calhoun, Dixie, Franklin, Gadsden, Gulf, Jackson, Jefferson, Lafayette, Leon, Liberty, Madison, Taylor, Wakulla, Washington
Large minorities: 25% black
Politics: Republican-leaning when Boyd retires
District 3 (purple) – Corrine Brown (D-Jacksonville)
Counties: Alachua, Clay, Duval, Lake, Orange, Putnam
Large minorities: 47% black (just 40% white)
Politics: strong Democratic
District 4 (red) – Ander Crenshaw (R-Jacksonville)
Counties: Baker, Columbia, Duval, Hamilton, Nassau
Large minorities: 15% black
Politics: strong Republican
District 5 (yellow) – Ginny Brown-Waite (R-Brooksville)
Counties: Citrus, Dixie, Gilchrist, Hernando, Levy, Pasco
Large minorities: none
Politics: strong Republican
District 6 (aquamarine) – Cliff Stearns (R-Ocala)
Counties: Alachua, Baker, Bradford, Clay, Columbia, Hamilton, Marion, Suwannee, Union
Large minorities: 11% black
Politics: strong Republican
District 7 (gray) – John Mica (R-Winter Park)
Counties: Flagler, Lake, Putnam, Seminole, St. Johns, Volusia
Large minorities: 12% Hispanic, 11% black
Politics: generally Republican
District 8 (lavender) – Alan Grayson (D-Orlando)
Counties: Orange
Large minorities: 27% Hispanic, 10% black
Politics: tilting/trending Democratic
District 9 (turquoize) – Gus Bilirakis (R-Palm Harbor)
Counties: Hillsborough, Pasco, Pinellas
Large minorities: 14% Hispanic
Politics: tilting Republican
District 10 (fuchsia) – Bill Young (R-Indian Shores)
Counties: Pinellas
Large minorities: none
Politics: swing/leaning Republican
District 11 (yellow-green) – Kathy Castor (D-Tampa)
Counties: Hillsborough, Pinellas
Large minorities: 28% black, 24% Hispanic
Politics: strong Democratic
District 12 (sky blue) – Adam Putnam (R-Bartow)
Counties: Hardee, Hillsborough, Marion, Polk, Sumter
Large minorities: 15% Hispanic, 12% black
Politics: generally Republican
District 13 (pink) – Vern Buchanan (R-Sarasota)
Counties: DeSoto, Hardee, Manatee, Sarasota
Large minorities: 11% Hispanic
Politics: generally Republican
District 14 (olive) – Connie Mack (R-Fort Myers)
Counties: Charlotte, Collier, Lee
Large minorities: 16% Hispanic
Politics: strong Republican
District 15 (orange) – Bill Posey (R-Rockledge)
Counties: Brevard, Indian River, St. Lucie
Large minorities: 11% black
Politics: generally Republican
District 16 (green) – Tom Rooney (R-Tequesta)
Counties: Charlotte, DeSoto, Glades, Hendry, Highland, Martin, Palm Beach, Okeechobee, St. Lucie
Large minorities: 16% Hispanic
Politics: tilting Republican
District 17 (ash purple) – Kendrick Meek (D-Miami)
Counties: Broward, Miami-Dade
Large minorities: 52% black, 28% Hispanic
Politics: strong Democratic
District 18 (yellow) – Ileana Ros-Lehtinen (R-Miami)
Counties: Miami-Dade, Monroe
Large minorities: 63% Hispanic
Politics: swing/leaning Republican
District 19 (chartreux) – Robert Wexler (D-Boca Raton)
Counties: Broward, Palm Beach
Large minorities: 22% Hispanic
Politics: strong Democratic
District 20 (light pink) – Debbie Wasserman Schultz (D-Weston)
Counties: Broward, Miami-Dade
Large minorities: 31% Hispanic, 11% black
Politics: strong Democratic
District 21 (maroon) – Lincoln Diaz-Balart (R-Miami)
Counties: Miami-Dade
Large minorities: 72% Hispanic
Politics: swing/leaning Republican
District 22 (brown) – Ron Klein (D-Boca Raton)
Counties: Broward, Palm Beach
Large minorities: 15% Hispanic
Politics: tilting Democratic
District 23 (mint green) – Alcee Hastings (D-Miramar)
Counties: Broward, Palm Beach
Large minorities: 52% black, 18% Hispanic
Politics: strong Democratic
District 24 (violet) – Suzanne Kosmas (D-New Smyrna Beach)
Counties: Brevard, Flagler, Orange, Seminole, Volusia
Large minorities: 13% Hispanic
Politics: swing
District 25 (salmon) – Mario Diaz-Balart (R-Miami)
Counties: Collier, Miami-Dade, Monroe
Large minorities: 65% Hispanic
Politics: swing/leaning Republican
District 26 (charcoal) – New
Counties: Highland, Lake, Marion, Okeechobee, Osceola, Polk
Large minorities: 25% Hispanic
Politics: tilting Republican
Georgia
While it’s possible Roy Barnes or another Democrat will win the open governor’s mansion (a possibility in Florida too), I’m tentatively betting on a GOP gerrymander that finally cracks Jim Marshall’s district and makes the districts of Sanford Bishop and John Barrow majority-minority at last (Bishop’s would have an outright black majority, Barrow’s being 48% black and 46% white).
The most controversial choice I made was to kill those two birds with one stone by dividing Marshall’s Macon base, giving most of urban Macon (which is heavily black) to Bishop (thereby forcing Marshall against the more entrenched Bishop in a majority-black district based in Southwest Georgia that Bishop would be clearly favored to win) and rendering the 8th even more rural and white.
I kept all three black-majority Atlanta districts over 50%, did my best to protect GOP incumbents in the suburbs, and created a new GOP-leaning suburban seat. In short, the quintessential Republican map. The only part I may have seriously screwed up was Linder’s district…it’s getting harder and harder to keep his portion of Gwinnett County solidly in GOP hands, and the 7th is now the most diverse district in the state.
District 1 (blue) – Jack Kingston (R-Savannah)
Description: entire coastline, rural South Georgia, white areas of Savannah, Valdosta, Vidalia
VRA stats: 72% white, 21% black
Politics: strong Republican
District 2 (dark green) – Sanford Bishop (D-Albany) vs. Jim Marshall (D-Macon) [Bishop would likely win primary in mostly intact but newly black-majority district despite Marshall’s Macon base)
Description: rural Southwest Georgia, Columbus, Albany, most of Macon and Valdosta
VRA stats: 52% black, 42% white
Politics: generally Democratic
District 3 (purple) – Lynn Westmoreland (R-Grantville)
Description: Atlanta exurbs to the south
VRA stats: 68% white, 25% black
Politics: strong Republican
District 4 (red) – Hank Johnson (D-Lithonia)
Description: most of DeKalb County
VRA stats: 51% black, 32% white, 11% Hispanic
Politics: strong Democratic
District 5 (yellow) – John Lewis (D-Atlanta)
Description: heart of Atlanta, remainder of DeKalb County
VRA stats: 54% black, 34% white
Politics: strong Democratic
District 6 (aquamarine) – Tom Price (R-Roswell)
Description: north Atlanta suburbs — Cherokee County, portions of Bartow and Cobb, north Fulton
VRA stats: 78% white
Politics: strong Republican
District 7 (gray) – John Linder (R-Duluth)
Description: most of Gwinnett County, small portion of Forsyth
VRA stats: 47% white, 22% black, 18% Hispanic, 11% Asian [most diverse, and rapidly diversifying, district in the state; this could be serious trouble for the Republicans by the mid-to-late 2010s]
Politics: tilting Republican but trending Democratic
District 8 (lavender) – open/not Jim Marshall
Description: far southern outskirts of Atlanta MSA, Warner Robins, rural Middle Georgia, down to Thomasville and Quitman
VRA stats: 66% white, 27% black
Politics: fairly strong Republican
District 9 (turquoise) – Nathan Deal (R-Gainesville)
Description: Appalachian North Georgia, Dalton, Gainesville, far north exurban Atlanta
VRA stats: 80% white, 13% Hispanic
Politics: strong Republican
District 10 (fuchsia) – Paul Broun (R-Athens)
Description: Northeast Georgia, Athens, north and west Augusta
VRA stats: 77% white, 15% black
Politics: strong Republican
District 11 (yellow-green) – Phil Gingrey (R-Marietta)
Description: northwest Atlanta suburbs/exurbs, much of Cobb County
VRA stats: 67% white, 19% black
Politics: strong Republican
District 12 (sky blue) – John Barrow (D-Savannah)
Description: southeast Augusta, northwest Savannah, rural eastern Georgia [meant to concentrate black population]
VRA stats: 48% black, 46% white [not quite a majority but closer than before]
Politics: generally Democratic
District 13 (pink) – David Scott (D-Atlanta)
Description: south Fulton County, all of Clayton and Douglas, southeast Cobb
VRA stats: 52% black, 33% white, 10% Hispanic
Politics: strong Democratic
District 14 (olive) – New
Description: east Atlanta suburbs/exurbs — most of Forsyth County, remainders of Gwinnett and Hall, stretching south through Barrow, Walton, Rockdale, Newton, and Butts
VRA stats: 71% white, 18% black [I should definitely have weakened Republican strength here for Linder’s benefit…live and learn, I guess!]
Politics: strong Republican [again, split the difference between this and the 7th and you have two fairly strong GOP districts]
So there you are, computer-generated equivalents of two of my maps. I’ve also done Texas and Missouri on Dave’s app and will post those at a later date.
Florida Redistricting using the DRA
Dave’s Redistricting Application brought us this fun.
A summary of the districts
FL-1 (Incumbent Jeff Miller [R], pop. 704958, 76% white/14% African-American): This district removes the coastal tail in Okaloosa/Walton Counties and it shrinks overall (except some tracts in Jackson County). Overall, it should be Republican as usual.
FL-2 (Incumbent Allen Boyd [D], pop. 704923, 67% white/25% African-American): This district was previously 72/22 white. It adds CD4 in Madison County westward and Washington County. It loses Suwanee County and parts of Taylor and Dixie Counties. It should be fine for Boyd and likeminded Moderate Dems.
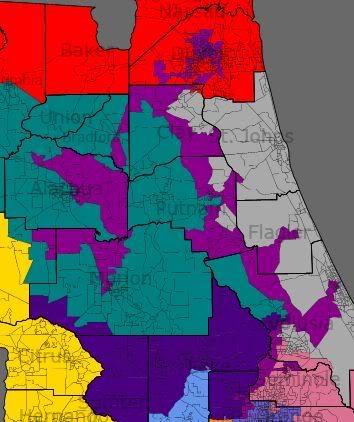
FL-3 (Incumbent Corrine Brown [D] pop 704874, 45% African-American/43% White): This district resembles the 1992 version of this district, which is probably not ideal since the 1992 version of this district got struck down by the Supreme Court. The district starts in Ocala, moves north, takes in part of Williston, includes parts of Gainesville, includes a slice of Starke, then it moves north to include parts of Jacksonville, it goes back south through Clay County, then it goes to Palatka, then includes part of Palm Coast, it goes farther south, takes in part of Daytona Beach, DeLand, Sanford, and ends with part in Apopka, and some tracts near Orlando. Overall, I’m not satisfied with the final product in regards to VRA. But the 2000 district was 49/38 African-American.
FL-4 (Incumbent Ander Crenshaw [R], pop. 704958, 75% White/14% African-American): This district is actually not as white as the 2000 district, despite losing random appendages and taking in more of Jacksonville.
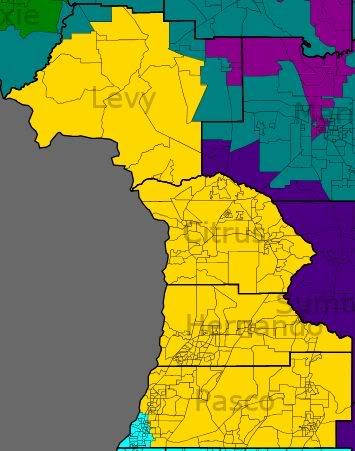
FL-5 (Incumbent Ginny Brown-Waite [R], pop. 704953, 83% White/5% African-American): This district gains coastal parts of Pasco County. It loses Sumter County and anything east of Citrus/Hernando/Pasco.
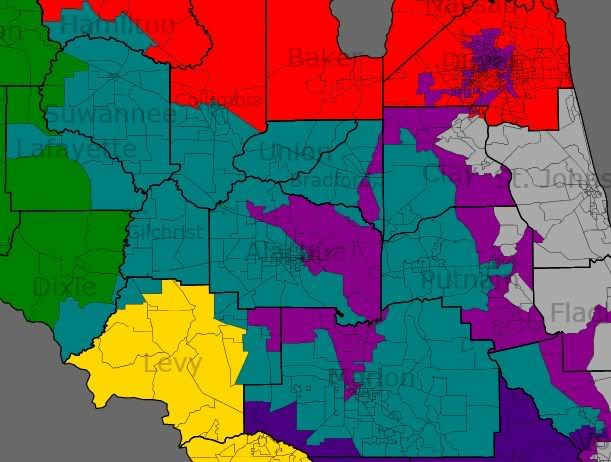
FL-6 (Incumbent Cliff Stearns [R], pop. 704932, 78% White/9% African-American): This district changes shape quite a bit and wraps around the 3rd.
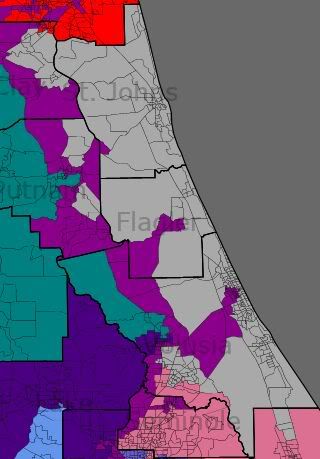
FL-7 (Incumbent Suzanne Kosmas [D], pop. 704882, 82% White, 6% African-American): Kosmas current district [the 24th] is also whiter than this district. Since putting Mica’s house in the 7th wasn’t as practical as putting Kosmas’ house in the 7th, this arrangement was decided upon.
FL-8 (Incumbent Alan Grayson [D], pop. 704986, 48% White, 26% Hispanic, 20% African-American): Not only is this a total gift of a district for Grayson, it’s also not a horrendous gerrymander. The district unites Orlando in one district.
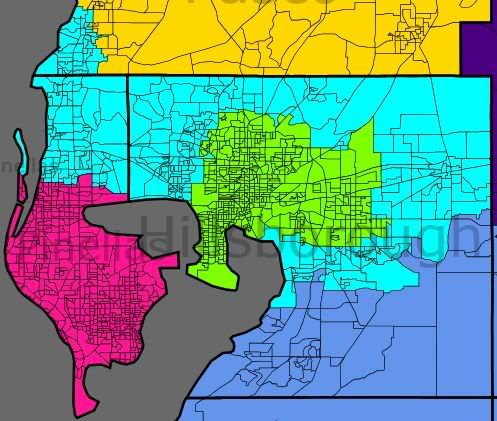
FL-9 (Incumbent Gus Bilirakis [R], pop. 704968, 75% White, 15% Hispanic, 5% African-American): Gus gives up parts of the coast on Pasco, and his district wraps around FL-11 now. And the White percentage drops here while the Hispanic percentage surges upwards.
FL-10 (Incumbent Bill Young [R], pop. 705002, 76% White, 12% African-American, 8% Hispanic): Here, the White percentage also drops, and we get a logical looking district including St. Petersburg.
FL-11 (Incumbent Kathy Castor [D], pop. 704964, 50% White, 23% Hispanic, 21% African-American): Despite making this district look logical, the demographics don’t particularly change.
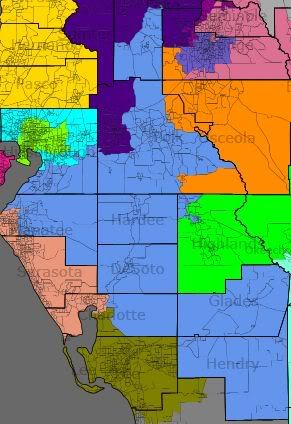
FL-12 (No known incumbent, pop. 704768, 66% White, 20% Hispanic, 11% African-American): This district basically meandered since it was one of the last ones I did and it took in a lot of extras from everybody else. Depending on who wins the FL-12 election, this district may or may not have an incumbent.
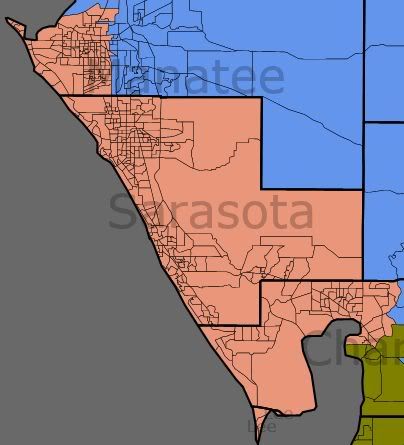
FL-13 (Incumbent Vern Buchanan [R], pop. 704933, 82% White, 9% Hispanic, 6% African-American): The district shrinks, and actually includes African-American majority areas in Bradenton.
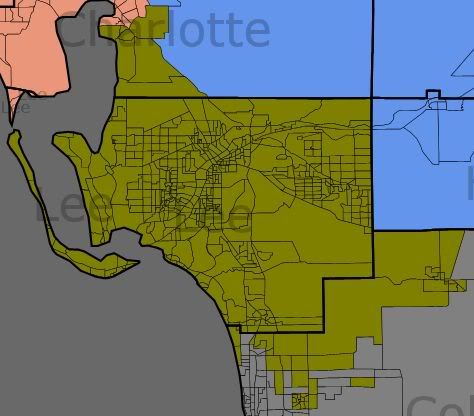
FL-14 (Incumbent Connie Mack [R], pop. 704899, 70% White, 21% Hispanic, 7% African-American): Adios Naples, Hola parts of Punta Gorda. Also, Hola giant surge in Hispanic percentage.
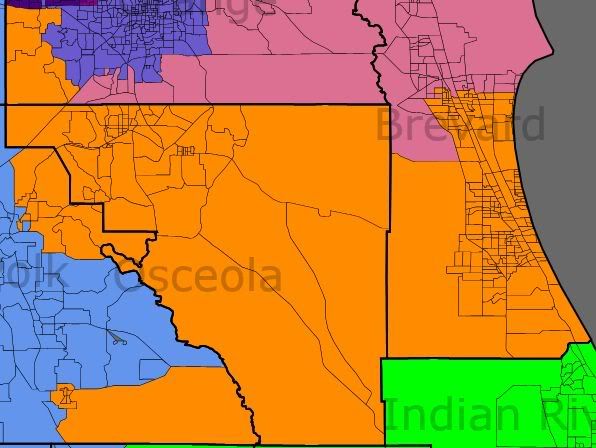
FL-15 (Incumbent Bill Posey [R], pop. 704991, 64% White, 23% Hispanic, 10% African-American): Well, hey… the minority population almost doubles. Posey loses Cape and gains Bay Lake/LBV.
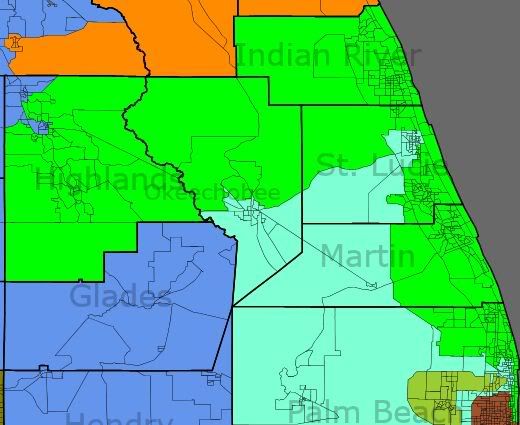
FL-16 (Incumbent Tom Rooney [R], pop. 704935, 80% White, 11% Hispanic, 6% African-American): This district is one of the few to not have a higher minority population. It also looks a bit more normal now. It loses anything south/southwest of Highlands County, it gains Jupiter going down the beach.
And let’s go out of sequence for a one moment.
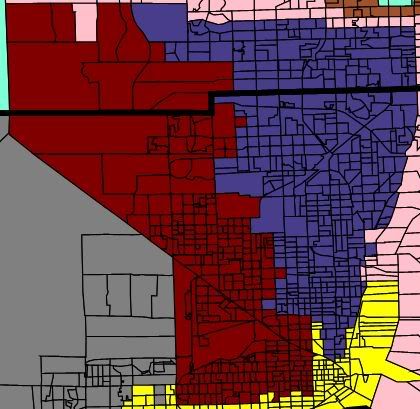
FL-21 is in red, FL-17 is in blue
FL-17 (Incumbent [fill in blank] Meek [D], pop. 704893, 52% African-American, 27% Hispanic, 17% White): The Hispanic population goes up, the African-American population goes down, and the representative is named Meek.
FL-21 (Incumbent Lincoln Diaz-Balart [R], pop. 704902, 82% Hispanic, 12% White, 5% African-American): Lawsuit bait, as serious packing is being undertaken here (from 69% to 82% Hispanic). If you don’t know your Miami-Dade, this district is now more compact around Hialeah.
And now back to sequence.
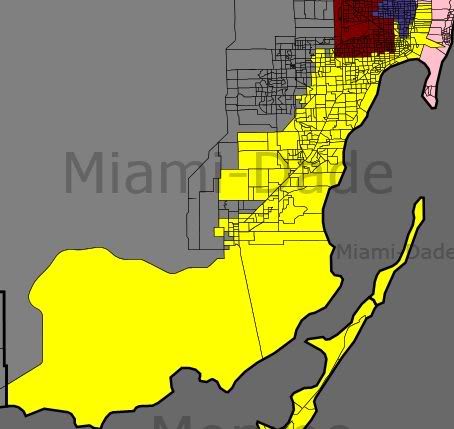
not pictured: Key West
FL-18 (Incumbent Ilena Ros-Lehtinen [R], pop. 704887, 55% Hispanic, 30% White, 13% African-American): Also a bit of lawsuit bait, as the Hispanic percentage goes down by 7 points.
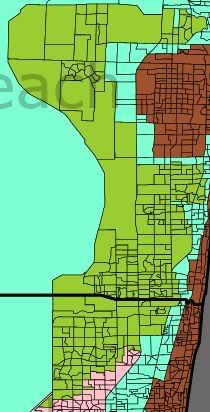
FL-19 (Incumbent Robert Wexler [D], pop. 705015, 72% White, 16% Hispanic, 8% African-American): This district is being smoothed out a bit due to other changes around, and it keeps the same basic shape.
FL-20 (Incumbent Debbie Wasserman Schultz [D], pop. 704927, 53% White, 33% Hispanic, 10% African-American pop. 704872, 50% White, 32% Hispanic, 14% African-American): I probably drew this wrong (and it is a lot more Hispanic than the current district). It moves from Miami Beach up to Weston and Davie.
FL-22 (Incumbent Ron Klein [D], pop. 704918, 58% White, 24% Hispanic, 14% African-American, pop. 704996, 60% White, 24% Hispanic, 12% African-American): The district looks normal, the Hispanic percentage doubles, the African-American percentage triples.
FL-23 (Incumbent Alcee Hastings [D], pop. 704982, 49% African-American, 32% White, 16% Hispanic pop. 704959, 47% African-American, 33% White, 17% Hispanic): Travelogue time. The district starts in Hollywood, goes north to Fort Lauderdale, Deerfield Beach, Delray Beach, Boynton Beach, then west, then north, then east, then there’s West Palm Beach, then a bunch of underpopulated large tracts are included, along with Fort Pierce and Okeechobee.
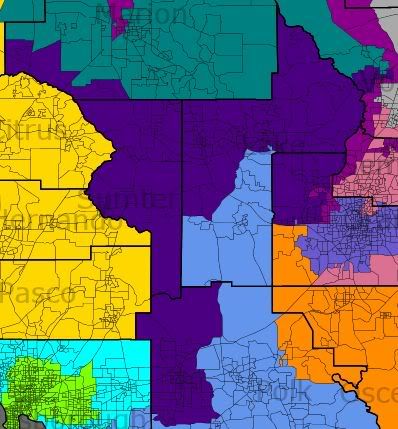
FL-24 (No Incumbent, maybe, Pop. 704976, 74% White, 12% Hispanic, 11% African-American): This was the northern part of the unallocated lands covered by FL-12. If Dennis Ross is the next Rep in FL-12, then this would be his district.
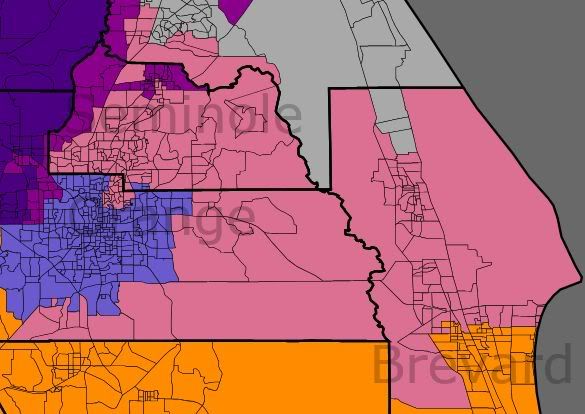
FL-25 (Incumbent John Mica [R], Pop. 704957, 70% White, 17% Hispanic, 8% African-American): This district is a lot more Hispanic than Mica’s current district, and I think it includes a lot of the current FL-24.
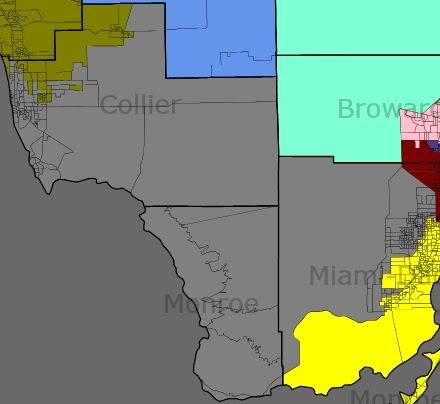
FL-26 (Incumbent Mario Diaz-Balart [R], Pop. 704957, 60% Hispanic, 35% White): The only huge difference is that the African-American population dropped from 10% to 3% as unincorporated Miami-Dade (West Perrine) was put in FL-18. The district gains Naples, drops Homestead, gains some areas that were in FL-21.
In this first attempt of a map, several things occur.
1) Alan Grayson’s electoral hopes are probably improved and he won’t run up as much mileage going from event to event.
2) FL-3 is the target of several lawsuits.
3) FL-21 is the target of several lawsuits.
4) FL-22 is made bluer, FL-10 is made bluer, and FL-6 is confused.
So. Any thoughts at this first attempt at a map?
Georgia on my Mind (redistricting)
The following is a bit of a thought experiment. Imagine a Democratic Gerrymander of Georgia that could more or less ignore the VRA, or at least go with the standard of “majority minority” rather than striving for 50%+ Black. I used Dave’s Redistricting App, with the new population estimates, creating 14 districts. I was not as aggressive as fitchfan28 and focused my efforts on the Atlanta area leaving South Georgia largely unchanged.
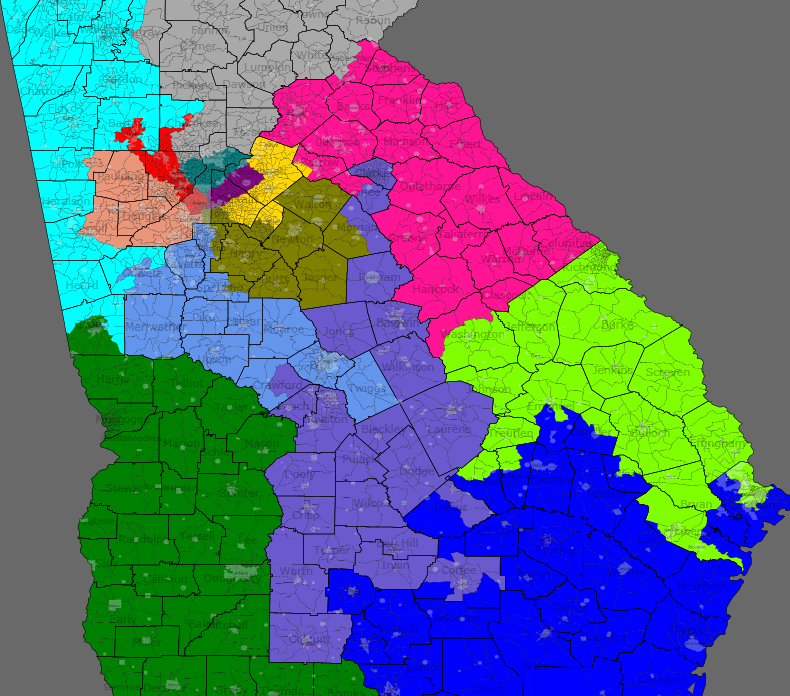
District 1 (Dark Blue):
Not much different from before. Jack “Pelosi is destroying families by making us work Mondays” Kingston will have no trouble here.
District 2 (Dark Green):
Also not much change. Sanford Bishop’s district continues to be racially mixed, with a narrow White majority. Perfect for a Black Blue Dog.
District 3 (Salmon):
First of several of the majority minority districts. Southern parts of Fulton County balance out some more conservative suburbs. Contains some of the Black suburbs as well.
District 4 (Red):
Heart of Atlanta and much of Cobb county. At little more White than some of the others, but still not a majority.
District 5 (Purple):
The most diverse of all the districts. Large populations of Whites, Blacks, Hispanics and Asians.
District 6 (Aquamarine):
This district is about 2/3rds White. It might be more Liberal, being located largely in Fulton and Dekalb counties, it might not be. I didn’t have political data. (Anyone familiar with Georgia care to comment?)
District 7 (Gold):
A fairly equal mix of Whites from and Blacks. Some other minorities, but not as many as the 5th.
District 8 (Light Purple):
I took away Macon, but made it up with Athens. Only after I drew the lines did I realize that Jim Marshall lives in Macon and may choose to run in the new 13th. The district is just over 60% White, so there’s enough minorities and Liberals (in Clark County) the Dems might do okay.
District 9 (Cyan):
Very Conservative and White.
District 10 (Pink):
See district 9.
District 11 (Grey):
Conservative Atlanta Exurbs and North Georgia district. Would be a good landing spot for Tom Pierce, if the 6th is too urbanized now.
District 12 (Light Green):
Not too different from the old 12th, though a little bit blacker. (Now Majority Minority)
District 13 (Periwinkle):
Whites are just under to a majority in this rural and exurban district.
District 14 (Mustard):
Another majority minority district with whites and blacks in close numbers.
Overall, 6 minority districts, which should all go to the Dems, plus Bishop’s Second, which is an easy hold. The new 8th will be a bit of a struggle but doable and potential pickup in the 6th, depending on how the numbers run. So a total of 7 – 9 districts out of 14, without any aggressive Gerrymandering.


