SSP Daily Digest: 11/15

AK-Sen: As it gets more and more apparent that victory isn’t going to come on the write-in-challenges front, the Joe Miller camp seems to be admitting as much. However, they aren’t preparing to concede, as they see one last ace in the hole: absentee ballots, which are still trickling in. The last to arrive (ahead of Wednesday’s deadline) will be the military overseas ballots, which Miller expects will break heavily in his favor (seeing as how many military members nearing the end of their commitment are probably looking forward to a profitable career on Miller’s paramilitary goon squad). With Lisa Murkowski’s lead holding at 40-35, though, it’s unclear whether military ballots would show up in sufficient numbers to turn the tide even if they broke widely for Miller.

DE-Sen, WV-Sen: Congratulations today to Chris Coons and Joe Manchin, both of whom are being sworn into the Senate this afternoon for the lame-duck session. It’s also the first day on the job for Earl Ray Tomblin, who becomes the new West Virginia Governor in Manchin’s absence. If you’re wondering about Mark Kirk, he’ll be sworn in next week thanks to vagaries of Illinois law. (If I may be allowed a brief moment of alma mater pride, Coons appears to be the first Amherst alum elected to the Senate since the ill-fated Thomas Eagleton.)

MA-Sen: You may remember a boomlet that peaked last week for Senate speculation concerning Setti Warren, the “rock star” mayor of Newton. Well, that’s over, as he’s now saying his “intent” is to finish his term, which runs through 2013. However, a different young up-and-coming mayor of one of the Bay State’s larger cities is now poking the Senate race with a stick: Will Flanagan, the 30-year-old mayor of the much more blue-collar Fall River, is gauging the race.

TX-Sen: The Fix has a look at possible primary challengers to Kay Bailey Hutchison, who, with her bungled gubernatorial run and her TARP vote, seems to have painted a big target on her back aimed at Texas tea partiers looking for a promotion. Former SoS Roger Williams and former Railroad Commissioner Elizabeth Ames Jones are already in the race (dating back to when it was expected that KBH would be on her way to the Governor’s Mansion at this point), but the bigger names to watch are Lt. Gov. David Dewhurst and Railroad Commissioner Michael Williams. Dewhurst is establishment but has the personal wealth to get a foothold here, while Williams has no money but is the favorite of the tea party set. Dallas mayor Tom Leppert is also mentioned as a wild-card. One Dem who won’t be making the race is former Houston mayor Bill White, who in wake of his gubernatorial loss says he won’t pivot to a Senate race. That probably frees up the Dem Senate slot for former comptroller John Sharp, who was going to run in the hypothetical special election that never happened and already has a big stack of cash saved up for the race.

CT-Gov: If you’re hearing zombie lies from Republican friends about the Connecticut gubernatorial race being stolen by the urban machines, here’s a handy debunking point: exit polls show that the huge falloff in votes in Bridgeport neatly tracks the statewide falloff in Dem crossover votes for the Republican candidate in general from 2006 (when the broadly-popular Jodi Rell ran) to 2010.

KY-Gov: One more Republican to keep in mind as a potential challenger in next year’s off-year gubernatorial election: Jefferson County Clerk Bobbie Holsclaw. That’s kind of a big step up to Governor, so it seems like she might be starting with a high negotiating position with the party to try to worm her way into the SoS slot instead (assuming Trey Grayson follows through on plans to run for AG instead).

NC-02, TX-27: Here are updates on two of our outstanding races: recounts have been officially approved in both of ’em. Six counties in the 27th will be recounted, per Solomon Ortiz’s request, as he trails by about 800. In the 2nd, the canvass was officially certified with Bobby Etheridge trailing by 1,489, but he’ll be pursuing a recount as allowed under state law. While neither of these prospects looks that hopeful, we can take some solace in that the likely victors, Blake Farenthold and Renee Elmers, are some of the most amateur-hour entrants into the new House and hopefully likely to help define the new face of the Republican Party.

NY-29: Best wishes for a quick recovery to soon-to-be-sworn-in Tom Reed, who literally just arrived in Washington and was immediately sickened by it. He was diagnosed with a blood clot in his lungs and says he’ll be released in one or two days, ready to get to work.

WA-01, WA-03: I’d hoped that Brian Baird was going to take his unique variety of douchiness to the private sector for good, but it looks like his strange retirement decision may have been an inspired case of district-shopping instead. He’s moving to Edmonds in Seattle’s northern suburbs, which just happens to be in the 1st District. Assuming that Jay Inslee follows through on his widely-known plans to run for Governor, lo and behold, the 1st will be an open seat in 2012. The 1st (which is a pretty safe district in its current configuration, and will probably keep similar lines in redistricting) has to be more appealing than the 3rd, which redistricting will probably move from a true swing district to a light-red one, as liberal Olympia will probably have to be exchanged for a Columbia Gorge-centered district that’s based in Vancouver but that runs east into conservative Yakima County. (Which, unfortunately, would be tailor-made for Jaime Herrera, who’s Latina but living in the Vancouver burbs, and will make her much harder to dislodge.) For more detail on Washington’s likely 10-district map, see here.

NY-St. Sen.: Here’s an update on the three races that are holding New York State Senate control in the balance. Dem incumbent Craig Johnson trails by only 427, and seems to be gaining at a rapid clip as absentee votes get counted, so the trajectory indicates he might pull ahead by the end. Things seem more locked in with two more Dem incumbents, though: Suzi Oppenheimer leads by 504, while Antoine Thompson trails by 597. Wins by Johnson and Oppenheimer would set up a 31-31 tie.

Chicago mayor: The election’s been over for two weeks, and it’s already time for the first new edition of SSP TV: Rahm Emanuel kicked off his mayoral bid with his first TV spot already. Rep. Danny Davis also made it official this weekend, launching his bid and dubbing himself the “grassroots” candidate. (He looks like he’ll be giving up his House seat only in the event that he wins the mayoral race.)

DSCC: After some hopeful signs that Michael Bennet might be willing to take on the role of DSCC head, he said “no thanks” late Friday. At this point, Beltway pundits seem to think that the shortest straw has Patty Murray’s name on it.

RGA: Texas Gov. Rick Perry signed on for another cycle at the helm of the Republican Governor’s Association. I’ve seen speculation that he’s doing it mostly to shut down rumors that he’s really running for President, although it should be a pretty sleepy gubernatorial cycle and he might be able to juggle both tasks (since most big states elect governors during the midterms, and only a few open seats loom… Indiana, North Carolina, and Washington may be the highest-profile races).

Redistricting: The Wall Street Journal has a good overview of what to expect with redistricting, and they seem to come to the same conclusion that I have: that the downside for the GOP of their strong performance in Dem-held red districts is that it means there are a lot fewer opportunities to turf anyone out through aggressive gerrymandering, and instead their efforts are going to have to more defensive, oriented toward shoring up the deadwood that washed ashore. Meaning, of course, that predictions of another large redistricting-driven gain in the House for the GOP aren’t likely to come to pass, although it will still make it harder for the Dems to regain significant ground.

A couple articles are also out today dealing with the biggest redistricting prize of all, California, although whether it’s a prize or not has much to do with what happens with the newly-created (by Prop 20) congressional redistricting commission; this week, out of the pool of 36,000 applicants, 36 finalists for the commission’s citizen slots will be picked. Of particular interest is what exactly happens with the seats in northern Los Angeles’s San Fernando Valley, where there’s a push underway to get a Hispanic district. (Worth noting: CA-28 already has a Hispanic majority, although Howard Berman seems pretty primary-proof there, and there don’t seem to be enough parts and pieces elsewhere in the Valley to create another neatly-shaped one.)

Demographics: Here’s a big surprise, on the demographic front: there are reports that there are 100,000 fewer Hispanics in Arizona than there were when SB 1070 passed. That may not have a big impact on voting behavior (since those emigrants are probably unlikely voters), but a big impact on redistricting, where the possibility of a third VRA district in Arizona looms. Or maybe not… since the census only cares where you were on April 1, much of that fleeing may not have happened yet at that point.

Dave’s App: Exciting news from over in the diaries: version 2.0 of Dave’s Redistricting App is available. You can check out all the details at the link, but two major improvements including use of street maps (making urban work much easier) and ability to save JPGs. Redistricting is going to be one of Swing State Project’s main preoccupations over the next year, and Dave’s App is one of the best tools we have in our arsenal.

CA-AG: Things Looking EVEN Better for Kamala Harris

Update: You can check out our spreadsheets, too. We’re about 138,000 votes ahead of the SoS.


I was pessimistic last time about Kamala Harris’ chances, but daman09’s excellent analysis inspired me to do another county-by-county canvass of results with new projections. And as the title would give it away, things are looking MUCH better for Kamala.

Going county-by-county for the most recent updates, Harris now leads by 4,565 votes, 4,141,477 to Cooley’s 4,137,212.

While the SoS estimates 898,458 votes left to process, I estimate about 636,669, using the most recent estimates from individual counties when available and adjustments to the UBR counts where appropriate.

In the counties left standing, I’m conservatively estimating Harris’ weighted performance to be 46.08% to Cooley’s 45.14%, which should be good for another 5,993 votes.

Perhaps most significantly, Harris is performing better in the Abs/Prov/VBMs that have been added. Based on her performance as of our November 8th county-by-county canvass and and the origin of the 1,042,711 tabulated since then, we would have expected Kamala to outperform Cooley by 0.84%, for a margin of 8,707. But instead, she’s actually outperformed Cooley by 2.28%, improving her margin by 23,754.

Her swings in counties are as follows:


County Swing County Swing
San Benito 1.98% Tulare -1.38%
Nevada 1.42% Sutter -1.34%
Orange 1.30% El Dorado -0.89%
Monterey 0.93% Tehama -0.64%
Alameda 0.75% Amador -0.58%
Contra Costa 0.71% Santa Cruz -0.43%
Sacramento 0.70% Yuba -0.35%
Inyo 0.64% Los Angeles -0.33%
San Mateo 0.55% Solano -0.29%
Merced 0.45% Siskiyou -0.16%
San Luis Obispo 0.39% Yolo -0.15%
San Francisco 0.38% San Joaquin -0.15%
Kings 0.28% Fresno -0.08%
Santa Barbara 0.28% San Diego -0.04%
San Bernardino 0.24% Kern -0.03%
Marin 0.18% Sierra -0.00%
Imperial 0.14%
Ventura 0.12%
Riverside 0.10%
Shasta 0.10%
Santa Clara 0.03%

My estimation of the number of unprocessed ballots differs from the UBR for the following counties:

  • Butte: +222, per the county update.

  • Contra Costa: -9,411 to adjust for votes added since November 12.

  • Imperial: -5,557 to adjust for votes added since November 6.

  • Los Angeles: -55,762 to adjust for votes added November 12.

  • Marin: -19,108 to adjust for votes added since November 8.

  • Monterey: -27,126 to adjust for votes added since November 8.

  • Orange: -43,227, per the county update.

  • Placer: +27,956 to restore the estimates to those on November 6. Placer County has not updated its results since November 3.

  • Riverside: -900, per the county update.

  • San Bernardino: -7,000 per the county update.

  • San Diego: -11,470 per the county update.

  • San Francisco: -10,037 to adjust for votes added since November 8.

  • San Joaquin: -32,279 to adjust for votes added since November 8.

  • San Mateo: -26,812; San Mateo has actually added 34,601 votes since November 8; I’ve now assumed 0.

  • Santa Clara: -9,686 to adjust for votes added since November 10.

  • Santa Cruz: -20,592 to adjust for votes added since November 8.

  • Yolo: -9,791 per the County; the County now lists no unprocessed ballots.

  • Yuba: -1,209 per the County’s labeling of its latest update as “Final.”

Movers and shakers below:


County Total Harris Cooley Unproc Harris Cooley Margin
Los Angeles 2,077,252 1,104,134 822,859 152,751 81,193 60,509 20,684
Alameda 413,545 275,663 106,564 24,500 16,331 6,313 10,018
Sonoma 138,383 79,052 45,321 35,500 20,280 11,626 8,653
San Francisco 245,397 174,177 50,398 11,339 8,048 2,329 5,719
Contra Costa 310,433 165,752 122,421 29,002 15,485 11,437 4,048
Mendocino 19,097 10,321 6,159 12,358 6,679 3,986 2,693
Santa Cruz 87,349 54,033 24,218 7,313 4,524 2,028 2,496
Marin 102,499 63,668 31,727 7,942 4,933 2,458 2,475
Humboldt 35,966 18,011 13,436 13,387 6,704 5,001 1,703
Napa 28,480 14,229 11,711 17,877 8,932 7,351 1,581
Santa Clara 467,447 256,069 170,877 8,414 4,609 3,076 1,533
Solano 109,963 55,825 45,385 5,498 2,791 2,269 522
Monterey 87,434 47,784 32,266 2,344 1,281 865 416
Imperial 23,812 11,583 9,985 3,629 1,765 1,522 244
Lake 14,980 6,585 6,430 5,372 2,361 2,306 56
San Benito 15,164 7,007 6,759 433 200 193 7


County Total Harris Cooley Unproc Harris Cooley Margin
Placer 107,703 31,998 66,112 28,056 8,335 17,222 -8,886
San Diego 806,573 309,842 421,749 60,500 23,241 31,635 -8,394
Riverside 447,756 163,335 248,095 28,800 10,506 15,958 -5,452
San Bernardino 393,156 145,444 207,987 29,000 10,728 15,342 -4,613
Fresno 166,017 59,237 95,001 17,500 6,244 10,014 -3,770
Kern 159,058 42,875 100,947 10,202 2,750 6,475 -3,725
Orange 838,124 260,554 504,483 11,089 3,447 6,675 -3,227
Butte 56,937 20,635 29,626 18,229 6,607 9,485 -2,879
Tulare 76,763 22,316 48,368 6,700 1,948 4,222 -2,274
Ventura 241,363 93,845 129,520 12,556 4,882 6,738 -1,856
Madera 27,635 8,130 16,872 5,806 1,708 3,545 -1,837
Calaveras 14,501 4,168 8,236 4,918 1,414 2,793 -1,380
El Dorado 72,133 21,081 43,705 3,900 1,140 2,363 -1,223
Shasta 59,536 15,995 37,152 3,400 913 2,122 -1,208
Stanislaus 110,462 41,587 59,205 6,980 2,628 3,741 -1,113
Tehama 17,117 4,594 10,321 2,999 805 1,808 -1,003
Sutter 22,671 6,642 13,871 2,384 698 1,459 -760
Nevada 37,088 14,129 19,126 4,730 1,802 2,439 -637
San Joaquin 146,197 59,904 70,919 7,436 3,047 3,607 -560
Sacramento 378,523 169,118 178,844 21,621 9,660 10,215 -556
Amador 15,640 4,334 9,238 1,741 482 1,028 -546
Santa Barbara 119,282 51,662 57,104 6,536 2,831 3,129 -298
San Luis Obispo 99,236 37,257 51,944 1,728 649 905 -256
Del Norte 6,876 2,520 3,562 1,008 369 522 -153
Tuolumne 21,104 6,629 11,962 524 165 297 -132
Mariposa 7,010 2,096 4,051 267 80 154 -74
Merced 46,263 18,698 23,540 400 162 204 -42

Two Republican Congressional Seats in New York City.

Played around with the new redistricting app and played the usual games we play in New York.  How to make NY-1 more Democratic, take out King, and protect all the incumbents at the same time.

But being from Staten Island I tried ways to redo NY-13.  And quickly saw how important the undecided New York State Senate races are.

First and foremost is how NY-13 is almost middle ground as far as it’s Brooklyn portion.  Push it along the north and it becomes a lot more Democratic.  Push it south or east and it becomes even safer Republican.  A very possible scenario if the legislature is forced to do a “protect all incumbents who are not drawn out” map.

Staten Island is hard to redistrict out due to the south shore with it’s high voter turnout and very Republican vote. Despite being heavily unionized.  Despite a Democratic registration advantage.  One area with an outrageously high number of government employees is among the most conservative.

But what makes it very difficult is Brooklyn.  Because you have a lot of Republlican pockets in the south.  Put the South Shore there and you may well have created a district even MORE Republican than one that includes the Democratic North Shore of Staten Island.

To illustrate this problem I created a map with two Republican districts using Staten Island and Brooklyn.  I actually made one a bit more compact but decided to see how many Republicans pockets I could fit.  So went hog wild and went all the way out to Queens.

To answer probably your first question.  No you don’t have to use Verrazzano Bridge.  When Frank Murphy held the seat the district went up into Manhattan instead of Brooklyn.  

First is Michael Grimm’s new district which includes his home in Rosebank.

He loses the most Democratic portion of the district.  Which will be flung off either to Brooklyn or Manhattan.  Probably Brooklyn (Yvette Clark) as part of a majority minority district.

Mid Island are spun off to our new district.

Grimm’s district now sports a 54 – 46 McCain-Obama vote as opposed to the old NY-13 which only had a 52-48 McCain/Obama split.  And stays 71% white.

Notable additions to the district is the ultra-Orthodox high voting and very conservative neighborhood of Borough Park.

The fun part was the creation of a new district that took in the more conservative parts of Queens of Southern Brooklyn and Queens as well as going slightly into Nassau  The district is 52-48 McCain/Obama and also 71% white.

The first part as you can see on the first map is the Mid-Island.  You could describe these voters as Reagan Republicans.  They voted for Gore, they voted for Bush, and they voted heavilly for McCain. Even more heavily than the South Shore.  Yet they are also the swing voters.   Michael McMahon won narrowly mid-island.   So arguably I should’ve put the South Shore here instead of Mid-Island here.  But first priority is to protect “our” Republican incumbent Grimm.

The Brooklyn/Queens portion will have Coney Island, Sheepheads Bay, and the Rockaways.  It also has the ultra-orhodox neighborhoods around Avenue M that I can never remember the name of.  A lot of Russians as well as other white ethnics.

And just for the hell of it connected it to the “Five Towns” partly in Nassau.  Probably lost more Republican votes than I gained getting there.  But a population made up of either the ultra wealthy or ultra-religious orthodox jews?  That can anchor any Republican.

And the point of this excercise?  To illustrate how important the Brooklyn portion of NY-13 is and why we’re going to need a friendly redistricting to regain this district.  Not sure if this anecdote is true but I’ve heard it quite often and it sounds about right.  Staten Island has only gone Democratic on the Presidential twice since the civil war.  Once under Johnson in 1964 and once under Roosevelt in 1936.  Now McMahon did win in Brooklyn (though not as well as his campaign had hoped).  He even won mid-island.  He of course won the North Shore.  And he even narrowly won mid-island which usually would seal the deal.  but the South Shore completely overwelmed him and gave Grimm the victory.  You need a strong Brooklyn component.

Right now NY-13 will be tough but it could be won back.  If the Brooklyn portion of the district turned north (or went back to a Manhattan configuration) it becomes a lot more winnable.  But if the district is allowed to go east into Brooklyn.  Game over.

How bad could it look?  Well including Borough Park you could get a McCaim-Obama vote of 56/43.  By way of reference Obama won 44% of the vote in South Carolina.

Wonder how much Weiner would complain about losing one ED I found that went 91% for McCain?

Take out the north shore of Staten Island and you can even do worse.  McCain-Obama 69/39.  Obama got 41% of the vote in Kansas and 38.7% of the vote in Alabama.

The last one is highly unlikely.  You’d just anger voters here splitting Staten Island up.  However I wouldn’t doubt the possibility of something like the other map happening.

Big Apple Compromise: 22-5 Redistricting

Photobucket

What a difference one state senator makes. If the GOP takes the State Senate-a 32-30 majority-there will have to be a compromise plan, just like the one created in 2000. With the delegation likely going to be 21-8, the GOP will look to shoring up their reps. The Dem goal will be to take out all the Republicans. However, Dems, could only realistically keep it 27-2. (Unless they go with abgin’s famous, excellent plan.)

So I split the difference. I know some speculated that they’ll trade one Dem for one Republican, but I think this deal could realistically happen. With New York likely losing two seats, I eliminated three Republican seats.  The new delegation, in my opinion, will likely be 22-5. Let’s get down to the nitty gritty:

District 1 – BLUE

Incumbent: Randy Altschuler (R-St. James)

Obama: 49%

McCain: 50%

Old District: Obama 51% McCain 48%; Kerry 49% Bush 49%

White: White: 88% Black: 2% Native: 0% Asian: 2% Hispanic: 6% Other: 1%

Notes: Part of the compromise is that Altschuler gets two points safer. Though still a swingy district, Republicans are favored here at the federal level.

District 2 – DARK GREEN

Incumbent: Steve Israel (D-Huntington)

Obama: 60%

McCain: 40%

Old District: 56% McCain 43%; Kerry 53% Bush 45%

White: 67% Black: 12% Native: 0% Asian: 4% Hispanic: 15% Other: 2%

Notes: Israel is already safe, but now this district is safe in any wave, for any Democratic candidate.

District 3 – PURPLE

Incumbent: Peter King (R-Seaford)

Obama: 45%

McCain: 54%

Old District: Obama 47% McCain 52%; Kerry 47% Bush 52%

White: 87% Black: 2% Native: 0% Asian: 4% Hispanic: 6% Other: 1%

Notes: A Republican Long Island sinkhole, the district is now safe for any King successor. If Dems get the Senate and want to be ambitious, they can destroy the district and gerrymander every Republican out in Long Island.

District 4 – RED

Incumbent: Carolyn McCarthy (D-Mineola)

Obama: 66%

McCain: 33%

Old District: Obama 58% McCain 41%; Kerry 55% Bush 41%

White: 48% Black: 19% Native: 0% Asian: 11% Hispanic: 16% Other: 6%

Notes: This is one of four suburban-New York City districts, as opposed to only two now. McCarthy is safe forever now. The district is now minority-majority but has a plurality of whites.

District 5 – YELLOW

Incumbent: Gary Ackerman (D-Roslyn Heights)

Obama: 63%

McCain: 36%

Old District: Obama 63% McCain 36%; Obama 63% McCain 36%

White: 43% Black: 5% Native: 0% Asian: 23% Hispanic: 27% Other: 2%

Notes:

District 6 – DARK GREENISH BLUE

Incumbent: Gregory Meeks (D-Queens)

Obama: 87%

McCain: 12%

Old District: Obama 89% McCain 11%; Kerry 84% Bush 15%

White: 17% Black: 51% Native: 0% Asian: 6% Hispanic: 19% Other: 6%

Notes: To make up for the loss of two districts, Meek has to expand to Brooklyn to get more black precincts.

District 7 – GRAY

Incumbent: Charlie Rangel (D-Manhattan)

Obama: 93%

McCain: 7%

Old District: Obama 93% McCain 6%; Kerry 90% Bush 9%

White: 20% Black: 28% Native: 0% Asian: 3% Hispanic: 46% Other: 2%

Notes: Now entirely in Manhattan

District 8 – DARK PURPLE

Incumbent: Ed Towns (D-Brooklyn)

Obama: 86%

McCain: 14%

Old District: Obama 91% McCain 9%; Kerry 86% Bush 13%

White: 59% Black: 7% Native: 0% Asian: 17% Hispanic: 14% Other: 3%

Notes:

District 9 – LIGHT TURQUOISE

Incumbent: Anthony Weiner (D)

Area: Part of Kings County (Brooklyn)/Part of Queens County (Queens)

Population: 699,891

Obama: 61%

McCain: 38%

Old District: Obama 55% McCain 44%; Kerry 56% Bush 44%

White: 50% Black: 6% Native: 0% Asian: 16% Hispanic: 22% Other: 5%

Notes: I had to shore up this district, even though Weiner would be fine otherwise. It’s just that Weiner will probably run for another office some day (especially mayor), so I wanted to make sure that a moderate (probably Jewish) Republican couldn’t win here. It’s pretty gerrymandered to be a slightly majority white district. Anyway, his base is here and Weiner should win by a large margin.

District 10 – DARK PINK

Incumbent: Edolphus Towns (D)

Area: Part of Kings County (Brooklyn)

Population: 699,919

Obama: 85%

McCain: 15%

Old District: Obama 91% McCain 9%; Kerry 86% Bush 13%

White: 22% Black: 52% Native: 0% Asian: 5% Hispanic: 18% Other: 23%

Notes: Pretty much the same Brooklyn-based VRA-protected district, but it takes in icky some icky Brooklyn precincts to help Weiner.

District 11 – GREEN

Incumbent: Yvette Clarke (D)

Area: Part of Kings County (Brooklyn)

Population: 700,196

Obama: 84%

McCain: 16%

Old District: Obama 90% McCain 9%; Kerry 86% Bush 13%

White: 25% Black: 54% Native: 0% Asian: 7% Hispanic: 11% Other: 4%

Notes: Same deal as District 10.

District 12 – MEDIUM BLUE

Incumbent: Nydia Velazquez (D)

Area: Part of Kings County (Brooklyn)/Part of Queens County (Queens)

Population: 700,735

Obama: 86%

McCain: 13%

Old District: Obama 86% McCain 13%; Kerry 80% Bush 19%

White: 23% Black: 11% Native: 0% Asian: 11% Hispanic: 51% Other: 3%

Notes: A VRA-protected Hispanic district, Velazquez sheds Manhattan and takes in the Hispanic parts of Brooklyn and Queens. The district gets a somewhat big makeover to make it Hispanic-majority, but I’m sure there will be no complaints for anyone.

District 13 – TEAL

Incumbent: Michael McMahon (D)

Area: All of Richmond County (Staten Island)/Part of New York County (Manhattan)

Population: 700,676

Obama: 62%

McCain: 37%

Old District: Obama 49% McCain 51%; Kerry 45% Bush 55%

White: White: 71% Black: 8% Native: 0% Asian: 8% Hispanic: 11% Other: 2%

Notes: My Staten Island-based district is now tethered to downtown Manhattan to make the district a safe Democratic district.

District 14 DARK GREEN

Incumbent: Carolyn Maloney (D)

Area: Part of New York County (Manhattan)/Part of Kings County (Brooklyn)/Part of Queens County (Queens)

Population: 699,854

Obama: 80%

McCain: 19%

Old District: Obama 78% McCain 21%; Kerry 74% Bush 25%

White: 64% Black: 8% Native: 0% Asian: 8% Hispanic: 18% Other: 3%

Notes: My hometown district, Maloney gains parts of Brooklyn to enable Velazquez to have a Hispanic-majority district. Goes all the way up to the limits of the Upper East Side on 96th Street.

District 15 – ORANGE

Incumbent: Charlie Rangel (D)

Area: Part of New York County (Manhattan)/Part of Queens County (Queens)

Population: 700,198

Obama: 91%

McCain: 8%

Old District: Obama 93% McCain 6%; Kerry 90% Bush 9%

White: 17% Black: 27% Native: 0% Asian: 6% Hispanic: 47% Other: 3%

Notes: Rangel’s district is plurality Hispanic (and almost majority Hispanic). I would bet he wouldn’t like this district, as he could be primaried by an ambitious Hispanic legislator who would target him on ethics issues. Otherwise, it loses all parts of the Upper West Side, which never really made sense for him.

District 16 – LIGHT GREEN

Incumbent: Jose Serrano (D)

Area: Part of Bronx County (Bronx)

Population: 700,500

Obama: 95%

McCain: 5%

Old District: Obama 95% McCain 5%; Kerry 89% Bush 10%

White: 3% Black: 33% Native: 0% Asian: 2% Hispanic: 60% Other: 2%

Notes: The VRA-protected South Bronx district makes no substantive changes. This district would undoubtedly have the fewest white people in the country.

CA-AG: I Project Kamala Harris Wins

I put this in the comments of the open thread earlier today, but I’m confident in my numbers to make a proclamation.

As it stands right now, Kamala Harris is up by .2%, or 14,000 votes according to the CA SOS website, which was updated at 8 am this morning.

There are still around 900,000 ballots left uncounted.

Here are the top counties, their outstanding votes, and by how large a margin each county voted for a candidate.

Los Angeles: 208,513 (Harris +13.5%)

San Diego: 71,970 (Cooley +13.8%)

Orange: 54,316 (Cooley +29.2%)

San Joaquin: 39,715 (Cooley +7.6%)

Contra Costa: 38,413 (Harris +13.3%)

San Bernardino: 36,000 (Cooley +5%)

Sonoma: 35,500 (Harris +24.2%)

Riverside: 29,700 (Cooley +19%)

Monterey: 29,470 (Harris +15.2%)

Santa Cruz: 27,905 (Harris +34.1%!)

Marin: 27,050 (Harris +31.2%)

San Mateo: 26,812 (Harris +21.6%)

Alameda: 24,500 (Harris +40.7%!!)

Sacramento: 21,621 (Cooley +2.6%)

San Francisco: 21,376 (Harris +50.4%!!!!!!)

Using some mind numbing number crunching, I project that Kamala Harris takes it home with a net 64,584 from all of the above counties combined.

All of those counties account for around 694,000 of the 898,458 unprocessed votes, or 77% of the uncounted votes.

This means that for cooley to overtake that 64,584 deficit from the remaining uncounted counties, he would have to, on average, win them by around a 32% margin.

While not impossible, I find it highly unlikely for this to occur.  The biggest margin Cooley received from any county that I can see is from Kern, when he got a 36.5% margin.  He is going to have to do better than that with outstanding counties like santa Clara that went for Harris by 18.2%, and has 8,000 more outstanding ballots than Kern.

Unless the last of these ballots go overwhelmingly for Cooley, I think Cooley is a goner, and California will have its first Bi-Racial AG.

Congrats Kamala.  

By what margin will Bob Shamansky win?

View Results

Loading ... Loading ...

Redistricting North Carolina

This is my first shot at this, so be gentle 🙂

Meant to create:

1 Heath Shuler: 11

4 blue districts: 1, 4, 7, 12

8 red districts: 2, 3, 5, 6, 8, 9, 10, 13

http://img413.imageshack.us/im…

NC-1 (dark blue): Butterfield (D)

Obama 59%.

Mostly the same as before. The way I drew it, its only plurality black, not majority black. It could probably be tinkered with easily to be majority black though.

NC-2 (bright green): Ellmers (R)

McCain 55%

Loses Raleign and Chatham county, and most of Cumberland county. Picks up some nice R areas elsewhere.

NC-3 (purple): Jones (R)

McCain 58%

Pretty ugly. This was the leftover territory district for me.

NC-4 (red): Price (D)

Obama 72%

Congrats David Price. Obama vote dump. Loses carefully chosen sections of Chatham, Durham, Orange,and holds all of Chapel Hill and Raleigh.

NC-5 (yellow): Foxx (R)

McCain 55%

Absorbs a piece of Guilford county and the Greensboro area. Probably weaker than before.

NC-6 (olive green): Coble? (R)

McCain 55%

Not sure where Coble lives:

Covers most of Davidson, Rowan, Cabarrus, a bit of the Charlotte suburbs, and another piece of Guilford county.

NC-7 (grey): McIntyre (D)

Obama 58%

Another Democratic voting dump. Retains a piece of New Hanover and keeps Fayetville. All these counties voted for Elaine Marshall over Burr for Senate this year.

With a bit of fancier line drawing this can probably hit 60% Obama easily.

NC-8 (purple): Coble (R)

McCain 55%

See 6.

Yields territory to the new 6th and grabs Chatham and a piece of Wake County. Less Repbulican than before. Either 6 or 8 gets a new Republican.

NC-9 (teal): Mynick (R)

McCain 55%

Mostly unchanged.

NC-10 (pink): McHenry (R)

McCain 58%

Absorbs half of Buncombe. Picks up some of the 5ths territory.

NC-11 (bright green): Shuler (D)

McCain 56%

Breaks Buncombe in 2. Grabs some territory from the 5th and 10th. Shuler can win this anyway, though. A future Democrat probably can’t.

NC-12 (pale blue): Watt (D)

Obama 68%

Mostly unchanged. Picks up some more Dem territory at both ends, but maintains the general 2 city and corridor structure. Almost certianly less than 50% white at this point.

A professional could probably hit 70% Obama with this, and shore up the new 6th.

NC-13 (tan): Miller (D)

McCain 55%

Loses most of Raleigh and Greensboro. Grabs all of Alamance county and some areas from the old 2nd.

Designed to knock off Brad Miller.

Daves Redistricting 2.0 [Updated 2]

Daves Redistricting 2.0 is now ready.

There are many changes from 1.0. It uses a Bing map, so you can see roads and aerial view, and pan and zoom normally. You can load and save files normally, too. You can save a view directly to a JPEG. And there are more features to help do the job of assigning districts to CDs.

I am very excited to be releasing this. You are the first to know! I hope you like it.

Fire it up and check the “How To” for a brief idea of what’s different. And the help file explains it all. You can load 1.0 files, too.

Please let me know of any bugs. I’m sure there are some in there. I’ve only tested on Windows, so Mac users, please let me know if it’s ok on the Mac.

Update: Here’s some more info and explanation of the big changes:

1) The background is a bing map instead of a canvas. The advantages are you can see the roads and you get pan/zoom in a way you are use to (using the pan and zoom controls or the hold-mouse-and-drag that are common to bing and google maps). The disadvantages are that rendering is slower necessitating showing only a subset of the voting districts at a time, and that hold-mouse-and-drag no longer colors (because it pans) so you have to double-click to change the mode to coloring and back. I’ve tried to mitigate the performance disadvantage by giving you control over showing those districts (All, None, Auto with control over Auto). Another disadvantage is that the colors are paler in order to show the roads thru. I plan to give you a little more control over that.

2) File Save/Load is improved. I hope you all find this to be a big win. I always disliked the necessity of saving your work in the obfuscated files.

3) Area views. Saving the 1.0 area maps in some XML that required another tool was a real hack. And I had really broken the look of those, too, with all of the crossing lines. All of that is gone and now you can save directly to JPEG. The only issue is that Bing does not allow its road map or aerial map backgrounds to be saved — proprietary. (I’m prevented from rendering the background into the bitmap that is translated into the JPEG.)

4) Labels: This may be harder to notice, but all of the labels (CDs, Counties, etc.) can be moved and resized. Hover over them to get the tool tip. Hold mouse and drag to move; Hold mouse and hit ‘s’ to make it smaller or ‘l’ to make it larger. You can even delete some of the labels.

5) The Cur CD check box is new. It lets you focus on the currently selected new CD, hiding all the others. If you switch CDs when this is checked, it will pan and zoom to the newly selected CD.

5) Find CD Parts is a new feature that helps find little pieces of a CD that you may have left behind when changing CDs around. It uses only the bounding rectangle, so it won’t catch non-contiguous pieces that are really close to the main CD or in especially snake-like situations, but it can help. I may try to implement a real contiguity check someday, but that is much harder.

6) There still is Auto Assign according to Old CDs. I’ve also added Auto Assign by quadrants — something I came up with. It does not balance the CDs, but starts you out with rectangular districts that you can then modify to balance properly. I’ve made a map for Texas using this and it’s reasonably compact. In the future, I hope to add additional algorithms that others have developed or will develop.

7) I didn’t include city shapes this time, because the road map helps you see where the cities are. However, the road map doesn’t show the actual boundaries, which can of course, be useful. I will look into adding those back. But remember that adding more shapes slows down Bing’s rendering, so I need to think about how to limit the city shapes to the ones that are really useful.

And keep sending feedback. I will try to make improvements over the next couple of months and then work on all the new data when it comes out, so the app is ready for really helping you and others next year.

[Update 2]

From the feedback it seems you all are facing two major issues:

1) It’s too slow, even with the “only show some districts” mitigation. And that mitigation is a pain because you can’t see as much as you need.

2) The Bing pan control seems to go wild.

For (1) I am trying a change that looks promising and, I hope, will get the speed to be close to 1.0 speed. I thought about this all day (while doing other stuff), tried a couple of things. I need to work on it more and it will be at least a few days, possibly after T-day before I would have this ready. So stay tuned.

On (2), I was finally able to sort of duplicate the behavior. I can see that if I hold the mouse in the pan control and then quickly (really fast) move it out of the control, the map does speed away in that direction. My guess is that on the Mac at least, the pan control is not calibrated to the mouse as well and is too sensitive, so you all hardly have to move the mouse to get the map winging away. Since I don’t do anything for that control (the Bing object does) I don’t have a good solution, other than using the drag on the map method of panning.

Thanks!

Redistricting 2011-12 Preview

The Census figures won’t be reported until December and not finalized until next spring, but the 2010 elections are now over and it seems redistricting is on everyone’s – and by everyone, I mean everyone in the rarefied world of political blogs and political science academia – minds. Republicans are crowing that their control of the redistricting trifectas in Florida, Georgia, Michigan, Ohio, Pennsylvania, Texas, and Wisconsin will bring them great gains and solidify their new House majority for years to come (funny, much the same was said in 2002, and House control has flipped twice since then, in dramatic numbers each time). So though it’s early, let’s look state-by-state at what is most likely to come of redistricting this decade.

I’m excluding some states – Alabama, Arkansas, Colorado, Connecticut, Hawaii, Idaho, Kansas, Kentucky, Maine, Maryland, Mississippi, Nebraska, New Hampshire, New Mexico, Oklahoma, Oregon, Rhode Island, Tennessee, and West Virginia – whose redistricting process will likely prove uninteresting this round.

Arizona

Who’s in control? Nonpartisan commission

How many seats? 9 (up from 8 in 2002)

Likely shift? +1 competitive seat

The Republicans have a 5-3 majority in Arizona’s delegation, but each party holds a couple generally competitive seats (the 1st and 5th for the Republicans, the 8th for the Democrats), and the commission needs not protect incumbents, so will probably seek to create as close to a tossup seat as possible in the fast-growing suburban areas of Maricopa County (Phoenix). As in 2002 when Rick Renzi’s win in the then-newly created 1st corresponded to slightly expanded Republican majorities nationwide, how the new Arizona seat goes may act as a bellwether of sorts.

California

Who’s in control? Nonpartisan commission

How many seats? 53

Likely shift? Totally up in the air

This state saw a genius Democratic gerrymander in 1982, a competitive court-drawn map in 1992, an incumbent protection gambit in 2002, and now nonpartisan redistricting has finally come to California. Republicans are convinced they can net a handful of seats out of a commission-drawn map, but remember we are talking about a presidential year in which Democratic turnout for Obama should be high and that some of the greatest beneficiaries of 2002’s map were suburban Republicans. Bottom line: no one knows what to expect.

Florida

Who’s in control? Republicans, within limits

How many seats? 27 (up from 25 in 2002)

Likely shift? We’ll see

A state constitutional amendment passed on November 2 that banned the legislature from drawing districts designed to favor or disfavor a given political party, so in essence the state is now subject to nonpartisan redistricting. However, the state government is still solidly in GOP control, so the legislature can easily pass a gerrymandered map and just wait for the Democrats to launch a time-consuming court challenge. Meanwhile, the amendment is itself being challenged in court right now by Reps. Corrine Brown and Mario Diaz-Balart, who claim that the new redistricting rules re: compactness jeopardize VRA-protected minority seats. If they win in court, the amendment is out and GOP gerrymandering is in. But should the legislature actually have to follow new rules, we could see quite a few Democratic pickups here, as the state is already ridiculously rigged in Republicans’ favor.

Georgia

Who’s in control? Republicans

How many seats? 14 (up from 13 in 2002)

Likely shift? +1-2 R

The only question is how aggressive Republicans want to be. If I were them, I’d craft a new GOP seat in Gwinnett County/eastern Atlanta and pack Sanford Bishop’s south Georgia seat with black population in Macon, then make John Barrow’s Augusta-to-Savannah marginal Dem district a bit more Republican. But if they overreach re: Barrow (or try to target Bishop instead) they could leave frosh GOPer Austin Scott underprotected.

Illinois

Who’s in control? Democrats

How many seats? 18 (down from 19 in 2002)

Likely shift? +2-3 D

The Democrats definitely plan to milk Illinois for all its worth, particularly given GOP gains this year that allow for some serious poaching and the lack of Democratic gerrymandering opportunities elsewhere. Expect a Republican – either Bobby Schilling downstate or Bob Dold/Joe Walsh in the Chicago area – to face elimination and another two (Randy Hultgren and Adam Kinzinger, e.g.) to see their districts cracked or reconfigured.

Indiana

Who’s in control? Republicans

How many seats? 9

Likely shift? +1 R

This is a simple enough task for the GOP: protect Larry Bucshon and Todd Young, defeat Joe Donnelly. For the latter purpose, moving Donnelly’s South Bend-area base into the already heavily Democratic 1st District would be all that is required.

Iowa

Who’s in control? Nonpartisan commission (with legislative approval)

How many seats? 4 (down from 5 in 2002)

Likely shift? Dem vs. GOP incumbent match

The nonpartisan commission likely won’t force two Democrats (Braley and Loebsack) or two Republicans (Latham and King) together, so the only plausible outcome, I think, is a match between Latham and Boswell in central Iowa around Des Moines and Ames. This will be a tossup district with maybe a slight edge given to Latham.

Louisiana

Who’s in control? Split (GOP Gov, Dem Legislature)

How many seats? 6 (down from 7 in 2002)

Likely shift? -1 R

The only Democratic seat left is Cedric Richmond’s VRA-protected 2nd District, which will likely regain lost population by adding a tentacle in Baton Rouge. A Republican – perhaps newcomer Jeff Landry – will have to be cut loose. If it’s Landry as some have suggested, he will be combined with Charles Boustany in a Cajun Country/Gulf-centered seat.

Massachusetts

Who’s in control? Democrats

How many seats? 9 (down from 10 in 2002)

Likely shift? -1 D

This cancels out Louisiana from a partisan standpoint. RealClearPolitics recently pointed out that the Western Mass 1st District, held by 70-something Rep. John Olver, seems a likely target for elimination but that liberals would much rather devise a way to get rid of Stephen Lynch in South Boston. And then, of course, there’s freshman Bill Keating. The decision may rest more on personality than on politics, given the lack of partisan intrigue innate to a bunch of veteran Democrats picking which veteran Democrat to force out of Congress.

Michigan

Who’s in control? Republicans

How many seats? 14 (down from 15 in 2002)

Likely shift? -1 D

Much speculation has centered on who the unlucky Democrat will be but I’m actually reasonably certain it will be two-termer Gary Peters in Oakland County. The Detroit area has lost population, but both VRA districts (Hansen Clarke’s 13th and John Conyers’ 14th) can and will be preserved, so the simplest solution is to combine Peters with longtimer Sander Levin in a heavily Democratic suburban seat. I doubt the Republicans will target Dingell or Kildee either, since that would spread GOP votes too thin in an already gerrymandered map.

Minnesota

Who’s in control? Split (Dem Gov, GOP Legislature) assuming Dayton wins the gov. race

How many seats? 7 (down from 8 in 2002)

Likely shift? Dem vs. GOP incumbent match

If Tom Emmer wins the gubernatorial recount, we are in for a whole new ballgame as Republicans finally combine Minneapolis and St. Paul into one district, but should Dayton prevail this may involve a competitive seat between Collin Peterson and Chip Cravaack up north or between Tim Walz and John Kline down south.

Missouri

Who’s in control? Split (Dem Gov, GOP Legislature)

How many seats? 8 (down from 9 in 2002)

Likely shift? Dem vs. GOP incumbent match

RealClearPolitics noted that the GOP’s legislative majorities are almost veto-proof and that, if black Democrats ally with Republicans, they could pass a GOP- and minority-friendly map over Gov. Nixon’s objections. But the most likely outcome here is a suburban St. Louis race between Todd Akin and Russ Carnahan that favors Akin (since Carnahan will need to cede some Democratic votes to Lacy Clay’s population-losing 1st District).

Nevada

Who’s in control? Split (GOP Gov, Dem Legislature)

How many seats? 4 (up from 3 in 2002)

Likely shift? +1 D

The legislature will probably pass a plan that protects newbie Republican Joe Heck but compensates with a new Dem-leaning seat in Reno or suburban Clark County.

New Jersey

Who’s in control? Bipartisan commission

How many seats? 12 (down from 13 in 2002)

Likely shift? Dem vs. GOP incumbent match

North Jersey’s population loss means Bill Pascrell could be combined with Rodney Frelinghuysen or Scott Garrett in a moderate suburban district. The commission is bipartisan, not nonpartisan, so swing votes can easily be swung and incumbent protection for the other 11 districts is almost assured.

New York

Who’s in control? Split (Dem Gov and House, GOP Senate)

How many seats? 27 (down from 29 in 2002)

Likely shift? 1 D and 1 R

I am assuming the Senate stays in Republican hands; this should involve the elimination of one upstate seat and one city-area seat. RCP predicts the unlucky upstater will be a Democrat and the unlucky downstater a Republican (Pete King or, if he wins, Randy Altschuler). But I always assumed it would be the opposite. In all predicted scenarios, incumbents of the same party will be combined with each  other. We shall see.

North Carolina

Who’s in control? Republicans

How many seats? 13

Likely shift? +2 R

Republicans will seek to aggressively undo the Democratic gerrymander of ’02 by dismantling Larry Kissell and either Heath Shuler or Mike McIntyre. They could conceivably target all three and spread Republican votes extremely thin. David Price, Brad Miller, Mel Watt, and G.K. Butterfield should be fine in any case.

Ohio

Who’s in control? Republicans

How many seats? 16 (down from 18 in 2002)

Likely shift? 1 D and 1 R

I am convinced the GOP will not seek to eliminate two Democrats. That would, quite simply, jeopardize their incredibly lopsided majority in the state delegation. I’ve long thought they’d combine Dennis Kucinich and Betty Sutton in a new Cleveland-to-Akron seat and two freshman Republicans elsewhere (best bet? Bill Johnson and Bob Gibbs in the rural east, or Gibbs and Jim Renacci from Canton). Meanwhile, they’ll shore up regained GOP seats in Cincinnati and Columbus.

Pennsylvania

Who’s in control? Republicans

How many seats? 18 (down from 19 in 2002)

Likely shift? -1 D and possibly +1 R

As in Michigan and Ohio, we are already working with a GOP-gerrymandered map in the aftermath of a GOP-friendly election so the Republicans can’t afford to target the remaining Dem incumbents much. The most they can do is eliminate Mark Critz and make Jason Altmire’s seat more Republican.

South Carolina

Who’s in control? Republicans

How many seats? 7 (up from 6 in 2002)

Likely shift? +1 R

John Spratt’s defeat makes this an easy call- pack the black population and Democrats in general into Jim Clyburn’s 6th to squeeze out one more Republican seat either up north or near Charleston.

Texas

Who’s in control? Republicans

How many seats? 36 (up from 32 in 2002)

Likely shift? +3 R and +1 D

This is a fascinating case. The Republicans have unlikely freshmen in Quico Canseco and Blake Farenthold; how to protect them without diluting the Hispanic populations in the 23rd and 27th and thereby violating the VRA? Meanwhile, RCP is convinced they can carve out four new GOP districts, but every way I’ve run the math the Democrats are due a new seat in Dallas-Fort Worth. The scenario I suggest may actually be the best possible outcome for the Republicans, since if they protect Canseco and Farenthold too much they may see their map tossed out in court. One more parting shot: pack every available Hispanic into the already heavily Latino 29th to see if they can finally knock Gene Green out in a Democratic primary.

Utah

Who’s in control? Republicans

How many seats? 4 (up from 3 in 2002)

Likely shift? +1 R

The big question is whether the legislature will try once again to ruin Democratic survivor Jim Matheson, whose district is already heavily rural and ridiculously conservative, or just give him a moderate Salt Lake City-based district to ensure the election of three Republicans? It seems to me they can’t make his seat much more Republican without making the new 4th District a comparably liberal SLC seat.

Virginia

Who’s in control? Split (GOP Gov and House, Dem Senate)

How many seats? 11

Likely shift? None

At the moment everyone presumes we will see an incumbent protection map, but consider the following scenario: Republicans stall on redistricting until after the 2011 elections, hoping to flip control of the Senate and thereby run the whole process. They then draw a map the following year that cracks Gerry Connolly’s base and allows for a 9-2 GOP majority. Of course, that assumes the wind is still at Republicans’ backs next November, and a year is indeed an eternity in politics.

Washington

Who’s in control? Nonpartisan commission

How many seats? 10 (up from 9 in 2002)

Likely shift? +1 competitive

The commission is not obliged to protect incumbents, so anything can happen with the existing delegation or with the new 10th District. Both suburban Seattle and the inland have grown, and the two regions’ politics stand in stark contrast, so…we shall see.

Wisconsin

Who’s in control? Republicans

How many seats? 8

Likely shift? None or +1 R

The most they could do at this point is crack Ron Kind’s district, but that would represent a huge risk since Sean Duffy and Reid Ribble are new in town. Duffy, particularly, would benefit from Kind getting a more Democratic seat in western Wisconsin.

Illinois Redistricting – Democratic Gerrymandering

Overview

IL AL

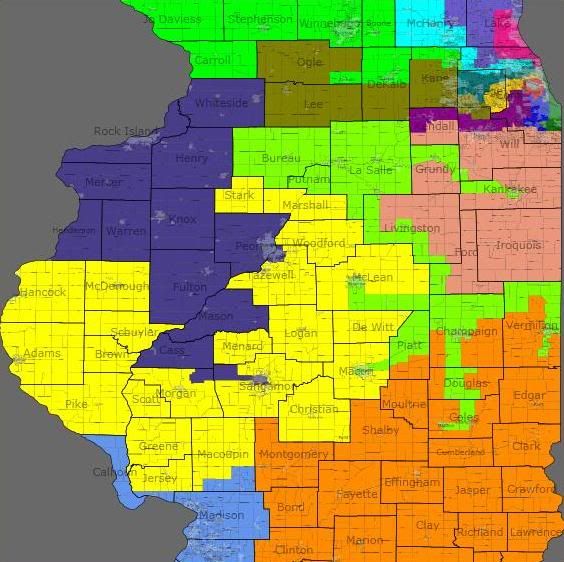
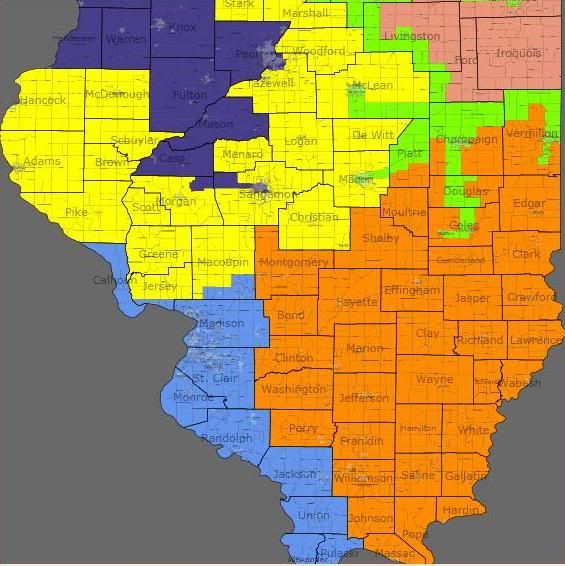
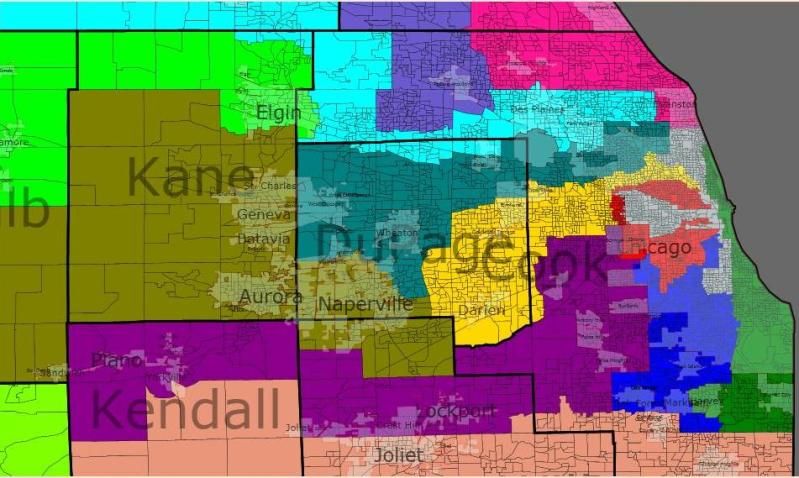
Basically, this Illinois map is a Democratic Gerrymander designed to give the best shot at reasonably-drawn districts, drawn with a trifecta. I was quite creative, but out of 18 (IL loses a seat), only 2 are Safe Republicans (both Central+Southern Illinois). I seek to restore all of the districts we lost in 2010, gain Kirk’s, Roskam’s seat, make the Rockford seat vulnerable in an open-seat situation, snag Judy Biggert’s seat, and create a Champaign/IL-11 mid-state cities district, making for a possibility of 16-2 (at max), but more likely towards 14-4 or 13-5. All while retaining the general spirit of most of the current districts, almost all the districts, except for the general combination of IL-11 and IL-15, contain most of their current territory, though some like Jan Shakowsky and Lipinski are now taking in some suburban and exurban territory. Since there’s no partisan info in david’s redistricting Ap, All districts are either ‘safe’ or a rough approximation by me based on the current structures, plus or minus vote totals/percentages from counties, plus rural v. urban factors.

Oh, and I guess I’m not the only one who suddenly wanted to redistrict Illinois. I like mine better, though 😛

Downstate

IL Downstate

IL-15 (R-John Shimkus)

Since the 19th is to be removed, the 19th becomes most of the 15th, except adding counties here and there especially into the present-day 15th, but it’s basically a solidly safe GOP district for Shimkus.

IL-18 (R-Aaron Schock)

He loses Peoria to Hare’s district, but gains a bunch of rural counties from Hare’s district and elsewhere. Safe Republican seat.

IL-12 (D-Jerry Costello)

Very similar to the present district, except with 2 counties worth 50k population that are heavily GOP are removed for the rest of Madison County, and some Macoupin and Calhoun counties, which should make this district ever so slightly more D.

IL-17 (D-Phil Hare?)

Removed the more GOP south and some of the stretcher salient counties (to Shock) for the rest of Whiteside County (solidly dem), a few swing counties, Peoria and some Suburbs in Tazewell County, and another sliver into a good chunk of Springfield. Should likely make the configuration even bluer, for a Phil Hare return, but it’s not impossible for the GOP incumbent to hold onto it in GOP wave elections, but is generally a Likely D (Schock could run here too!).

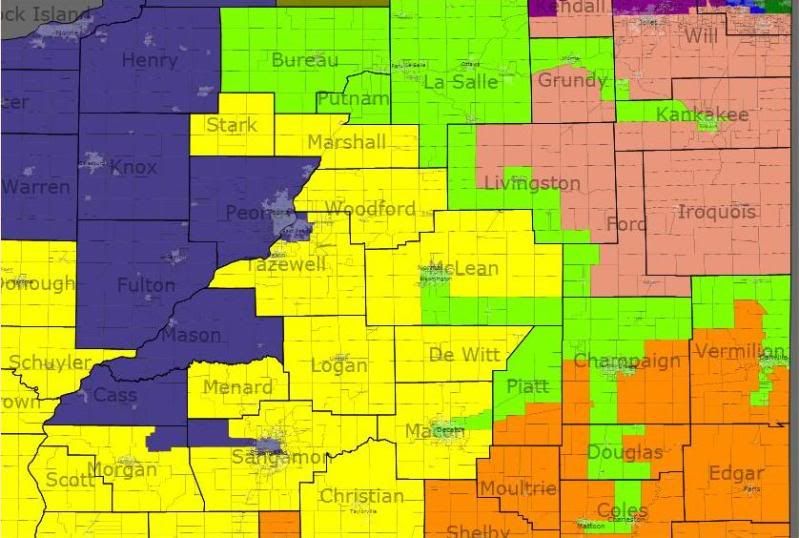
Central East

IL Central Easter

IL-11 (D- someone new, Debbie Halvorson? or R-Tim Johnson)

This district contains a bunch of cities scattered across the Eastern-Central part of Illinois, including the cities of Champaign, Danville in Vermillion County, Mattoon and Charleston in Coles County, core urban Dactuar in Macon County, Bloomington in McLean County, Pontiac in Livingston, and then a more IL-11 territory in La Salle, Bureau, Putnam, Northern Grundy and city of Kanzakee in Kanzakee Counties. Basically, it’s pretty amendable to a Democrat, and Tim Johnson will be running for only the most unfriendly places of his former district, probably only 40% of this current district, with highly amendable areas in the remaining 60%. Lean D in a neutral year, with Obama atop the ticket next year.

IL-13 (D- someone new? or R-Judy Biggert)

This district takes the remainders of Ford, Iroquos, Livingston, Kankakee and Grundy counties, which lean GOP, but a rather small portion of the district. It takes up the 70% Southern portion of Will County (a swing, 56% Obama district), and the South+Eastern portion of Kendall county, and part of some South Side Cook County. Overall, with the strongly D Cook County, the swingy nature of Will+Kendall counties, and only small population rural precincts, this should lean D in a neutral year. Judy Biggert could try for this, but she’d only be familiar with Most of Will and a bit of Cook County in her own district, so not very hopeful.

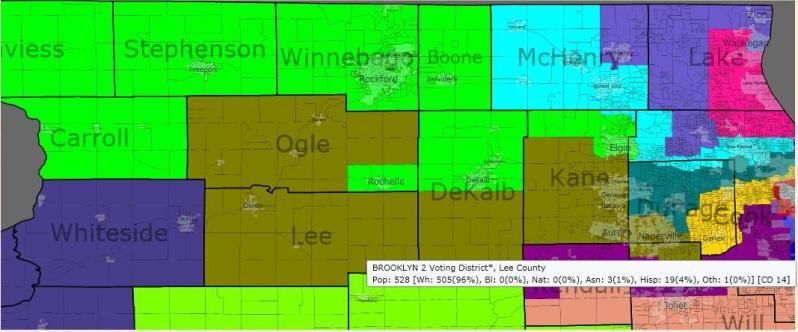
Northern

IL Northern

IL-14 (D- Foster? or R)

similar to the current 14th, takes in most of Ogle, Lee, southern 1/2 of DeKalb, 70% of Kane, and the Aurora-Naperville area of DuPage+Will Counties. Rural counties are meh, but the amount of suburban cities in it with Kane County/Aurora as its base should make this a toss-up, with Foster being favored.

IL-16 (R-Donald Manzullo, or toss-up open seat)

Similar to his current seat, but takes a bit out esp. McHenry and takes in some of DeKalb, Kane and a small bit of Cook counties. This would favor Manzullo quite a bit, but being a modestly Obama district (54% or so), this could be captured in an open-seat situation or wave.

Chicago

IL Chicago

IL-01 (D-Bobby Rush)

A Black Majority district (about 52%) based in Southside Chicago, Safe D.

IL-02 (D-Jesse Jackson)

A Black Majority district (about 52%) Based in Southside Chicago, but now extending along the coast into Northern Chicago. Safe D

IL-03 (D-Dan Lipinski)

Now extending into the northern 3/5s of Kendall County, and a slice of Will County, and most of Lipinski’s working-class white sectitons of Cook County – should be more conservative, but since Lipinski is more conservative and it’s still solidly D (56% Kerry / 60% Obama), this remains a Safe D.

IL-04 (D-Luis Guitierrez)

Has a similar C-shaped district based in Cicero and hispanic-majority areas of Chicago, slightly less ugly now. Safe D

IL-05 (D-Mike Quigly)

Extends now into some of DuPage county, loses some of the top of his thin district, but remains similar with some ‘burbs. Safe D

IL-06 (D-Tammy Duckworth/Christine Cegalis? Peter Roskam?)

About 50% of DuPage county here, and then extending into former Schakowsky and Quigley areas, making this much bluer than before. A Democrat should win this, but it’s not impossible that Roskam can too, if he decides to run here.

IL-07 (D-Bobby Rush)

A Black-majority district with some of North Chicago, now safe D.

IL-08 (D-Melissa Bean?)

Similar to the setup now, except takes in slightly more of Lake, slightly less of McHenry, and slightly more of her Cook Suburbs, making this a lean/likely-Melissa Bean / toss-up otherwise.

IL-09 (D-Jan Schakowski)

She loses some of her Northern Cook base like Evanston to extend into the rest of McHenry and NW Cook/DuPage, making this slightly less Democratic in this very safe D seat.

IL-10 (D-Dan Seals? / R-Bob Dold!)

Loses a bit of Lake and extends into Evanston + environs, making this tilt even more D. Dan Seals is a 3-time loser, jeez!, but even he should be able to win it next time around (or how about someone new?!) against Bob Dold!

So, there it is. If this were the map in 2012 predict us picking up the IL-17, IL-08, IL-10 with a good shot at picking up IL-11, IL-13, IL-14, with IL-15 in an Obama+Open Seat scenario. Final prediction would be a 14-4 split, with 1-2 districts to grow in. What do you think?