CA-AG: Maybe Our Last Update?

Hopefully, this is the last update we’ll have to make about the Attorney General’s race!

We went through and did another county-by-county canvass, and we now have Kamala Harris (D) leading Steve Cooley (R) by 37,662 votes, 4,251,331 to 4,213,669. This count is about 100,000 votes ahead of the SoS.

Again we sync up the estimates, and my estimation of the number of unprocessed ballots differs from the UBR for the following counties:

  • Butte: +222; the county reports 18,229 ballots left.

  • Del Norte: -1,002 for votes added since November 8.

  • El Dorado: -1,795 for votes added since November 9.

  • Fresno: -8,687 for votes added since November 12.

  • Imperial: -6,089 for votes added since November 6.

  • Kern: -4,831 for votes added since November 8.

  • Marin: -19,108 for votes added since November 8.

  • Mariposa: -267; this is the county’s “final update.”

  • Nevada: -4,730; the county estimated 4,730 outstanding on November 8 but has added 6,692 votes since then.

  • Orange: -53,404; the county reports 912 ballots left.

  • Placer: +27,956; vote counts have not been updated since November 3.

  • Riverside: -11,300; the county reports 18,400 ballots left.

  • San Diego: -44,970; the county reports 27,000 ballots left.

  • San Francisco: -18,892 for votes added since November 8.

  • San Luis Obispo: -826 for votes added since November 12.

  • San Mateo: -26,812; this is the county’s “final unofficial results.”

  • Santa Clara: -18,100; the county estimated 18,100 outstanding on November 10 but has added 18,174 votes since then.

  • Tehama: -1,976 for votes added since November 10.

  • Ventura: -6,142 for votes added since November 11.

  • Yolo: -9,791; the county reports 0 ballots unprocessed.

Therefore, we estimate 428,179 ballots left unprocessed (compared to the SoS’ 671,594.)

The remaining territory is pretty much a wash, with our estimates having Harris gaining 47 votes to pad her margin.

As with last time, the ballots reporting have been more friendly to Kamala than before; she’s doing 0.36% better than we expected her to based on the November 13 canvass and 0.65% better than expected based on the November 8 canvass. Here are the relative swings in each county since the November 13th and 8th updates.


County 11/8 – 11/13 11/13 – 11/17 11/8 – 11/17
San Benito 1.98% 0.00% 1.98%
Alameda 0.75% 0.65% 1.39%
Orange 1.30% 0.05% 1.35%
Nevada 1.42% -0.34% 1.08%
Sacramento 0.70% 0.36% 1.06%
Fresno -0.08% 1.12% 1.04%
San Mateo 0.55% 0.43% 0.98%
Monterey 0.93% 0.00% 0.93%
San Francisco 0.38% 0.30% 0.68%
Inyo 0.64% 0.00% 0.64%
Del Norte 0.00% 0.63% 0.63%
Contra Costa 0.71% -0.18% 0.53%
Ventura 0.12% 0.41% 0.53%
Riverside 0.10% 0.40% 0.50%
San Diego -0.04% 0.51% 0.47%
Merced 0.45% 0.00% 0.45%
San Luis Obispo 0.39% 0.02% 0.41%
Kern -0.03% 0.37% 0.34%
Kings 0.28% 0.00% 0.28%
Santa Barbara 0.28% 0.00% 0.28%
Santa Clara 0.03% 0.23% 0.26%
San Bernardino 0.24% 0.00% 0.24%
Mariposa 0.00% 0.24% 0.24%
Marin 0.18% 0.00% 0.18%
Shasta 0.10% 0.00% 0.10%
Tuolumne 0.00% -0.08% -0.08%
Yolo -0.15% 0.00% -0.15%
Los Angeles -0.33% 0.18% -0.15%
Siskiyou -0.16% 0.00% -0.16%
San Joaquin -0.15% -0.02% -0.16%
Imperial 0.14% -0.30% -0.17%
Solano -0.29% 0.00% -0.29%
Yuba -0.35% 0.00% -0.35%
Tehama -0.64% 0.27% -0.37%
Santa Cruz -0.43% 0.00% -0.43%
Amador -0.58% 0.00% -0.58%
El Dorado -0.89% 0.30% -0.59%
Sutter -1.34% 0.20% -1.15%
Tulare -1.38% 0.00% -1.38%

Movers and shakers below the fold.


County Total Harris Cooley Unproc Harris Cooley Margin
Los Angeles 2,135,078 1,135,803 842,854 93,590 49,787 36,946 12,841
Sonoma 138,383 79,052 45,321 35,500 20,280 11,626 8,653
Mendocino 19,097 10,321 6,159 12,358 6,679 3,986 2,693
Marin 102,499 63,668 31,727 7,942 4,933 2,458 2,475
Contra Costa 317,509 169,278 125,519 16,982 9,054 6,713 2,340
Monterey 87,434 47,784 32,266 11,563 6,319 4,267 2,052
Santa Cruz 87,349 54,033 24,218 5,655 3,498 1,568 1,930
Humboldt 35,966 18,011 13,436 13,387 6,704 5,001 1,703
Napa 28,480 14,229 11,711 17,877 8,932 7,351 1,581
San Francisco 254,252 180,762 51,748 2,484 1,766 506 1,260
Solano 109,963 55,825 45,385 5,498 2,791 2,269 522
Imperial 24,344 11,807 10,247 3,097 1,502 1,304 198
Lake 14,980 6,585 6,430 5,372 2,361 2,306 56
San Benito 15,164 7,007 6,759 200 92 89 3
Del Norte 7,878 2,905 4,049 6 2 3 -1
Merced 46,263 18,698 23,540 400 162 204 -42
San Luis Obispo 100,062 37,545 52,335 902 338 472 -133
Sacramento 392,703 176,034 184,727 8,774 3,933 4,127 -194
Orange 842,060 261,964 506,586 912 284 549 -265
Santa Barbara 119,282 51,662 57,104 6,536 2,831 3,129 -298
Tehama 19,093 5,141 11,478 1,023 275 615 -340
San Joaquin 146,789 60,116 71,201 6,844 2,803 3,320 -517
Sutter 23,325 6,849 14,240 1,694 497 1,034 -537
Amador 15,640 4,334 9,238 1,741 482 1,028 -546
El Dorado 73,928 21,681 44,647 2,105 617 1,271 -654
Ventura 247,505 96,609 132,181 6,414 2,504 3,425 -922
Stanislaus 110,462 41,587 59,205 6,980 2,628 3,741 -1,113
Tulare 76,763 22,316 48,368 3,350 974 2,111 -1,137
Shasta 59,536 15,995 37,152 3,400 913 2,122 -1,208
Calaveras 14,501 4,168 8,236 4,918 1,414 2,793 -1,380
Fresno 174,704 62,671 98,351 8,813 3,161 4,961 -1,800
Madera 27,635 8,130 16,872 5,806 1,708 3,545 -1,837
Kern 163,889 44,444 103,680 5,371 1,457 3,398 -1,941
Butte 56,937 20,635 29,626 18,229 6,607 9,485 -2,879
Riverside 455,493 166,883 251,301 18,400 6,741 10,152 -3,410
San Diego 838,571 323,600 435,683 27,000 10,419 14,028 -3,609
San Bernardino 393,156 145,444 207,987 29,000 10,728 15,342 -4,613
Placer 107,703 31,998 66,112 28,056 8,335 17,222 -8,886

2011 Virginia General Assembly Elections – An Early Look

The 140 seats of Virginia’s general assembly are all up in 2011. This will be one of the first post-redistricting elections in the country; redistricting will take place next spring in Virginia, and must be submitted to the Department of Justice for VRA pre-clearance. This will likely result in a compressed campaign season, as the composition of the maps will not be known until March or April, and they won’t be approved until June or July. This is especially frustrating, as many legislative seats hang in the balance due to the explosive population growth in the Northern Virginia exurbs.

The Virginia Public Access Project has posted maps that estimate the current population variance of the existing legislative (and Congressional) maps. A quick look at the maps makes the population trends in Virginia readily apparent: the state is experiencing huge amounts of growth in the outer NoVa suburbs of Loudoun and Prince William Counties, as well as the more exurban parts south of Prince William (Culpeper, Fauquier, Spotsylvania, and Stafford Counties). The Richmond suburbs (Chesterfield and Henrico Counties and some of the more rural counties to the north) and outer Hampton Roads areas (Isle of Wight and York Counties and the city of Suffolk) are also experiencing growth, although not as significant.

This growth comes at a cost: the rural areas of Southwestern and Southside Virginia are taking a beating, as well as Richmond proper and the older, more urbanized cities of Hampton Roads (Hampton, Newport News, Norfolk, and Portsmouth). Even Northern Virginia is not immune to these trends: growth has stagnated in the inside-the-beltway areas of Alexandria, Arlington, and inner Faifax.

What does all this mean? The obvious answer is that reapportionment is going to draw seats away from these areas and towards the outer ring of D.C. suburbs and exurbs. In the short-term, this is likely going to hurt Democrats; although they had some success in these areas during the Bush administration, capped by Obama’s double-digit wins in Loudoun and Prince William, the areas have swung back to the Republicans in the past couple years. The Democratic Party can’t take these places for granted — they’re filled with fiscally conservative, socially moderate voters who have no problem voting for a Republican over a Democrat when it comes to pocketbook issues.

Having said all that, I’m now turning my attention to the State Senate, where Democrats hold a 22-18 edge. The Democrats will find defending all 22 seats a challenge; currently the map is maxed out for them, there are no realistic targets for picking up Republican seats. That may change in redistricting, but of course, I can’t guess what the map will look like. For now, I’ll run down the Democrats in the Senate that may be vulnerable in 2011, ranked from most vulnerable to least vulnerable. The district numbers are linked to VPAP’s breakdown of each district by locality and statewide performance.

1. SD-01 (John Miller, elected in 2007) – In 2007, Miller beat a fairly nutty Republican who knocked off the popular, moderate incumbent in a primary. Sound familiar? As it stands, Miller’s district is a pretty conservative one; although Kaine and Obama did come close to winning it, it includes the extremely Republican city of Poquoson and carves out the most Republican parts of Newport News. If I had to hazard a guess, the next map will likely trade out the York/Poquoson areas in exchange for the Newport News/Williamsburg portion of SD-03. Either way, Miller will be in for a tough fight next year.

2. SD-29 (Chuck Colgan, elected in 1975) – Colgan, the President Pro Tem of the Senate, may retire next year. At 84 years old, it would be hard to blame him. The district is one that on paper favors Republicans, being a swath of central Prince William County. However, Colgan’s long tenure in office has helped him hold on, although his margins in recent elections have not been impressive: he won 55% in 2003 and 54% in 2007. Democrats might try to draw a better district, given that the 29th has to shed quite a few voters, but it will be tough to hold this one even if Colgan doesn’t retire. Colgan hasn’t raised a whole lot of money so far — about $150k, with only $43k in the bank.

3. SD-17 (Edd Houck, elected in 1983) – Houck is one of the few “old guard” Democrats left. A 27-year veteran of the Senate, he chairs the Education and Health Committee, and represents a conservative district that spans from the sleepy, rural counties of Madison and Orange to the growing exurbs of Fredericksburg and Spotsylvania County. Houck has been facing decreasing margins of victory over the years; in 1999 he won 60%; in 2003, 59%; and in 2007, 56%, despite outspending his opponent nearly 3-1. With $300,000 in the bank, Houck seems likely to run for another term, but it will be a struggle. The district needs to shed voters, but I don’t really see how it can be made much better for Houck; Fredericksburg is the only real Democratic bastion in the district. Regardless, Houck will be in for a fight next year.

4. SD-38 (Phil Puckett, elected in 1998) – Puckett is probably the most conservative Democrat in the Senate, and it’s not surprising to see why: he represents a chunk of Southwestern Virginia that has voted for exactly two statewide Democrats in the past six years, Creigh Deeds in 2005 and Mark Warner in 2008. Again, not to sound like a broken record, but this is a part of the state that is becoming extremely unfriendly to Democrats. Pucket hasn’t had an opponent in the past two contests, which probably won’t be the case this time. Of course, he could turn out to still be a safe bet, but given what has happened over the last two years in this part of the state, I wouldn’t put money on it.

5. SD-20 (Roscoe Reynolds, elected in 1996) – Reynolds is a conservative Democrat representing a swath of Southside Virginia that stretches from Martinsville to Wythe County. He has won handily in each of his three election contests, but this is an area that has been sharply trending away from the Democrats in the past few years. Not helping things is the fact that this district, like all of those in this part of the state, is going to have to expand in order to meet population requirements. I’m not sure what the districts in the area are going to look like next year, but if Republicans don’t mount a strong challenge to Reynolds, they’re missing a big opportunity.

6. SD-06 (Ralph Northam, elected in 2007) – Northam easily defeated Republican Nick Rerras in 2007. He’s a moderate Democrat with a great bio: he grew up on the Eastern Shore, went to VMI, and is a pediatric neurologist at CHKD. The district is split between the white parts of northern Norfolk and the Eastern Shore, and Northam has ties to both parts of the district. I don’t expect this one to change that much, though it may have to expand east into SD-07 (which may benefit Northam, as there are some precincts in western Virginia Beach that are generally favorable to Dems). Northam is definitely favored for re-election, but as a freshman in a swing district, he should be watched carefully.

7. SD-33 (Mark Herring, elected in 2006) – Herring picked this seat up in a special election in 2006, and though his margin slipped the next year, he still won by a double-digit margin. The concern, of course, is that Loudoun County has swung back to the Republicans in the past couple years, kicking out both of its Democratic Delegates in 2009. There are two good bits of news for Herring, though: first, the district is going to have to shed about half its voters, which means Democrats should be able to draw a much safer district. The other good news for Herring is the cast of characters running against him: Dick Black, a long-time embarrassment who lost his House seat in 2005, Patricia Phillips, who lost to Herring in 2007, and some guy who came in third for a Board of Supervisors seat in 2007.

8. SD-39 (George Barker, elected in 2007) – Barker’s district is located mostly in southern Fairfax with some of Prince William County. I don’t think he should be in too much trouble, but I’m including him here because he’s a freshman in a fairly swingy district, though the Democrats might be able to shore him up a bit.

SSP Daily Digest: 11/17

NV-Sen: By far the most interesting news of what’s been a very slow news day is that John Ensign appears to be running again, at least according to one of his spokespersons. While he’s been acting like he’d run again (and he was probably encouraged by that recent PPP poll showing him leading Dean Heller in a GOP primary), it’s still a little surprising, given the disrepair his fundraising operation has fallen into, and the pile of ethics and potentially criminal investigations he’ll have to navigate next year. (H/t sebby123.)

FL-Sen: Can’t a man publish an op-ed in a major in-state newspaper without people thinking he’s running for a higher office? Well, apparently not, based on reaction to a column written by Rep. Connie Mack IV in the Orlando Sentinel that took Bill Nelson to task over extension of Bush-era tax cuts. Beltway code-talkers are interpreting this as the first salvo of a likely Senate race.

WV-Sen, WV-Gov, WV-02: GOP Rep. Shelly Moore Capito is sounding studiously noncommital about her plans for 2012. A challenge to newly-elected (in a special election) Sen. Joe Manchin? “I’m not ruling it out…” but also “I have given no thought to it…” (other than, by definition, the amount of thought needed in order to decide not to rule it out). She also didn’t rule out running for Governor in 2012, although she did pretty explicitly rule out running for Governor if the legislature decides they should have a fast odd-numbered-year special election to replace Manchin in 2011. A Manchin/Capito match would be between two super-popular politicians: a Blankenship (the pollster, not the coal company) survey just found Manchin with 80% approvals and Capito at 77%.

AL-02: Bobby Bright popped up today to criticize the Dems’ decision to retain Nancy Pelosi as leader, but he also offered some vague “never say never” sentiments about a return engagement for his seat, saying he wouldn’t rule it out in 2012.

IN-06: With Mike Pence looking likelier that he’s up and out of the House after this term — although whether he’s running for Governor or President is unclear — Roll Call names some potential replacements. One is a blast from the past: ex-Rep. David McIntosh, who represented an earlier iteration of this district (then IN-02) from 1994 to 2000, when he lost the Governor’s race. Other names include Wayne Co. Sheriff Matt Strittmatter, former state Rep. Luke Messer (whom you might remember from narrowly losing the IN-05 primary to Dan Burton this year), and rich guy Don Bates (who finished 4th in the IN-Sen primary this year, and has also been rumored for a Richard Lugar primary challenge).

LA-SoS: Here’s an interesting career pivot: soon-to-be-ex. Rep. Joe Cao is considering a run for Louisiana Secretary of State. He’d face a primary against Tom Schedler, a Republican who will be acting SoS for the next year (current SoS Jay Dardenne is about to be sworn in as Lt. Governor) and will be running for a permanent slot next year. (H/t GOPVOTER.)

AK-Sen: AP Calls the Race for Murkowski

It’s all over but the tedious courtroom challenges, at least according to the AP, which called the Alaska Senate race within the last hour:

Ms. Murkowski emerged victorious after a painstaking, two-week count of write-in ballots showed she has overtaken tea party rival Joe Miller.

Her victory became clear when Alaska election officials confirmed they had only about 700 votes left to count, putting Ms. Murkowski in safe territory to win re-election.

Ms. Murkowski has a lead of about 10,000 votes, a total that includes 8,153 ballots in which Mr. Miller observers challenged over things like misspellings, extra words or legibility issues.

Joe Miller has maintained that he’ll stop fighting the race if the math doesn’t work in his favor, although it’s been clear for a week now that the math doesn’t work in his favor. He has also maintained that he’s going to keep pursuing legal action, although it’s unclear how long that’ll last once his financial backers do a cost/benefit analysis.

My take on the GOP tide on Florida’s Legislative and select local races – Part 1

As an impartial observer, I am really saddened by the extent the national GOP wave trickled into certain local races in Florida (I sat out this mid-term as elections in MS-02, where I’m living now is ultra-uncompetitive due to its obvious demographics), as it seems many voters allows their identification with the GOP and anger with Washington to cloud their judgement on state legislative and local races, conveniently ignoring the fact of longtime GOP control of the state legislature and certain county commissions.  The result:  A 28-12 GOP majority in the State Senate and a 81-39 GOP majority at the State House of Representative, the first veto-proof ones for the GOP since the Reconstruction.  Together with the all-GOP incoming cabinet, they will have unfettered power in the Sunshine State for the next four years.

Rant over, and here my list of the affected local races.  My second part of this series will deal with my takes on select legislative races and the geopolitical implications on the partisan makeup of the upcoming State Legislature.

In a few counties, notably in Tampa Bay and its environs, at least eight incumbent county commissioners seemingly lost only due to them being Dems – a cardinal sin in the eyes of the most stridently partisan GOP voters this year.  Here are the casualties (In alphabetical order of the counties):

Alachua County – Veteran local pol Cynthia M. Chestnut upset by GOP candidate Susan Baird at 54%-46%, largely due to rural and small-city voter backlash against the dominant Gainesville Dems.  These voters had a higher turnout compared to the Gainville voters on Nov 2.  Baird is the first GOP Commissioner in 22 years.

Broward County – Freshman Commissioner and County Mayor Ken Keechl was upset by Lighthouse Point Commissioner and former Broward GOP chair Chip LarMarca  by 49.8%-45.0%, with almost 5.2% taken by Chris Chiari, a former Democrat and two-time HD-91 candidate.  (HD-91 covers many of the coastal communities in County Commission District 4)  Admittedly, Broward’s County Commission was 9-0 Democratic since Keechl’s election in 2006 and LaMarca’s victory simply re-introduce a GOP voice to a overwhelmingly Dem body.  Keechl may also be hurt by the split Dem vote due to Chiari’s presence on the ballot, and the up-ticket coattails from CD-22, SD-25 and HD-91 (All contains some or all of these coastal communities in this District, and the GOP won all three races).  Finally, coastal Broward county is probably the most Republican part of Broward county due to the affluence of many residents there, and the District might be tough for Keechl to hold even in a more neutral year.  

Hernando County – GOP powerbroker and county GOP chair Blaise Ingoglia has finally completed his goal of removing Dems from the County Commission, after defeating Commissioners Diane Rowden and Chris Kingsley in 2008, an otherwise good year for Florida’s Dems.  Commissioner Rose Rocco lost her District 2 race to Wayne Dukes at about 60%-40%.  Looks like the most active voters tends to be GOP-leaning seniors.  With the county’s economy in dire straits, Ingoglia’s anti-tax/spending and pro-development messages seem to get really receptive ears.  As a result, the County commission is 100% GOP.  The Supervisor of Elections and Tax Collector are the only partisan elected county positions still held by Dems today, and the incumbents must feel lucky that they were not on the ballot two weeks ago.

Marion County – The only Dem in the County Commission, Barbara Fitos was defeated at about 49%-35% by GOPer Carl Zalak III, with two other candidates taking about 16% of the votes.

Pasco County

Pinellas County

Polk County

St. Lucie County

In addition, two well-respected former Tampa City Council members fall well-short in their bids

IL-08: Final Count Shows Walsh Up by 292 Votes

The counting is finally over:

By a miniscule margin of 292 votes, GOP challenger Joe Walsh emerged Tuesday as the apparent winner over U.S. Rep. Melissa Bean in their nail-biting 8th District congressional race.

Walsh, a Tea Party-backed conservative, led the three-term Democrat by 347 votes at the beginning of the day, but absentee and provisional ballots tallied Tuesday by election officials narrowed that margin even further.

There’s no word on whether Bean will seek a recount, but she has a press conference scheduled for tomorrow. Walsh, whose campaign was most noted before election day for its dramatic implosion, looks primed to be a one-term wonder before he meets the buzz-saw of the Democratic-controlled redistricting machine in Illinois.

UPDATE: Via the comments, Bean has conceded.

SSP Daily Digest: 11/16

AK-Sen: Nothing has really changed with the overall trajectory of the Alaska Senate race, but this is the first day that Lisa Murkowski has been able to claim a “lead” over Joe Miller (even though her victory has become increasingly clear each day). At the end of yesterday’s counting, she had 92,164 votes to Miller’s 90,448. 7,601 were subject to challenge but counted for her anyway (and, if Miller’s lawsuit succeeds, could get reversed), but based on Murkowski’s success at avoiding write-in challenges, is on track to win with or without those challenged ballots.

FL-Sen: George LeMieux, whose year-and-a-half in the Senate is about to expire, is leaving with more of a whimper than a bang, if PPP is to be believed: his approvals are 11/28 (with 61% with no opinion), including 14/24 among Republicans. He’s not looking like he’d have much impact in a challenge to Bill Nelson in 2012, which he’s threatened (which isn’t to say that Nelson is out of the woods, as a stronger Republican will no doubt come along). Among all the appointed Senators, he’s still faring better than Roland Burris (18/57) but worse than Carte Goodwin (17/22) and Ted Kaufman (38/33). (Oh, and if you’re still feeling like we lost out by not having Charlie Crist win the Senate race, guess again: Bob Dole! is reporting that Crist promised him he’d caucus with the GOP if he won the 3-way race. This comes after leaks in the waning days of the race that he’d caucus with the Democrats. Somehow, I expect any day now that Ralph Nader will reveal that Crist promised him that he’d caucus with the Green Party if he won the race.)

IN-Sen: Richard Lugar made it official; he’s running for re-election one more time. Lugar, who’ll be 80 in 2012, probably has more to worry about in the Republican primary than he does in the general election, where aspiring Democrats would probably be more interested in the open gubernatorial seat.

OH-Sen: Sherrod Brown will probably have a tougher re-election than his initial election, but it’s unclear which Republican he’ll face. The two who’ve gotten the most press are Mary Taylor, the current Auditor and newly-elected Lt. Governor, or Rep. Jim Jordan (a religious right fave from the state’s rural west), but another possibility that the article broaches is long-time Rep. Steve LaTourette, one of the House’s more moderate GOPers left. Either way, if Jordan or LaTourette were to try for the promotion, that would help the state GOP decide which of their seats to vaporize in the redistricting process (although LaTourette’s, in the northeast corner and surrounded by Dem seats, would be much harder to work with). Ohio’s losing two seats, though, and one more Dem seat is on the chopping block, especially since the biggest population losses have come in the northeast — the likeliest outcome seems to be consolidation of districts that sets up either a Dennis Kucinich/Marcia Fudge or Dennis Kucinich/Betty Sutton mash-up.

PA-Sen: The GOP feels like they have a shot against Bob Casey (who won by a near-overwhelming margin in 2006), given the state’s turn toward the red this year. The big question, though, is who? If Tom Ridge didn’t do it this year when it would have been a gimmee, he certainly isn’t any likelier to do it in 2012. Hotline mentions a couple current suburban Reps., Jim Gerlach and Charlie Dent, both of whom have tenaciously held down Dem-leaning districts that would be prime open seat battles if they left. Failing that, the bench looks pretty empty; they cite state Sen. Jake Corman as interested, as well as talk radio host and behind-the-scenes player Glen Meakem, who cited interest in running for 2010 but decided against it.

MN-Gov: Minnesota’s SoS (a Dem, Mark Ritchie) has laid out the timeline for the recount process. The race will be canvassed starting Nov. 23, and presuming a recount is necessary (which it will be unless something weird happens with the canvass, as Dem Mark Dayton leads Tom Emmer by less than one-half of a percent, triggering the automatic recount provision), the recounting will begin on Nov. 29.

MD-01: Nothing like teabagger hypocrisy at work: freshly elected with a mandate to destroy the federal government, Andy Harris’s first act in Washington was to demand all the free goodies from the federal government that he’s entitled to, so long as other people are paying for them. At freshman orientation, Harris was observed expressing dismay that his gold-plated health care plan takes a month to kick in.

NY-01, NY-25: Here are a couple more updates from overtime. In the 1st, Randy Altschuler’s lead over Tim Bishop is currently 383, but there are more than 11,000 absentees to be counted starting today, and since they’re all from one county (Suffolk), your guess is as good as mine how they break. In NY-25, Ann Marie Buerkle gained a tiny bit of ground as two GOP-leaning counties reported their absentees; she’s now up 729. Dan Maffei’s base, Dem-leaning Onondaga County, is about to start counting its 6,000 absentees. He should make up some ground, but he’ll need to average 56% among the remaining absentee ballots, while he’s only got 54% in Onondaga so far, though.

DSCC: Dianne Feinstein told the press that Michael Bennet is, despite his previous demurrals, going to be the next DSCC chair. Does Michael Bennet know this? He’s still saying no. The rest of the Dem leadership in the Senate (and the GOP, too) was elected without a hitch today, but the DSCC job still stands vacant.

CA-AG: Things keep looking up for Kamala Harris in California, after a torrent of new votes yesterday from Alameda County (where the Dem stronghold of Oakland is). That batch broke 18,764 for Harris, and only 5,099 for Steve Cooley, which may be a decisive moment in the count.

Chicago mayor: Rahm Emanuel is certainly looking like the early favorite in the Chicago mayoral race, courtesy of an Anzalone-Liszt poll commissioned by the Teamsters local (who haven’t endorsed yet). Emanuel is at 36, with Danny Davis at 14, Carol Mosely Braun at 13, Gery Chico at 10, James Meeks at 7, and Miguel del Valle at 4. Now you may be noticing what I’m noticing, that there’s significant splitting of the African-American vote here, and if you added Davis, Braun, and Meeks up into one super-candidate, they’d be in a dead heat with Emanuel. Well, don’t forget that this election uses a runoff, so chances are good we’ll see a head-to-head between Emanuel and one of the African-American challengers, and the poll finds Emanuel winning both those contests convincingly too: 54-33 versus Davis and 55-32 against Braun.

Open Thread: Comebacks

The Hill has a piece today about possible comeback attempts from defeated Democratic incumbents. Given the sheer volume of defeats, we’re bound to see some of these people return to office in some form or another, while others will quietly fade into obscurity. So let’s canvass your opinion: Are there any candidates — incumbents and challengers alike — who lost in 2010 (or 2008, for that matter) that you’d like to see try again for another office in the not-too-distant future? It could be the same seat they lost, or it could be something else. Let’s hear your ideas!

Redistricting California (revised)

My second attempt at redistricting California. I scrapped my first attempt, because it didn’t look quite like something the commission would do in most places, after reading some comments and taking a second look, I saw many flaws. Now this map isn’t perfect and I’m not as good at this as some other members, but I did my best and it looks a lot better than the last one. It’s probably 75% close to what we might see from the commission.

Revision: I modified some of the Central Valley and Bay Area Districts.

Goals:

Avoid county and city splitting where possible.

Attempt to follow communities of interest.

Keep lines looking as clean as possible.

Possible Incumbent face offs:

Garamendi vs. Lungren

Honda vs. Stark

Cardoza vs. Denham

Gallegly vs. Sherman

Napolitano vs. Sanchez

Davis vs. Bilbray (rematch)

Uploaded with ImageShack.us

CA-1: (Blue)

OPEN

Obama 50%, McCain 47%.

This district includes much of the old CA-1 and CA-2. It compacts this part of the state, which was previous very gerrymandered. It’s the definition of a swing district, with a PVI of R+1. I have no idea who would run here on the Democratic side, but there are several Republican legislators who have been termed out who could make of a go of it.

CA-2: (Green)

Mike Thompson

Obama 65%, McCain 33%

Mike Thompson’s district gets a whole lot smaller, as it shrinks down to include just Napa, Solano and a portion of Yolo County.

CA-3: (Purple)

Wally Herger

McCain 51%, Obama 46%

Herger’s hometown of Chico is still here, as well as some previously represented territory, but it’s more squared off to look compact. I couldn’t get the population just right on this one, but I estimate that new population numbers would probably allow for this district to balance out.

CA-4: (Red)

Tom McClintock

McCain 55%, Obama 43%

McClintock loses some counties in the north and picks up some other counties to further south. Inyo, Alpine and Mono are always hard to place because of their position, I can’t be sure where the commission would place them, but this wouldn’t be an unreasonable place. Population was a little off here too, but it would likely balance out with new census numbers.

Uploaded with ImageShack.us

CA-5: (Gold)

Doris Matsui

Obama 69%, McCain 29%

Not much to say here, it’s practically the same as it was before.

CA-6: (Teal)

Lynn Woolsey

Obama 76%, McCain 22%

Another one that I can’t say much about, as it’s almost exactly the same.

CA-7: (Gray)

George Miller

Obama 71%, McCain 27%

Strictly a Contra Costa County district. Much more compact than the previous incarnation.

CA-8: (Violet)

Nancy Pelosi

Obama 85%, McCain 13%

Takes in more of San Francisco.

CA-9: (Electric Blue)

Barbara Lee

Obama 88%, McCain 10%

Not much change, just picks up some territory from the old CA-13.

CA-10: (Hot Pink)

John Garamendi, Dan Lungren

Obama 50%, McCain 48%

Garamendi and Lungren are thrown together here for a compact, Sacramento County district. Garamendi is a strong candidate and he has the potential to defeat Lungren, who would be at somewhat of a disadvantage without Amador and Calaveras Counties, which are now in CA-4.

CA-11: (Electric Green)

Jerry McNerney

Obama 66%, McCain 32%

This district includes most of it’s old territory in Alameda and Contra Costa Counties, as well as picking up Hayward and some other places. The Commission might opt for a different formation, but if they want to make the Bay Area look as clean as possible, this is the best route for CA-11.

CA-12: (Medium Pastel Blue)

Jackie Speier

Obama 74%, McCain 25%

A bit of San Francisco and almost all of San Mateo County,

CA-13: (Salmon)

OPEN

Obama 60%, McCain 38%

Stockton gets it’s own district. It also includes a portion of Contra Costa Counties, leftovers from what I had from making the other districts. Not sure who would run here, but my revised version is now D+7. Still could be a swing district.

CA-14: (Camouflage)

Anna Eshoo

Obama 73%, McCain 25%

Drops parts of Santa Cruz and San Mateo Counties to become a compact Silicon Valley district.

CA-15: (Orange)

Mike Honda, Pete Stark

Obama 71%, McCain 27%

Two more incumbents drawn together, this time it’s two Democrats. There just wasn’t enough growth around here to sustain every district in a compact way. Stark may opt to retire.

CA-16: (Bright Green)

Zoe Lofgren

Obama 67%, McCain 31%

Lots of San Jose, along with Gilroy and Morgan Hill.

CA-17: (Dark Purple)

Sam Farr

Obama 72%, McCain 25%

All of Santa Cruz and Monterey Counties are unified here, with a portion of Santa Clara.

CA-18: (Yellow)

Dennis Cardoza, Jeff Denham

52% McCain, 47% Obama

Yet another pair of incumbents thrown together. This would be a hard climb for Cardoza, so he might opt to run in another district, like the new CA-13 or CA-19, which I’m discussing next.

CA-19: (Lime)

OPEN

50% Obama, 48% McCain

Now cut down to do just Stanislaus and a portion of San Joaquin. Very much a swing district, but Dennis Cardoza could win it if he moved here.

CA-20: (Pink)

Jim Costa

54% Obama, 44% McCain

Fresno County won’t fit in one district, so I had to figure out how to split it in sensible way. This takes in all of the city of Fresno itself, along with some outlying areas.I also took into account Hispanic voters, with all the other Central Valley districts being majority or plurality white, I think there would have to be  one Hispanic majority or at least plurality district in the Central Valley. The commission will be traveling and getting input, that might be one of the concerns raised by Hispanics in the Central Valley

CA-21: (Dark Red)

Devin Nunes

59% McCain, 39% Obama.

Nunes keeps all of Tulare, but picks up Kings and some of Kern in place of portions of Fresno.

CA-22: (Brown)

Kevin McCarthy

56% McCain, 42% Obama

Finally, a district completely within Kern County.

Uploaded with ImageShack.us

CA-23: (Aqua)

Lois Capps

57% Obama, 41% McCain

Almost identical to a previous incarnation of the district, which was a swing district. It’s D+4 and that’s close to swing territory, but Santa Barbara proper has trended very Democratic over the past couple of cycles and the PVI might rise a little more over time.

CA-24: (Deep Purple)

OPEN

58% Obama, 41% McCain

This one has the potential to be a swing district, but Democratic leaning Oxnard might prevent that. State Senator Fran Pavley of Agoura Hills could win this district handily. I do know of one Republican who could win it and that would be Ventura County Supervisor Linda Parks of Thousand Oaks, who is very moderate (I voted for her). A Pavley vs. Parks battle would be epic. State Senator Tony Strickland or his wife,  soon to be former Assemblymember Audra Strickland might make a run for it, but they probably are too conservative for the district.

Uploaded with ImageShack.us

CA-25: (Magenta)

Buck McKeon

McCain 49%, Obama 48%

This PVI drops from R+6, to just R+3. Lots of minorities have moved into the Antelope Valley and High Desert, setting it on a track to turn blue. McKeon would be fine here, but when he retires, it would  be a potential Democratic target.

CA-26: (Dark Gray)

David Dreier

Obama 60%, McCain 38%

This goes from R+3 to D+7 just by making it more compact, which proves of crazily gerrymandered the other incarnation was. David Dreier would probably attempt to run here, but a good Democrat would defeat him hands down. Gary Miller also lives here, but it doesn’t include any of his other territory.

CA-27: (Fluorescent Green)

Brad Sherman

Obama 58%, McCain 40%

A lot of this was just leftovers from other districts. Sherman keeps most of his territory in the valley and picks up parts of Ventura County that wouldn’t fit in CA-24. Some of these areas have been paired up in the past. Elton Gallegy was about to retire some years ago, he might actually do that as opposed to running in this district.

CA-28: (Light Purple)

Howard Berman

Obama 72%, McCain 26%

Not too different than Berman’s current district, just a little more compact.

CA-29: (Dollar Bill)

Adam Schiff

Obama 64%, McCain 34%

A little less Democratic to be more compact, but still about the same district.

CA-30: (Burnt Sienna)

Henry Waxman

Obama 76%, McCain 22%

Nothing much to say about this one, it’s just more compact.

CA-31: (Vanilla)

Xavier Becerra

Obama 77%, McCain 21%

Includes much of Los Angeles and some outlying communites.

CA-32: (Medium Orange)

Judy Chu

Obama 68%, McCain 30%

Getting clean district lines in this part of Los Angeles County was hard, but I think I did a fairly good job of it here.

CA-33: (Denim Blue)

Karen Bass

Obama 85%, McCain 14%

It shrinks down some, but isn’t hugely different.

CA-34: (Emerald)

Lucille Roybal-Allard

Obama 85%, McCain 13%

Still holds portions of East Los Angeles and surrounding communities.

CA-35: (Purple)

Maxine Waters

Obama 85%, McCain 14%

Nothing much changed, only more compact.

CA-36: (Yellow Orange)

Jane Harman

Obama 63%, McCain 35%

Picks up Santa Monica and more the Palos Verdes Peninsula.

CA-37: (Blue)

Laura Richardson

Obama 78%, McCain 21%

Nothing much different here.

CA-38: (Sea Green)

Linda Sanchez, Grace Napolitano

Obama 61%, McCain 37%

Put together all of the gateway cities of L.A. County. Would likely be a bellwether district. I’d expect Napolitano to challenge Sanchez in the primary, Sanchez would have an edge because more of her old district is included.

CA-39: (Burgundy)

Ed Royce

McCain 54%, Obama 44%

Pulls together Fullerton, Orange, Yorba Linda and parts off Anaheim.

CA-40: (Bright Green)

OPEN

Obama 57%, McCain 41%

All the cities in the tail of San Bernardino County come together with Pomona for one compact district. Assemblymember Norma Torres would be a good recruit for the Democrats here.

Uploaded with ImageShack.us

CA-41: (Chocolate Brown)

Jerry Lewis

McCain 54%, Obama 44%

Almost no changes here, except it takes in all of empty San Bernardino County.

CA-42: (Fuchsia)

Joe Baca

Obama 63%, McCain 35%

Now includes Rancho Cucamonga. Was a swing district drawn like this in the past, but it’s majority-minority and should be a hold for Democrats.

CA-43: (Magenta)

Ken Calvert

Obama 53%, McCain 45%

Bill Hedrick ran strong in the current version which is very gerrymandered, so under lines that just contain this portion of Riverside County, he could win. Ken Calvert needed the Orange County portions to be safe, without them, it’s a different ball game.

CA-44: (Cyan)

Mary Bono Mack

Obama 55%, McCain 43%

This district would very likely elect a Democrat under these lines and I’m positive the commission will draw a district here, just because there is so much population and no place to go but a new district. Steve Pougnet, who ran in 2010 against Mary Bono Mack, would have a much better chance here. Mack may run here, but she does have another option that I’m about to discuss.

CA-45: (Baby Blue)

OPEN

McCain 54%, Obama 44%

A nice, compact district and probably a sure bet from the commission. Mary Bono Mack might run here, even though she’s from Palm Springs which is now in the new CA-44. It’s been said that she actually lives in Florida, so residency probably isn’t a big deal to her.

CA-46: (Coral)

Dana Rohrabacher

McCain 49%, Obama 49%

This district got a little more narrowly divided than the previous one. Looks pretty much the same, but it loses the Palos Verdes Peninsula, picks up some areas from the old CA-40 and a small portion of Long Beach. It looks very compact, but the commission might got another route.

CA-47: (Periwinkle)

Loretta Sanchez

Obama 58%, McCain 40%

Gets slightly less Democratic as I put in most of Garden Grove. I didn’t bother with this one too much, because the commission might have to leave it majority Hispanic.

CA-48: (Copper)

John Campbell

Obama 51%, McCain 48%

Gets a little more Democratic as it grabs Costa Mesa, while shedding some territory to CA-39 and CA-49.

Uploaded with ImageShack.us

CA-49: (Brick)

Darrell Issa

McCain 54%, Obama 44%

Goes into Orange County, instead of Riverside County like in the previous incarnation. Looks reasonably good for communities of interest.

CA-50: (Cream)

Susan Davis, Brian Bilbray

Obama 62%, McCain 36%

I attempted to divide San Diego County more evenly, including the city proper. I put most of the coastal cities here with some of San Diego proper. It looks as if it would be a bellwether district for the statewide vote. I think Susan Davis would prevail here.

CA-51: (Light Blue)

Bob Filner

Obama 62%, McCain 36%

I took out Imperial County and shrunk Filner’s district down to a Chula Vista centered one.

CA-52: (Forest Green)

OPEN

Obama 52%, McCain 46%

Another swing district, with an almost even PVI, it could go either way. Imperial County is always going to be attached to a district that is anchored to some larger density places, I thought it looked best in this district.

CA-53: (Light Gray)

Duncan Hunter Jr.

McCain 52%, Obama 46%

Should be fairly safe Republican district, although it is slightly less Republican than Hunter’s old district.

Maps without county and city lines.

Uploaded with ImageShack.us

Uploaded with ImageShack.us

Uploaded with ImageShack.us

Overall, that would be almost a net gain of 6 for the Democrats, just from drawing more compact districts. In reality, it will probably be 4 or 5, because I’m sure the Central Valley will turn out a bit differently than I had it, but there will nonetheless be another swing district up no matter how they draw it.

Washington Redistricting v.2.0

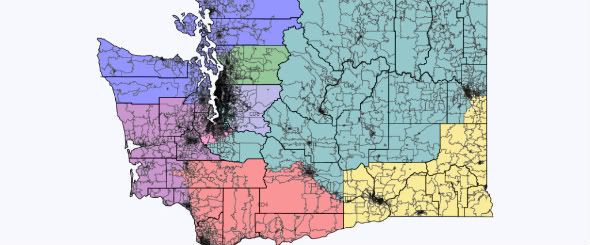
Earlier this year I posted a diary creating a 10 district Washington State. With the update to Dave’s Redistricting, I thought I would update my proposed redistricting map of Washington.

Washington has a bipartisan commission for redistricting, so at best the map is going to strive for balance or the creation of swing districts.

Photobucket

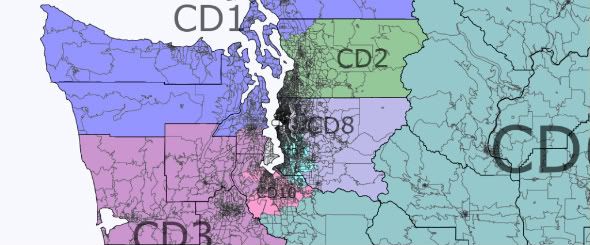
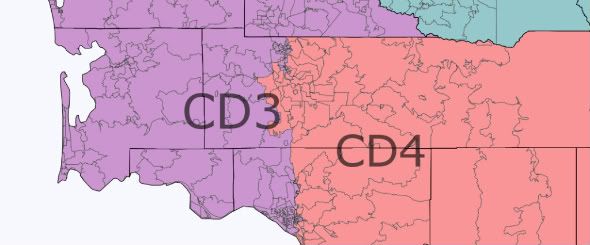
In this map, I make a return to the delegation maps of the 1960s, where the 2nd Congressional district connected Whatcom County along the Canadian border with Clallam County along the Pacific Ocean. (Actually, that district contained all or portions of Clallam, Island, Jefferson, King, San Juan, Skagit, and Snohomish Counties). Also in this map, the new 10th CD is an Tacoma (Pierce County) based district while the 3rd CD connects Bremerton with the Pacific Coast. Should this map be adopted, I would think that the delegation would be 7-3, and possibly 9-1 in a strong Democratic year if and as the cities Spokane and Yakama trend towards Democratic candidates.

Photobucket

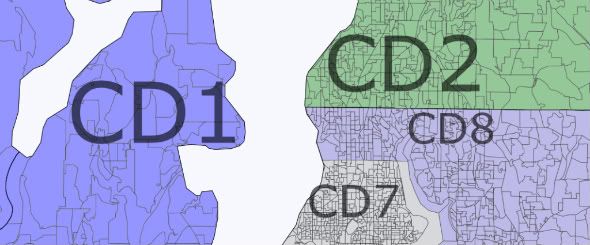
CD 1 – Inslee (D – Bambridge Island) or open

White – 82%
Asian – 3%
Hispanic – 5%

Photobucket

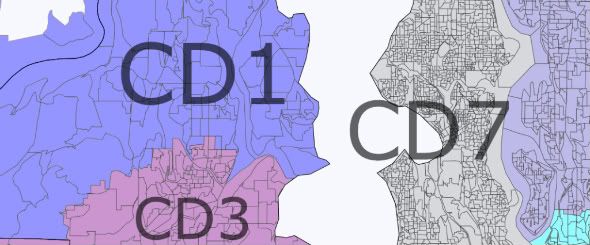
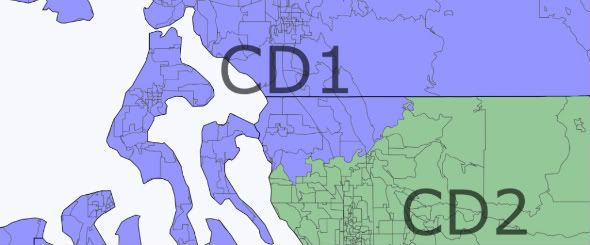
As I wrote in the introduction, the 1st CD connects Whatcom County in the north with Jefferson County along the Olympic Peninsula. The district is connected via the Keystone to Port Townsend ferry. The district also includes the northern half of Kitsap County (Kingston and Bambridge Island), extending to the southern edge of Bremerton.

The district will be a swing (at worse) district that leans Democratic. Of the counties in the new district, Jefferson, Kitsap, and Whatcom county voted for Patty Murray, while Clallam still gave her 46%. While Rick Larsen won a squeaker in 2010, most of the Republican leaning area of his district (East Snohomish County) is now in the 2nd CD.

CD 2 – Larsen (D – Lake Stevens)

White – 83%
Asian – 6%
Hispanic – 5%

Photobucket


The 2nd is now entirely in Snohomish County. The only City not in the CD is Stanwood.

The district should be a sold Democratic district. There are 4 Democrats on the Snohomish County Council and 1 Republican. A portion of the Republican district is not in the 2nd CD, while the districts of the remaining 4 Democrats are in. Still, there is a potential for an upset in a bad year, but Patty Murray did win 51% of the vote in Snohomish County.

CD 3 – Norm Dicks (D – Bremerton)

White – 85%
Asian – 3%
Hispanic – 5%

The 3rd CD connects Bremerton in Kitsap County to Longview and Kelso in Cowlitz County. The district includes Olympia and Centralia and Chehalis in Lewis County (the district splits Lewis and Cowlitz counties [mostly down 1-5]). The district also includes Gig Harbor in Pierce County.

With Olympia and Bremerton, and as well as the Democratic lean along the Pacific Ocean (Murray won in Pacific, Gray’s Harbor, and Thurston counties), the district should remain a Democratic one.

Photobucket

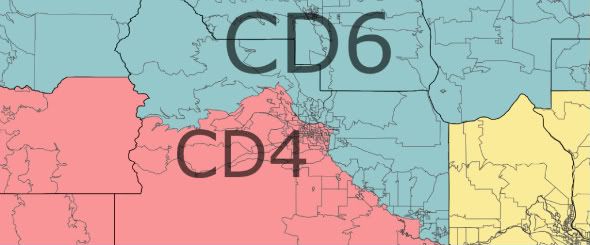
CD 4 – Jamie Herrara (R – Camas)

White – 79%
Hispanic – 13%

The 4th CD is a Columbia River district and extends north to the City of Yakama.

Photobucket

For the near term, this would be a Republican district. Over time, it is possible that the City of Yakama returns to its Democratic roots (the area did elect Jay Inslee in 1992) and with Vancouver, become a Democratic-performing district.

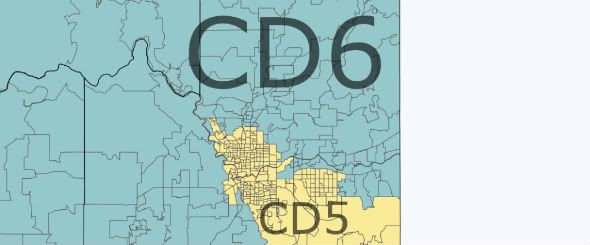
CD 5 – Cathy McMorris-Rodgers (R – Spokane)

White – 83%
Hispanic – 10%

It may not be possible to elect a Democrat east of the Cascades, but combining the Tri-Cities with Spokane may be the only way to do so. The district includes the cities of Spokane and Spokane Valley in Spokane County, but nothing to the west or north.

The district does have the advantage of placing Representative Hastings (Pasco) and McMorris-Rodgers into the same district (but I would not expect them to run against each other).

Photobucket

CD 6 – Open or Doc Hastings (R – Pasco)

White – 79%
Hispanic – 15%

This 6th CD takes in all of the rest of Eastern Washington not in the 4th or 5th and supplements that population with a small portion of Eastern Pierce County. This is a solid Republican precinct.

CD 7 – Jim McDermott (D – Seattle)

White – 68%
African American – 8%
Asian – 13%
Hispanic – 6%

This is the City of Seattle and Vashon Island. Not much to say here (except this would be one area where having city boundaries on v.2.0 would be especially nice).

CD 8 – open

White – 82%
Asian – 9%
Hispanic – 4%

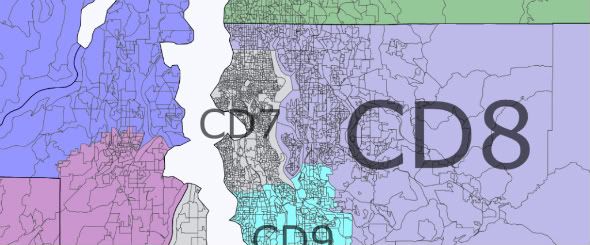
This district is the district that any of the challengers to Dave Reichert would have wanted. In the north, all of the northern King County cities (and reliably Democratic) (Shoreline, Lake Forest Park, Kenmore, Kirkland, Redmond), combine with Bellevue to balance the Republican portion of east King County.

Photobucket

CD 9 – Dave Reichert (R – Auburn)

White – 71%
African American – 6%
Asian – 10%
Hispanic – 7%

Photobucket

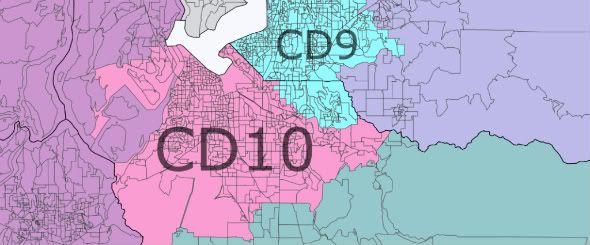
The 9th CD retains most of its current form, extending north to Renton and east to Auburn, while it loses most of its portion of Pierce County. What remains is all (or most of the south end of King County – a distinct region in King County politics).

This swing district that never really swung, becomes a more solidly Democratic district.

CD 10 – Adam Smith (D – Tacoma)

White – 73%
African American – 8%
Asian – 7%
Hispanic – 6%

The district includes Tacoma and portions of South and East Pierce County.

Pierce County is a swing County, but the Republican portions of Pierce County are not in this CD. The 6th CD has lots of east Pierce, and the 9th has a chunk of north-central Pierce County. A Democrat should retain this seat.

Photobucket

At the end of the day this map is compact, yet would probably yield a 7-3 Democratic split in the delegation most years. If there was another Republican wave, potentially 2 more Democrats could be endangered – in a Democratic wave, 2 Republicans would be endangered.

By what margin will Bob Shamansky win?

View Results

Loading ... Loading ...