MO-Sen: GOP Primary Poll Has Steelman Leading

Public Policy Polling (PDF) (3/6-9, “usual Missouri Republican primary voters,” no trendlines):

Sarah Steelman (R): 31

Todd Akin (R): 24

Ed Martin (R): 9

Ann Wagner (R): 2

Undecided/other: 34

Sarah Steelman (R): 37

Ed Martin (R): 18

Ann Wagner (R): 11

Undecided/other: 34

(MoE: ±4.9%)

I don’t have much to say here except that the primary vote share (either with or without Akin) almost perfectly correlates with how well known these candidates are – as in, a correlation of 1. Put another way, if you add each person’s “don’t know” share on the favorable/unfavorable question to their vote share on the horserace question, you get just about the same number for all candidates. This says to me that Ed Martin has a lot of work to do to get his name out there, and that Todd Akin (who has only just now ramped up to “considering” status) should not be scared off by Sarah Steelman’s early lead.

And just for fun:

Mike Huckabee (R): 29

Newt Gingrich (R): 19

Sarah Palin (R): 14

Mitt Romney (R): 13

Ron Paul (R): 7

Mitch Daniels (R): 4

Tim Pawlenty (R): 3

Haley Barbour (R): 2

Other/undecided: 10

(MoE: ±4.9%)

SSP Daily Digest: 3/17

NM-Sen (PDF): What happens if you took a poll and no one answered? That’s what this Tulchin Research poll (taken on behalf of the Defenders of Wildlife) feels like to me, what with its sample size of just 213 likely Democratic primary voters. If you’re trying to figure out the margin of error, you’ll need to start counting on your other hand – it’s 6.7%. Anyhow, the results, such as they are: 1st CD Rep. Martin Heinrich: 32; Lt. Gov. Diane Denish: 25; 3rd CD Rep. Ben Ray Luján’s: 15; State Auditor Hector Balderas: 5; and 24% undecided. I think it’s very unlikely that the field would develop this way, but I still think these “round up the usual suspects” polls can be valuable – if they have enough respondents, that is.

OH-Sen: This kind of speculation is always seriously moronic… but hey, I live to serve. So in case you want to imagine a world where the Republican presidential nominee wins next year, and he’s picked Sen. Rob Portman as his running mate, Roll Call is happy to indulge your grim dystopian fantasy about a suddenly open Senate seat in Ohio come Jan. 20, 2013.

WV-Gov: Democratic State House Speaker Rick Thompson just earned the endorsement of two teachers’ unions:  The West Virginia Federation of Teachers and the West Virginia Education Association. The primary here for this oddly-timed special election (necessary because of ex-Gov. Joe Manchin’s Senate victory last year) is coming up very soon, May 14th.

CT-05: Kevin Rennie mentions a couple of possible Democratic prospects to replace Rep. Chris Murphy, who of course is running for Senate. One is 28-year-old pr strategist Dan Roberti, whose father Vincent was once a state rep. The other is CNBC reporter and former local news anchor Brian Schactman.

NV-02: A piece in the WaPo has 2006 and 2008 Dem nominee Jill Derby sounding pretty interested – she said she’s considering forming an exploratory committee. (Ridiculous as that sounds – I mean, she’s considering whether to consider? – that actually counts as pretty aggressive talk in this hyper-cautious age.) The story also mentions another possible name, Assemblywoman Debbie Smith, as well as noting that state Treasurer Kate Marshall (whom we flagged as another potential candidate yesterday) calling the race “absolutely winnable.”

NY-26: Republican Jane Corwin has her first ad out (NWOTSOTB), in which she repeatedly touts her supposed small business credentials but doesn’t mention that she’s a Republican. In some not-so-happy news, New York’s Green Party is saying they are likely to endorse Ian Murphy, the guy behind the fake David Koch call to WI Gov. Scott Walker, as their nominee. That means they probably won’t cross-endorse whoever winds up being the Democratic nominee… and that signals a long four years ahead of us. (Thanks to scoring 50,000 votes in last year’s gubernatorial election, the Greens get an automatic ballot spot in every race in the state through 2016.) Green Party co-chair Peter LaVenia says he doesn’t think that Murphy will “siphon votes” from the Dem… oy, christ, this is giving me nightmarish flashbacks to debates with idiotic Naderites in 2000. I can’t do this again.

Wisconsin Recall: Let’s talk about Randy Hopper. If you’ll click the link, you can hear a ridiculously misleading radio ad that he’s just gone up with. The lying isn’t the point – it’s the fact that he’s on the defensive, a place you never want to be. And he knows, it, too – which is why he’s gone out and hired Jeff Harvey, who most recently managed Rep. Dave Reichert’s (WA-08) successful campaign last year. That’s a pretty big gun to bring in to a state lege race, so how can Hopper afford something like that? Well, state Senate Majority Leader Scott Fitzgerald and several lackeys (including recall target Alberta Darling) were in DC last night, picking up cash at a high-dollar fundraiser held at Haley Barbour’s lobbying firm (more-or-less in exchange for gunning through that infamous bit of right-to-work legislation). The optics couldn’t be better! But cold, sweet cash can move mountains.

In related news, HuffPo’s Sam Stein tries to track down elusive information about the state of the attempted recalls of Democratic senators. It sounds like it’s going poorly: An uncoordinated mess by different groups which launched different efforts at different times. The Wisconsin Republican Party has refused to get involved, and apparently the recall has been whittled down to just three target senators (from the original eight). I would not be hugely surprised if they would up with zero.

Philly Mayor: This is pretty funny: Philadelphia Mayor Michael Nutter faces no real primary opposition, but he’s still trying to bounce the crazy brother of former Mayor John Street, Milton, from the ballot. Among other things, Nutter is alleging that Street doesn’t meet the residency requirements, which say that candidates have to live in the city for three years prior to the election. Where was Street? Serving a 30-month sentence in federal prison on tax evasion charges – in Kentucky.

SF Mayor: SurveyUSA has a poll out for the San Francisco mayoral race slated for this November. SF uses instant run-off voting (IRV), so SUSA asked people to pick their first, second, and third choices. Interim Mayor Ed Lee (who filled in for Gavin Newsom when he won the Lt. Gov. race last fall) says he isn’t running but actually gets the most first-choice votes. Here’s the full field:

Ed Lee, interim Mayor, 17%

Michaela Alioto-Pier, former Board of Supervisors member, 12%

Leeland Yee, State Senator, 11%

David Chiu, Board of Supervisors President, 10%

Dennis Herrera, City Attorney, 9%

Bevan Dufty, former Supervisor, 8%

Click through the link to see second and third choices.

DCCC: Steve Israel talked a bunch with the Hotline about candidate recruitment. The most interesting thing is his “alumni association” of former members of Congress who are thinking about running again. He holds “semi-regular” (Hotline’s phrase) conference calls with “the vast majority of former members.” Israel says that in recent weeks, interest and attendance has spiked, and I have to guess that recent Democratic enthusiasm inspired heavily by protests in the Midwest has been a factor. Israel also insists that ex-MoCs who have closed down their campaign accounts or taken lobbying jobs are not necessarily taking themselves out of the game; he sympathetically argues that some folks simply need the cash. Of course, optics aside, K Street might just seem a lot more comfortable than the campaign trail grind to many of these folks

DNC: The usual unnamed Democrats are telling Politico they think Ted Strickland is a “strong contender” to replace Tim Kaine at the DNC if the latter decides to run for the Senate in Virginia. I think the world of Strickland, but I’d hate to see his considerable talents get muzzled at the DNC. I just don’t think that a proud populist is going to be able to speak his mind while at the Obama DNC.

Votes: Dave Catanese has a run-down on the House members seeking (or likely to seek) statewide office and how they voted on the most recent temporary budget bill. A big swath of Republicans voted “no” (i.e., against their party), after having previously voted for the prior continuing resolution, likely out of fears of getting teabagger (because the bills don’t cut spending enough). Meanwhile, several Democrats in the same boat all voted “yes.”

WATN?: My word:

A seven-count indictment accuses Tom Ganley, a high-profile auto dealer and onetime congressional candidate, of kidnapping a 39-year-old Cleveland woman and having sexual contact with her.

Ganley, 68, faces three felony charges of gross sexual imposition, and single counts of kidnapping, abduction, solicitation, and menacing by stalking, according to Ryan Miday, a spokesman for County Prosecutor Bill Mason.

Redistricting Roundup:

Mississippi: Looks like Lt. Gov. and gubernatorial aspirant Phil Bryant is getting his ass handed to him. Bryant attempted to interfere with the state Senate’s attempt to draw a new map by instead offering his own. Bryant’s plan was rejected by the Senate (which we noted on Tuesday). Now, the Senate’s original plan has been adopted by the House. So it looks like an incumbent-protection deal has been reached, with the Democratic-held House and the Republican-controlled Senate each getting their way. But even with a Dem gerrymander, you’ve got to believe it’s only a matter of time before the House falls, too.

General: Politico has a piece discussing the GOP’s overall strategy of playing it safe with redistricting this decade, and to avoid “dummymanders” like the one in Pennsylvania which proved (at least temporarily) disastrous to the party.

Maryland Population Shifts by State Senate District

So yeah, lately in my few spare moments I’ve been working on the perfect Maryland legislative redistricting map. Before I release that though, I want to talk a little about the thought process that goes into such a map. Today’s diary will show how the population in Maryland has shifted over the past decade, and what this will mean for redistricting in my beloved home state.

To start, I made a map using Census 2010 colors, that shows how the state’s districts have grown over the past decade.

From this map we can make several conclusions:

– Given that the state growth rate was around 9%, it makes sense that most districts would be in the 5-15% range.

– Growth in traditionally high-growth exurbs of Baltimore (Carroll, Harford, northern Baltimore County) slowed to the state average this decade.

– Many of Baltimore’s inner suburbs stagnated (although this is an improvement for Essex/Dundalk, which had been losing population for decades)

– 5 of Baltimore City’s 6 districts lost significant population, guaranteeing the loss of a State Senate district. The one that actually did post a modest gain, District 46, is the one most likely to be abolished given that it’s the only non-majority black district in Baltimore City.

– The only district to lose population outside of Baltimore City was majority-black District 24 in Prince George’s County. Every district in MD that lost population over the past decade was majority-black.

This might be worth exploring in a later diary, but the correlation coefficient between %black and %growth was -.54, while for whites it was .42, Asians .39, and Hispanics .05

– The highest growth area of the state by far is the I-270 corridor in Frederick/Montgomery Counties. District 15 gained an amazing 28%, while District 3 gained 25%.

– Other areas growing significantly faster than the state average include:

     – the western Baltimore suburbs (9 and 11)

     – Gaithersburg/Rockville (17)

     – Southern Maryland (27, 28, and 29)

     – Outer Prince George’s County (21 and 23)

     – the Upper Eastern Shore (36) – mostly from high growth around Elkton and Kent Island

– Although growth stagnated in the inner DC suburbs, the balance of power in the state continues to shift towards DC.

Redistricting Implications

Growth isn’t everything. Another important consideration is the extent to which current districts are over or under population. Under the law, districts must be within 5% deviation of the mean population. The following map shows what districts are over, under, or acceptable.

From this map, one can see that inner Baltimore and DC suburbs districts will need to expand, while the outer suburban and rural districts will need to contract.

Side Note about Deviation

It’s important to note that a lot of the underpopulated districts started out with fewer people in 2000. Here’s a map showing which districts were drawn to be over and under the median (but within 5%) in 2000.

As you can see, the Democratic Party has used acceptable deviation as way to slightly maximize the influence of its most loyal counties – Prince George’s, Montgomery, and Baltimore City. Expect to see deviation put to good use in my map, as well as in the map that eventually gets drawn.

Conclusion

So yeah, that’s it. I hope this gets a few people talking and/or thinking. Before I release my perfect legislative map, I’m thinking about writing a diary on the history of Maryland legislative redistricting, so be on the lookout for that as well.

AZ Congressional Redistricting

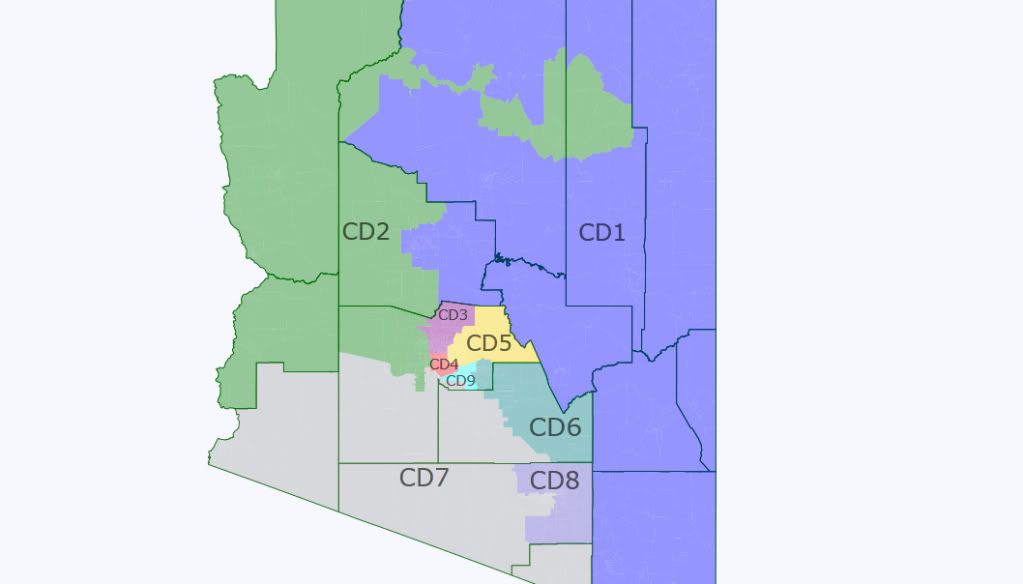
The 2010 census data recently came out for Arizona. I haven’t seen any maps since then, so I wanted to try to guess what the commission will do to get the ball rolling.  I don’t have much local knowledge of Arizona, so if I have butchered something, please let me know!

Photobucket

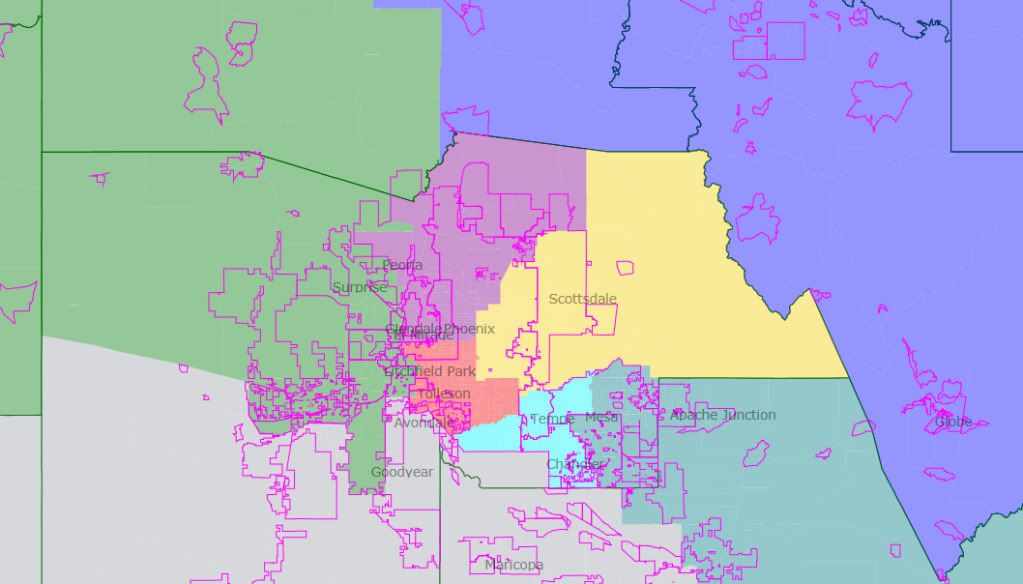
Photobucket

1st District- Paul Gosar (R)

New District VAPs

White:      64.1%

Black:      01.4%

Hispanic:   15.2%

Asian:      01.2%

Nat. Am.:   16.8%

Old District VAPs

White:       62.3%

Black:       01.6%

Hispanic:    16.9%

Asian:       01.2%

Nat. Am.:    16.6%

This district gets a bit whiter as it drops its portion of Pinal County in exchange for conservative Cochise County.  I think this change is justifiable as it allows the 8th to become a more Tucson-centric district.  The PVI probably shifts a point or two to the right, making the district R+7.  Even though Democrats held this seat until this year, I think it would be tough to recover.

2nd District- Trent Franks (R)

New District VAPs

White:      70.0%

Black:      03.5%

Hispanic:   20.1%

Asian:      02.2%

Nat. Am.:   02.8%

Old District VAPs

White:      74.1%

Black:      03.2%

Hispanic:   16.8%

Asian:      02.7%

Nat. Am.:   01.8%

This district had to shed about 150,000 people.  Because the district has to take in the Hopi reservation, all of the loss came in metro Phoenix.  The district also picks up La Paz County from the 7th.  I’m not sure that Trent Frank’s portion of Glendale is in the district, but it contains most of his old territory.  Though the district gets less white, its PVI is probably around R+9.  

3rd District- Ben Quayle (R)

New District VAPs

White:      76.8%

Black:      03.0%

Hispanic:   14.2%

Asian:      03.6%

Nat. Am.:   01.0%

Old District VAPs

White:      74.9%

Black:      03.0%

Hispanic: 15.9%

Asian:      03.6%

Nat. Am.: 01.2%

This district has shifted a bit east and includes Peoria and portions of Phoenix and Glendale.  The PVI is probably unchanged at R+9.  Even with Ben Quayle, this district would be hard to win.

4th District- Ed Pastor (D)

New District VAPs

White:      25.0%

Black:      09.2%

Hispanic:   60.0%

Asian:      02.9%

Nat. Am.:   01.7%

Old District VAPs

White:     27.3%

Black:     08.9%

Hispanic:  57.6%

Asian:     02.6%

Nat. Am.:  2.2%

The district takes in central Phoenix and southern Glendale.  It is not much changed and should be a safe Democratic district.

5th District- David Schweikert (R)

New District VAPs

White:      75.7%

Black:      02.8%

Hispanic:   15.4%

Asian:      03.0%

Nat. Am.:   01.8%

Old District VAPs

White:      73.8%

Black:      03.7%

Hispanic:   14.0%

Asian:      04.7%

Nat. Am.:   02.2%

The district loses Tempe and a portion of Phoenix to the south, becoming a Scottsdale-centric district.  I’d guess it also becomes a bit more Republican with a PVI of R+7.  This district would be hard for a Democrat to pick up.

6th District- Open

New District VAPs

White:      76.9%

Black:      02.7%

Hispanic:   14.7%

Asian:      03.0%

Nat. Am.:   01.4%

Old District VAPs

White:      73.7%

Black:      03.0%

Hispanic:   17.2%

Asian:      03.9%

Nat. Am.:   00.9%

The district loses a portion of western Mesa and all of Chandler and picks up more of eastern Pinal County.  This monstrously Republican district probably becomes even more so.  It has no incumbent due to Jeff Flake’s Senate run.

7th District- Raul Grijalva (D)

New District VAPs

White:      38.3%

Black:      03.2%

Hispanic:   51.2%

Asian:      01.7%

Nat. Am.:   04.6%

Old District VAPs

White:      38.7%

Black:      03.6%

Hispanic:   50.1%

Asian:      02.2%

Nat. Am.:   04.1%

This district loses La Paz County and a bit of Tucson while adding western Pinal County.  On balance, it becomes slightly more Hispanic.  The PVI is probably similar to the current D+6.  Since he won in 2010 after urging a boycott of the state, I have to assume he’ll be safe in this district.

8th District- Gabriele Giffords (D)

New District VAPs

White:      71.6%

Black:      03.1%

Hispanic:   19.1%

Asian:      03.3%

Nat. Am.:   00.9%

Old District VAPs

White:      72.7%

Black:      03.2%

Hispanic:   18.9%

Asian:      02.9%

Nat. Am.:   00.8%

This district drops conservative Cochise County and picks up more of the city of Tucson.  It is now contained entirely in Pima County.  I’d guess that the PVI shifts from R+4 to about even.  If Giffords runs again, she’ll probably win, though I’d consider this a toss-up district.

9th District- New District

New District VAPs

White:      64.8%

Black:      04.4%

Hispanic:   21.5%

Asian:      05.6%

Nat. Am.:   02.0%

This new district contains Chandler, Tempe, western Mesa, and the southern portion of Phoenix.  Because no incumbent lives in this district and because its PVI is probably about even, I’d expect a competitive election in 2012.

Overall, the map has 5 Republican districts, 2 Democratic districts, and 2 pure toss-up districts.  In my view, this will better than the current map, which really had two Democratic districts and six Republican ones.

CA-03: Ami Bera (D) to Run Against Rep. Dan Lungren (R) Again

Via email:

More than four months have passed since the election and I am still humbled and inspired by what we accomplished.  It was truly an incredible journey.

And now, the journey continues. After a period of honest reflection and consultation with my family and members of the community, I have decided to run again for Congress in 2012. I am running because the issues we care about are no less important today than they were last November, and the dysfunction in Congress is only getting worse.  I’ve dealt with these issues in a recent Huffington Post Op-Ed addressed to Congress.

Though he lost, Ami Bera was one of the rare bright spots for Democrats in 2010. A physician with no prior political experience, he ran a deft campaign and hauled in a ton of money, putting the fright into the Republican Party and Rep. Dan Lungren. In the end, Bera outraised Lungren by an impressive $3 million to $2 million margin, but thanks to the brutal overall climate, Lungren hung on with just 50.1% of the vote.

Of course, with California’s new redistricting commission, district lines are liable to change quite radically. But hopefully Bera will have someplace he can reasonably run – and with any luck, he’ll put an end to Dan Lungren’s career, too.

Miami Mayor Recall Election driven mostly by Republicans

Maps and Graphs looking at yesterday’s Mayoral Recall on a precinct level. Cross-posted at Stochastic Democracy.

In a lop-sided result that shocked most advisors, 88% of Miami voters voted to recall Mayor Carlos Alvarez (R- Miami). Some Democrats suggested parallels with the likely upcoming recall elections of Republican State Senators in Wisconsin over controversial anti-Union legislation. Republicans were quick to point out that Alverez’s recall campaign centered around the mayor’s property tax increases and perceived concessions to county employee unions.


Alvarez recall vote by precinct. Alvarez did not win a single precinct with more then two voters.


Vote for Republican Senate Candidate Marco Rubio in 2010 vs Yes vote by precinct. Statistically significant but not particularly strong relationship.

The question is what extent this recall was driven by Democrats or Republican disapproval. Nothing passes with 88% of the vote without bipartisan approval, but a deeper look at the data reveals a disproportionately Republican electorate.


Turnout for the 2011 Mayoral Recall Election by precinct


2010 Senate results by precinct, falling mostly on ethnic lines. Note spatial similarity to the previous map.


A graph confirming the seeming relation between the last two maps. Precincts where Rubio performed strongly had much better turnout relative to 2010 then Democratic districts.


Election results under different year’s precinct turnout levels.  

These factors combined to produce an incredibly Republican electorate relative to 2010, a year that had by far the best Conservative turnout in a decade. Roughly 50% of votes in the special election came from precincts where Rubio received more than 55% of the vote, these same districts made up 37% of the votes in 2010. If precincts had turned out in 2008 at 2011 levels, Obama would have nearly lost the county, traditionally a Democratic stronghold.

This isn’t bad news for Wisconsin Democrats, they seem to be doing fine. But if they prevail, it’s safe to say that their electorate won’t look anything like this one.  

MN, NM, and TN: Population by CD

Today and yesterday’s Census data dump is of three states that didn’t gain or lose seats but will need some internal adjustment to reflect population movement from the cities and the rural areas to the suburbs: Minnesota, New Mexico, and Tennessee. (It also included three states with at-large seats that we won’t need to discuss: Alaska, Montana, and North Dakota.)

Minnesota barely made the cut for retaining its eighth seat (13,000 fewer people statewide and it would have lost it), which you can see in its very low new target: 662,991 per district. (That’s up from about 615K in 2000.) Despite the fact that Michele Bachmann lives there, people keep pouring into MN-06 in the outer-ring suburbs and exurbs to the north, west, and east of the Twin Cities. Only it and MN-02, taking in the southern suburbs/exurbs, will need to shed population, giving part to the rural 1st and 7th, and part to the urban 4th and 5th (and suburban-but-boxed-in 3rd). With split redistricting control, look for the parties, if they’re able to agree, to settle on incumbent protection.

Talk of moving the college town of St. Cloud, currently in MN-06, into MN-08 (which would enable Tarryl Clark to run there) may be premature, as MN-08 gained enough population that it can remain about the same. In fact, the fact that it did so may say a lot about last year’s election; the 8th’s growth has been happening at its southern end, where the MSP exurbs begin and where new Rep. Chip Cravaack hails from, and the population growth in this area has outpaced losses in the dark-blue Iron Range to the north, Jim Oberstar’s traditional turf.


District Rep. Population Deviation
MN-01 Walz (D) 644,787 (18,204)
MN-02 Kline (R) 732,515 69,524
MN-03 Paulsen (R) 650,185 (12,806)
MN-04 McCollum (D) 614,624 (48,367)
MN-05 Ellison (D) 616,482 (46,509)
MN-06 Bachmann (R) 759,478 96,487
MN-07 Peterson (D) 625,512 (37,479)
MN-08 Cravaack (R) 660,342 (2,649)
Total: 5,303,925

New Mexico’s target is 686,393, based on staying at three seats (up from 606K in 2000). Not much change needs to happen between the districts; the largely rural NM-02 will need to gain some population, probably from the southern suburbs of Albuquerque in NM-01. New Mexico has become appreciably more Hispanic over the last decade, though maybe not as dramatically as the other three border states (California, Arizona, and Texas), moving as a state from 45% non-Hispanic white and 42% Hispanic in 2000 to 40% non-Hispanic white and 46% Hispanic in 2010. That means that, since 2000, it has become the first state with a Hispanic plurality. The movement was fairly consistent among districts, with the 1st going from 42% to 48% Hispanic, the 2nd going from 47% to 52% Hispanic, and the 3rd going from 36% to 39% Hispanic (the 3rd, though, is the least-white of the three districts, thanks to an 18% Native American population, which stayed consistent over the decade).


District Rep. Population Deviation
NM-01 Heinrich (D) 701,939 15,546
NM-02 Pearce (R) 663,956 (22,437)
NM-03 Lujan (D) 693,284 6,891
Total: 2,059,179

Tennessee stays comfortably at nine seats, and its new target is 705,122 (up from 632K in 2000). It, like Minnesota, has seen a big population shift from cities and rural areas to suburbs and exurbs, as seen in the huge growth in the 6th (which half-circles Nashville on the east) and the 7th (a thin gerrymander that hooks up Nashville’s southern suburbs with Memphis’s eastern suburbs). In particular, western Tennessee, both in the city (TN-09) and the rural areas (TN-08) were hard-hit, with the 8th barely gaining and the 9th outright losing population. The GOP controls the redistricting process for the first time here, but with them up 7-2 in the current House delegation (and with Memphis unfixably blue), look for them to lock in current gains rather than getting aggressive with TN-05 (seeing as how Nashville could be cracked into multiple light-red urban/suburban districts, although that has ‘dummymander’ written all over it).  


District Rep. Population Deviation
TN-01 Roe (R) 684,093 (21,029)
TN-02 Duncan (R) 723,798 18,676
TN-03 Fleischmann (R) 692,346 (12,776)
TN-04 Des Jarlais (R) 688,008 (17,114)
TN-05 Cooper (D) 707,420 2,298
TN-06 Black (R) 788,754 83,632
TN-07 Blackburn (R) 792,605 87,483
TN-08 Fincher (R) 658,258 (46,864)
TN-09 Cohen (D) 610,823 (94,299)
Total: 6,346,105

Redistricting outlook: Miss.-N.H.

Now that it’s 2011, the redistricting games will soon begin in earnest, with more detailed Census data expected in the coming weeks and some states holding spring legislative sessions to deal with drawing new maps. Long ago I planned to do state-by-state rundowns of the redistricting process as soon as 2010 election results and Census reapportionment were clear. Now that time has arrived, and it’s time to look at Mississippi, Missouri, Nebraska, Nevada, and New Hampshire.

Previous diary on Alabama, Arizona, and Arkansas

Previous diary on California, Colorado, and Connecticut

Previous diary on Florida, Georgia, and Hawaii

Previous diary on Idaho, Illinois, Indiana, and Iowa

Previous diary on Kansas, Kentucky, Louisiana, Maine, and Maryland

Previous diary on Massachusetts, Michigan, and Minnesota

The rest below the fold…

Mississippi

Photobucket

Districts: 4

Who’s in charge? Split (GOP Governor and Senate, Dem House)

Is that important? Nope

The legislature is engaged in moderately high-stakes drama over legislative redistricting, which must be done before the state’s qualifying deadline later this spring. Congressional remapping will, by contrast, be quite simple, with a plan that expands Bennie Thompson’s 2nd to pick up as many majority-black areas as possible and protects newbie GOP incumbents Alan Nunnelee in the north and Steven Palazzo in the south.

Missouri

Photobucket

Districts: 8 (down from 9 in 2002)

Who’s in charge? Split (Dem Governor, GOP Legislature)

Is that important? Yes

I have long expected the legislature — which has almost enough Republicans to override a veto by Gov. Jay Nixon — to dismantle Russ Carnahan’s suburban St. Louis 3rd District and split it up between Lacy Clay’s 1st, Todd Akin’s 2nd, and Jo Ann Emerson’s 8th, since Clay’s district must expand and the two Republicans are safe enough to accommodate a few new Democratic voters. However, renewed chatter about Akin running for the Senate against Claire McCaskill is muddying things a bit. With a 6-2 map feasible — all major areas of Democratic strength concentrated into the 1st and the Kansas City-based 5th — it’s hard to believe Republicans won’t go for it, but it may be too early to declare Carnahan odd man out after all. If Akin does seek a promotion to the Capitol’s north side, the legislature will still probably draw a less hospitable seat for Carnahan, to make that 6-2 split plausible.

Nebraska

Photobucket

Districts: 3

Who’s in charge? Republicans (de facto; legislature is officially nonpartisan)

Is that important? I suppose

Jeff Fortenberry’s Lincoln-area 1st and Lee Terry’s Omaha-based 2nd will contract in area to accommodate the slow-growing rural 3rd, but that is the height of drama here. The only notable thing about Nebraska’s congressional districts in 2012 is that electoral votes will probably no longer be apportioned by CD, denying Obama that Omaha electoral vote he won in 2008.

Nevada

Photobucket

Districts: 4 (up from 3 in 2002)

Who’s in charge? Split (GOP Governor, Dem Legislature)

Is that important? Very

Here we have a very ambitious legislature that would love to carve up Nevada as never before, with one rural/suburban Republican vote-sink for Joe Heck and three Dem-leaning seats (two in Las Vegas and environs, one stretching from Reno down to northern Clark County). The congressional delegation is deeply in flux, with Dean Heller running for the Senate, Shelley Berkley contemplating a Senate bid, and a new seat being added that will almost certainly lean Democratic. I have to assume Gov. Brian Sandoval will veto any plan that does not preserve two Republican seats, one in the north where Heller used to be and one for Heck, but with state Treasurer Kate Marshall considering a run for the 2nd, even that former stipulation is up in the air. The upside here will be for the Democrats, regardless.

New Hampshire

Photobucket

Districts: 2

Who’s in charge? Split (Dem Governor, GOP Legislature)

Is that important? Not a bit

New Hampshire’s congressional districts really haven’t changed much in living memory, simply trading towns based on Census figures every ten years. The GOP legislature may try to draw very friendly lines for itself, but as we saw in the last decade, New Hampshire politics functions as a series of tidal wave pendulum swings, if I may mix metaphors. Independents are unpredictable and fickle, and tend to break hard against one party or the other.

Wisconsin recall: 3 GOP State Senators Trail Generic Dem, More at Risk

(Cross-posted from Daily Kos.)

We asked our pollster, Public Policy Polling, to test the waters in all eight Republican-held state Senate districts in Wisconsin which are currently the target of recall efforts. PPP went into the field over the weekend, and the numbers we got back are very interesting. I’ve summarized the key results in the table below.


Dist. Incumbent Approve Dis-
approve
Support
Recall
Oppose
Recall
Vote
Incumbent
Vote
Democrat
Number of
Responses
2 Rob Cowles 32 40 36 39 45 43 2,199
8 Alberta Darling 51 42 38 54 52 44 1,333
10 Sheila Harsdorf 43 43 38 47 48 44 2,385
14 Luther Olsen 32 42 40 39 47 49 2,307
18 Randy Hopper 38 47 44 33 44 49 2,550
20 Glenn Grothman 49 30 28 53 60 32 2,561
28 Mary Lazich 35 29 26 44 56 34 2,471
32 Dan Kapanke 41 55 52 44 41 55 2,759

We asked a battery of questions in each poll (links to full results are at the end of this post). One basic question asked whether respondents approve of the job performance of each senator-those numbers are in the first two columns after each incumbent’s name. Four senators have negative ratings, and one is even-not particularly welcome news for Republicans.

a non-exclusive worldwide license to reproduce, distribute, and publicly display your work(s)

We also asked whether respondents support or oppose the idea of recalling their senators. As you can see in the next pair of columns, this question doesn’t test as well-pluralities say they favor recall in just three districts-but in a way, it’s the least important question we asked. As long as canvassers collect enough valid signatures, a recall election will happen automatically under Wisconsin law. So while this is helpful information to have, it is far from dispositive, especially when contrasted with the next pair of columns.

“Vote Incumbent” and “Vote Democrat” summarize data from our most critical question. We asked poll-takers whether, in a hypothetical election that would be held later this year, they’d support the incumbent (whom we mentioned by name), or his/her “Democratic opponent.” (This sort of question is often described as testing a “generic Democrat.”) Here, the results give us reason to be cautiously optimistic.

Three Republican incumbents actually trail “generic Dem”: Luther Olsen, Randy Hopper, and Dan Kapanke. Two more have very narrow leads and garner less than 50% support: Rob Cowles and Sheila Harsdorf. And one more, Alberta Darling, holds a clear lead but is still potentially vulnerable. (Two recall-eligible senators, Mary Lazich and Glenn Grothman, sit in extremely red districts and look to have safe leads.) These numbers suggest we have a chance to make five and possibly six recall races highly competitive.

But a key thing to remember, though, is that if any of these senators have to face a recall election, we’ll need an actual candidate to run against each of them. In that regard, Wisconsin’s recalls are very different from California’s, where in 2003 voters were simply asked if they wanted to remove Democratic Gov. Gray Davis from office. Arnold Schwarzenegger was elected (with less than a majority) by means of a separate ballot question. In my view, California’s system makes it easier to boot an office-holder, because at bottom, the first question simply asks if you’d prefer some other-any other-alternative. If your answer was “yes,” you then had your choice on the second question, whether it was Arnold (R) or Lt. Gov. Cruz Bustamante (D) or Gary Coleman (?). In Wisconsin, if a recall election makes it on to the ballot, there is no California-style first question-we go directly to a head-to-head between candidates (with a possible stop along the way for primaries). So for a recall to succeed, we’ll need to convince voters to support a real live Democrat-and that means we’ll have to recruit some good candidates.

As the recall process moves forward, you’ll want to bookmark this link and keep it handy. It’s a chart of the 2004 & 2008 presidential results in each state Senate district in Wisconsin. While not a perfect measurement, the presidential numbers offer a clear baseline for a rough-cut assessment of how competitive each district is likely to be. Of course, many other factors are involved, but if you click the link, you’ll understand immediately why Kapanke is in such trouble – he’s in the bluest district held by a Republican, one that went 61% for Obama and 53% for Kerry. A little further down the list, you’ll see that Olsen, Cowles, Hopper, Harsdorf, and Darling all occupy districts with roughly similar presidential results that hover in swingy territory, so you can see why at least the first four are at risk. Darling’s stronger performance is somewhat surprising, given that senators in comparable districts all do worse, but even she is not out of the woods. Bringing up the rear are Lazich and Grothman, who holds the most Republican seat in the entire state. It’s hard to imagine a scenario in which either of them could fall.

One final detail: You’ll notice that in the table up above, the last column reads “Number of Responses.” That refers to how many people actually completed our poll when we called them. If you’re familiar with electoral polling at all, those numbers are simply eye-popping, particularly for state senate districts. Our target was 600 to 800 respondents per poll, and yet we got well into the two thousand range for all but one of them (and even that outlier had over 1,300). What does this mean? The only reasonable conclusion is that an unusually high proportion of Wisconsinites are tuned into this conflict, and when given the opportunity to make their opinions heard, they jumped at the chance. While we can’t yet say for sure whether the enthusiasm gap has been erased, we do know that folks in Wisconsin are very definitely paying attention.

And so, of course, are we. As the situation warrants, we’ll revisit these districts and test the poll numbers again. For now, though, we wait on the outcome of the petition drive to force these recall elections in the first place. Then the battle will really begin.

Full Results: Cowles | Darling | Harsdorf | Olsen | Hopper | Grothman | Lazich | Kapanke

NV-02: It’s Angle Time!

Ralston via Taegan:

Jon Ralston confirms that Sharron Angle (R) will run for the seat of Rep. Dean Heller (R-NV), who is running for U.S. Senate.

He notes the GOP primary “will be something else.”

It’s time to play the music! It’s time to light the lights! It’s time to meet the wingers on the crazy show tonight! Yeah, my friends, I’m in a good mood today. It’s like I can smell the cat fud that hasn’t even been opened yet. It’s not that I expect Angle to win – see Ralston via DavidNYC:

As for that 2nd CD race, Jon Ralston said he’s seen three different internal polls in recent days, all of which show Sharron Angle doing poorly in a one-on-one fight against Krolicki (and also against Heller for Senate). Ralston says he can’t divulge the numbers, but he now thinks that Angle – whom he had previously considered “the favorite” for NV-02 – would need a multi-way primary to have a chance at the nomination.

But this sure as hell ought to be entertaining!

UPDATE: Here’s Angle’s announcement video: