MA-Sen: Brown Leads Capuano, Elizabeth Warren

(Please give a warm welcome to brownsox (aka Arjun Jaikumar) who is joining our horserace superteam – promoted by DavidNYC)

Pretty reasonable numbers, but a dodgy-looking sample.

Western New England College (PDF) (3/6-10, Massachusetts voters):

Michael Capuano (D): 38

Scott Brown (R-inc): 51

Elizabeth Warren (D): 34

Scott Brown (R-inc): 51

(MoE: ±4.5%)

The toplines are pretty much in line with what other pollsters have shown, like PPP. Brown has a solid lead, hovering around 50%, while his prospective opponents aren’t especially well known (one difference between WNEC’s poll and PPP’s is that Mike Capuano, tested in both polls, has impeccable 30/14 favorables in WNEC’s poll and pretty lousy 26/27 favorables in PPP’s).

Brown also leads Elizabeth Warren, who WNEC decided to poll for reasons best known to them (though check out those 17/3 favorables – Mike Beebe, eat your heart out!)

Like a lot of university polls, though, WNEC’s sample seems bizarre – 34% Democrats, 12% Republicans and 47% independents (the remainder responded “something else”). That’s very low on Democrats for a Massachusetts poll – the 2008 exit polls were 43% Dem, 17% Republican, 40% indie. Still, the toplines are close enough to everybody else’s numbers that they seem likely to be accurate. So the question is, can Brown lose?

He’s popular, but unlikely to get much more popular than he already is, especially as he continues to vote with Republican leadership to cut jobs and slash Medicare benefits. And popular Republicans can lose in Massachusetts in Presidential election years – ask former Governor Bill Weld, who ran for the Senate after receiving an eye-popping 71% of the vote in his 1994 reelection. Weld lost to John Kerry by seven points, 52% to 45%, helped in no small part by Bill Clinton’s 33-point romp in Massachusetts.

So sure, Brown can lose. He starts in a strong position for reelection, though, and it will take an exceptional campaign to unseat him.

Daves Redistricting & Progressive Congress [Update]

Dave’s Redistricting Application is now a project of ProgressiveCongress.org. Woohoo!

[Update: CA is ready!]

This means that more members and visitors of Progressive Congress will get to know about DRA and that more users of DRA will get to know about Progressive Congress. This means that the Progressive Congress team will be providing advice and guidance for DRA. (Some of Darcy’s suggestions have already been included in the app, in fact.) This means that Progressive Congress and DRA will be teaming up to help you better understand what’s going on with redistricting and what you can do about it. And this means working together to make government better for the people!

This also means that you can now make tax-deductible contributions to support the Dave’s Redistricting Project. Your support, whether it’s $10 or $500 will help keep the project going with the rest of the 2010 data, election data and more features. It will also help support the awesome work done by ProgressiveCongress.org

Cross-posted at DailyKos. Latest DRA info below the fold.

Here’s the latest on the application:

— 29 states now have 2010 data. The new ones are AZ, CT, ID, OH, PA, WI. (CA soon!)

— VA and MD have election data, now including actual vote counts (except absentees are not places in any precinct and so are left out). More election data expected soon.

— Bug workaround: if you have trouble with the Pan control, you should be able to Save your work now.

Thanks to all of you users. Keep the feedback coming. Thank you SwingStateProject! Special thanks to Darcy Burner for making this partnership a reality.

SSP Daily Digest: 3/14

AZ-Sen: This is amusingly insane. I’m certainly all for it!

CA-Sen: Our long national nightmare is finally over: Meg Whitman says she will “definitely not” run against Sen. Diane Feinstein (D) next year. Rather, she says she’s going to spend time campaigning for fellow rich guy Mitt Romney. (Also, here’s an amusing tidbit: Earlier this year, she joined the board of none other than Hewlett-Packard – the company her 2010 Republican ticket-mate Carly Fiorina nearly ran into the ground.)

CT-Sen: In an interesting development, fans of magical realism have been making a push for Borges to enter the Connecticut Senate race. Ah, wait. What’s that? Fuck. So, um, former state Treasurer Frank Borges (D), who left office in 1993, says supporters are asking him to run, and while’s he’s thinking about it, he’s set no timetable for a decision. Borges is CEO of a private equity firm (so I’m guessing he’s pretty rich), and he’d be the state’s first black senator if successful.

FL-Sen: Rep. Vern Buchanan (R) is starting to sound like a “no” for the Senate race. Now that he’s scored a spot on the Ways & Means Committee, he says he’s less likely to seek a promotion. In fact, he very explicitly said: “If this hadn’t happened, I would have been looking to do something else.” That sort of talk has to make you figure that the GOP’s takeover of the House has actually been bad news for one Republican: NRSC chair John Cornyn.

In much sillier (and related) news, Cornyn told The Hill that he had tried to recruit former congressman and current MSNBC host Joe Scarborough to run against Bill Nelson. Undoubtedly, this made make Rep. Connie Mack a little hot under the collar, because the NRSC wigged out and Cornyn weirdly tried to claim the story was “not true,” even though Scarborough confirmed it. Rather, said Cornyn, he had been asking Joescar about a potential Senate run in… New York. (The Atlanta-born, Alabama-educated, Florida-elected Scarborough’s tv show is based in NYC.) Then, the NRSC took a dump on Joe, saying: “There are already a number of far stronger candidates looking at the Florida Senate race….” Whoops!

Also, there’s a tenative Biden alert! – the VPOTUS supposedly will come down to Florida later this month to raise money for Bill Nelson.

IA-Sen: Wingnut Bob Vander Plaats, who did surprisingly well against now-Gov. Terry Branstad in last year’s Republican gubernatorial primary (with an assist from some Democratic ratfuckers), was asked whether he’s contemplating a run against Sen. Tom Harkin in 2014. Said BVP: “I think about it daily. That doesn’t mean I’m going to run against him, Ok. I don’t know.”

IN-Sen: Now this is fucking interesting. I’m just going to let SSP commenter Bob Bobson summarize the situation:

WISH-TV’s Jim Shella noted on his blog today that that there exists a hypothetical but plausible scenario in which state Democrats could sue to overturn the results of last year’s election for Secretary of State by arguing that Charlie White wasn’t a valid candidate for office. That’s not really anything new, and has been rumored in the Hoosier political press for a while.

What is new here is that Shella points out that such a lawsuit, were it ruled in favor of the Democrats, wouldn’t just remove White from office, but would also make the Republicans a “minor party” under state law. SSPers probably remember the whole [10]% threshold thing from the Colorado governor’s race last year where Dan Maes’ trainwreck candidacy nearly cost the Colorado Republicans their ballot position as a major party, and there’s a similar regulation at play here. The difference is that in Indiana, it’s the Secretary of State race that decides which parties are “major,” and the threshold is [also] 10%. If White’s candidacy is invalidated, though, that could mean that the Republicans, legally, received zero votes in the SoS race last year.

That outcome would also mean that their nominating process for statewide candidates for the next four years would be via convention and not primary. And that means Dick Lugar becomes the next Bob Bennett.

In related news, Sean Keefer, who as Deputy Secretary of State was no. 2 to Charlie White (and also served as his chief of staff, and before that, as his campaign manager) just resigned, and there’s a report that White’s spokesman will also quit. Even better: White staged a totally bizarro impromptu press conference on the courthouse steps after a hearing in which he pleaded not guilty to all charges. The presser only ended after White’s attorney told him to “shut up” and led him away by the elbow. Fun times!

MA-Sen: Deborah Shah, a consultant to Newton Mayor Setti Warren, sent around an email (I’m guessing to some listservs) looking for college kids interested in working on a potential Warren Senate campaign, set to be staffing up at the end of April. (Aren’t most students stressing about finals at that point?) Shah says that “This is just the first step to make sure you’re prepared.”

MI-Sen: Pete Hoekstra hasn’t yet said if one of these days a Congressman from Michigan’s gonna come back home and run a Senate race, but he expects to decide this spring. One tea leaf suggests he’s rather stay focused on his lame-ass-looking consulting firm: He just shuttered his House campaign account, which he could have instantly turned into a Senate fund.

OH-Sen: In response to ex-Gov. Ted Strickland calling him “scurrilous,” “bigoted,” “reprehensible,” and “laughable,” the Cleveland Plain Dealer reports that Republican state Treasurer Josh Mandel “said Strickland is a good person.” Maybe that makes Mandel look big, I dunno, but does it also make him look like a wuss to his biggest supporters, the teabag contingent? At the same q-and-a with other GOP elected officials, SoS Jon Husted (who has declined a run) said he’d like to see Mandel take on Sherrod Brown, while AG (and ex-Sen.) Mike DeWine much more amusingly said that a Brown-Mandel matchup would be “fascinating.” Is that Mr. Spock fascinating, or a trainwreck fascinating?

AZ-08: Rep. Gabby Giffords’ doctors gave an update on the congresswoman’s recovery on Friday, and they sounded very upbeat about her progress (though they noted that it’s not a sure thing whether she’ll attend her husband’s space shuttle launch next month, contra what a staffer said last week). Meanwhile, 2010 Republican candidate Jesse Kelly, who very nearly beat Giffords, set up a new campaign committee for a potential rematch.

CA-37: Though Rep. Laura Richardson (D) previously denied it, a letter of resignation sent by her former district scheduler suggests that the congresswoman is indeed the subject of an ethics probe, pertaining to misuse of staff. Now Richardson’s office is simply refusing to comment. The staffer’s letter is really brutal, citing “constant verbal and emotional abuse” and requests that she perform tasks “on the ethical borderline.” I can’t imagine Richardson has a very long future in Congress (she originally won office in a 2007 special with just 37% of the primary vote in this very blue district), so who do you think could replace her?

NM-01, NM-Sen: State Sen. Eric Griego (D), who is considering a run for the House if fellow Dem Martin Heinrich decides to go for the Senate race, says he expects “the smoke to clear” by April or May, in terms of people making decisions about what they’re gonna do.

NV-02: Jon Ralston says that retired Navy Commander Kirk Lippold is “in” the race for Nevada’s 2nd congressional district, which ought to have a very interesting GOP primary, at the least. Lippold, who was captain of the USS Cole when it was bombed by Al Qaeda a decade ago, was touted as a possible challenger to Harry Reid last year.

NV-03: Freshman Rep. Joe Heck was the only Republican to vote against defunding the Federal Housing Administration Refinance Program (designed to help homeowners with underwater mortgages). Anticipating criticism, he put out a video press release (an actual video press release, not a “tv ad with a tiny buy designed to get free media attention”) defending his vote. Could Heck be worried about getting teabagged?

NY-26: Republican nominee Jane Corwin just received the Independence Party’s nomination for the special election as well, and ya know, this is a pretty darn good demonstration of why the Democrats’ dithering on selecting a candidate has been a pretty dumb move. I mean, even if the IP wanted to endorse a Dem, they couldn’t! (Or at least, couldn’t do so yet.)

Anyhow, 2010 NY-Sen-A GOP primary loser (in other words, the guy who couldn’t beat the guy who got vaporized by Chuck Schumer) Gary Bernsten sent out an email asking supporters to help teabagger David Bellavia petition his way on to the ballot as an independent. I’d be surprised if this effort is successful, though – Bellavia has only until March 19 to collection 3,500 signatures. Crazy Jack Davis is doing the same thing, but at least he has a shot, since he’s putting his millions to work for him.

SD-AL: I linked this story in the Pete Hoekstra item above (see MI-Sen), but ex-Rep. Stephanie Herseth Sandlin has also closed her campaign account, suggesting that Steve Israel’s efforts to woo her into a rematch with Republican Kristi Noem haven’t been successful. The Fix has a long list of other Dems (and a few Repubs) who have shut down their FEC committees – click the link for the rest.

TX-LG: Texas Ag. Comm’r Todd Staples isn’t ruling out a run for Lt. Gov., a seat which could become open if the current occupant, David Dewhurst, wins Kay Bailey Hutchison’s Senate seat. Other possible aspirants include Comptroller Susan Combs and Land Commissioner Jerry Patterson. (And yes, since this is Texas and everyone I just mentioned holds statewide office, that means they’re all Republicans.) While you might be wondering why we’re going so far down into the weeds here, the LG job is considered one of the most powerful in Texas (some like to say even more powerful that the governor’s), because the LG is also President of the state Senate.

Wisconsin Recall: The DLCC just launched a TV ad against GOP state Sen. Luther Olsen, attacking him for flip-flopping to support Scott Walker’s anti-union legislation – though it does not mention anything about the recall effort which Olsen is (among others) the subject of. The ad (which you can watch here) is running in Green Bay, and a spokesman tells me that the buy is “about 1000 points.”

Also, check out this piece from the Milwaukee Journal Sentinel’s Craig Gilbert, which begins:

Number of state lawmakers removed from office by recall in all of American history: 13.

Number of state lawmakers currently facing recall campaigns in Wisconsin: 16.

Hawaii: In order to avoid another Charles Djou, the Hawaii House just passed a bill to institute instant runoff voting (aka IRV) for special Congressional elections. Of course, they could just hold primaries instead of jungle elections.

WATN?: Scott Lee Cohen, the disastrous Lt. Gov. candidate whose utterly failed gubernatorial bid probably saved Pat Quinn’s ass, is hoping to replace ex-state Sen. Rickey Hendon, who resigned last month. Given that the replacement gets picked by a panel of Chicago Democratic Party committeemen, I’m guessing that Cohen’s chances are somewhere between zero and nil.

Redistricting Roundup:

Idaho: At least one local expert is confirming what we observed last week: population shrinkage in the 2nd CD will likely require it to absorb the entire city of Boise, which is currently split between the state’s two districts.

New Jersey: Richard Lee has some interesting historical details about the 1990 round of redistricting, focusing on two politicians who are still part of New Jersey’s congressional delegation today: Rep. Frank Pallone and Sen. Bob Menendez. Menendez’s federal career was launched when New Jersey’s loss of a seat led to the creation of an Hispanic-friendly district. Pallone, meanwhile, was targeted for elimination by his own party. Said one Republican: “I’d like to see Mr. Pallone defeated. But apparently I don’t want to see him defeated as much as the Democrats do.” Obviously, Pallone lived to fight another day.

Meanwhile, Rutgers Prof. (and state redistricting tiebreak vote) Alan Rosenthal supposedly put out a memo outlining his vision for a fair legislative map, reportedly leading state Dems to believe their vision is much more closely aligned with Rosenthal’s than is the Republicans’. But it doesn’t seem like this memo, if it exists, has been released online.

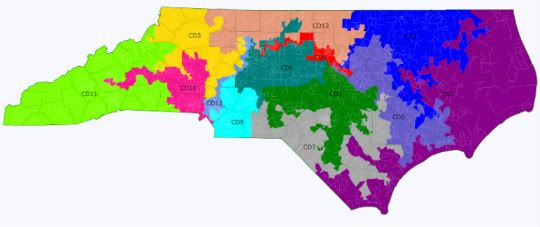
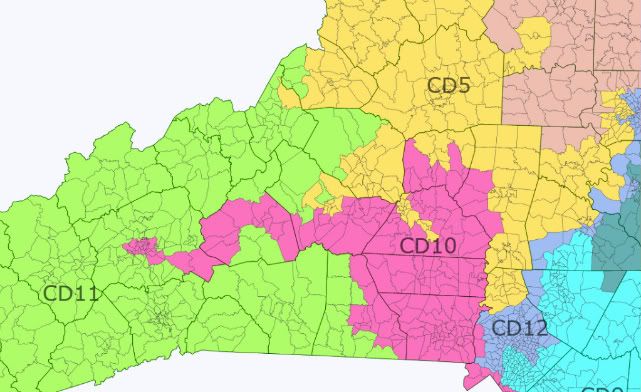
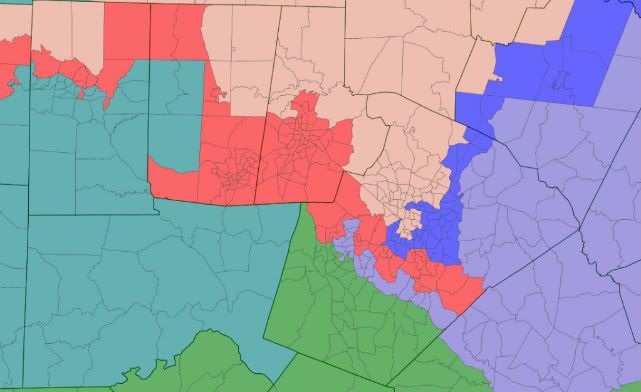
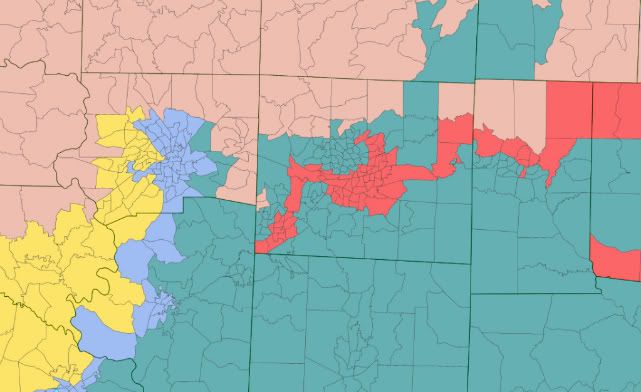
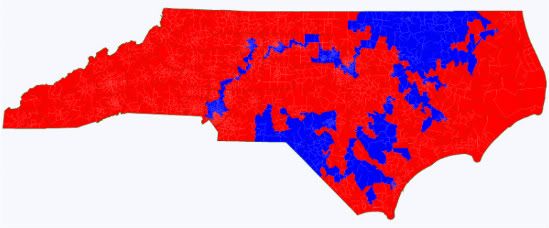
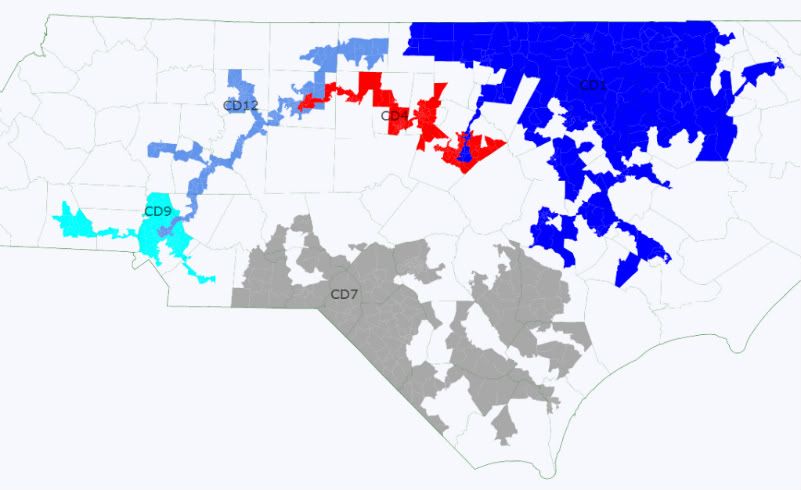
NC gop 9-4 with 4 Majority-Minority Districts

So I finally registered on SSP and this map is my first posting of North Carolina. It’s intended to result in 9 safe GOP districts, all of which are 57% McCain or above, and 4 safe majority-minority Dem districts, two of which are plurality VAP black.

Overview:

Photobucket

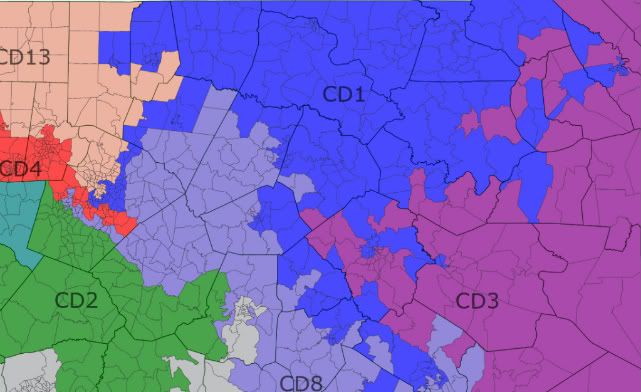
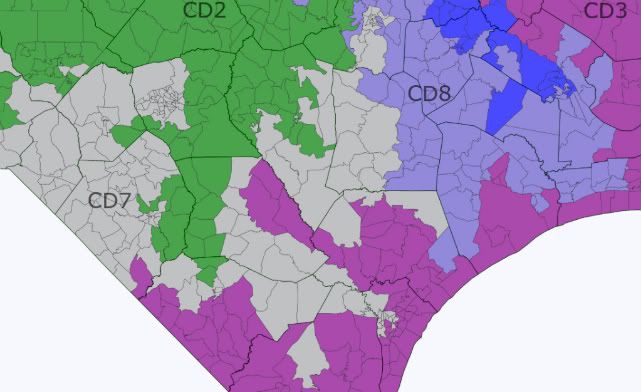
From East to West:

Photobucket

Photobucket

Photobucket

Photobucket

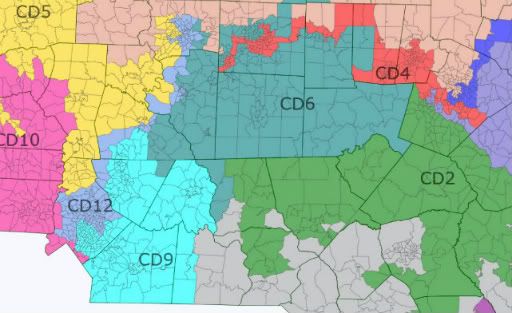
Finally, a close up of the Triangle and the Triad:

Photobucket

Photobucket

All districts are within 500 of ideal population as follows:

Obama/McCain       White/Black/Hispanic/Asian/Native/other

NC-1 (Blue)        G.K. Butterfield (D)

67.5-32.0        40.9/47.8/7.4/1.7/0.7/1.5

The 1st loses a bit of the coastal region but the only major change is a snaking addition into Raleigh to pick up heavily Democratic and minority voters so as to have enough population.

Safe Democratic

NC-2 (Green)        Renee Ellmers (R), Larry Kissell (D)/Mike McIntyre (D)

40.7-58.4        69.3/15.2/9.5/2.5/1.6/2.0

The 2nd undergoes significant changes as it loses area in Raleigh proper and the counties to the northeast and gains heavily Republican territory to the south and west from the current 7th and 8th districts.  Ellmers should be safe here barring a primary challenge from another Republican, but seeing as how she’s very conservative this shouldn’t be a huge problem for her. Incidentally, Kissell’s home in Biscoe and possibly McIntyre’s in Lumberton have both been placed into the 2nd.

Safe Republican

NC-3 (Purple)        Walter Jones (R)

40.8-58.3        76.5/14.6/5.5/1.1/0.4/1.8

The 3rd loses its appendage towards Wilson and Rocky Mount and gains one snaking down the rest of the coast to include Republican friendly territory from the current 7th. Jones’ district becomes slightly more Democratic but that shouldn’t be much of a problem for him.

Safe Republican

NC-4 (Red)        David Price (D)

77.4-21.8        41.6/37.9/11.9/5.9/0.4/2.2

The 4th loses all of the southern 3rd and northwestern section of Wake County and instead bisects it to pick up heavily Democratic and minority voters.  The most radical change to the 4th, and what makes this configuration so devastating, is that it extends an arm across Alamance and Guilford counties, picking up very heavily minority and Democratic territory from Greensboro and High Point and in the process screwing over Brad Miller. The 4th is one of the most Democratic districts in the South and would be one of the most Democratic MMD to elect a white Democrat.

Safe Democratic

NC-5 (Yellow)        Virginia Foxx (R)

41.2-57.6        80.7/9.0/7.0/1.6/0.2/1.5

The 5th loses territory around Winston Salem and the counties to the north and west while trading territory with the 11th around Marion, Lenoir, and Hickory.  The district also adds territory in northern Mecklenburg.  Virginia Foxx might have some difficulty here since the 5th has become a moderate amount more Democratic and undergoes a moderate to large change in territory, however this is due to her weakness as a candidate.  Even Foxx should be all right here, and a generic R will have little to no trouble.

Safe Republican

NC-6 (Teal)        Howard Coble (R)

41.0-57.9        75.6/12.8/7.8/1.9/0.4/1.5

The 6th keeps most of its base in Greensboro and suburban Guilford county while the only substantial changes include trading Moore for Chatham county and taking in some outer heavily Democratic precincts in Guilford so that the surrounding Republicans can be shored up. I accidentally drew Coble out of the 6th since he actually lives in Summerfield, but that shouldn’t really be a problem since he’s represented much of the district for decades and probably won’t serve that many more terms anyway. It will probably trend a little Democratic over the decade but should be safe for Coble or any other country club Republican.

Safe Republican

NC-7 (Gray)        Open/Mike McIntyre (D)

63.3-36.0        41.0/37.2/9.5/1.5/8.2/2.6

And here is where the fun begins. I could have just done an 8-3-2 map leaving Shuler and McIntyre in competitive districts, or another configuration of 9-4, but after playing around with DRA a little, I realized it was possible to draw a 4th (heavily gerrymandered) majority-minority district in southeastern NC. So here goes:

The 7th loses most of the whiter parts of its current configuration and adds minority heavy areas to the north in Goldsboro and to the west in territory from the current 8th. Fayetteville is now almost entirely within the 7th. All but one voting block within Mike McIntyre’s hometown of Lumberton is included in the 7th, but that is pretty much irrelevant because McIntyre wouldn’t last two seconds in a primary here seeing as how the district is significantly more Democratic than the current 7th.

Overall, the only reason the GOP would consider allowing for this configuration is that it unambiguously removes Kissell and protects Ellmers and Myrick, but at the cost of securing a seat for a significantly more liberal Democrat than McIntyre.

Safe Democratic

NC-8 (Steel Blue)        Open

40.7-58.4        68.3/18.2/9.5/1.6/0.4/1.9

The 8th here bears no resemblance to the current district and reflects just how screwed Larry Kissell would be since the surrounding districts have gobbled up the entirety of his district.  The new 8th stretches from Wake to Onslow county and is composed mostly of territory from the current 2nd and 3rd. Before 2010 there would have been the chance for a Mike McIntyre clone the right type of Democrat to win here, but Dems got absolutely slaughtered here in 2010 and have a bit of a weak bench.

Safe Republican

NC-9 (Cyan)        Sue Myrick (R)

40.4-58.7        75.8/11.3/8.6/2.4/0.3/1.6

Due to population gains the 9th had to shed a lot of territory and does so by losing all of its area in Gaston and northern Mecklenburg counties.  Since the 9th showed quite a large shift in voting patterns between 04 and 08 I added more conservative territory from the dead carcass of Larry Kissell’s 8th district with the 9th now containing blood red territory to the east of Charlotte.  This district should be safe for Myrick, but it would be interesting to see how it trends over the whole decade due to large gains in population.

Safe Republican

NC-10 (Magenta)        Patrick McHenry (R)

41.9-57.1        78.1/11.4/6.2/2.3/0.3/1.6

The 11th changes significantly in order to allow Republicans to remove Shuler in the neighboring 11th. The district picks up the remnants of the old 9th in Gaston County and reaches an arm into Ashville to annex the majority of its Democratic base.  To compensate for this lunge towards the left, the 10th district trades Democratic leaning Hickory, Lenoir, and Morganton to the 5th in exchange for more dyed-in-the-wool Republicans.  The district becomes significantly more Democratic from extremely safe Republican to just pretty safe Republican, but McHenry now represents a lot of new territory and could be vulnerable to a primary challenge.

Safe Republican

NC-11 (Chartreuse)        Heath Shuler (D)

41.7-57.0        87.6/3.9/5.0/0.7/1.4/1.6

Ah, the other beauty of this map. Since the 9th is able to shift east unhindered by Larry Kissell’s 8th, the 10th is able to also shift east, which provides ultra conservative territory for the 11th to pick up. Ashville and Marion are almost entirely removed from the 11th which deprives Shuler of Democratic base voters, however it is plausible that his appeal to conservative-leaning Dems and Indies could provide a path to victory. Generic R would be heavily favored against Shuler and all but guaranteed against a Generic D.

Likely Republican vs. Shuler

Safe Republican vs. Generic D

NC-12 (Medium Blue)        Mel Watt (D)

73.2-26.1        35.3/43.1/15.3/3.9/0.3/2.1

The 12th loses all of Greensboro, High Point, and Thomasville, but picks up large parts of eastern Charlotte from the old 8th.  There’s nothing else but some minor changes, such as not hugging the county line between Charlotte and Winston-Salem to free up extra Republican voters. There’s no point in crying about not splitting towns and counties when it doesn’t constitute a back door veto on a Democratic gerrymander. Republicans have stated that they won’t draw anything like the current 8th, but it still remains an effective vote sink when drawn from Charlotte to Winston-Salem.

Safe Democratic

NC-13 (Salmon)        Open/Brad Miller (D)

42.0-57.0        77.8/13.0/5.9/1.6/0.3/1.4

Karma has it out for Brad Miller with this map, although pretty much any GOP effort guarantees he’s finished, which is quite a shame.  The 13th loses all of its heavily democratic territory in Greensboro, Burlington, and Cary, and most of it in Raleigh in exchange for the most GOP-friendly parts of northern Wake County. Additionally, the 13th moves westward to pick up large amounts of territory from the 5th by extending across to Yadkin County. Since I didn’t know exactly where Brad Miller lives in central Raleigh, it’s possible he lives in either the 1st or the 13th, but that’s utterly irrelevant since the 13th no longer contains his urban bases in Wake and Guilford counties.

Safe Republican

Intended result:

Photobucket

Summary:

Republicans shore up all of their incumbents, most importantly Ellmers and Myrick, while dividing up fast growing Wake and Mecklenburg counties among various buffered districts. Brad Miller, Larry Kissell, and Mike McIntyre are dead men walking. Miller gets replaced by a conservative Republican, Kissell has no district and a conservative Republican wins the new 8th to the east. McIntyre is defeated in the primary by a much more liberal, minority Democrat if he runs in the new 7th. Heath Shuler likely loses to a Republican without the Democratic base in Ashville. Furthermore, by removing Shuler, Kissell, and McIntyre in 2012 the GOP prevents a statewide challenge from a moderate-to-conservative Democratic sitting congressman in 2016.

This configuration is made entirely possible by its four majority minority Dem vote sinks which lock in the 9-4 split, assuming that Shuler loses, for most, if not all of the decade. Additionally, the 4th is a 77%!!!1!1! Obama district yet only 54.2% VAP minority, and is an ambitious radical, socialist, atheist Marxist’s Democrat’s wet dream.

Now… obviously this map would draw myriad lawsuits after all of two seconds, and state Republicans have claimed they won’t attempt anything like the current 12th, but they were also clamoring for independent redistricting until they found themselves in the majority. It’s not sleek and pretty, and it could only care a little less about city and county lines, but if this map has any chance of surviving in court then having 9 safe seats is much smarter for the Republicans than having 8 or 10 shaky seats with the added bonus that anyone who won the 4 Dem districts would likely be too liberal to win statewide.

And as an added bonus, North Carolina with 5 majority minority districts:

Photobucket

All are majority minority voting age population, and the first remains majority black, but barely so.

What do you all think?

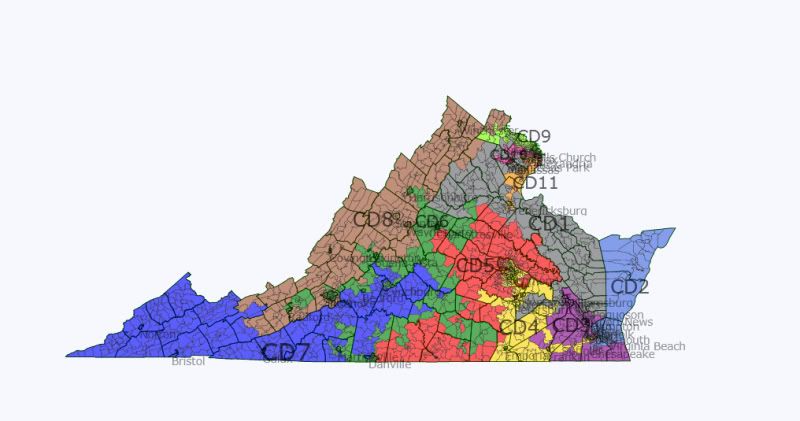
Virginia: A Democratic gerrymander of the Old Dominion

As a native Virginian and Democrat, I was very excited when Dave was able to add voting data for Virginia to his redistricting app because of how it would ease tinkering with Virginia.

Naturally, the map I produced here is entirely unrealistic, if not because of the shape and scope of some of the districts I drew but because of the fact that the GOP controls the Virginia House of Delegates and the governor’s mansion. With the Democrats controlling the State Senate, it seems likely that a incumbent-protection map will be drawn this time around.

However, I set this map up to create the opportunity for Democrats to control seven of the state’s eleven House seats. The result was more or less a 6-1-4 map (7-4), with a D+3 seat in the Tidewater as the swing-iest district.

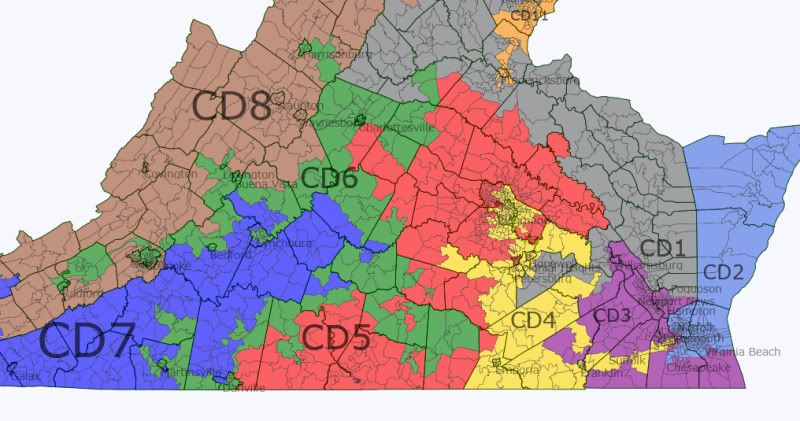
Without further adieu, here is the final product:

Photobucket

VA-01 (Gray)

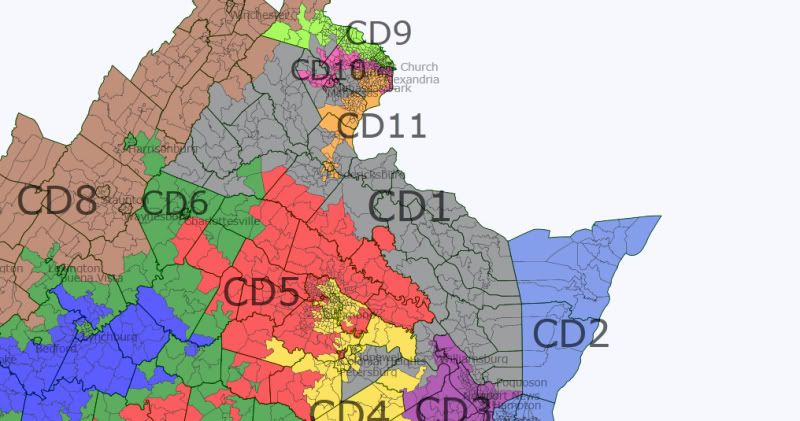
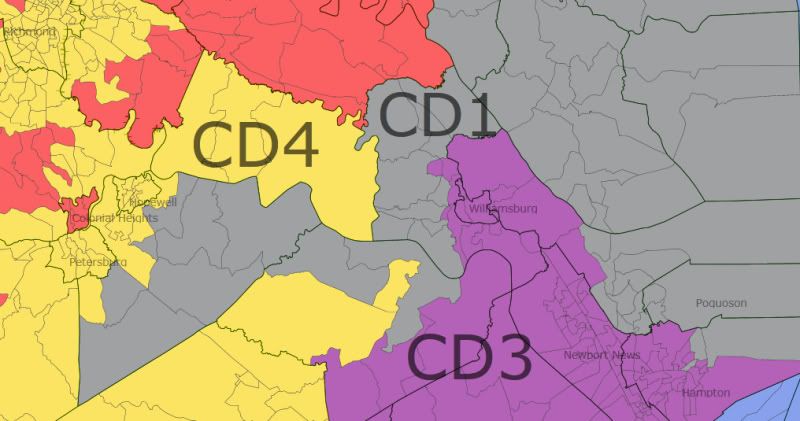
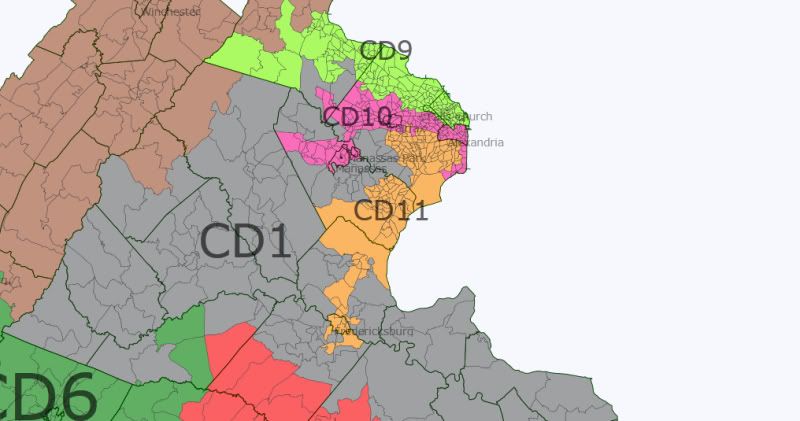
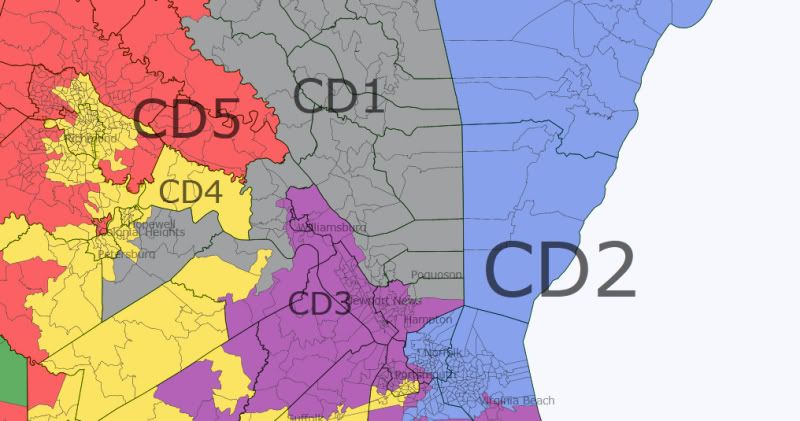
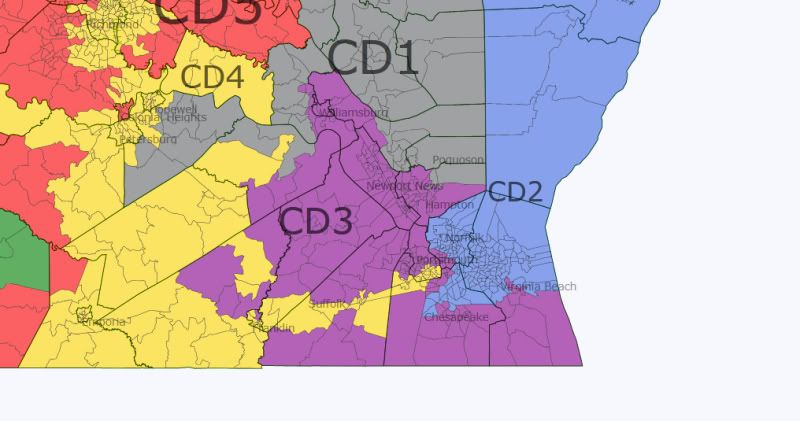
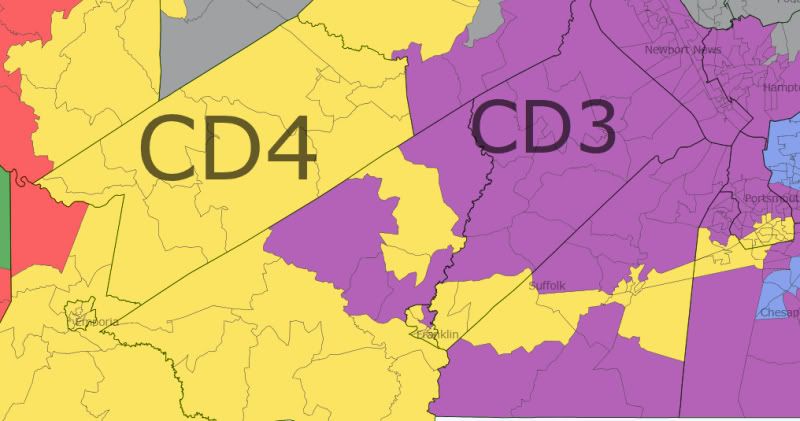
Appropriately, we’ll start with CD-1, which stretches northwest from its most southern point in eastern Hampton in the Tidewater (as well as below Richmond) to the edge of the Blue Ridge Mountains in Greene and Madison Counties, as well as all the way into the outer D.C. suburbs. Clearly, communities of interest did not come into play with this map.

Photobucket

Here’s the part that goes south of Richmond and Petersburg and down into eastern Hampton:

Photobucket

And the northern part of the district:

Photobucket

The statistics for this district as follows (NOTE: Dev. stands for deviation from the ideal population total):

Photobucket

VA-02 (Blue)

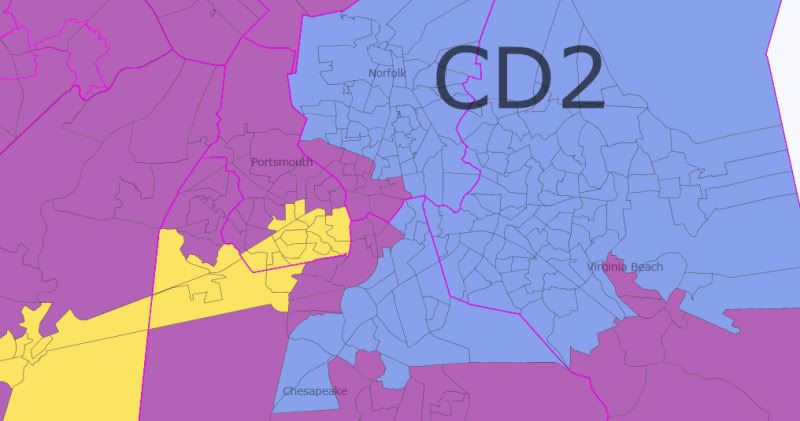
The Virginia 2nd is the most contestable district on this map with only a slight Democratic edge. Encompassing the Eastern Shore, part of Virginia Beach, and part of Norfolk, it could be best held by an ex-military moderate Dem, given the large military community in the area. Just don’t bring back Glenn Nye, please.

Photobucket

Here is the Virginia Beach/Norfolk part of the district, with the city outlines highlighted in pink:

Photobucket

The most Republican parts of Virginia Beach and Chesapeake are taken by VA-03 to give this district its slight Dem lean.

And the statistics for this district:

Photobucket

VA-03 (Purple)

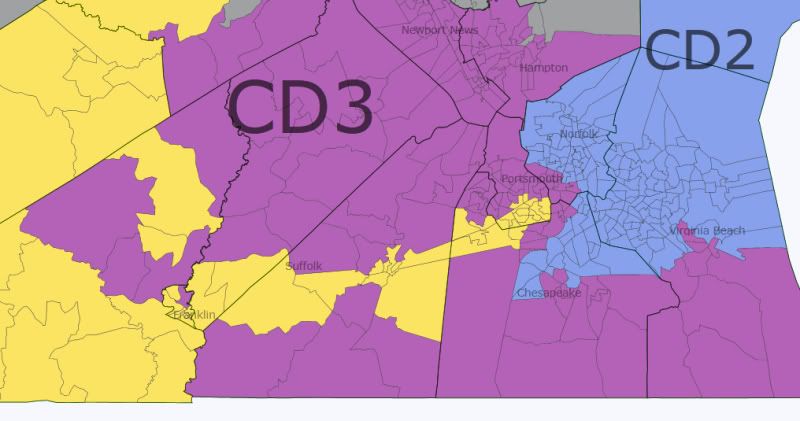
The third Congressional District takes up parts of the current VA-03 represented by Bobby Scott but is not a minority-majority district.

Photobucket

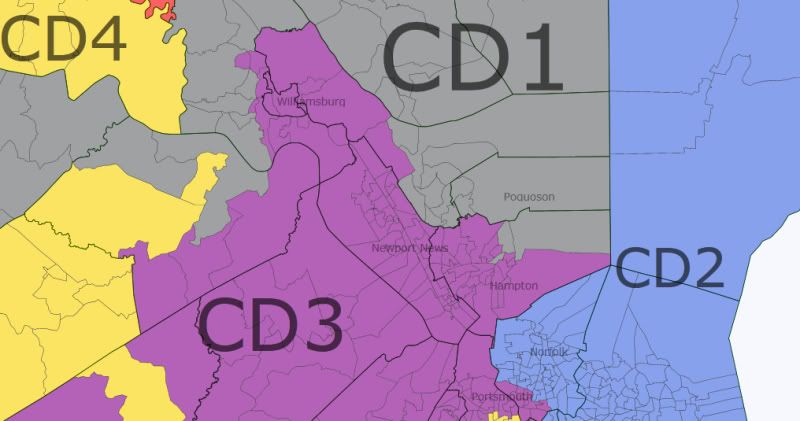
It is not a strong Dem district but it has a very solid Democratic base in its portions of Hampton, Newport News, and its small parts of Norfolk and Portsmouth. If I had left the parts of Chesapeake and Virginia Beach that are in this district in VA-02, I could have made that district about 50-50 and this one more than 60-40 but again, I was trying to make a map with a good shot at seven Democratic representatives.

Here is the part of the district that winds around central Suffolk. One side goes into the southwest corner of Suffolk, which is one of the fastest-growing cities in the state, growing more than 25% between 2000 and 2010. The other juts into Southampton County above Franklin, taking one precinct from that small independent city (a 52-48 McCain precinct).

Photobucket

Here’s the Newport News/Hampton section of VA-03, also encompassing the city of Williamsburg with its university population from the College of William & Mary.

Photobucket

Lastly, the statistics for this district:

Photobucket

VA-04 (Yellow)

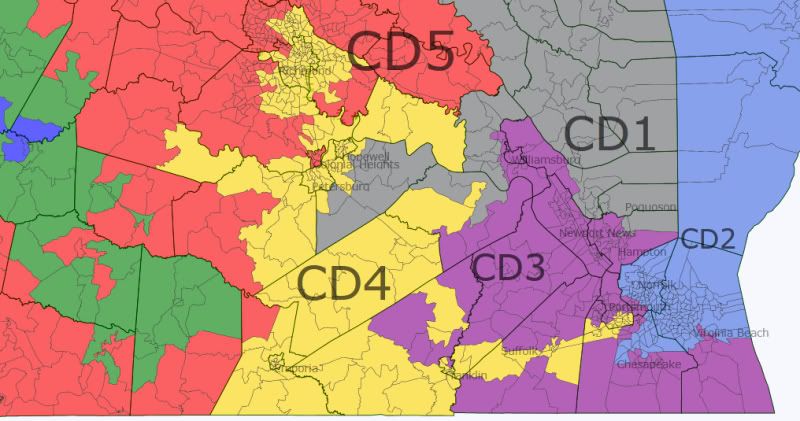
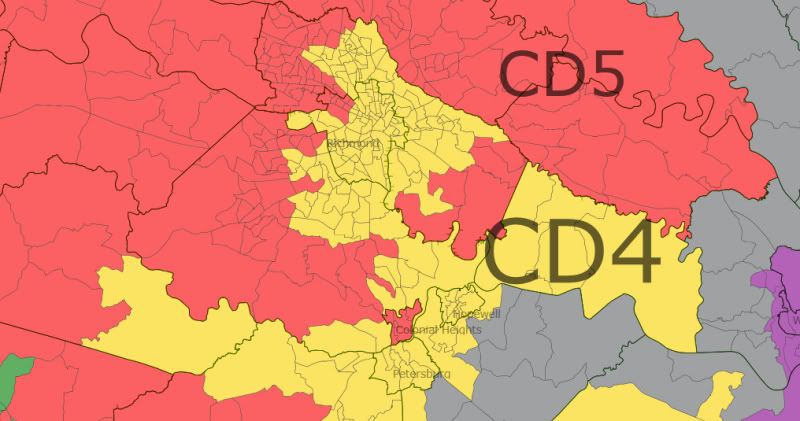
Here we have the VRA required minority-majority district. Fifty percent of the population is black; it is also about 6.5 percent Hispanic. It is chiefly made up of the state capital, Richmond, as well as probably the most African-American city in the state, Petersburg. It stretches down into Emporia and all the way east through Suffolk, Chesapeake, and into Portsmouth to also pick up more minority-heavy precincts. I would have preferred to leave the district at 46 or 47 percent, with blacks + Hispanics equaling over 50 percent but I’m under the impression that the law and the nature of Virginia politics would necessitate the minority-majority district having at least a 50 percent African-American population.

Photobucket

Here is the Richmond, Petersburg, and Hopewell section:

Photobucket

And the Suffolk and Portsmouth part:

Photobucket

The statistics for this district:

Photobucket

VA-05 (Red)

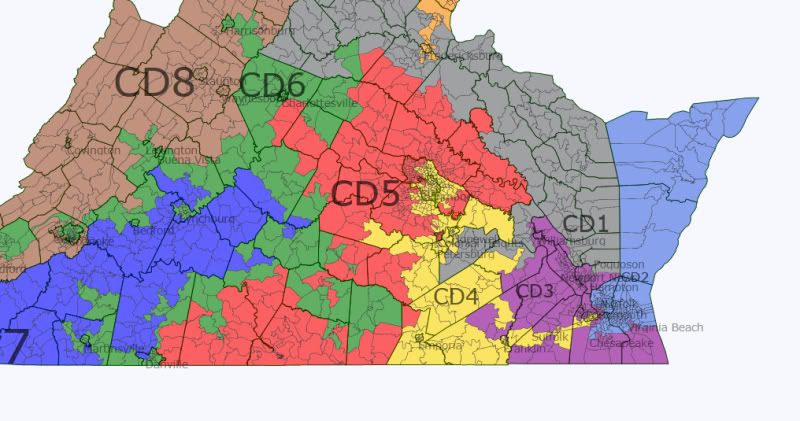
Despite what it may look like, this district is contiguous. Barely.

Photobucket

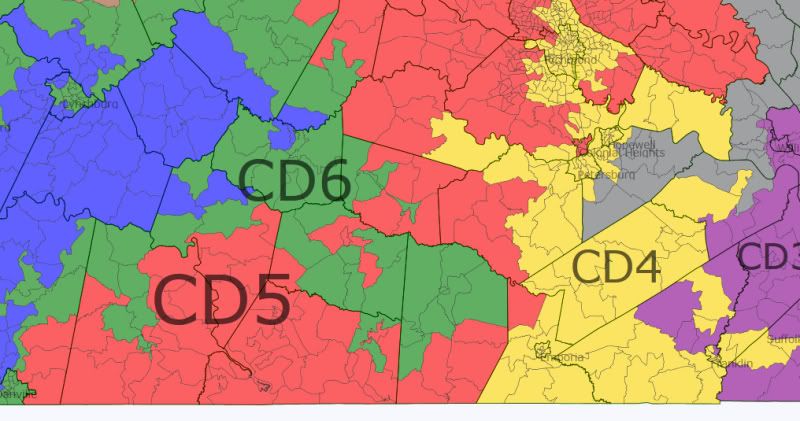
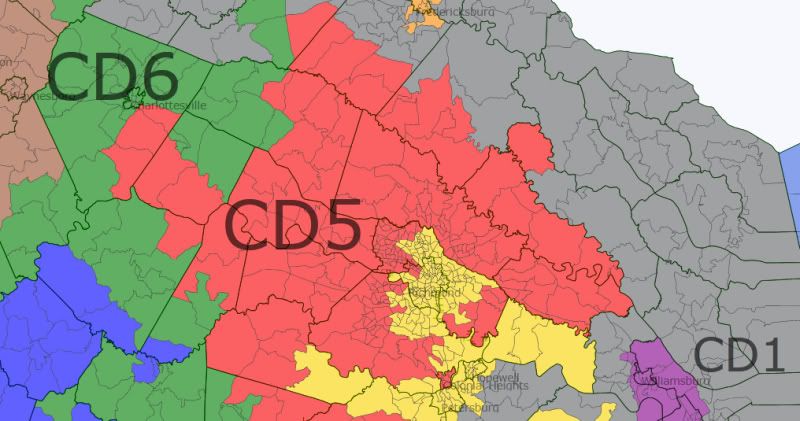
The district is made up of suburban Richmond and snakes all the way down to and along the North Carolina border for quite some distance. Just north of Emporia, at the top of Greensville County, the district barely connects west to part of Brunswick County to remain contiguous.

Photobucket

The district also makes its way up north to part of Spotsylvania County, not far away from what Virginians typically refer to as Northern Virginia.

Photobucket

The statistics for VA-05:

Photobucket

VA-06 (Green)

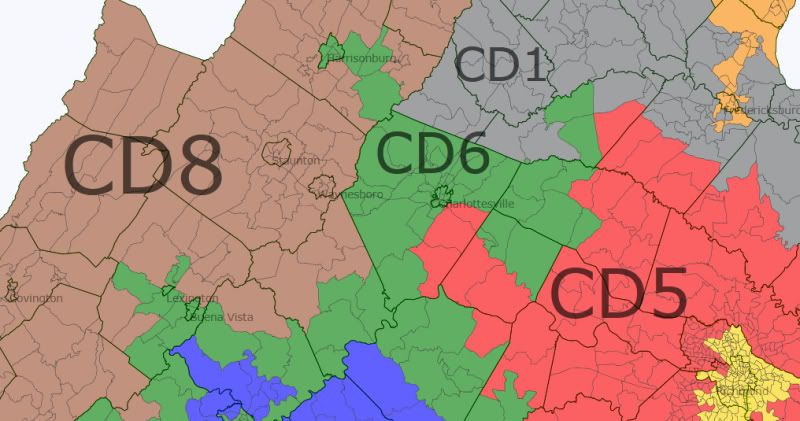
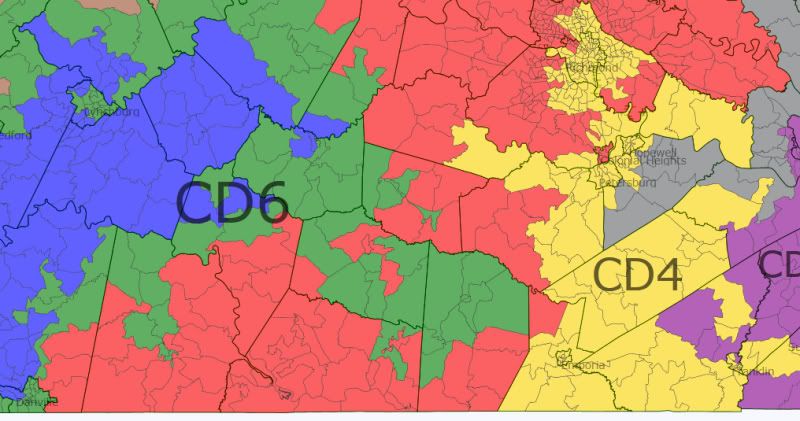
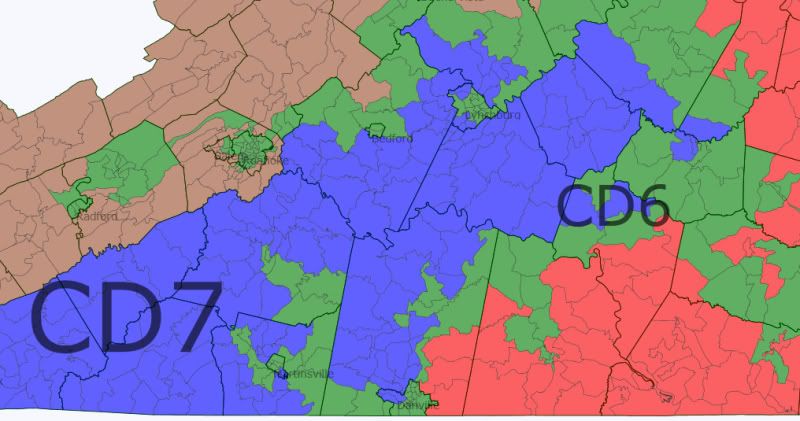
The most convoluted and gerrymandered district on this map is most certainly the sixth district. A friend of mine looked at what I had created and called it the “Virginia Python,” which seems an apt name for it. It essentially connects a series of college towns and strong minority areas to form a fairly Democratic district.

Photobucket

In the northern part of the district we have the liberal bastion of Charlottesville, where my alma mater, the University of Virginia, is located. Surrounding the city is Albemarle County, an increasingly blue part of the state. The most northern part of this district, however, is my home city of Harrisonburg, which is a university town as well (James Madison University and a small Mennonite college). The demographic trends of that city are the kind you want to see in a Democratic district. It has gotten bluer and bluer with each Presidential election as both the student population and the Hispanic population have grown steadily. In fact, the city of Harrisonburg is, per capita, one of the most diverse cities in the state. Each of its five precincts is over 8 percent Hispanic, with two having 16 and 18 percent, and one with 28 percent.

You’ll notice that the district also extends to Lexington in the west, the home of Washington & Lee University (and the Virginia Military Institute, though I expect it is not the major source of the town’s 61 percent Obama vote).

Photobucket

Moving southeast, the district meanders through parts of southern Virginia that have heavy black populations, as well as another university town, Farmville, where Longwood University is located.

Photobucket

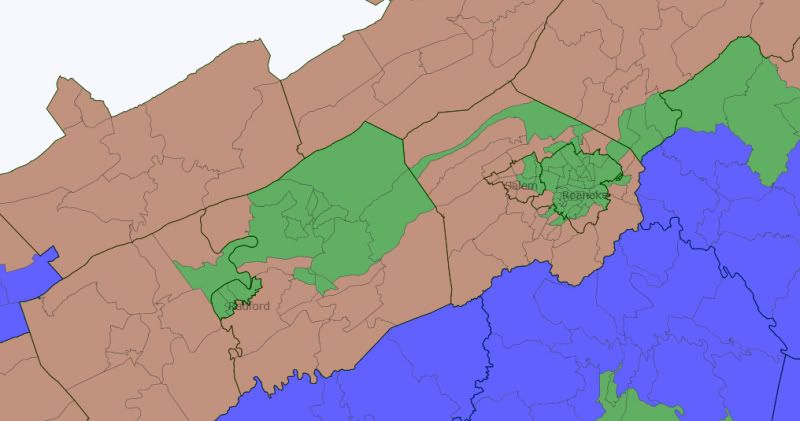
Lastly, as we move southwest, the district passes through the most Democratic parts of Lynchburg but more importantly this part of the district makes its way down to Roanoke, Blacksburg, and Radford. Roanoke is the largest city in the western part of the state, with about 97,000 people as of the 2010 census. Blacksburg, the home of Virginia Tech (the state’s biggest university) and Radford (home of Radford University) are also blue areas this district takes in.

To the very far south, the district adds in the fairly African-American cities of Danville and Martinsville, as well as the areas of Halifax, Pittsyvlania, Henry, and Franklin Counties that are more Democratic.

Photobucket

The statistics for the “Virginia Python”:

Photobucket

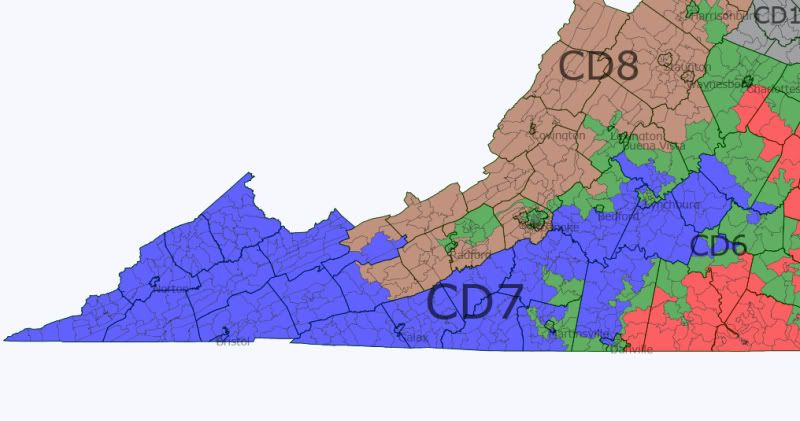
VA-07 (Navy Blue)

This is the most conservative district on the map, stretching from the far west corner of what is really Southwest Virginia (SWVA) into the more central southern part. SWVA has a strong union tradition in some of its counties due to the coal industry; however, the strength of unions and Democrats in general is clearly on the wane, illustrated by the surprising (to some) loss by Blue Dog Rick Boucher in the current VA-09 that makes up much of this area in 2010.

Photobucket

The statistics for VA-07:

Photobucket

VA-08 (Brown)

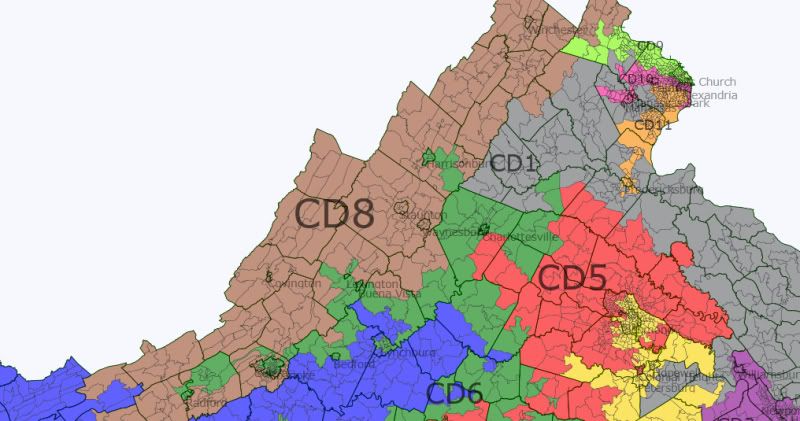
This conservative district makes up much of what is currently the VA-06 represented by Republican Bob Goodlatte. It stretches from Wytheville in SWVA to Winchester around the Maryland border.

Photobucket

I drew VA-08 to curl around Radford, Blacksburg, and Roanoke while taking much of Salem (a much more conservative independent city than most any part of Roanoke right next door). Here’s a close up of that:

Photobucket

The statistics for this district:

Photobucket

VA-09 (Neon Green)

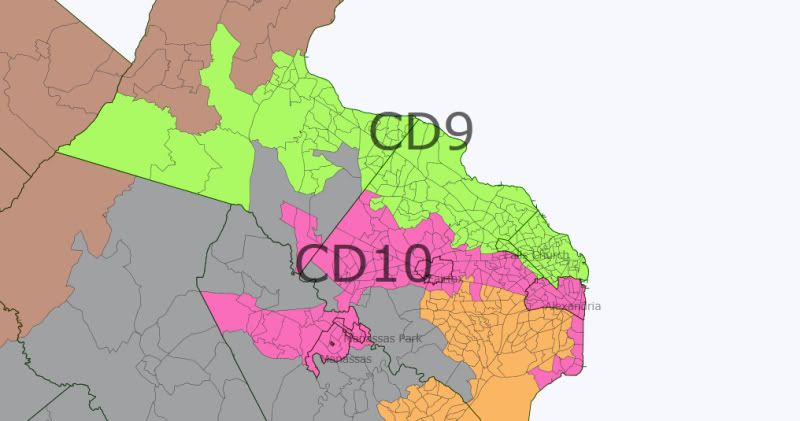
Finally, we have reached Northern Virginia (NoVA), the strategic lynch-pin in all Virginia Democratic strategies from here on out. This is the area of the state that is key to the transformation of Virginia from a sure-thing in the Republican column to its new status as a swing state. In drawing three NoVa districts, I wanted to create a fairly well-balanced trio that would all be strongly Democratic. VA-09 is the “Arlington” district in NoVA, encompassing the very blue county that abuts Washington, D.C. The district also makes it way through Falls Church and out all the way into the more developed and liberal parts of Loudon County, the fastest growing county in the state, which saw a more than 30 percent increase in population from 2000 to 2010.

Photobucket

The statistics for this district:

Photobucket

VA-10 (Pink)

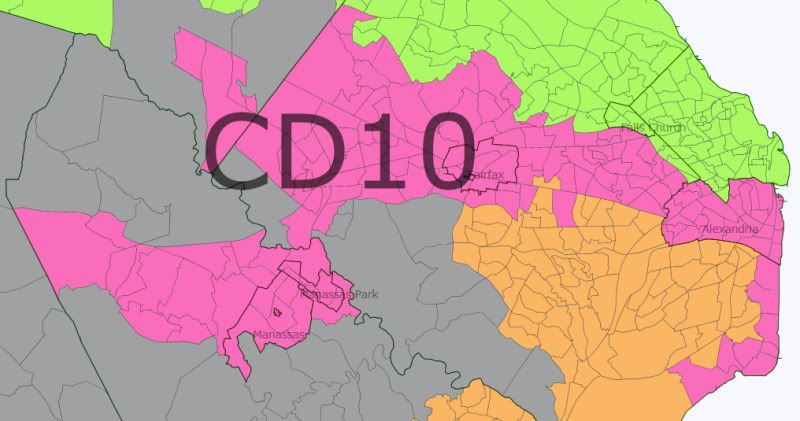
VA-10 contains all of Alexandria, one of the bluest cities or counties in Virginia, but also meanders out through Fairfax City, and all the way west to Manassas, taking in large chunks of Fairfax County, the state’s most populous entity (over 1 million people) in the process. The demographic and political trends of this area are generally favorable for Democrats, and having Alexandria in it almost guarantees that the district would remain blue even in the worst year for Democrats.

Photobucket

The statistics for this district:

Photobucket

VA-11 (Orange)

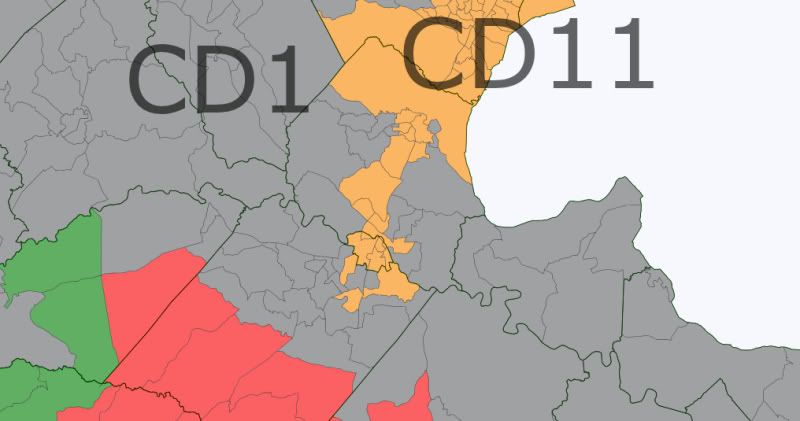
Lastly, VA-11 is made up of most of the most Democratic sections of Fairfax County (those directly next to Arlington and Alexandria) but runs through the Democratic-trending Prince William County and all the way to Fredericksburg, a growing city that is also a university town (Mary Washington University) and whose suburbs in Stafford County are increasingly Democratic.

Photobucket

The statistics for VA-11:

Photobucket

The overall statistics for the districts on this map:

Photobucket

Clearly, the four GOP districts are all vote sinks that would be sure-things in every election. Perhaps from the state party level this is not a great situation for Democrats because the VA GOP could focus all its resources on VA-02, as well as VA-06 and VA-03, without risking its hold on VA-01, VA-05, VA-07, and VA-08. At the same time, this map gives Democrats a good shot of holding seven seats a fair amount of the time, or at least six (a majority). Anyway, thanks for reading, Comments are definitely appreciated.

Virginia I hardly knew ye (6R-5D w/o Wolf)

You know, I've got to say, I find it interesting that so many people think that Virginia must be destined to have a shored up 8-3 map (with Gerry Connolly's 11th district being only marginally Democratic!) With Democrats still in control of the senate, I find it hard to believe that they're just going to just allow the Republicans to hold so many seats (and just shore them up). This map is probably not the one that gets made (I don't know where incumbents live and as such I probably drew a few out of where they live), but I think it's a lot closer to what Democrats are going to try for rather than just allowing Republicans to strengthen all of their seats. So my goal here was to keep 5 Republican incumbents, shore up Gerry Connolly, weaken Scott Rigell, and make Frank Wolf's district more Democratic (thus giving us the seat when he retires).

With that said, my vision for Virginia below the fold:

(Parentheses denote previous district numbers)

VA-05 (Yellow, Robert Hurt – R)

Dem 46.7% Rep 53.3% (Dem 47.3% Rep 52.7%)
Obama 48.2% McCain 51.8% (Obama 48.5% McCain 51.5%)
Black 22%, White 71.4%
Population 727,824

Notes: Not very much has changed here, though what changes happened favor the Republicans (the change might be slight, but Tom Perriello would have lost against Virgil Goode in 2008, small changes can make big differences). Robert Hurt probably won't complain too much about this district. (Likely R)

VA-06 (Blue-Green,  Bob Goodlatte – R)

Dem 40.9% Rep 59.1% (Dem 42.1% Rep 57.9%)
Obama 42.3% McCain 57.7% (Obama 43.2% McCain 56.8%)
Population 727,426

Notes:  In order to make VA-10 more Democratic, I needed to have this district absorb the more Republican parts of NoVA, but given that either way VA-10 needed to shrink, it's a good bet that something like this would have happened anyways. The district is heavily Republican and still retains Roanoke so Goodlatte can continue being re-elected indefinitely). (Safe R)

VA-07 (Grey, Eric Cantor – R)

Dem 42.2% Rep 57.8% (Dem 43.3% Rep 56.7%)
Obama 45.2% McCain 54.8% (Obama 46.6% McCain 53.4%)
Black 15%, White 74.5%
Population 726,655

Notes: Assuming Cantor still lives in the district (which is likely given that I didn't change the district much) he's going to be very happy with its configuration, he becomes safer now. (Safe R)

VA-09 (Bright blue, Morgan Griffith – R)

District profile (old numbers)

Dem 44.2% Rep 55.8% (Dem 43.7% Rep 56.3%)
Obama 41% McCain 59% (Obama 40.3% McCain 59.7%)
Population 727,973

Notes: So VA-09 doesn't really change too much, the district becomes somewhat more Democratic, although I doubt it matters much, as it's still going to be pretty safe for Morgan Griffith, unless Rick Boucher decides to run again. Safe R (Leans R if Boucher runs).


VA-01 (Blue, Rob Wittman – R)

Dem  42.5% Rep 57.5% (Dem 44.8% Rep 55.2%)
Obama 45.7% McCain 54.3% (Obama 48.4% McCain 51.6%)
Black 15.7% White 73.1%
Population 727,330

Notes: This map shores up Wittman, and ensures that even in an open seat situation it'll stay with Republicans (Safe R)


VA-02 (Green, Robert Hurt – R)

Dem  52.4% Rep 47.6% (Dem 49.1% Rep 50.9%)
Obama 56.5% McCain 43.5% (Obama 52.4% McCain 47.6%)
Black 27.4%, White 57.2%
Population 727,531

Notes: I'm not going to lie, this district is meant to make life difficult for Scott Rigell, and I think I succeeded. To be honest, I doubt that Glenn Nye would have beaten Rigell in 2010, but then again, another Democrat could probably do it, particularly with Obama on the ballot. (Toss-up against Rigell/Likely D Open)


VA-04 (Red, Randy Forbes – R)

Dem 46% Rep 54% (Dem 48.2% Rep 51.8%)
Obama 48.3% McCain 51.7% (Obama 51% McCain 49%)
Black 29.5% White 61.6%
Population 726,491

Notes: This district shores up Forbes somewhat, it goes from a district that Obama won by two to won he lost by two and a half. In an open seat in the right year this district could be trouble for the Republicans, but even then they'd be favored. (Likely R)


VA-03 (Purple, Robert Scott – D)

Dem 70.1% Rep 29.9% (Dem 71.3% Rep 28.7%)
Obama 74.8% McCain 25.2% (Obama 75.7% McCain 24.3%)
Black 52.5%, White 36.6%
Population 727,748

Notes: Well this monstrosity is a carry-over from the last map, to be honest, I'm not sure if the VRA requires this district to be majority-black or simply majority-minority but I kept it like this just to be safe. If I hadn't there's a good possibility I could have made the fourth more Democratic (probably not enough to give Forbes any problems, but enough to make it competitive in an open seat).


Virginia Bipartisan Map: 7-4 (Updated with Vote Totals)

Cross posted on my blog http://frogandturtle.blogspot…. which you should visit for more redistricting maps.

I was reading the recent diary on Virginia redistricting and saw people calling for a 7-4 Republican map. I decided to post this one to see how it works.

Both parties have a voice in Virginia’s redistricting process this year so expect either a quick compromise or a long battle that ends in a court drawn map. The Republicans control the Governorship and the State House but the Democrats control the State Senate. The Republicans hold an 8-3 majority of Virginia’s House seats, 3 of them were won in 2010. The Republicans will want to protect their freshman Robert Hurt (R) and Scott Rigell (R) who won in swing districts as well as Frank Wolf (R) whose district is trending Democratic. Trying to protect them all will be difficult because the Republicans will not want to create a dummymander. Therefore, I drew a 7-4 Republican map that the Republicans will like because although they lose one district, the 2nd and 5th districts are now more Republican. The Democrats should like this plan too because it strengthens the 11th district and creates a new Democratic district. I also ensured that the 3rd district’s African American population exceeded 50%. As for the districts on the map, there are 3 Safe Democratic, 1 Likely Democratic, 1 Lean Republican, 2 Likely Republican and 4 Safe Republican.

Here is a link with a map of Virginia’s current congressional districts (after clicking the link, scroll down to the bottom of the page:) http://www.nationalatlas.gov/p…

A few notes: The “Average 2000-2009” refers to the average performance of Democrats and Republicans in that district from 2000 to 2009. Change does not refer to the average performance; change refers to how well Obama performed in the new district compared to the old one. “Old Demographics” refers to the demographics of the old district in 2000.

Photobucket

Virginia

Virginia’s 1st Congressional District Rob Whitman (R) Blue

President 2008: Obama 143,841 47%, McCain 165,688 53%

Average 2000-2009: Democrats 101,210 44%, Republicans 128,630 56%

Change: McCain +3

Demographics: 6.1% Hispanic, 19.7% African American, 68.8% White

Old Demographics: 18.4% African American, 74.7% White

Status: Safe Republican

This district becomes more Republican as it loses parts of Newport News and Hampton in the south and losing Democratic Prince William County in the north. To keep population equal with other districts, the 1st district gains Republican leaning rural counties such as New Kent. The 1st district also picks up the Delmarva Peninsula which leans Democratic but the removal of most of Newport News makes this district more Republican.

Photobucket

Hampton Roads

Virginia’s 2nd Congressional District Scott Rigell (R) vs. Randy Forbes (R) ? Green

President 2008: Obama 139,807 48%, McCain 152,608 52%

Average 2000-2009: Democrats 101,215 46%, McCain 121,240 54%

Change: McCain +6

Demographics: 5.0% Asian, 5.9% Hispanic, 21.3% African American, 64.2% White

Old Demographics: 21.4% African American, 67.0% White

Status: Lean Republican

I could not do much to strengthen Rigell because I had to keep the 3rd district majority African American so it could not pick up many precincts that voted for Obama and had a low African American population. Anyway, I strengthened Rigell a bit by removing Hampton and most of Norfolk. I also added Republican parts of Chesapeake where Rep. Randy Forbes (R) of the 4th district lives. If he chooses to run in the 2nd, he will have the seniority advantage but more of Rigell’s current district is in the 2nd. Also, Forbes is popular because although Obama won his district, Forbes has won easily in the past few elections.

Virginia’s 3rd Congressional District Bobby Scott (D) Dark Magenta

President 2008: Obama 194,505 69%, McCain 85,991 31%

Average 2000-2009: Democrats 123,854 64%, McCain 69,604 36%

Change: McCain +14

Demographics: 51.3% African American, 39.0% White

Old Demographics: 56.0% African American, 37.7% White

Status: Safe Democratic

Scott’s district gets more Republican as it loses all of Richmond and picks up less Democratic precincts from the 1st in Newport News. I kept the district majority African American by picking up African American areas in Suffolk, Petersburg, and Sussex County. Although Scott’s district becomes more Republican, it is still extremely safe for him and majority African American. He should have no problems winning reelection.

Photobucket

Richmond Area

Virginia’s 4th Congressional District Robert Hurt (R) vs. Randy Forbes (R) ? Red

President 2008: Obama 133,903 42%, McCain 187,735 58%

Average 2000-2009: Democrats 97,669 41%, Republicans 142,126 59%

Change: McCain +17

Demographics: 23.3% African American, 71.1% White

Old Demographics: 33.1% African American, 62.0% White

Status: Safe Republican

Forbes may run here because this district contains some of his current territory in Chesterfield County and some southeastern rural counties. Hurt will run too because his home Chatham is in this district. If Forbes ran, As for Hurt’s district, I strengthened it because the Republicans will try to protect him from a tough race. I removed heavily Democratic Charlottesville from Charlottesville while adding parts of the current 4th district such as Republican Amelia County near Richmond. Hurt should have no trouble winning reelection here.

Virginia’s 5th Congressional District Vacant Eric Cantor (R) ? Yellow

President 2008: Obama 129,143 43%, McCain 175,646 57%

Average 2000-2009: Democrats 92,922 40%, McCain 137,356 60%

Change: N/A

Demographics: 5.4% Hispanic, 10.8% African American, 79.9% White

Old Demographics: N/A

Status: Safe Republican

Cantor’s 7th district is now Democratic so I expect him to run here, although his home is in the 7th district. The 5th district contains much of his current territory by including some conservative rural counties near Richmond such as Goochland, Hanover County in the Richmond exurbs, Spotsylvania County in the D.C exurbs and the string of rural counties in Central Virginia in Cantor’s current district. The 5th district also picks up some far D.C exurbs though because it represents Winchester and western Loudon County. Cantor used to represent a 53% McCain district that was trending Democratic but his district is now 55% McCain and the rural areas are not trending Democratic. Cantor should be safe here.

Virginia’s 6th Congressional District Bob Goodlatte (R) Teal

President 2008: Obama 137,543 46%, McCain 162,585 54%

Average 2000-2009: Democrats 102,396 44%, Republicans 130,058 56%

Change: Obama + 7

Demographics: 9.1% African American, 82.2% White

Old Demographics: 10.9% African American, 84.8% White

Status: Safe Republican

Goodlatte’s district becomes more Democratic as it loses heavily Republican Amherst County and picks up Charlottesville. The Republicans will probably want Charlottesville in Goodlatte’s district because it provided Tom Perrellio with his winning margin and more in 2008 and Goodlatte has enough Republicans in his district to offset Democratic votes in Charlottesville. Goodlatte should be safe here.

Virginia’s 7th Congressional District Vacant Gray

President 2008: Obama 186,082 61%, 121,294 McCain 39%

Average 2000-2009: Democrats 124,386 54%, Republicans 105,495 46%

Change: N/A

Demographics: 6.7% Hispanic, 34.5% African American, 52.0% White

Old Demographics: N/A

Status: Safe Democratic

Republicans may decide to sacrifice one district in order to protect Robert Hurt and Eric Cantor. The 7th district also helps Scott Rigell (R) in the 2nd district because by losing Richmond, the 3rd district has to pick up African American areas currently in the 2nd district so the 3rd can remain majority African American. Anyway, the 7th district is a combination of the current 3rd, 4th and 7th districts. The 7th contains all of Richmond, all of Henrico County, Chesterfield County’s close in suburbs and Hopewell. In the current map, the Richmond area is split between three districts but the Richmond area now has its own district so Richmond area legislators should like this district. Possible candidates for this seat could be State Senator Donald McEachin (D) who represents part of Henrico County or Henry Marsh (D) who represents some heavily African American parts of the district.

Photobucket

Northern Virginia

Virginia’s 8th Congressional District Jim Moran (D) Slate Blue

President 2008: Obama 178,372 66%, McCain 92,487 34%

Average 2000-2009: Democrats 146,592 64%, Republicans 82,791 36%

Change: McCain +7

Demographics: 12.5% Asian, 16.5% Hispanic, 9.9% African American, 57.9% White

Old Demographics: 9.5% Asian, 16.4% Hispanic, 13.4% African American, 57.1% White

Status: Safe Democratic

Moran’s district does not undergo major changes as Moran retains his base in Arlington and Alexandria. His district becomes a few points more Republican in order to protect Gerry Connelly (D) of the 11th district. Moran loses the close in suburbs near Alexandria such as Fort Washington to the 11th District. To compensate for the loss of the close in suburbs near Alexandria, the 8th district gains Democratic parts of McLean, Oakton, Herndon and Tysons Corner. Although Moran’s district is not as Democratic as its current form, Moran should have no problems winning reelection in the general or the primary.

Virginia’s 9th Congressional District Morgan Griffith (R) Periwinkle

President 2008: Obama 111,232 40%, McCain 166,719 60%

Average 2000-2009: Democrats 94,587 43%, Republicans 123,531 57%

Change: McCain +1

Demographics: 3.7% African American, 92.1% White

Old Demographics: 3.8% African American, 93.3% White

Status: Likely Republican

Griffith’s district does not undergo major changes as he loses Alleghany County which usually votes Democratic at a local level. The 9th district had slow population growth so the 9th gained Franklin and Bedford Counties which are both strongly Republican. It is possible Rick Boucher (D) who previously held this district will run again but it will be more difficult for him because of the new Republican counties in the district. Anyway, it was difficult to strength Griffith without creating convoluted lines or making the 6th district Democratic enough for a competitive race.

Virginia’s 10th Congressional District Frank Wolf (R) Deep Pink

President 2008: Obama 149,174 53%, McCain 132,937 47%

Average 2000-2009: Democrats 107,560 49%, Republicans 113,791 51%

Change: McCain +1

Demographics: 17.9% Asian, 11.0% Hispanic, 6.9% African American, 60.7% White

Old Demographics: 6.6% Asian, 7.1% Hispanic, 6.7% African American, 77.2% White

Status: Likely Republican

Northern Virginia is trending Democratic so drawing Wolf a district that will be safe Republican in the long term is impossible but I drew a district that should protect him for the next few years. I removed the western part of the district around Winchester which leans Republican but I also removed the Democratic parts of Herndon, McLean and Manassas. Although the 10th district is growing quickly, it had to gain a few more areas so it gained some moderate areas near Fairfax City and some conservative parts of Prince William County. Wolf is popular so he should hold this seat. If he retires though, Democrats will have a shot here.

Virginia’s 11th Congressional District Gerry Connelly (D) chartreuse

President 2008: Obama 149,097 60%, McCain 99,321 40%

Average 2000-2009: Democrats 105,702 55%, Republicans 88,099 45%

Change: Obama +5

Demographics: 10.6% Asian, 21.4% Hispanic, 17.4% African American, 46.9% White

Old Demographics: 10.9% Asian, 9.1% Hispanic, 10.1% African American, 66.8% White

Status: Likely Democratic

Connelly faced a tough race last year from Keith Fimian (R) in 2010 which is a high water mark for Republicans. If Connelly could survive in 2010, he can survive any year barring a major scandal. Anyway, I strengthened Connelly so he would not have another tough race. I removed the moderate areas near Fairfax City, Fimian’s home Oakton, and conservative parts of Prince William County. I added Democratic areas near Alexandria and Democratic Manassas. These changes should protect Connelly

By what margin will Bob Shamansky win?

View Results

Loading ... Loading ...
WI-State Senate: Population by District

With the release of census data for Wisconsin, we can also crunch population numbers by State Senate district – and to see potentially how redistricting could affect the various senators with recall campaigns mounted against them.

Without further ado, here’s the table – the eight rows highlighted in green are the eight recallable Republican senators.

As also shown in the data by Congressional district, there’s a shift from Milwaukee to Madison, population wise.  The Milwaukee County based districts (3rd – 8th) are all quite underpopulated, while the Madison-based 16th, 26th, and 27th are now overpopulated.  The MSP exurbs – now expanding into St. Croix County – have also grown, as shown in the overpopulation in the 10th (Harsdorf, R).

Will this affect the Recallable 8?  I’m skeptical – it’s unlikely, IMO, that we’ll get anything friendly from an unfriendly trifecta. Likely, the relative stability means that not too much will have to change – most of the recallable eight have districts that were stable population wise.  Harsdorf’s 10th will have to lose some – but that could be easily some Dem-leaning territory given to Robert Jauch’s 25th (D).

The Milwaukee County districts will need to expand outward…which could conveniently remove the Dem-leaning North Shore from Alberta “anything but” Darling’s 8th.  Additionally, given that Milwaukee County is surrounded on three sides by heavily Republican suburbs, it’s pretty easy to slice that pizza.  On the flip side, the growth in Dane County hasn’t reached a point yet where that would have to be sliced four ways.

So, unless we actually manage to recall Hopper, Darling, Kapanke, et al., the census numbers don’t necessarily indicate any help to come from Senate redistricting…especially not with an unfriendly legislature drawing the maps.

New South Wales 2011 election part 2:

Author’s Note: Cross posted at Red Racing Horses. Part 1 (dealing with Labor’s electoral woes is here, recommend reading that before this) is linked here:

http://www.swingstateproject.c…

And for a good analysis about the election, including specifically what seats will be in play this election, read this page as well:

http://www.abc.net.au/election…

The New South Wales 2011 state election

Part 2: Labor’s still heading to oblivion and how they got there.

In the Part one of this two part diary series dealing with the New South Wales election which is to be held in less than 15 days we examined the ruling Labor Government’s imminent annihilation at the ballot box. This diary will deal with the latest developments on the campaign trail and three key issues: public transportation, corruption and power privatization, issues that have helped sink Keneally and her party’s chances of even having enough members in state parliament to form a credible opposition. If things get any worst for Kristina Keneally and NSW Labor (and they certainly still can) Keneally could become the Kim Campbell of New South Wales politics and perhaps Australian politics.

Before we start talking about the three issues I listed above, we must first start talking about the recent developments on the campaign trail. And of course as electoral junkies such as ourselves must do is read the latest polling….another disastrous poll for Labor. A poll done by Galaxy (cross tabs available here) on behalf of the conservative leaning Sydney newspaper Daily Telegraph confirms what every other poll (well there have been 3 to be exact) has found. Labor’s primary vote is stuck at 23% with the Liberal/National coalition far ahead at 50%, the Greens at 14%. And when 2PP is applied, the Liberals are at 64% with Labor at 36%. Labor’s 50 seats in state parliament would be reduced to just 16. A loss of over 68% of their seats taking with them back benchers and cabinet ministers and perhaps the premier as well.

Labor’s expensive and overwhelming ad campaign and Keneally’s stellar performances during the debates have not moved the needle enough to matter. And her appeals to not give O’Farrell and the Coalition a blank check are falling on deaf ears with 66% of voters already making up their minds. And as a sign of how much the electorate has come to despise Labor, 70% of those surveyed in the poll say O’Farrell and his party will win government only because Labor deserves to lose while only 21% believe O’Farrell deserves to be elected in his own right.

Not only that, but the Greens are expected to pick up two Labor seats, Marrickville and Balmain. Marrickville is especially heartbreaking towards Labor for the seat is held by popular MP and Deputy Premier Carmel Tebbutt. A recent Daily Telegraph-Galaxy poll shows Tebbutt trailing Marrickville’s Greens mayor Fiona Byrne 57-43 on a 2PP basis. Education Minister Verity Firth who occupies the seat of Balmain is expected to lose her hotly contest reelection race to Leichhardt council mayor Jamie Parker.

Transport Minister John Robertson is also in the political fight of his life as he attempts hold the usually safe Labor seat of Blacktown. Robertson has been tapped by party insiders to replace Keneally as leader after the election, but to do that he has to drop down from the upper house to parliament. But the toxic climate facing NSW Labor could be Robertson’s undoing as internal polling shows Robertson would of lost the seat two weeks ago if the election was held then. Labor is reportedly poring in money and volunteers into Blacktown in order to get Robertson elected.

But the Greens hopes of perhaps picking up some more Labor seats like Keneally’s seat of Heffron were dealt a perhaps crippling blow when the Liberal party announced they would direct their voters to preference no one except the Liberals. A similar approach was used by the Liberals during the Victorian state election last year which deprived the Greens of a chance to win a lower house seat in Melbourne. On the other hand the Greens might of dealt Labor a death blow by announcing last month they would would preference neither Labor or the Liberals, the only exception being that Greens voters will direct their preferences towards Nathan Rees as he attempts to hold his seat of Toongabbie.

Anyway, two weeks ago the Liberal Party held their campaign launch in Penrith which is in Western Sydney. Western Sydney is traditionally Labor territory, but the Liberals are poised to make major inroads in the region as Labor voters are prepared to turn on their party in droves and in the process delivering a coalition government. Also Penrith was the site of a landslide special election last year which resulted in the Liberals picking up a Western Sydney seat for the first time in 20 years. Federal Opposition leader Tony Abbott was also at the rally where he called the Keneally Labor government the worst NSW has had since Captain Bligh was deposed during the rum rebellion….in 1808. He also offered a glowing endorsement of Barry O’Farrell by telling the crowd, “He ain’t pretty, but he’s pretty effective!

While the rally was being held, Labor and Greens protesters were outside heckling Liberal supporters blocking the entrance. While the protesters were hoping to force Tony Abbott and Barry O’Farrell to push their way through the gauntlet of protestors, they instead slipped into the auditorium through the back entrance. Touche.


From left to right: Young Liberals blocking the entrance and Young Labor  protesters.

Politics in Canberra have found their way into NSW with Labor PM Julia Gillard’s recently unveiling her carbon tax proposal causing a lot of heartburn for NSW Labor at a time they don’t need anymore bad news. In fact by proposing a tax on carbon, Julia Gillard broke one of her campaign promises where she promised on TV not to push a carbon tax under her government. Though Gillard didn’t have much choice but to propose a tax on carbon because she needed secure the support of the Greens senators in the Australian senate (who will hold the balance of power in the senate come July) to help push her agenda through.

As expected, Tony Abbott is screaming bloody murder saying Gillard lied to the Australian people and demanding Gillard call an election immediately to get a mandate to impose a carbon tax. And in NSW, as expected, Barry O’Farrell and the Liberals quickly lined up against it while Keneally has being doing her best to defend Gillard’s proposal. Not only did O’Farrell say a carbon tax would raise prices on fuel, food, electricity all the usual things opponents of carbon taxes/cap & trade constantly say but in a nod towards Western Sydney, O’Farrell said that a carbon tax would force train commuters to pay more. To hammer the message home, the Liberals recent launched a mobile billboard that will “travel to those parts of the state that will be hit hardest by Labor’s carbon tax.”

This image will be on a Liberal party mobile billboard. From left to right: Julia Gillard and Kristina Keneally. Credit to NSW Liberal Party.

With the Keneally government all but certain to go down in a crushing defeat, Labor MP’s everywhere have been doing anything they can to save themselves with Labor MP’s in marginal and in seats not super safe for the party have been accused of trying to hide the fact they are part of the Labor party. For example Roads minister David Borger who’s seat of Granville (carried by Labor by a 11% margin in 2007) is expected to change hands come March 26th was caught using post it notes to cover up his party affiliation on campaign signs at his campaign office. (Australian law requires candidates to clearly display their party affiliation in the lower right corner of their campaign posters.)

Spot the Labor candidate if you can. Credit to Brianne Makin and the Daily Telegraph.

With the time running out for Labor, there are signs that even the unions (a reliable Labor constituency) have abandoned all hope of a Labor victory with a recently launched ad where one of the people in the ad tells two other people with her that, “…they reckon we’re getting a new state government.” The three people in the ad then proceed to in vague terms talk about what an O’Farrell government would mean for them. Even the person running the Labor campaign efforts and party secretary Sam Dastyari told the Daily Telegraph that it was basically all over except the screaming:

“Barry O’Farrell is going to win this thing, and he is going to win it big,” Mr Dastyari said. “But he doesn’t deserve the majority he will get.”

Keneally herself all but conceded defeat when at a campaign stop in Sydney yesterday, she delivered what could be called a doomsday speech. She warned voters to, “Take care of your neighbor because there will be fewer police to do that for you.” Keneally also warned parents to read to their children at night because a good public education would become a memory under a Coalition government because, “…our teachers join nurses on the unemployment queue.” O’Farrell was livid at Keneally’s speech calling it bizarre and called it a new low because Keneally was seeking to scare the most vulnerable in the community.

Now we will examine several key issues that have brought NSW Labor to the bring of political extinction. The first of them being power privatization.


Power privatization (You’d think the party that supports more “private sector” involvement in government would do this):

When the talk heads discuss on election night why the Keneally government went down in When the talk heads discuss on election night why the Keneally government went down in blazing defeat, they’ll probably talk mostly about corrupt MP’s and Labor’s half baked attempt to privatize the state’s electrical assets. Plans to privatize the state’s electrical assets began shortly after the Iemma Labor government was reelected in 2007. To make it clear, Labor was not reelected in 2007 because they were loved by the public, but because of hatred towards then PM John Howard (who you might remember as Bush’s loyal ally on Iraq and saying that an Obama presidency would be the best thing that ever happened to Al-Qaeda) and the fact the opposition led by Peter “Member for Vaucluse” Debnam was beyond hopeless. To prove how loathed the Iemma Labor government was already at this point, three major newspaper, The Australian, the Sydney Morning Herald and the Daily Telegraph threw their support behind the Coalition, though they indicated this was a lesser of two evils decision than anything else.

Federal politics came into play here. With the 2007 Federal election (which would see Kevin Rudd becoming the first Labor PM in 12 years) less than a few months away, Kevin Rudd and the National Labor party wanted Iemma to drop his plans for power privatization until after the election. Labor was running heavily against the Howard government’s “WorkChoices” legislation (think Scott Walker’s proposal to eliminate collective bargaining except on steroids) and the unions were helping Labor in this endeavor by pumping in millions of dollars in attack ads. Rudd did not want the unions in NSW to turn their attention from Howard and the Liberals to fighting Iemma’s privatization schemes.

In a secret meeting between the two, Iemma agreed to drop his power privatization scheme until after the election and Rudd would help, “…. fuck them [the unions] together.”

Iemma only kicked the can down to an epic confrontation between himself and the unions which exploded during the May 2008 party conference. There the government and the unions turned the usually grassroots like conference to a angry debate with cabinet ministers stepping up to the podium to sell the power privatization plan to a skeptical audience and various speakers coming to the podium ridiculing the plan including ALP President Bernie Riordan.

But the show was stolen by then treasurer and architect of the privatization plan Michael Costa’s newsworthy outbursts during during the conference. The first of which observers could hear Costa yelling at Premier Iemma telling him not to accept the conference’s decision if they come out against power privatization. The second outburst involved Costa angrily eviscerating the secretary of Unions NSW and future Transport Minister John Robertson with Costa telling him, “You blokes can get fucked! You’re going to look like dickheads on Monday morning!”

Then came Costa’s speech to the delegates which TV commentators would label “Mussolini-like” where Costa would berate and harangue the audience in a fit of rage:

“It is an absolute joke to come into this conference and claim and claim that prices are going up. When we are adopting a policy, the Gano policy which will increase prices by 30%. So that’s a falsehood #1!

Falsehood #2! Jobs will go offshore! Jobs will go offshore! Half the people people in this room are wearing yellow t-shirts made in China! In China! Your a joke! Your a absolute joke! You don’t care about that, you don’t care about jobs offshore, it’s convenient, it’s convenient. The reality is, the reality is, more power stations means more jobs! More power stations means more jobs! Jobs are not going offshore! We will have more jobs!”

Costa’s temper tantrum. Credit to Steve Lunam of the Sydney Morning Herald.

The delegates assembled would overwhelmingly reject the Iemma government’s power privatization plan 702 to 107. A day later though, Iemma went full steam ahead with his plans, regardless of what the unions and party faithful though. In late August Parliament was reconvened in order to vote for a power privatization bill. Iemma had a problem though, he could not corral the votes needed to pass the bill on a party line vote so he turned to the Coalition for help. Unfortunately for Iemma, the Coalition declared their unanimous opposition to Labor’s efforts to privatizing power. Without the support of the Coalition and Iemma facing the humiliating sight of 14 Labor MP’s crossing over and voting against the bill, it was quickly yanked from the floor.

While Iemma began exploring alternative ways to sell the state’s power assets off without needing parliament’s okay, his deputy premier John Watkins resigned from parliament. This was the catalyst for a major cabinet reshuffle that would prove to be the end of the Iemma government. The same day Iemma sacked Michael Costa as treasurer, his cabinet choices were rejected by the party’s powerful right faction and Iemma was forced to resign from parliament. He was then replaced as premier by Nathan Rees, a freshman MP who hailed from the party’s left faction. Rees only lasted a little over a year where after angering every power broker on the NSW Labor’s right faction was canned himself and replaced by Planning Minister Kristina Keneally. Before Rees was thrown out the door he took a shot at any challenger labeling them a puppet of Eddie Obedid and Joe Tripodi, the two major power brokers in the NSW Labor’s right faction.

With Keneally firmly in control of the reins now, Labor would go past the point of now return on power privatization. And on December 15th, 2010, Treasurer Eric Roozendaal announced the sale of state owned power companies Country Energy and Integral Energy were sold with the output of the power generator Eraring sold to Origin Energy, all for $5.3 billion. Two private companies, TRUenergy and Origin now had a duopoly over 85% of the state’s energy market.

The opposition quickly blasted Labor saying they basically gave away the electricity assets to the private sector and analysis concluded that power costs would rise for many people. Also lending credit to the opposition’s attacks were the fact 8 out 11 board members on the state owned companies of Eraring and Delta Electricity resigned before the sale announced forcing Roozendaal replace them so the sale could go ahead. It would be revealed a month later the government only pocked $3.27 billion from the sale. An attempt to offload the rest of the state owned power assets would fail when the political climate became too toxic to even think of buying the rest of the state’s assets.

And in a move labeled as the “trashing of democracy” by O’Farrell, Keneally ordered parliament to be shut down days after the sale in order to prevent an inquiry into the merits of the deal as confirmed by papers acquired by the Coalition a few weeks ago. An inquiry into the deal happened anyway and they came to the conclusion the sell off was a fiscal disaster. Keneally and Roozendaal blasted the report as a political cheap shot while O’Farrell reveled in the findings. Unfortunately if the state government were to backtrack on the deal, they would have to pay hundreds of millions of dollars in compensation, something no one is in the mood for.  

The NSW Labor hall of shame aka scandals, corruption, etc.

1. Cherie Burton: Loses driving license for a year after being convicted of drunk driving. (Expected to lose reelection.)

2. David Campbell: Caught leaving a gay sex club. Forced to resign as Transport Minister. (Retiring, Labor should be able hold his seat if only barely.)

3. Angela D’Amore: ICAC (Independent Commission Against Corruption) found D’Amore guilty of giving her staff kickbacks. She was canned immediately as parliamentary secretary for police by Keneally herself. Facing criminal charges. (Barred from running again, Labor expected to lose her seat.)

4. Karyn Paluzzano: Caught LYING to ICAC about giving her staff kickbacks. Quickly resigned from parliament over the matter. (Labor lost her seat of Penrith in a landslide special election.)

5. Milton Orkopoulous: Resigned from parliament over charges he raped several young boys. Subsequently convicted on 28 charges including 8 for having sex with a minor, 13 counts of supplying weed, four counts of supply heroin and three counts of indecent assault on a minor. (Labor held his seat easily in the 2007 election.)

6. Matt Brown: Resigns as police minister after a few days on the job after being caught having a wild night at a party which included him dancing in his underwear and simulating a sex act on a fellow MP, while telling the MP’s daughter who was watching the affair in probably horror he was, “titty fucking” her mother. (Expected to lose reelection.)

7. Tony Stewart: Sacked as small business minister after Rees found out he bulled a female staffer. (Retiring, Labor should be able to his seat of Bankstown.)

8. John Della Bosca: Resigned as Health Minister after caught having an affair with a 26 year old woman. He was 28 years her senior.

9. Ian MacDonald: Sacked as state development Minister after caught misusing taxpayer funds to pay for a trip to the Middle East. (Resigned his seat in the upper house on June 7th, 2010 and replaced by Luke Foley.)

10. Paul McLeay: Resigned as Ports and Waterways Minister after caught and admitting to using parliamentary computers to access porn and online gambling websites. Days later the search was deemed illegal and not accurate but the damage was already done. (Expected to lose reelection.)

Public transportation (well really rail to be specific)

Unlike in this country where spending money on public transportation specifically passenger rail is considered wasting good money that can be used to build highways and roads, passenger rail is very important in Australia. Case in point, one of the reasons why the Brumby Labor government went down in Victoria last year was because voters were angry at how the rail system in Melbourne and the suburbs continued to be in poor shape. And in NSW, the Keneally government has been dogged repeatedly over the state of Sydney’s commuter rail system named CityRail, or as the locals like to derogatorily call it, ShityRail.

And for good reason. With hundreds of thousands of Sydney commuters using CityRail daily, the system is plagued by frequent overcrowding and many of the older trains don’t even have air conditioning with the train cars supposed to replace them having been delayed over and over again. (They still haven’t been put into service.) In addition CityRail is a favorite of vandals who often tag the trains, some even brazen enough to film their exploits in broad daylight.

A typical commute on CityRail during rush hour. (And yes those are people standing in the stairwell.)

But that’s not where the juicy stuff lies. Unlike in this country, the argument is not over if money needs to be spent on brand new rail lines, but where the money should be spent. And at the heart of the argument lies a promise Gillard made during the Federal campaign last year.

In an effort to hold the marginal seat of Bennalong which was taken from the Liberals when Maxine McKew defeated PM John Howard in 2007, Gillard promise the Federal government would

earmark $2 billion dollars towards the Epping to Parramatta rail link (EPRL). The Carr Labor government had actually began construction of the EPRL years ago, but the line was truncated to the half way point at Chatswood after costs blew out. (The scaled back rail link still managed to come several years late and way over budget.) Of course this announcement came out of nowhere, the state government had no plans to finish the rail link until Gillard coughed up the funding to do it. And Labor boss Karl Bitar would later admit Gillard should of never promised to help finish the rail link. The Liberals seized upon the announcement and labeled it as pure pork barreling and aired attack ads criticizing the deal. And even the locals were skeptical that the line would be built this time.

And to top it all off, Maxine McKew lost her reelection fight to Liberal candidate John Alexander. But after her concession speech, Maxine McKew was more than happy to vent her anger of Labor’s national campaign that led it to the lowest percentage of the vote since the 40’s.

Even though construction of the rail link is scheduled to start next year, the Coalition has vowed to put the project on the back burner for the foreseeable future in favor for the North West and South West rail links (South West rail link is already under construction). While Labor is committed to building the EPRL, Western Express and finishing the South West rail link. The Coalition has also vowed to forced Canberra to divert the federal money earmarked for the EPRL to the North West rail link which Gillard has flatly out refused to do.

Unfortunately for the Keneally government, internal documents leaked to the Daily Telegraph this week revealed that the EPRL will be opened a year behind schedule and over budget. This is all if the the rail link is even built which the Coalition has pledged not to.

Further down the weeds, Barry O’Farrell has pledged to add 135 CityRail express trains a week for commuters in Western Sydney and the Central Coast. Both regions are must win areas for the Coalition. While Keneally has promised free wifi for all CityRail commuters if they win the election.

Two weeks ago Keneally gave her constituents a “Please keep me in office” gift by slashing train fares at two stations in her district, which went into effect a few days after the announcement. The Coalition pledged to support the plan, but they blasted it as pork barreling noting the timing was very convenient and it directly benefited her constituents.

Final words and thoughts

Well if you managed to read through this diary I congratulate you. This diary took me a week to write but I assure you it was fun to right.

Now you maybe wondering what will this mean for Federal Labor and where will Labor suffer another loss. In the short term losing control of another state will be bad for the Gillard government. Especially since O’Farrell as indicated he will cause endless grief for her especially over the carbon tax proposal. But in the long run it might be better for the Julia Gillard to let NSW Labor go down in a flaming defeat. And it also might be good for Gillard to watch the Bligh government in Queensland go down in defeat next year as well. One of the reasons why NSW Labor is in for an electoral wipeout come the 26th is that they really wore out their welcome. It would of been better for the party to lose in 2007 in order to dissipate the anger building up against the party for years. NSW Labor also didn’t help itself by members in the party acting like buffoons and throwing good ethics into the garbage.

Both the Keneally and Bligh governments have become increasingly toxic and weighed down Federal Labor in recent years. The Liberal Party last election aired attack ads tying Gillard to Keneally and Bligh. And especially in Queensland where both the state and Federal Liberal parties worked overtime to tie Gillard to the unpopular Bligh government. And it worked with the bulk of Labor’s loses coming from Queensland.