Land of Enchantment, Land of Redistricting

The daily digest from the other day about the Democrats' plans for New Mexico got me thinking about creating my own New Mexico map. My goals in this map were very simple, make NM-01 more Democratic while shoring up Steve Pearce in the south (making Pearce happy with the map makes it harder for Republicans to reject it, especially given that there is a real risk that a court-drawn map makes NM-02 more Democratic, and Pearce is going to have a hard time winning a district that votes for Obama). But having said that, these caveats apply:


1. This map is probably not what a court would draw

2. It's better for Democrats than Republicans (although as I mentioned before it strengthens Steve Pearce, and that probably would at least give Pearce

3. The partisan percentages are only rough estimations, as I had to use the election data from 2008 (with 2000 population) compared to using the actual 2010 census data, as such my partisan numbers might be off somewhat (though probably not enough to make a difference)

Even with these caveats in mind, I still think there is a good chance that Democrats at least try to pass this type of map and try to get Martinez to go along with it by making Steve Pearce happy the maps below the fold:

Format: New stats (old stats)


NM-01

Pop: 685,912 (-481 dev.)

Democraphics

White: 39.8%/44.6% VAP (41.8%/46.7% VAP)
Hispanic: 47.2%/43% VAP (48.2%/43.7% VAP)
Native American: 6.6%/6.3% VAP (3.6%/3.5% VAP)

Partisanship: Obama 60.8% (59.6%)/McCain 37.8% (39.1%)

Notes: The first district gets a bit of a make-over here, it sheds all of Torrance County and loses most of Valencia County (while retaining a reservation). Really, all I've done to NM-01 is to shift it to the west, it loses the very northeastern part of Bernalillo County to the second district, while in exchange taking the western parts of Bernalillo county and absorbing Cibola County and the reservations in McKinley County.


NM-02

Pop:  686,837 (dev. +444)

Demographics

White: 42.1%/47.4% VAP (40%/45.2% VAP)
Hispanic: 52.6%/47.4% VAP (51.9%/47% VAP)
Native American: 1.7%/1.6% VAP (4.5%/4.3% VAP)

Partisanship: Obama 47.5% (48.5%)/McCain 51.1% (50.1%)

Notes: So you'll notice that the second district has become a touch whiter and more Hispanic, that's because NM-01 has absored most of reservations that were here before. Another big thing that happens here is that it sheds the more heavily Democratic northwestern part of Bernalillo County and takes in the more Republican northeastern part, as well as taking the town of Edgewood, taking all of Torrance County, and nearly all of Valencia county. To make the population as close as possible, it was also necessary for the second district to take small parts of San Miguel county. The major difference happen by trading some populations between CD-01 and CD-02. This is a district that Steve Pearce would be quite happy with.


NM-03

Pop: 686,430 (dev. +37)

Demographics

White: 39.6%/43.9% VAP (39.6%/44% VAP)
Hispanic: 39.1%/36.4% VAP (39.0%/36.3%)
Native American: 17.3%/15.9% VAP (17.3%/16% VAP)

Partisanship: Obama 61% (60.9%)/McCain 37.8% (37.9%)

Notes: Very little changes about NM-03, it sheds a little population to NM-02 and NM-01 for population purposes, but otherwise its core completely.

My first stab at Congressional Redistricting in Florida (Part 2: Central Florida)

Tampa Bay Area

FL-5 (Rep. Richard Nugent, R-Spring Hill), Yellow

It now covers just 3 counties instead of all or parts of 8 counties in its current form (removed from Lake, Levy, Marion, Polk and Sumter counties), and is designed as an exurban Tampa seat.  It takes most of Citrus and Pasco counties (minus Port Richey and New Port Richey), plus all of Hernando County (Nugent’s political base, as he’s formerly the Sheriff there).  Safe Republican.  

FL-9 (Rep. Gus Bilirakis, R-Palm Harbor), Cyan

This district is minimally altered from its present form, except that it loses Clearwater and parts of western Pasco County.  It also exchanges some Tampa suburbs with FL-11 and FL-12.  Bilirakis’ home base of Palm Harbor and northern Pinellas County, however, is still here.  Safe Republican.

FL-10 (Rep. C.W. Bill Young, R-Indian Shores), Pink

It gains Clearwater from FL-9, and black parts of St. Peterspurg from FL-11; but loses Dunedin and parts of Palm Harbor to FL-9.  Still totally within Pinellas County, and is the most competitive district in the Tampa Bay area.  Lean Republican with Young, Toss-Up/Tilt Democratic in open seat scenario.


FL-11 (Rep. Kathy Castor, D-Tampa), Light Green

This is the most drastically altered district in the Tampa Bay area, as it is now confined within Hillsborough County.  It loses its arms into Manatee and Pinellas counties, and gains some more conservative suburbs to the east.  It has a lower black percentage but a higher Hispanic percentage than its previous form.  Still plurality white (and 52% white voting age population/VAP).  Castor should be fine if she survives her initial election in this district.  Leans Democratic.

Central Florida

FL-8 (Rep. Daniel Webster, R-Orlando), Lavender

This district is recast to become solely within metro Orlando (Removed from Lake and Marion counties), it also loses its Osceola County portion to FL-12.  However, it gained southeastern Seminole County (Altamonte Springs and Longwood etc.) and eastern Orange County from FL-24, plus bits of FL-3 and FL-7.   As it subsumes most of the conservative parts of Orange County with a slice of traditionally GOP Seminole County attached to it, Webster should be fine here, although the growth of Hispanic population could make the district more interesting towards the end of the decade.  Likely Republican.

FL-12 (Rep. Dennis Ross, R-Lakeland), Baby Blue

Polk County (formerly split with FL-5 and FL-15) is now entirely within this district.  It loses the Hillsborough County portion to FL-9 and FL-13.  It is less white and more Hispanic (about 22%) than its previous incarnation, thanks to the inclusion of parts of Kissimmee.  For now, Ross should be fine, but it seems likely that this district will undergo  demographic changes similar to FL-8 down the road.  Likely Republican.

FL-15 (Rep. Bill Posey, R-Rockledge), Orange

This district now contains all of Brevard County (previously split with FL-24) and most of rural, less Hispanic portions of Osceola County.  It is removed from staunchly GOP Indian River County and takes most of Okeechobee County that still has hints of local conservative Democratic heritage (but votes GOP in federal races).  Posey should be fine here.  Likely Republican.


FL-24 (Rep. Sandy Adams, R-Orlando), Deep Violet

This district now contains most of Seminole County (Oviedo and Sanford etc.) and virtually all of Volusia County, but removed from Brevard and Orange Counties.  Seminole’s GOP heritage should give it a GOP tilt, but a moderate Democrat from Volusia should be competitive here in neutral or Dem-friendly years.  Toss Up/Tilt-Republican.

FL-27 (NEW SEAT, Sky Blue)

The Democratic votes freed up from FL-3 and FL-8 are the basis of this plurality Hispanic (about 33% of VAP) district (plurality white in VAP at about 38%, with 22% black VAP).  It consists of downtown Orlando, black areas in western Orange County, Hispanic portions of east-central and southern Orange County, and the adjoining heavily Hispanic portions of Osceola county (Kissimmee and environs).  Should be a perfect district for State Reps. Darren Soto or Scott Randolph, both Orlando Democrats, if they want promotion to the Congress.  Orlando Mayor Buddy Dyer is another solid candidate for this seat.  Finally, polarizing but wealthy former Rep. Alan Grayson may also want to run here if he wants to return to Congress.  A Puerto Rican Republican, however, can make this race competitive.  Lean Democratic.

My partisan count for these seats are 5R, 2D, 2 swing.

Overall partisan count so far are 10R, 3D, 2 swing.

Southwest Florida, Heartland and Heartlands seats (FL-13, 14, 16 and 26) up next.

31, Male, Independent, MS-02 (Hometown FL-19)

Maryland 8-0 Map

Photobucket

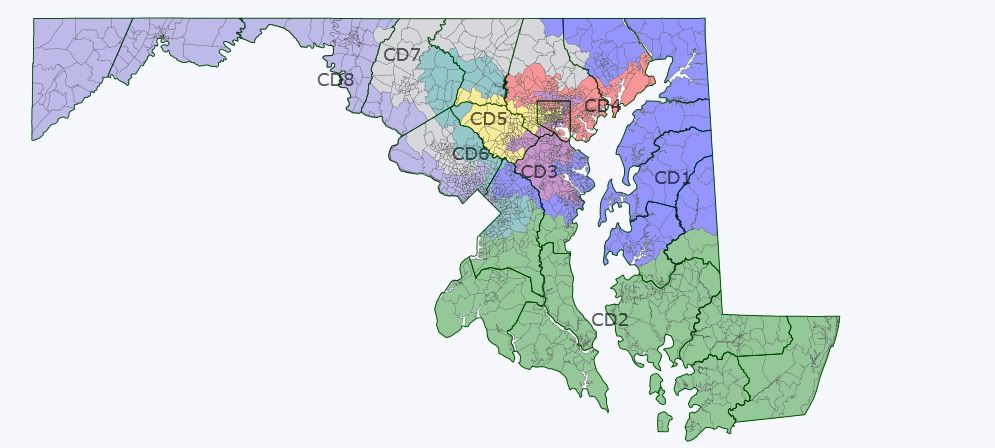
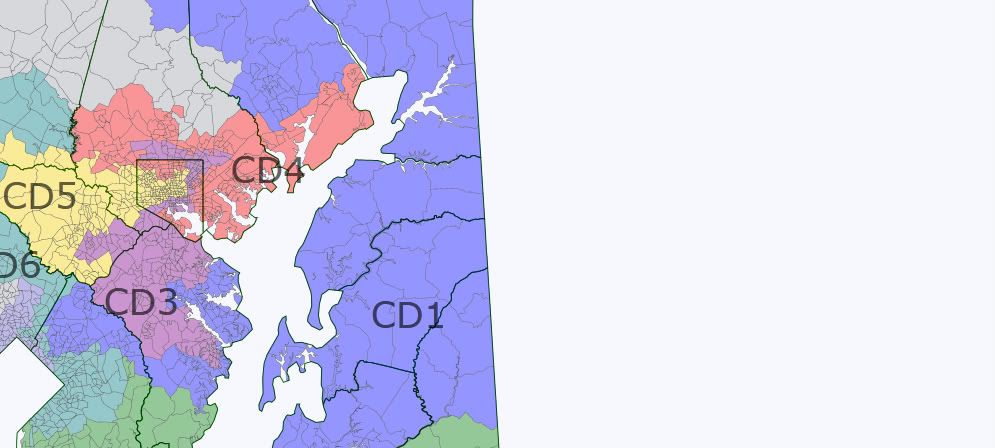
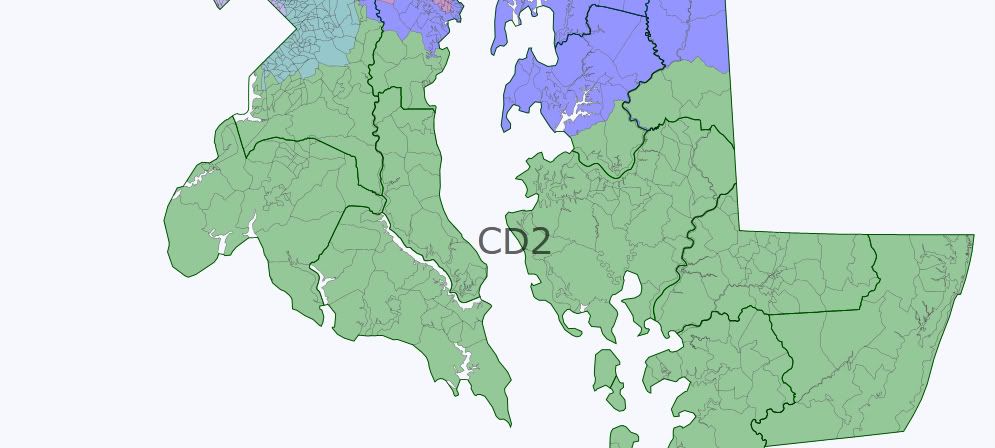
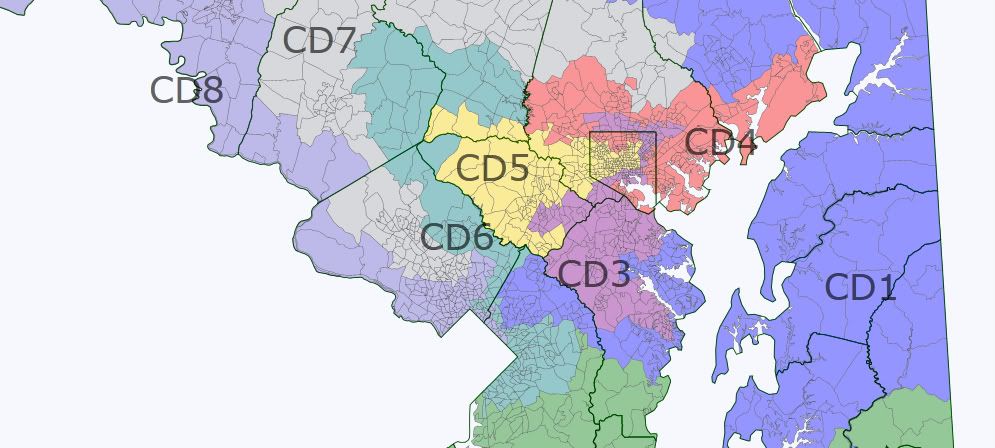
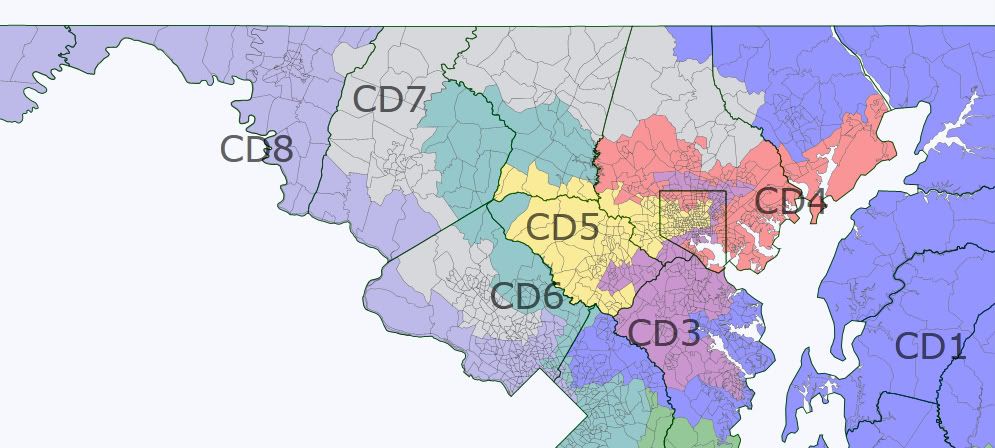
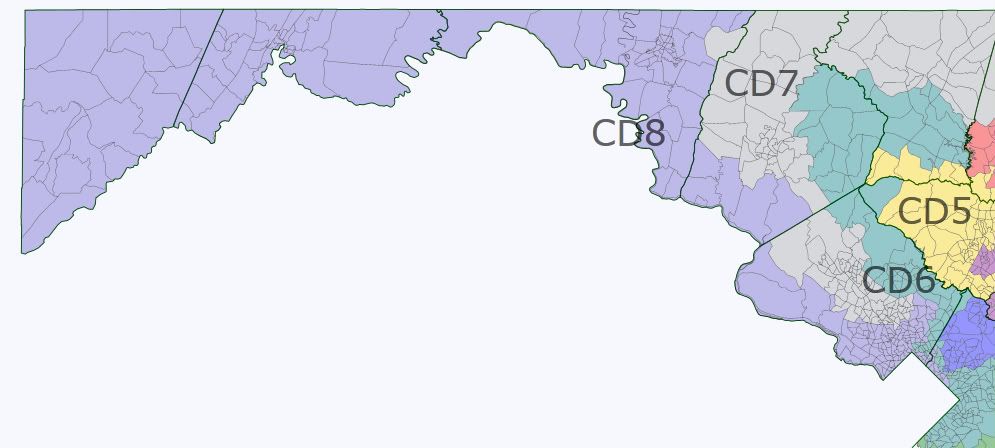
Welcome to my first diary, I altered the numbering of the congressional district to be geographically oriented. The goal of this diary is to produce an 8-0 Maryland delegation. After playing with the map for a few weeks, I produced 7 districts that are Democratic and another district for former Congressman Frank Kratovil. The easiest way to make the district 8-0 is to split the Eastern Shore. Originally I had a 6-0-2 map in which the 1st District was slightly McCain and the 6th District was slightly Obama, after editing, they both became more Democratic. I have have also tried to clean-up the look of the current 2nd&3rd Districts.

1st District: open (blue)

Democrat: frm. Rep. Frank Kratovil?

Advantage: Tossup, Likely D w/Kratovil

2008 results: Obama 50.1% McCain 48.0% Other 1.9%

Race: 73.6% W,15.8% AA,5.6% H,3.5% A,1.5% O

Photobucket

2nd District (current 5th): Minority Whip Steny Hoyer (green)

Democrat: Steny Hoyer

Advantage: Safe Dem

2008 results: Obama 59.8% McCain 39.1% Other 1.1%

Race: 60.6% W,32.0% AA,3.2% H,2.2% A,2.0% O

Photobucket

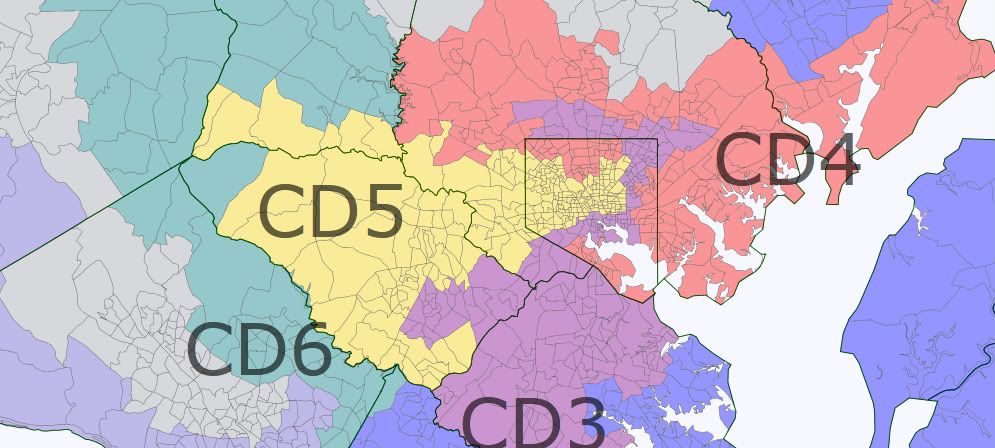
3rd District : Rep. John Sarbanes (purple)

Democrat: John Sarbanes

Advantage: Safe Dem

2008 results: Obama 58.2% McCain 39.8% Other 2.0%

Race: 67.5% W,21.2% AA,4.9% H,4.2% A,2.1% O

Photobucket

4th District (current 2nd): Rep. Dutch Ruppersberger (D), Rep. Andy Harris (R)? (red)

Democrat: Dutch Ruppersberger

Advantage: Safe Dem

2008 results: Obama 58.9% McCain 39.1% Other 2.0%

Race: 65.0% W,26.4% AA,3.3% H,3.4% A,1.8% O

Photobucket

5th District (current 7th): Rep. Elijah Cummings (yellow) VRA

Democrat: Elijah Cummings

Advantage: Safe Dem

2008 results: Obama 77.0% McCain 21.7% Other 1.3%

Race: 33.9% W,56.2% AA,2.7% H,5.3% A,1.7% O

Photobucket

6th District (current 4th): Rep. Donna Edwards* (teal) VRA

*lives outside current 4th and new 6th

Democrat: Donna Edwards

Advantage: Safe Dem

2008 results: Obama 77.9% McCain 21.1% Other 1.0%

Race: 30.7% W,53.0% AA,10.2% H,4.6% A,1.5% O

Photobucket

7th District (current 6th) : Rep. Roscoe Bartlett (R)(gray)

Democrat: Jen Dougherty? thoughts?

Advantage: Likely Dem

2008 results: Obama 55.2% McCain 42.9% Other 1.9%

Race: 64.6% W,11.6% AA,11.3% H,10.6% A,1.8% O

Photobucket

8th District: Rep. Chris Van Hollen (light purple)

Democrat: Chris Van Hollen

Advantage: Safe Dem

2008 results: Obama 61.6% McCain 36.8% Other 1.6%

Race: 65.8% W,13.8% AA,12.2% H,6.5% A,1.7% O

Photobucket

Thoughts on winners and losers in this map?

Errors?

Who would run in the new 7th?

Who would be unhappy with this map?

Other evidence that Illinois is very swingy: caution needed before we overreach with a 14-4 map

I am as partisan a Democrat as most people on this website.  As an Illinoisan, I am dismayed that my state elected five freshmen Republicans last fall but very grateful (for a whole lot of other reasons besides redistricting) that Governor Quinn just managed to hold on.  Otherwise we would be looking at another “incumbent protection” map, which in a state that just elected five freshmen GOP congressmen last fall, would be tantamount to a GOP gerrymander.

Various would-be mappers such as Silverspring have proposed 14-4 maps that would make Delay and Phil Burton proud.  But many of these maps go by Obama 2008 data, which is a fundamentally flawed data set to be basing districts on in my very educated opinion.  On the surface maps provided by such places as usaelection.org, you can see counties like Kendall and Grundy and Stephenson and McHenry (just to name a few) that wound up in Obama’s column in 2008.  No seasoned Democratic politician in Illinois would ever call these counties that are Democratic by any means.  Perhaps as suburban/exurban areas of McHenry and Kendall start to fill up and become more swingy, those counties might change.

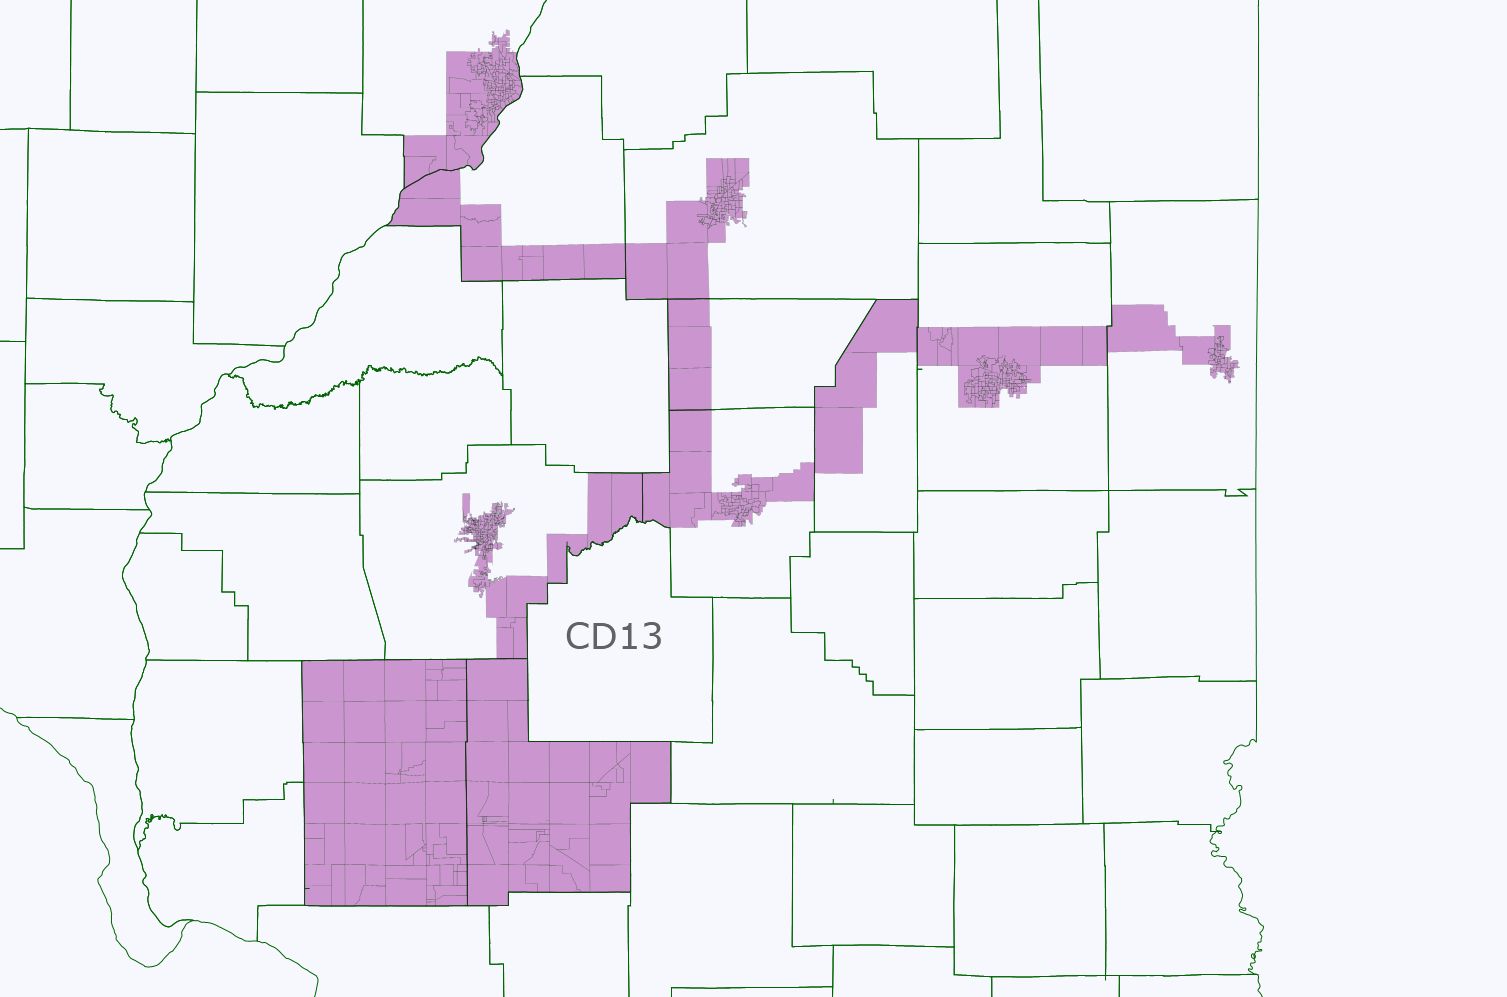
This diary, however, focuses on a slightly different problem with the Obama 2008 data when compared against Kerry 2004 downstate (where it models pretty accurately – I understand the concerns people have about Cook and Dupage which may be a bit bluer now in 2011 but that trend is not noticeable anywhere outside of Chicagoland).  The problem is this: several of the downstate cities that mappers such as myself and Silver Spring and others count on to create as many Democratic-leaning districts as we can, aren’t really all that blue to begin with.  In other cases, such as Decatur and Urbana-Champaign, they are quite blue, but turnout is a problem.  Follow me across the jump where I demonstrate this using a new district I have been creating in most of my maps – a new 13th which disappears in Chicagoland and reappears as a vacant downstate cities seat.

Photobucket

On first glance this district ought to be safely Democratic, even in 2004.  It isn’t entirely so.  Believe it or not, but Bush got 49% of the vote in this district (and the narrow tendrils connecting the various cities together only amount to about 30k residents so that isn’t the problem so much).  The district is good enough for my standards, though, because Obama did get 59%.  By Cook PVI it is a D+4, perhaps not completely safe from a meltdown of 2010 proportions but most Republicans cannot win in districts any more Democratic than this, and other than Tim Johnson, there is no sitting Republican congressman from this area of the state who could have cross-over appeal.  Even then, Tim Johnson is not a Mark Kirk, and it would take a Mark Kirk for the GOP to win this seat.  So I think it is reasonably safe Team Blue, probably as safe as can be drawn in fact.

In most other parts of the country, a 51% Kerry, 59% Obama seat would be considered safely Democratic.  But again, pay attention to that swing.  At 8% it is a bit larger than nationwide if not as extreme as the 10-12% swings found everywhere in Chicagoland.  When one looks at the cities, you see what I am discussing (with the order of the numbers being Dem-Rep):

Peoria: 28,542-18,536 in 2008; 24,795-22,398 in 2004

Danville: about 8,000 – about 4,500 in 2008; about 7,500-about 5,000 in 2004 (Does anybody know where I can find Danville or Vermillion precinct numbers; their elections website is among the most unhelpful I have ever experienced?)  I calculated this by assuming, for the sake of argument, that the out-city areas of Vermillion were equally as red as the out-city areas of Champaign County next door but I could be slightly off in either direction.

Champaign-Urbana: 32,618-13,408 in 2008; 28,814-17,222 in 2004

Bloomington: 17,578-15,167 in 2008; 13,628-17,154 in 2004

Normal: 12,257-9,197 in 2008; 9,555-10,570 in 2004

Springfield: 32,463-24,019 in 2008; 24,650-28,971 in 2004

I am progressing slower than normal with my maps because it has occurred to me that there are really three scenarios that have to be taken into consideration.  Scenario A: a tactically conservative but aggressive in every other sense map that would lock down 13 Kerry districts (Rockford going together with Rock Island; the 14th going into downtown Joliet, etc.).  Scenario B: a more risky 12-4-2 map that would put Joliet in a swing seat as well as Melissa Bean in another one in the north part of Chicagoland.  Scenario C finally would aim for a 12-5-1 which would shore up Melissa Bean while pushing a Kane seat into Rockford, which would then make the downstate cities seat very swingish (voted for Bush 53-47 then flipped to Obama 55-45).

Personally I would opt for Scenario A if I were drawing the map and not try to do a 14-4.  Unfortunately with Citizens United, the money game is even more unstacked in our disfavor.  Our ticket should get a bump with Obama on the top of the ticket, but then what about the remaining four elections in the decade-long period that any map would be operative?  Finally, another reason to be aggressive when possible but tactically conservative, drawing maps more according to Kerry or 2010 congressional data rather than Obama: Illinois is notorious for split-ticket voters.  In the weeds work I have been doing up in Chicago suburbia, I cannot tell you how often a precinct that voted 60-40 for Obama voted also in the same election for Biggert or Roskam.  And that was in 2008!  Chicago suburbia is full of independents and moderates.  

That being said, it is possible to draw 13 Kerry seats to only 5 Bush seats, and if 13-5 were achieved in 2012, that would still mean -6 GOP, +5 Dem.  That is nothing to snuff at.

2 Majority AfAm VAP Districts in SC

It’s not at all difficult to add a second (relatively) compact African American VRA district in South Carolina. The map below has two districts (SC-06 and SC-07) with an outright majority Non-White Hispanic Single-Race African American VAP:

As a consequence of adding a second African American VRA district, all 5 incumbent Republicans are made very safe. The main beneficiaries of this are Joe Wilson and Mick Mulvaney – the African American %s in their districts decline considerably. Jim Clyburn would probably run in the 6th District, since he lives in Columbia, and the 7th District would almost certainly elect another African American Democrat.

The two African American VRA districts meet a very high legal population % threshold – it is by no means settled that a majority African American VAP is actually legally required, but this map meets even that standard. White Non-Hispanics are only 43% of the total population in each district.

The two African American VRA districts could be made more compact if any or all of the following are true:

1) Hispanic African Americans are allowed to count towards the African American %.

2) Multi-Racial people who are part African American are allowed to count towards the African American %.

3) African Americans only have to be a majority of the total population, rather than the VAP.

4) African Americans only have to be a plurality of the district.

5) All minority groups combined count towards VRA status, and all that is necessary is that the White Non-Hispanic population

I will be surprised if the DOJ or a group like the NAACP does not sue to force a second such district to be created under Section 5 of the Voting Rights Act/the Gingles test.

WI Recall: Dem Jennifer Shilling Announces Candidacy Against Kapanke

Great news:

State Rep. Jennifer Shilling (D-La Crosse) announced her candidacy Saturday to run in a potential recall election against incumbent state Sen. Dan Kapanke (R-La Crosse).

Volunteers collected 22,561 signatures in a bid to force the recall in the wake of Gov. Scott Walker’s collective bargaining bill. Kapanke supported the measure.

For the election to be triggered, 15,588 signatures must be verified.

Shilling is about as strong a candidate as we could hope for – and it’s a great opportunity for her, since she gets to take a free shot at Kapanke while keeping her seat. Hopefully this means we’ll have other similarly strong recruits from the state House in our other recall efforts. Also, this is a pretty big vote of confidence by Shilling in the quality of the signatures, which I’m guessing will stand up to scrutiny. Game on!

P.S. Click here for Jennifer Shilling‘s Assembly campaign site, which I’m guessing will get updated soon.

My first stab at Congressional Resdistricting in Florida (Part 1: Panhandle and North Florida)

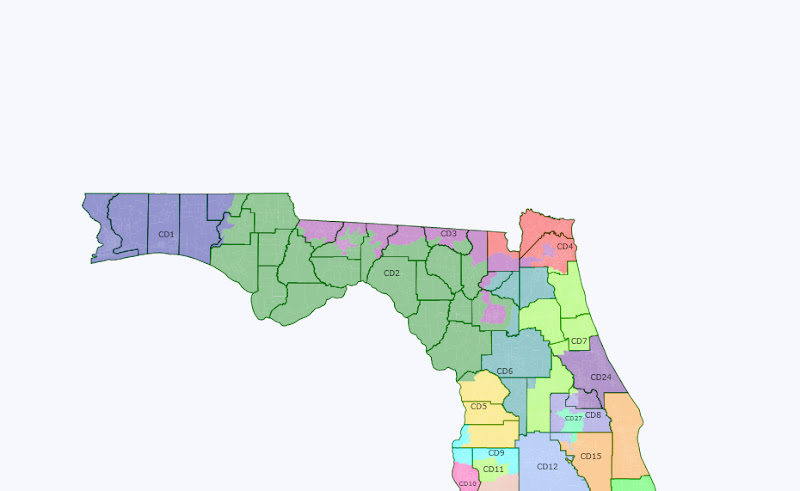
As a former Florida resident, I try to create a 27-district plan for Florida using Daves Redistricting App 2.0 with the 2010 population data.  I try to allow most major counties to have at least 1 district that’s totally within them.  If circumstances do not allow this, I will then keep counties whole as much as possible out of my good government instincts and to match the spirits of Florida’s Amendment 6 on congressional redistricting.  The only major exception is in my FL-3, designed to allow the Dems to keep a foothold in North Florida, and in the areas where my new districts are located (more of that covered under my districts).  Each of the district will also have a deviation from the ideal population per district of 696,341 by less than 1000 people, and the results can be seen as the following:

Overview- Northern half

Overview- Southern half

Panhandle

North Florida

Jacksonville Area

FL-1 (Rep. Jeff Miller, R- Chumuckla), Blue

This district now consists all four of the Panhandle’s westernmost counties (Escambia, Santa Rosa, Okaloosa and Walton), but retreats from most of Washington County and about one-third of Holes County.  Safe Republican.

FL-2 (Rep. Steve Southerland, R-Panama City), Green

Now dips into Holmes and Washington County.  It also takes Levy County from FL-5 and FL-6 and gain most of rural Alachua County from FL-6.  On the other hand, it is largely removed from Gadsden County and the city of Tallahassee.  Likely Republican.

FL-3 (Rep. Corrine Brown, D-Jacksonville), Purple

This is the new North Florida Democratic vote sink, and one of the few really ugly gerrymander here.  It spans from Gadsden County through Tallahassee; with one arm extending to the black areas of Jacksonville and the other extending into the city of Gainesville.  These areas are the only Democratic bastions in otherwise heavily GOP North Florida, and I feel that compact districts containing Gainesville, Tallahassee and black areas of Jacksonville would be fairly to heavily Republican.  On the other hand, this incarnation allows the Democratic votes in the Orlando area to be freed up.  They will be in my FL-27.  Rep. Brown should still be fine in this 43% black district, although she may face primary challenge from Gainesville or Tallahassee candidates like former State Sen. Al Lawson, who had unsuccessfully primaried then-Rep. Allen Boyd last year.  Likely Democratic.

FL-4 (Rep. Ander Crenshaw, R-Jacksonville), Red

This district is now more focused at the Jacksonville area.  It takes most of Duval County that’s not in FL-3 (minus a small southern sliver in FL-7), all of Nassau County and Northern half of Baker County.  The rural areas formerly attached to it are divided among FL-2, 3 and 6.  Safe Republican.

FL-6 (Rep. Cliff Stearns, R-Ocala), Teal


It unites Marion County (Stearn’s political base) with portions from the old FL-8, and also unites the very conservative Jacksonville suburb of Clay County with bits from the old FL-3.  These hubs are connected with a sliver of rural Alachua County.  It then extends South to take all of Sumter County and the Lady Lake (The Villages) portion of Lake County.  The real competition would be between a Clay County and a Marion County/The Villages Republican.  Safe Republican.

FL-7 (Rep. John Mica, R-Winter Park), Apple Green

While Rep. Mica’s home of Winter Park is drawn out of this district, it retains significant portions of his current constituency at St. Johns and Flagler counties.  It now includes all of Putnam and most of Lake (minus the Lady Lake area) counties, with small slivers in Duval, Volusia and Seminole counties (with no significant population centers in the latter two) just for population purposes.  Should be fine for Mica as long as he is willing to move.  In an open-seat scenario, expect a vigorous GOP primary between a St. Augustine and a Lake County candidate.  Safe Republican.

My partisan count for the seats so far are 5R, 1D.

Central Florida districts (FL-5, 8-12, 15, 24 and 27) up next.

31, Male, Independent, MS-02 (Hometown FL-19)

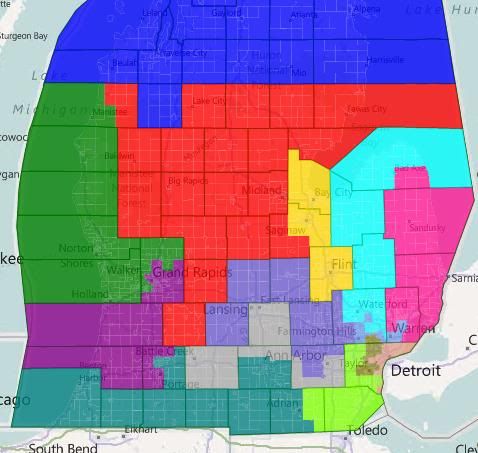
The Knollenberg Project: Michigan Congressional Redistricting

Conventional wisdom regarding Michigan’s congressional redistricting process to this point has looked towards the state Republicans dealing with Michigan’s lost seat by consolidating Sander Levin and Gary Peters into a single district. Two relatively new sources of information are challenging that wisdom.

First, the actual census numbers came out. And the beating that Detroit took over the last ten years was a lot worse than generally thought. As best as I can tell, it’s no longer possible to draw two majority-black congressional districts in Wayne County. Instead, whichever district is centered on western Detroit is going to have to crossover into southern Oakland County to pick up, at the very least, the city of Southfield. Which suggests the option of having that district scoop up as many white Oakland County Democrats as it can, since it’s in the neighborhood anyway. Which in turn suggests that the relevant pairing is going to be Levin-Conyers, not Levin-Peters.

Second, per a recent digest, state representative Marty Knollenbeg, a member of the redistricting committee and son of Peter’s predecessor, has moved from talking about challenging Peters in 2012 to actually starting the machinery of his campaign, in the form of an exploratory committee. That suggest that Knollenberg thinks Peters (or at least the bulk of Peters’ district) is going to be in such a form that it would be amenable to electing a Republican. Which again cuts against the Levin-Peters pairing.

So: If there’s a district for Knollenberg, some other district is still geting cut. Maintaining two VRA black districts requires one of the Detroit districts to cut into Levin’s Twelfth. Putting that together, perhaps the Twelfth is the district to go? What would that look like?

I explore three possible solutions after the jump.

Common Threads

All three of my solutions have six districts that are identical: MI-01, MI-05, MI-09, MI-10, MI-13, and MI-14. The new MI-12, which is now the designation for Dingell’s district, stays more or less in place for all three maps also. Here’s the process by which those six districts were built.
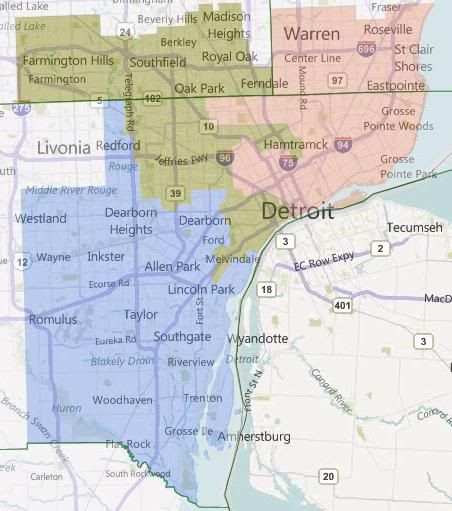
First, the inner Metro Detroit districts. Basically, all three of these maps are looking at scenarios where MI-14, based in western Detroit, takes in the western (Oakland County) portion of the dismantled MI-12, while MI-13, based in eastern Detroit, takes in the eastern (Macomb County) portion of the dismantled MI-12.

The particular version stretches MI-13 to its breaking point — it’s almost literally 50%+1 black by VAP. (It’s 50%+218.) It takes in heavily Democratic Warren, Eastpointe, and Roseville, along with not quite so Democratic St. Clair Shores. (I’m realizing now that I should look at scenarios where St. Clair Shores is in MI-10.) It’s forced into taking the Grosse Points and Harper Woods, and after that it can’t take any more non-black population. That’s why MI-14 has the odd arms to take in white Hamtramck and hispanic southern Detroit.

Besides those arms, MI-14 takes in the rest of Detroit, and then moves north in Oakland County, taking in Southfield for its black population, and the spreading east and west to take in the most Democratic parts of southeastern Oakland. It can’t quite do this cleanly, the little city of Clawson ends up split between it and the undrawn MI-09.

MI-12, having been dismantled, is then reborn as the designation for Dingell’s district. It takes in the most Democratic of the Wayne County suburbs, leaving the western tier of townships for McCotter (or at least he hopes so). Note that dismantling and relocating MI-12 in this way prevents Dingell from hanging on to Ann Arbor, which is going to be problematic for the Republicans later.
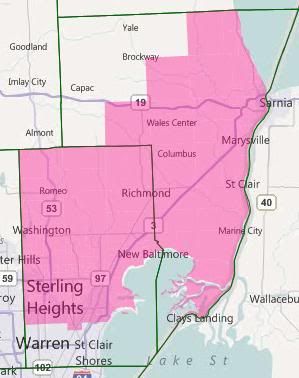
Then MI-10. It takes up the rest of Macomb, and then fills its balance by taking in as much of St. Clair County as it can. There’s been significant population growth in St. Clair and northern Macomb. This, combined with the fact that MI-13 isn’t taking in all of the old MI-12’s portion of Macomb County, causes Candice Miller to lose most of her Thumb Counties.

Obama won Macomb County by about a 36k margin. Warren by itself accounts for about 13k of that margin. The rest of MI-13’s part of Macomb County is about another 15k. That means that the rest of the county went for Obama by about an 8k margin, out of about 285k total votes (for the rest of the county.) Obama won the part of St. Clair County that’s in this district by about 3k out of 72k. That adds up to Obama winning this district by 11k out of 285k total votes. That’s not going to be as comfortable as for Candice Miller as her current R+5 district, but it should be manageable.
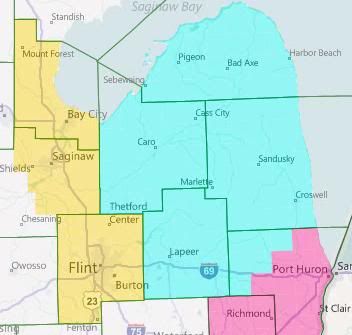
And now the Thumb. The Thumb Counties proper are fairly Republican, so I’m assigning them to our rebuilt MI-09 (which will also be taking in a good part of Oakland, as you’ll see later). That implies the assigned shape for MI-05: Gennessee and Bay Counties plus the most Democratic parts of Saginaw County that will fit.
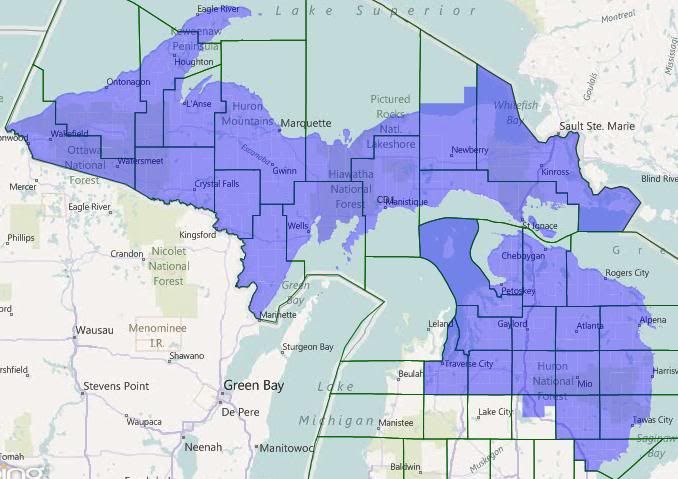
Which in turn implies this shape for MI-01. Having been kicked out of Bay County by MI-05, it needs to pick up population somewhere, and adding Republican Grand Traverse County to it will help anchor it for Benishek. One goal going forward is to keep that move from harming Dave Camp too much.

Okay, so with those 5-6 district set in place, what sort of options do we have for the others?

Interlude

The current Republican map of Michigan has some very finely wrought pieces. In particular, they went out of their way to make sure that most of Michigan’s Democratic-leaning cities in the outstate ended up in separate districts where they could be drowned out by rural and exurban voters. The cases in point: Muskegon in MI-02, Grand Rapids in MI-03, Kalamazoo in MI-06, Lansing in MI-08. MI-07 was such a case when it was created, keeping Battle Creek safely away from more Democrats (Jackson, so far as I can tell, is swing-tilt-Republican); but Lansing’s western suburbs in Eaton County have blued significantly over the last decade. They then decided that Flint-Saginaw-Bay City was too dangerous to crack, and also packed in Ann Arbor with the southern Detroit suburbs.

This analysis is important because, while we’ve maintained the packed district for Flint, we weren’t able to maintain the Ann Arbor to Dearborn packing. And none of the outstate districts can afford to take on Ann Arbor in addition to the existing Democratic city that they’re warding. The upshot of this is that if Knollenberg is successful at getting a seat made for himself, and if I’m right that Levin’s is then the disappeared seat, then Knollenberg is going to be creating a seat for himself at some other Republican’s expense.

Said another way, the current breakdown of the delegation is nine Republicans and six Democrats. One seat needs to go away; the Republicans obviously want it to be a Democratic one. In addition, Knollenberg is trying to flip a Democratic seat into a Republican one. That would make the delegation 10-4. I submit that it’s impossible to make a map of Michigan with only four districts that are Democratic. 9-5 is the GOP max. Since there are 9 Republicans already, adding another one to the delegation necessarily involves booting an incumbent.

In all three of my sample maps below, that person is Tim Walberg. This is because he is (1) a freshman who is (2) out of step with his swing district which can (3) be made into another MI-05-esque medium-sized-city Dem vote sink. The three options are named for the cities that the new MI-07 covers.

Option 1 — Ann Arbor, Battle Creek, Delta Township

Option 1 has MI-07 cover central Michigan from Ann Arbor to Battle Creek, with an arm reaching out to take in the western suburbs of Lansing.
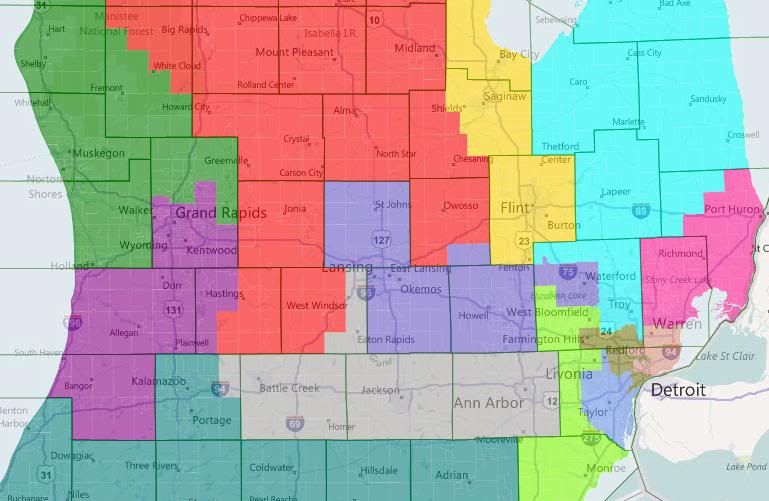
In the west, MI-02 subsumes deep blue Muskegon and the swingy coastal counties with deep red Ottawa and north Kent. (Although not picture, MI-02 takes in all of the coastal counties up to Leelanau. MI-04 has the interior counties that aren’t in MI-01.) MI-03 takes a third of a turn clockwise, dropping Ionia and most of Barry to grab Allegan and Van Buren. Camp’s MI-04 replaces its loss of Republican Grand Traverse with very Republican Ionia and Barry.

Upton’s MI-06 now stretches across southern Michigan, where he picks up an unwelcome constituent in Tim Walberg. Rogers in MI-08 is left to hold down more-or-less the same district that he has now.

Finally, there are the two metro Detroit districts. Knollenberg here adds the northwestern third or so of Oakland County to the Thumb Counties to make the new MI-09, resulting in a reasonably Republican district, even if he’s still holding onto Pontiac. McCotter actually gets shored up here, I think. He picks up Democratic West Bloomfield but loses the most Democratic parts of his current district, which I think balances out in his favor. He also gains Monroe County, which I’m under the impression is swing or lean-Republican these days.

Overall, I think this is the best of the three options for the Republicans. One problem is that having two Oakland-Wayne districts probably violates Michigan’s redistricting standards. That’s more of a political problem than a legal one, though.

Option 2 – Ann Arbor, Battle Creek, Lansing

Option 2 has MI-07 cover central Michigan from Lansing to Jackson, with obviously-gerrymandered-yet-Michigan-standards-compliant arms to pick up Battle Creek and Ann Arbor-Ypsilanti.
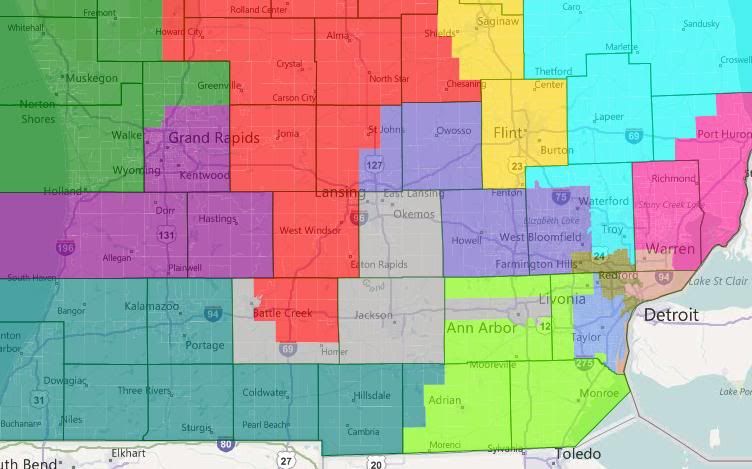
Off-screen, MI-02 has picked up Wexford, Lake, and most of Newaygo Counties from MI-04, which is has in turn picked up the rest of Eaton and a big chunk of Calhoun. This is bad for Dave Camp. In other news worth mentioning, Walberg is now McCotter’s problem — although the massive amounts of Washtenaw he also picks up are an even larger problem. If I recall some math I did the other day, if you exclude Ann Arbor, the rest of Washtenaw voted 2-1 for Obama. Excluding Ypsilanti also helps, but not that much.

Overall, this map is better for Upton, Amash, and Rogers; and worse for Camp and McCotter.

Option 3 – Battle Creek, Kalamazoo, Lansing

Option 3 has MI-07 cover central Michigan from Lansing to Kalamazoo without dealing with the Ann Arbor problem.
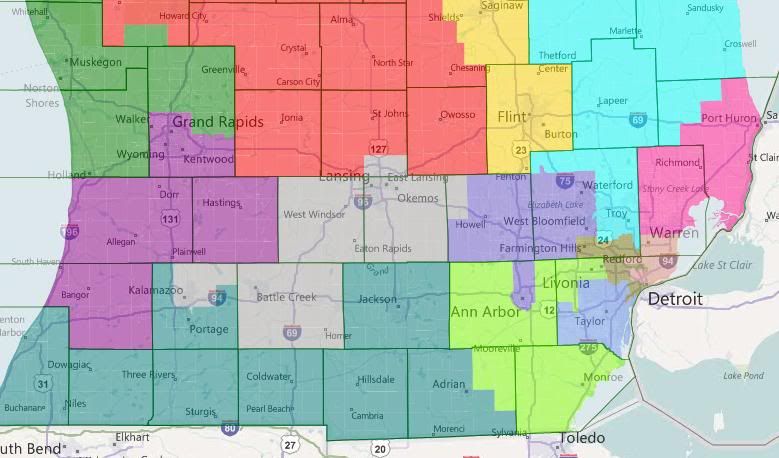
Offscreen, we’re back to the arrangment of the first map — coastal = MI-02, interior = MI-04. Walberg is back to being Upton’s problem — but he’s also lost Kalamazoo, so that’s a legitimately Republican district now. Amash and Camp should both be happy. (Amash’s district in this arrangment, incidentally, is at zero-deviation from ideal.) Rogers should be okay — taking in Ann Arbor for Lansing-East Lansing should balance out. But McCotter’s still in trouble — again, even without Ann Arbor, Washtenaw is a 2-1 Obama jurisdiction.

Bonus Option

As I was writing the diary, I had the inspiration for a pro-Knollenberg, anti-Walberg map that cut out Dingell instead of Levin. MI-13 is 52.2% black VAP, MI-14 is 53.4% black VAP. Here it is without further commentary, because I need to get myself to bed.
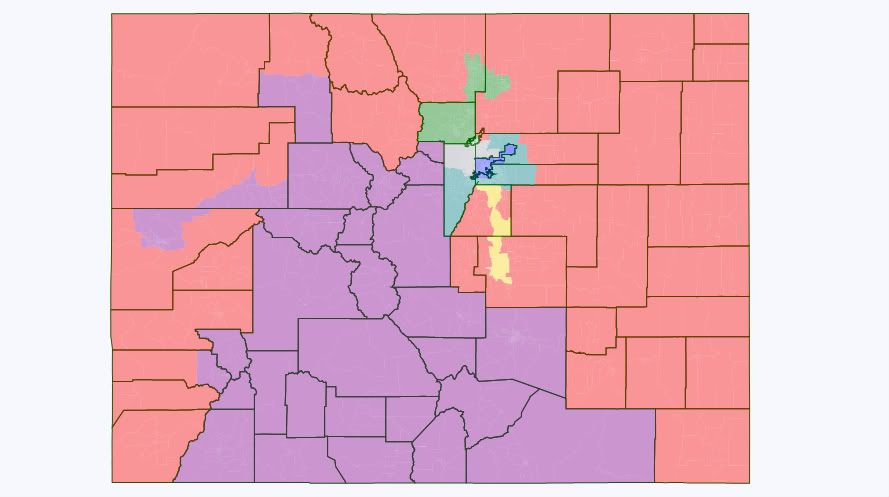
Democratic Gerrymander of Colorado

I had several goals here:

1. Knock out either Gardner or Tipton

2. Keep a district that Perlmutter can continue to hold relatively easily.

3. Make Coffman have to actually campaign, at the very least.

4. Create a district that Salazar or another moderate Dem can win and continue to hold.

Photobucket

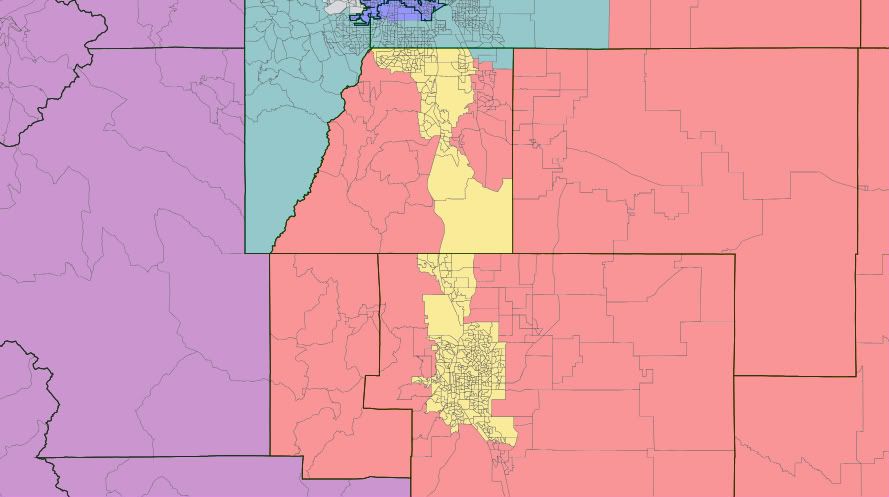
District 3 (Purple): This is currently represented by Scott Tipton, but he lives in the new 4th, and would probably much rather try to primary Gardner than hold this marginal seat. The seat is now Pueblo-based and adds all the liberal ski towns from the 2nd district.  It does add conservative Park and Fremont counties from the 5th, but its loss of all the heavily GOP counties on the Western Slope more than offsets that.  It has a little arm reaching back to nab Grand Junction in order to meet population equality.  My best guess is this goes from its current R+5 rating to around R+1 or R+2. Salazar probably would have won re-election if he had this in 2010 and could easily win in any other year.  Other possible candidates include State House Minority Leader Sal Pace of Pueblo.

Likely D if Salazar runs; tossup otherwise

District 4 (Red): This GOP vote sink manages to combine both Cory Gardner, who lives in Yuma in northeast Colorado, and Scott Tipton, who lives in Cortez in southwest Colorado.  It contains all of the heavily GOP counties on both the Eastern Plains and Western Slope.  In addition, it loses both Fort Collins and Greeley, resulting in perhaps the most Republican district in the state.  It could be anywhere from R+15 to R+20.

Safe R

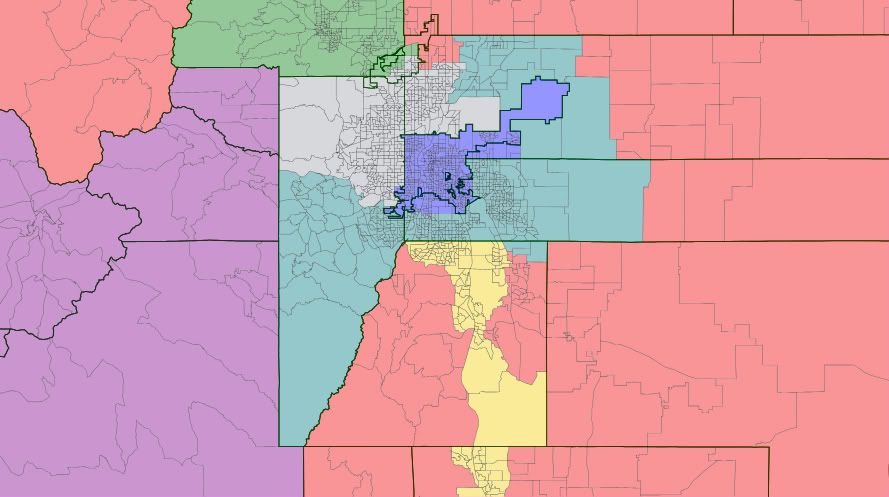
Metro Denver:

Photobucket

District 1 (blue): This is Diana DeGette’s Denver-based district.  Other than adding a few Arapahoe County precincts for population equality, not much of a change here. It’s currently D+21

Safe D

District 6 (teal): This is Mike Coffman’s suburban district, currently R+8.  However, it sheds extremely wealthy and conservative Douglas Country, as well as rural Elbert County, and the rural eastern part of Arapahoe County.  It adds a bunch of suburban areas in slightly D-leaning Jefferson and Adams Counties.  Although Coffman could probably still be able hold it, this would become a toss-up if he vacates the seat.  This is probably between R+3 and even PVI.

Lean R for Coffman, Tossup if open

District 7 (gray): This is the other suburban Denver district, currently held by Ed Perlmutter.  It basically just trades parts of Adams County for Jefferson County, which is pretty much a wash, and is probably still around the current D+4, but after dismantling Fraiser by 11% in 2010, he’s definitely safe.

Likely D for Perlmutter, Lean D if open

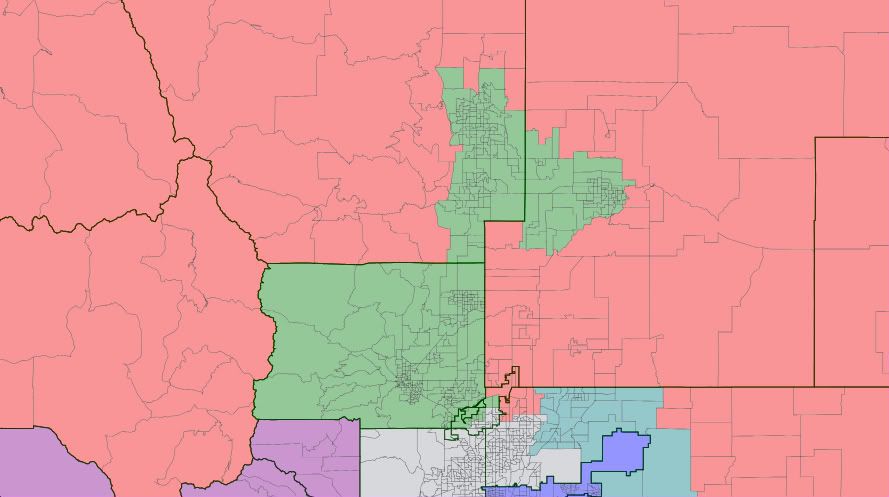
Northern Colorado:

Photobucket

District 2 (green): Jared Polis’ Boulder-based district sheds the ski towns, but adds liberal Fort Collins and Greeley to remain safe.  Probably unchanged much from the current D+11.

Safe D

Colorado Springs:

Photobucket

District 5 (yellow): This incredible GOP vote sink, held by Doug Lamborn, takes in Colorado Springs and a bunch of extremely wealthy parts of Douglas County: Castle Pines, Castle Rock, Lone Tree, etc.  It sheds liberal Lake County and swingy Chaffee County to the 3rd, as well as conservative, prison-filled Park and Fremont Counties.  It is probably even more Republican than its current R+14, and could be approaching R+20.

Safe R

So, here’s a recap:

District 1: Diana DeGette, Safe D

District 2: Jared Polis, Safe D

District 3: likely D for John Salazar, tossup otherwise

District 4: Cory Gardner/Scott Tipton, Safe R

District 5: Doug Lamborn, Safe R

District 6: Mike Coffman, Lean R for Coffman, tossup otherwise

District 7: Ed Perlmutter, Likely D for Perlmutter, lean D otherwise

Weekly Open Thread: Delurkers Thread

I’d like to use this thread to give folks who read the Swing State Project but haven’t yet opened an account a chance to “de-lurk” and say hi in comments. Creating a new account is free & easy – just click here – and you can start commenting right away. We’re a very friendly and welcoming bunch here, so whether you’ve been reading SSP for three weeks or three years, if you’ve been lurking this whole time, why not stop in and say hello? We look forward to meeting you!

UPDATE: Welcome to all the new users! And I can even offer an inducement to sign up that I hadn’t thought about before, but which brand-new user TMBJon just pointed out. When you sign up for an account and are logged in, the system will keep track of which comments you’ve alread read, and which comments are new, flagging the new ones with a very visible red “*[new]” flag. That makes it much easier to follow conversations, even if you aren’t participating yourself.

UPDATE 2: What a great thread! Welcome again to everyone! So far we’ve had over 30 new signups since this thread went up, as well as several de-lurks from folks we haven’t heard from in a long time. How awesome! I’m eager to give a personal welcome to each of you, but the thread’s grown quite enormous, so forgive me if I inadvertently skip your maiden comment. The First Lady and I are headed out to dinner, but I’ll be back later to chat some more.

UPDATE 3: If you want to edit your sig line or just provide general personal information, here’s how you do it: First, click on your username, or on the “[Username]’s Page” link in the menu on the right-hand sidebar. Then, click on the “Profile” tab. There, you can edit to your heart’s content. You can even put your email address in there, which is a great way to let other people contact you offline. (Note that you can use limited HTML in the sig line, but not in the other boxes.)