Racial Composition Change by CD

With the Census Bureau having released 2010 data for all 435 congressional districts, I started slicing ‘n’ dicing the data last week, looking at population change in the fastest growing and shrinking districts. Today, as promised, we’re moving on to how the racial composition of the congressional districts has changed.

You might remember that I did this same project a year and a half ago based on 2008 estimated data, and that was a good template for today’s work, as the lists haven’t changed that much. Where the lists have changed, it seems to be more likely because of strange sample issues in 2008 (like the rapid appearance and subsequent disappearance of a big Asian population in NY-06) than rapid changes in the trend over the last two years. As with last time, the most remarkable chart is the one showing biggest declines, percentage-wise in districts’ non-Hispanic white populations. (Because this is the key chart, I’m extending this list to 25 places.) As you’ll no doubt notice, many of these districts also had some of the biggest moves in the Democratic direction over the years from 2000 to 2008.

District Rep. 2000
white
2000
total
2000
%
2010
white
2010
total
2010
%
%
change
2000
election
2008
election
GA-07 Woodall (R) 476,346 630,511 75.5 486,673 903,191 53.9 – 21.7 31/69 39/60
GA-13 Scott (D) 295,107 629,403 46.9 202,053 784,445 25.8 – 21.1 57/43 71/28
TX-24 Marchant (R) 415,842 651,137 63.9 368,645 792,319 46.5 – 17.3 32/68 44/55
TX-22 Olson (R) 394,651 651,657 60.6 405,645 910,877 44.5 – 16.0 33/67 41/58
FL-19 Deutch (D) 494,890 638,503 77.5 456,060 736,419 61.9 – 15.5 73/27 65/34
CA-25 McKeon (R) 363,792 638,768 57.0 352,189 844,320 41.7 – 15.2 42/56 49/48
FL-20 Wasserman Schultz (D) 426,891 639,795 66.7 358,470 691,727 51.8 – 14.9 69/31 63/36
TX-07 Culberson (R) 439,217 651,682 67.4 411,276 780,611 52.7 – 14.7 31/69 41/58
NV-03 Heck (R) 459,756 665,345 69.1 568,343 1,043,855 54.4 – 14.7 49/48 55/43
TX-10 McCaul (R) 431,992 651,523 66.3 513,811 981,367 52.4 – 13.9 34/67 44/55
IL-03 Lipinski (D) 445,179 653,292 68.1 361,581 663,381 54.5 – 13.6 58/40 64/35
CA-11 McNerney (D) 408,785 639,625 63.9 400,825 796,753 50.3 – 13.6 45/53 54/44
VA-10 Wolf (R) 495,611 643,714 77.0 554,054 869,437 63.7 – 13.3 41/56 53/46
TX-02 Poe (R) 418,476, 651,605 64.2 399,454 782,375 51.1 – 13.2 37/63 40/60
FL-08 Webster (R) 447,266 639,026 70.0 459,529 805,608 57.0 – 13.0 46/54 53/47
CA-41 Lewis (R) 405,790 639,935 63.4 404,103 797,133 50.7 – 12.7 41/56 44/54
FL-12 Ross (R) 461,239 640,096 72.1 500,066 842,199 59.4 – 12.7 45/55 49/50
CA-10 Garamendi (D) 417,008, 638,238 65.3 377,698 714,750 52.8 – 12.5 55/41 65/33
CA-22 McCarthy (R) 426,192 638,514 66.7 432,482 797,084 54.3 – 12.5 33/64 38/60
MD-05 Hoyer (D) 400,668 662,203 60.5 368,667 767,369 48.0 – 12.4 57/41 65/33
NV-01 Berkley (D) 342,987 666,442 51.5 322,853 820,134 39.4 – 12.1 56/41 64/34
CA-13 Stark (D) 244,693 638,708 38.3 174,998 665,318 26.3 – 12.0 67/30 74/24
VA-11 Connelly (D) 430,091 643,582 66.8 434,526 792,095 54.9 – 12.0 45/52 57/42
CA-03 Lungren (R) 474,940 639,374 74.3 488,421 783,317 62.4 – 11.9 41/55 49/49
FL-15 Posey (R) 497,676 639,133 77.9 539,194 813,570 66.3 – 11.6 46/54 48/51

Districts appearing in the 2010 data’s top 25 that weren’t present in 2008 are VA-10, TX-02, FL-08, CA-41, and NV-01; while the other four are driven mostly by Latino growth, the growth in VA-10 (in Washington DC suburbs, more and more centered on once-exurban, now-suburban Loudoun County) is more Asian. These five replace TX-05, AZ-03, TX-06, TX-03, and NJ-07.

This presents a very different picture than the districts ordered according to the actual raw number of white residents lost. That list starts with GA-13 in first, which fell from 295,107 white residents in 2000 to 202,053 in 2010. This is the southern tier of Atlanta’s suburbs and exurbs, which is increasingly becoming a magnet for both Atlanta African-Americans moving outward and northern blacks moving south – in turn driving a lot of white flight, much of which seems to be rearranging itself north of Atlanta, especially in the 9th. The fast-growing 13th is unusual on this list, though; most of the remaining top 10 losers are districts where the overall population is stagnant or going down: MI-12, IL-03, PA-14, OH-10, IN-07, IL-02, CA-13, FL-20, and MO-01. As you’ll see in upcoming charts, blacks are replacing whites in MI-12, Hispanics are replacing whites in IL-03 and FL-20, Asians are replacing whites in CA-13, while in PA-14, OH-10, IN-07, IL-02, and MO-01, everyone is leaving, with whites are leaving the fastest.

Much, much more over the flip…

Here are the districts with the biggest gains among non-Hispanic whites:

District Rep. 2000
white
2000
total
2000
%
2010
white
2010
total
2010
%
%
change
2000
election
2008
election
IL-07 Davis (D) 178,144 653,521 27.3 204,780 638,105 32.1 4.8 83/16 88/12
NY-15 Rangel (D) 106,664 654,355 16.3 133,839 639,873 20.9 4.6 87/7 93/6
NY-11 Clarke (D) 140,595 654,134 21.5 161,819 632,408 25.6 4.1 83/9 91/9
NY-12 Velazquez (D) 150,673 653,346 23.1 180,232 672,358 26.8 3.7 77/15 86/13
GA-05 Lewis (D) 216,674 629,438 34.4 232,507 630,462 36.9 2.4 73/27 79/20
NY-10 Towns (D) 106,746 665,668 16.0 124,232 677,721 18.3 2.3 88/8 91/9
MI-14 Conyers (D) 213,120 662,468 32.2 187,516 550,465 34.1 1.9 81/18 86/14
CA-33 Bass (D) 126,488 638,655 19.8 137,720 637,122 21.6 1.8 83/14 87/12
CA-31 Becerra (D) 62,177 639,248 9.7 69,321 611,336 11.3 1.6 77/19 80/18
SC-06 Clyburn (D) 269,215 669,362 40.2 280,474 682,410 41.1 0.9 58/40 64/35

While you might expect the biggest white gains to be in the exurbs, that’s not the case at all (as suburbs and even exurbs are often becoming a first stopping-point for new immigrants). Instead, most of this list shows regentrification at work, especially in the parts of the outer boroughs of New York City currently under invasion by hipster armies (and also new additions CA-31 and CA-33, evidence of the very recent momentum in the revival of downtown Los Angeles). Similarly, Atlanta is becoming whiter even as its suburbs become much more African-American (which we got a preview of with last year’s mayoral race, where a white candidate nearly won). The odd district out is Detroit-based MI-14, where whites seem to be fleeing at a slower rate than everyone else. Only five additional districts had a percentage gain in white residents, for a total of 15 of all 435: LA-02, HI-02, CA-29, PA-02, and IL-04. (HI-02, NY-14, and CA-29 fall off the top 10 list from 2008, replaced by CA-33, CA-31, and SC-06.)

If you’re wondering which districts had the biggest numeric gains of white residents, rather than changes in the white percentage, here’s where the exurbs come in; the list looks a lot like the list of the biggest gainers altogether, or at least the whiter districts among the biggest gainers. AZ-06 in the Phoenix suburbs (with a large Mormon core in Mesa) had the biggest gain, from 490,359 to 673,881, followed by FL-05, AZ-02, ID-01, UT-03, GA-09, CO-06, SC-01, TX-26, and TX-31.

Now let’s turn to African-American populations:

District Rep. 2000
black
2000
total
2000
%
2010
black
2010
total
2010
%
%
change
2000
election
2008
election
GA-13 Scott (D) 255,455 629,403 40.6 439,119 784,445 56.0 15.4 57/43 71/28
GA-07 Woodall (R) 72,962 630,511 11.6 196,955 903,191 21.8 10.2 31/69 39/60
MI-12 Levin (D) 77,403 662,559 11.7 133,766 636,601 21.0 9.3 61/37 65/33
IL-02 Jackson (D) 403,522 654,078 61.7 414,414 602,758 68.8 7.1 83/17 90/10
MD-05 Hoyer (D) 198,420 662,203 30.0 281,862 767,639 36.7 6.8 57/41 65/33
FL-19 Deutch (D) 37,821 638,503 5.9 91,391 736,419 12.4 6.5 73/27 65/34
MD-02 Ruppersberger (D) 178,860 661,945 27.0 232,194 700,893 33.1 6.1 57/41 60/38
MO-01 Clay (D) 307,715 621,497 49.5 324,711 587,069 55.3 5.8 72/26 80/19
MI-11 McCotter (R) 23,456 662,505 3.5 64,239 695,888 9.2 5.7 47/51 54/45
GA-03 Westmoreland (R) 119,766 630,052 19.0 198,089 817,247 24.2 5.2 33/67 35/64

The list of the top 10 districts in terms of percentage gains among African-Americans is the same 10 as 2008, although with a few changes in the order. The story continues to be African-Americans moving from the cities to the suburbs, especially in the Atlanta area but also Detroit (with Detroiters moving north into the 12th), Chicago (with the metaphorical South Side now starting to extend south well below the city limits and even below I-80), and Washington DC (with Prince George’s County now largely black outside the Beltway, into the 5th, as well as inside in MD-04).

The top 10 gainers by raw numbers has many of the same districts, although also some of the suburban districts that gained a lot of everybody (like TX-22 and NC-09). It starts with GA-13 (from 439K to 629K), followed by GA-07, MD-05, GA-03, TX-22, NC-09, MI-12, FL-19, MD-02, and TX-24.

District Rep. 2000
black
2000
total
2000
%
2010
black
2010
total
2010
%
%
change
2000
election
2008
election
IL-07 Davis (D) 402,714 653,521 61.6 322,730 638,105 50.6 – 11.0 83/16 88/12
GA-05 Lewis (D) 350,940 629,438 55.8 313,302 630,462 49.7 – 6.1 73/27 79/20
LA-02 Richmond (D) 407,138 639,048 63.7 287,077 493,352 58.2 – 5.5 76/22 74/25
CA-09 Lee (D) 164,903 639,426 25.8 131,574 648,766 20.3 – 5.5 79/13 88/10
CA-35 Waters (D) 216,467 638,851 33.9 188,365 662,413 28.4 – 5.4 82/17 84/14
CA-33 Bass (D) 189,855 638,655 29.7 156,406 637,122 24.5 – 5.2 83/14 87/12
NY-11 Clarke (D) 379,017 654,134 57.9 335,828 632,408 53.1 – 4.8 83/9 91/9
PA-02 Fattah (D) 392,293 647,350 60.6 355,849 630,277 56.5 – 4.1 87/12 90/10
NY-15 Rangel (D) 198,915 654,355 30.4 169,460 639,873 26.5 – 3.9 87/7 93/6
TX-18 Jackson-Lee (D) 260,850 651,789 40.0 260,585 720,991 36.1 – 3.9 72/28 77/22

The list of districts with the biggest percentage losses among African-Americans mostly parallels the list of districts with the biggest white gains, where regentrification is changing the complexion (and that it includes the catastrophic regentrification of New Orleans). It also includes several traditionally black districts where the blacks are being replaced mostly by Hispanics: CA-09, CA-35, and TX-18. IL-01 and MD-04 have fallen off the list from 2008, replaced by PA-02 and TX-18.

The top 10 by raw numbers of losses among African-Americans is led (perhaps no surprise) by LA-02, which went from 407K to 287K, followed by MI-13, IL-07, MI-14, IL-01, NY-11, GA-05, PA-02, CA-33, CA-09. Interestingly, because New Orleans in general lost so many people, the 2nd still significantly trails IL-07 in terms of the percentage loss.

Now let’s look at Asian-American populations:

District Rep. 2000
Asian
2000
total
2000
%
2010
Asian
2010
total
2010
%
%
change
2000
election
2008
election
NY-05 Ackerman (D) 159,491 654,253 24.4 218,275 670,130 32.3 8.2 67/30 63/36
CA-13 Stark (D) 179,681 638,708 28.1 239,434 665,318 36.0 7.9 67/30 74/24
CA-15 Honda (D) 187,198 639,090 29.3 246,832 677,605 36.4 7.1 60/36 68/30
CA-48 Campbell (R) 80,095 638,848 12.5 137,094 727,833 18.8 6.3 40/58 49/49
NJ-12 Holt (D) 58,748 647,253 9.1 104,996 701,881 15.0 5.9 56/40 58/41
VA-10 Wolf (R) 41,846 643,714 6.5 107,583 869,437 12.4 5.9 41/56 53/46
WA-08 Reichert (R) 50,745 655,029 7.7 108,807 810,754 13.4 5.7 49/47 57/42
CA-11 McNerney (D) 55,895 639,625 8.7 114,217 796,753 14.3 5.6 45/53 54/44
CA-14 Eshoo (D) 102,430 639,953 16.0 140,789 653,935 21.5 5.5 62/34 73/25
CA-03 Lungren (R) 36,970 639,374 5.8 84,384 783,317 10.8 5.0 41/55 49/49

The Asian gains, percentagewise, are concentrated in the Bay Area, although the #1 gainer is NY-05, where the majority of the population is in NE Queens. Flushing is now thoroughly Asian, and that’s starting to spill over into Bayside (of Archie Bunker and Jerky Boys fame). That’s followed by the East Bay’s CA-13, the first non-Hawaiian district to have an Asian plurality. The rest of the list is mostly affluent suburban areas which are starting to become light-blue at the presidential level even as they keep Republicans in the House; will declining white populations in these districts be enough to push them over the edge?

NY-06, NJ-07, and TX-22 have fallen off the list from 2008, replaced by NJ-12, WA-08, and CA-03. If you’re curious about the top 10 by raw numbers gain, it mostly overlaps the above list, although with some of the all-purpose growth engines (like NV-03) on there too: NV-03, VA-10, TX-22, CA-13, CA-15, NY-05, CA-11, WA-08, CA-48, and VA-11.

Only twelve districts have experienced any drops in the Asian population by percentage, and most of the drops are small, so there’s not much need for a chart for them; HI-02 (28.0% to 24.9%) had the most significant change, partly because of an influx of white retirees but more so because the big rise in “Two or more” as a common choice in Hawaii. That’s followed mostly by districts with rapidly growing Latino populations:  HI-01, CA-20, CA-18, IL-02, TX-29, FL-17, CA-51, TX-30, CA-35, NY-16, and TX-16. Only six districts had drops in raw numbers of Asians: IL-02, MI-13, TX-29, FL-17, IL-05, and IL-01.

Finally, let’s look at Hispanics:

District Rep. 2000
Hispanic
2000
total
2000
%
2010
Hispanic
2010
total
2010
%
%
change
2000
election
2008
election
IL-03 Lipinski (D) 139,268 653,292 21.3 225,298 663,381 34.0 12.6 58/40 64/35
CA-25 McKeon (R) 174,193 638,768 27.3 330,711 844,320 39.2 11.9 42/56 49/48
CA-41 Lewis (R) 150,076 639,935 23.5 277,907 797,133 34.9 11.4 41/56 44/54
CA-43 Baca (D) 371,501 637,764 58.3 510,693 735,581 69.4 11.2 64/34 68/30
CA-22 McCarthy (R) 133,571 638,514 20.9 255,209 797,084 32.0 11.1 33/64 38/60
CA-18 Cardoza (D) 268,586 639,004 42.0 381,039 723,607 52.7 10.6 53/44 59/39
FL-20 Wasserman Schultz (D) 132,575 639,795 20.7 216,352 691,727 31.2 10.6 69/31 63/36
TX-10 McCaul (R) 122,894 651,523 18.9 282,641 981,367 28.8 9.9 34/67 44/55
TX-29 Green (D) 430,980 651,405 66.2 514,861 677,032 76.0 9.9 57/43 62/38
TX-02 Poe (R) 82,578 651,605 12.7 176,196 782,375 22.5 9.8 37/63 40/60

As in 2008, the biggest gainer is IL-03, covering Chicago’s Southwest Side. (I’m truly not sure if people are moving from the depopulating, closer-in IL-04 to the slightly more spacious 3rd, or if the 3rd is becoming the destination of choice for new émigrés; maybe Chicagoans in the comments might shed some insight into that.) And in second place continues to be CA-25, a Republican-held district linking LA suburbs like Santa Clarita with high desert outposts like Lancaster. Interestingly, the list is pretty evenly divided by Democratic-held districts that already were substantially Hispanic and just got much more so (like TX-29 and CA-43), and Republican-held suburban districts where voting patterns haven’t caught up with the Hispanic population (and given the number of kids and non-citizens among those numbers, where it’ll take many more years for that catching up to happen).

There’s been a lot of churn among districts since 2008, perhaps a result of the difficulty of estimating Hispanic populations: districts falling off the top 10 list since 2008 are TX-32, TX-05, AZ-04, and CA-52. These have been replaced by CA-43, CA-18, TX-10, and TX-02.

The top 10 in raw numbers gain doesn’t correlate directly with districts that had biggest white percentage drops or Hispanic percentage gains. Instead, the list pretty thoroughly overlaps with the list of the top population gainers overall; while the Hispanic percentage went upwards in all of those districts, many of these districts were ones with a large Hispanic share already: case in point, the biggest gainer, FL-25 in Miami’s westernmost suburbs (which went from 398,986 to 577,998). That’s followed by CA-45 (which I certainly would have expected to see in the top 10 Hispanic percentage changes, but where the share increased “only” by 7.2%), TX-28, TX-10, CA-25, AZ-07, TX-15, CA-44, TX-23, and CA-43.

One remarkable thing about Hispanic growth is that it’s present almost everywhere. Only six districts experienced any drops in the Hispanic percentage whatsoever, all in urban districts where regentrification is occurring: starting with NY-12 (48.7% to 44.6%), followed by CA-31, NY-15, CA-29, IL-04, and NY-14. Those same six districts were the only ones to report drops in raw numbers, either: IL-04 had the biggest loss (from 486,839 to 442,018), CA-31, NY-12, NY-15, CA-29, and NY-14.

5-4 Indiana Dem gerrymander

So since the Republicans released a “clean” gerrymander, I wanted to see what Dems could do if they were at the wheel again. My gerrymander isn’t clean in the sense of compact districts but it does minimize county-splitting. Sadly this is fantasy but I thought it’d be fun anyway to link together the places in Indiana that vote Dem.

One note: I only bothered to put Obama guesstimates for the districts that are supposed to be Democratic. The other ones are basically just Republican votesinks so it’s probably safe to assume they’re not competitive.

IN-01 Incumbent: Pete Visclosky, D-Merrillville

Little change here. Eats up the rest of Porter County as well as part of White County for population reasons. Only slightly less Dem, most likely.

Obama guesstimate: ~61%

IN-02 Incumbent: Joe Donnelly, D-Granger

Not much change. It’s probably unavoidable that this one gets more Republican due to population loss. Even so it should be mostly the same. Might have voted Donnelly out in 2010 but a better shot for him than what the Republicans have planned.

Obama guesstimate: ~53%

IN-03 Incumbent: Marlin Stutzman, R-Howe

Not much change, Safe R.

IN-04 OPEN

Todd Rokita is drawn out of this district and it is entirely reconfigured to become much more Democratic. It takes in a smorgasbord of Democratic cities like Muncie, Anderson, West Lafayette, and Terre Haute to create a district with a solid Democratic base.

Obama guesstimate: 53-54%

IN-05 Incumbent: Todd Rokita, R-Indianapolis?

Republican vote sink in the Indy suburbs. The Indiana version of the Circle of Ignorance. I’m not sure if Rokita lives here or the 7th, but he’ll have no trouble here, at least not in the general. Safe R.

IN-06 OPEN

Republican vote sink that starts in Fort Wayne and wraps around to the Indy suburbs. Hey, I told you this was a gerrymander. Safe R.

IN-07 Incumbent: Andre Carson, D-Indianapolis; Dan Burton, R-Indianapolis; Todd Rokita, R-Indianapolis?

Expands slightly. Should still be safe D. I’m pretty sure Burton lives here and Rokita might too. This district is far too Dem for them so they should duke it out in the 5th, or one can move to the 6th. (Perhaps Burton should just retire; he’s probably dead in the primary against a second-tier candidate, let alone a sitting Congressman.)

Obama guesstimate: ~68%

IN-08 OPEN

I guess I could have swapped the 8th and 9th, but whatever. Anyway, this is another gerrymandered vote sink winding its way from the Indy burbs to the Ohio River, and is Safe R.

IN-09 Incumbent: Larry Bucshon, R-Newburgh; Todd Young, R-Bloomington

Both Bucshon and Young live here, but neither will want to stick around. They’re both too conservative to win a district that contains Evansville and Bloomington, so they might as well run to the 8th (where Young has the advantage because some of it is territory he represents now). Even though this district only narrowly vote for Obama, some of its McCain-voting counties might be loyal to a conservadem. Both Brad Ellsworth and Baron Hill live here, so this might be an interesting Dem primary.

Obama guesstimate: 50% (narrow win)

Where Will We See New VRA Districts?

It’s a subject of much debate (and some confusion), and it’ll remain at least somewhat opaque until the Obama Department of Justice weighs in, but the question still is: Where will we see new majority-minority districts created in order to comply with the Voting Rights Act? I invite you to list any states – and especially regions of those states – where you think maj-min districts could get drawn, whether by state legislatures, by the DoJ, or in the end, by the courts. Bonus points for anyone who actually draws any proposed VRA districts.

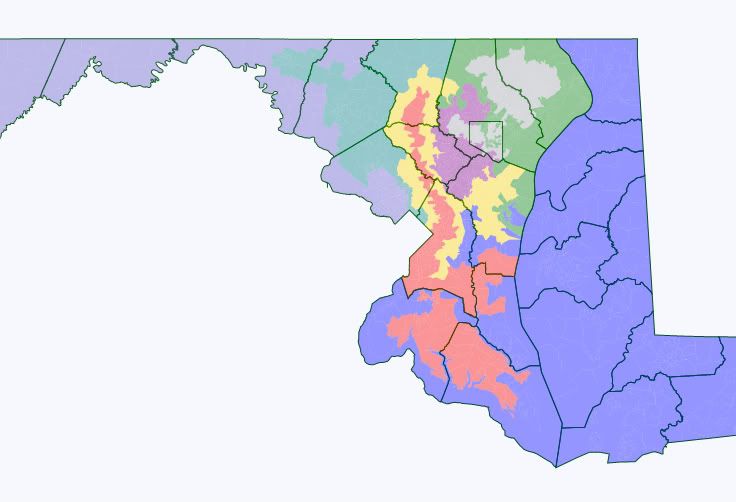
8-0 Maryland

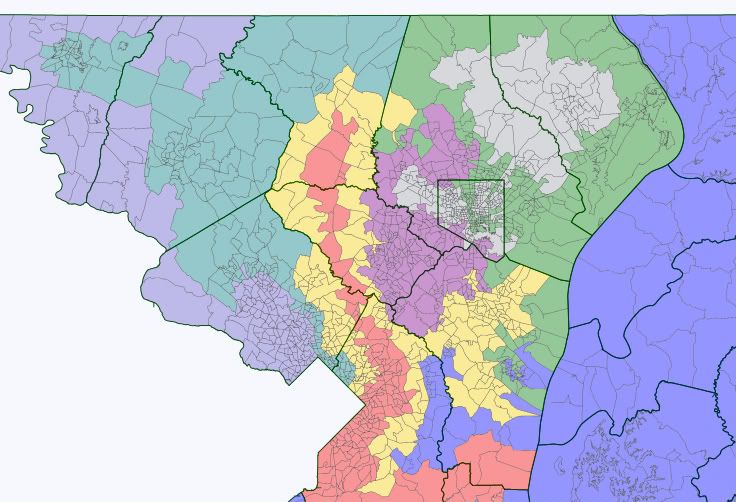
This map is extremely ugly, but it gets the job done.  The main reason for its ugliness is the VRA retrogression rule.  So, in order to use white Democrats to our advantage, almost all the whites in the VRA-protected 4th and 7th districts are Republicans.  Likewise, in the other districts, almost all the Democrats are white.  If not for the VRA, we could have made a much more compact map with a nearly invincible 8-0 delegation.

The main goals here were:

1. Make an Obama district for Kratovil.

2. Knock out Bartlett and Harris.

3. Make almost all the other districts 60% Obama.

Here’s the map:

Photobucket

District 1 (blue): Frank Kratovil?

It keeps the Eastern Shore intact, but sheds the conservative areas in Northern Maryland.  It uses water contiguity to grab liberal areas of Annapolis, as well as parts of mid and southern Maryland.  The current PVI is R+13.  It’s now like R+4 or 5, which should be no problem for Kratovil, barring another 2010.  It also manages to move Harris into one of the other districts.

Obama: 50.5%, McCain: 48% (previously 58-40 McCain)

White: 68.9%, Black: 22.3%

VAP: White: 71.5%%, Black: 21.3%

Likely D for Kratovil, Lean R otherwise

District 2 (green): Dutch Ruppersberger/Andy Harris

The district is weakened considerably from its current D+7 to around D+2, but Harris has no chance here, considering he lost in an R+13 district in 2008.  In Congressional races between 2006-2008, the Democrat actually won an average of 59.7%.  Parts of Baltimore County are more Democratic than the Obama-McCain numbers show.  Some of the people actually vote for Democrats, but are notorious racists and McCain mopped up in this area.  For example, in Edgemere, all 3 precincts went solidly for McCain, but the congressional Democrat won in both 2006 and 2008.  So, Ruppersberger should be fine in this district, barring another 2010.   As a side note, John Sarbanes probably lives here as well, but would likely opt to run in the new 3rd.

Obama: 54.8%, McCain: 42.8% (previously 60-38 Obama)

White: 68.5%, Black: 19.0%

VAP: White: 71.8%, Black: 17.1%

Likely D vs. Harris, Lean D otherwise

District 8 (light purple): Chris Van Hollen

This stretches north and adds northwest Maryland, as part of the plan to knock out Bartlett.  It goes down from D+21 to about D+7, but Van Hollen is definitely safe.

Obama: 60.5%, McCain: 37.9 (previously 74-25 Obama)

White: 65.1%, Hispanic: 12.7%, Asian: 10.8%

VAP: White: 67.0%, Hispanic: 11.7%, Asian: 10.9%

Safe D

Central Maryland:

Photobucket

District 3 (purple): John Sarbanes

Not too much to say here.  Its PVI of D+6 probably stays about the same.

Obama: 59.8%, McCain: 38.2% (previously 59-39 Obama)

White: 57.9%, Black: 24.2%

VAP: White: 61.0%, Black: 23.0%

Safe D

District 4 (red): Donna Edwards

This black-majority district extends far north and south to take in as many Republicans as possible.  Might a lose a few points off its D+31 rating, but it’s not like that would make any difference.  It barely meets retrogression requirements by staying at 56.8% black.

Obama: 76.5%, McCain: 22.6% (previously 85-14 Obama)

Black: 56.8%, White: 30.7%

VAP: Black: 56.4%, White: 32.2%

Safe D

District 5 (yellow): Steny Hoyer

The used-condom district includes liberal areas in Montgomery, Prince George, and Anne Arundel Counties, as well as Republican areas from wrapping around the 4th district.  Hoyer doesn’t live here, but he basically lives in DC anyway, so he would just run here.  It may be weakened a bit from its current D+11, but he’s still safe.

Obama: 60.0%, McCain: 38.3% (previously 65-33 Obama)

White: 54.9%, Black: 24.6%, Hispanic: 11.4%

VAP: White: 57.1%, Black: 24.0%, Hispanic: 10.1%

Safe D

District 6 (teal): Roscoe Bartlett

Bartlett is technically the incumbent, but has pretty much no chance here.  His current district is R+13, but this is D+6 or 7.  We’ll still probably have to run a minor campaign the first time to ensure he doesn’t become a Republican Chet Edwards, but otherwise we’re safe.  Someone who knows more about Maryland politics could suggest a possible Dem candidate here.

Obama: 60.2%, McCain: 38.1% (previously 58-40 McCain)

White: 57.1%, Black: 17.2%, Hispanic: 15.8%

VAP: White: 59.6%, Black: 17.0%, Hispanic: 14.5%

Likely D vs. Bartlett in 2012, Safe D otherwise

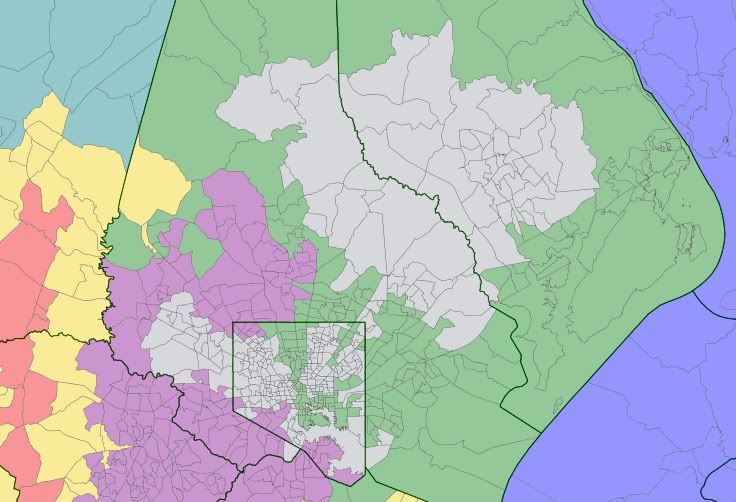
Baltimore Area Close-up:

Photobucket

District 7 (gray): Elijah Cummings

Perhaps the ugliest district on this map, this includes black areas in Baltimore City, as well as deep red parts of Baltimore and Harford Counties.  It probably stays at around D+25.

Obama: 71.5%, McCain: 27.1% (previously 79-20 Obama)

Black: 59.1%, White: 34.5%

VAP: Black: 57.9%, White: 36.3%

Safe D

IN Redistricting: Republicans Release New Maps

Sounds like we’re getting exactly what we expected:

Indiana lawmakers unveiled a new draft of legislative maps Monday morning that would solidify some Republican congressional seats, while making one Democratic congressional seat nearly certain to shift into Republican hands.

The maps proposed in the Senate Elections Committee this morning would make major changes to Democratic U.S. Rep. Joe Donnelly’s 2nd District, in north-central Indiana.

Lawmakers are proposing to drop Howard County, which includes the Democratic-leaning city of Kokomo, as well as part of Democratic-leaning LaPorte County, and add all of Republican-leaning Elkhart County and much of strongly-GOP Kosciusko County, among other changes.

I’ll wait until the numbers get run, but it sure seems likely that this new map will inspire Donnelly to run for Senate instead. Assuming Hoosier Republicans don’t melt down the way their counterparts have just done in Louisiana, these new plans should pass easily, seeing as the GOP controls the trifecta. Anyhow, the new map is just below, and new state Senate and House maps are below the fold (and no, I don’t know why the House map appears to be suffering from gigantism).

UPDATE: Statement (via email) from Donnelly:

I am disappointed because it appears that politics played into the drawing of the congressional district lines revealed this morning by Republicans in the General Assembly.  By comparison, the Indiana Senate Democrats released a map of congressional districts a few weeks ago that respected “communities of interest,” as called for by Governor Daniels.  For example, in the Senate Democrats’ map, LaPorte County was intact in the 2nd Congressional District and Kosciusko County was intact in the 3rd Congressional District.  In the Republicans’ map, LaPorte County is divided between the 1st and 2nd Congressional Districts and Kosciusko County is divided between the 2nd and 3rd Congressional Districts.

Even though it appears that politics played a role in the drawing of this map, I am confident that a Democrat can win in the new 2ndCongressional District.  Then-Senator Obama performed well in this district in 2008, earning 49% of the vote.  Also, it is not uncommon for a Democratic candidate in Indiana to outperform his or her nominee for president.  I did it in 2008, outperforming then-Senator Obama by 13 points, and I know it can be done again.

As for my future plans, my decision will ultimately be based on how I can best serve the people of this great state.  I will soon be sitting down with my wife and children and expect to make a decision in the coming weeks.

State Senate:

State House:

2010 California Gubernatorial: City by City results for Los Angeles County and suburbs

My analysis after the numbers

https://spreadsheets.google.co…

  Brown Whitman Total Votes D% R%
Agoura Hills 4037 4295 8332 48.45% 51.55%
Alhambra 11075 5267 16342 67.77% 32.23%
Arcadia 6012 8070 14082 42.69% 57.31%
Artesia 1618 1160 2778 58.24% 41.76%
Avalon 456 447 903 50.50% 49.50%
Azusa 5505 2914 8419 65.39% 34.61%
Baldwin Park 8403 2235 10638 78.99% 21.01%
Bell 3732 727 4459 83.70% 16.30%
Bell Gardens 3647 652 4299 84.83% 15.17%
Bellflower 8462 4924 13386 63.22% 36.78%
Beverly Hills 7156 5579 12735 56.19% 43.81%
Bradbury 117 247 364 32.14% 67.86%
Burbank 17818 12079 29897 59.60% 40.40%
Calabasas 4194 3988 8182 51.26% 48.74%
Carson 19010 5060 24070 78.98% 21.02%
Cerritos 8087 7109 15196 53.22% 46.78%
Claremont 8254 5426 13680 60.34% 39.66%
Commerce 2126 437 2563 82.95% 17.05%
Compton 14783 759 15542 95.12% 4.88%
Covina 6364 5409 11773 54.06% 45.94%
Cudahy 1932 337 2269 85.15% 14.85%
Culver City 11810 3759 15569 75.86% 24.14%
Diamond Bar 7271 7449 14720 49.40% 50.60%
Downey 14314 9269 23583 60.70% 39.30%
Duarte 3576 2125 5701 62.73% 37.27%
El Monte 9385 3175 12560 74.72% 25.28%
El Segundo 2925 3489 6414 45.60% 54.40%
Gardena 9995 2936 12931 77.29% 22.71%
Glendale 24362 16771 41133 59.23% 40.77%
Glendora 6582 10251 16833 39.10% 60.90%
Hawaiian Gardens 1186 393 1579 75.11% 24.89%
Hawthorne 11037 3260 14297 77.20% 22.80%
Hermosa Beach 3948 3907 7855 50.26% 49.74%
Hidden Hills 336 562 898 37.42% 62.58%
Huntington Park 5561 896 6457 86.12% 13.88%
Industry 19 31 50 38.00% 62.00%
Inglewood 22667 1810 24477 92.61% 7.39%
Irwindale 306 93 399 76.69% 23.31%
La Canada Flintridge 3744 5569 9313 40.20% 59.80%
La Habra Heights 739 1645 2384 31.00% 69.00%
La Mirada 6275 7474 13749 45.64% 54.36%
La Puente 4798 1290 6088 78.81% 21.19%
La Verne 4954 6523 11477 43.16% 56.84%
Lakewood 12636 11322 23958 52.74% 47.26%
Lancaster 14276 15632 29908 47.73% 52.27%
Lawndale 3610 1545 5155 70.03% 29.97%
Lomita 2836 2691 5527 51.31% 48.69%
Long Beach 68343 36700 105043 65.06% 34.94%
Los Angeles 590793 213305 804098 73.47% 26.53%
Lynwood 7739 1055 8794 88.00% 12.00%
Malibu 2919 2528 5447 53.59% 46.41%
Manhattan Beach 7162 8587 15749 45.48% 54.52%
Maywood 2723 391 3114 87.44% 12.56%
Monrovia 5984 5037 11021 54.30% 45.70%
Montebello 9631 2983 12614 76.35% 23.65%
Monterey Park 7632 4138 11770 64.84% 35.16%
Norwalk 13042 5862 18904 68.99% 31.01%
Palmdale 15179 12707 27886 54.43% 45.57%
Palos Verdes Estates 2329 4535 6864 33.93% 66.07%
Paramount 5627 1315 6942 81.06% 18.94%
Pasadena 28307 13897 42204 67.07% 32.93%
Pico Rivera 10777 2806 13583 79.34% 20.66%
Pomona 15825 6406 22231 71.18% 28.82%
Rancho Palos Verdes 7322 10508 17830 41.07% 58.93%
Redondo Beach 12730 11692 24422 52.13% 47.87%
Rolling Hills 238 784 1022 23.29% 76.71%
Rolling Hills Estates 1334 2432 3766 35.42% 64.58%
Rosemead 5144 2157 7301 70.46% 29.54%
San Dimas 4852 6357 11209 43.29% 56.71%
San Fernando 2855 828 3683 77.52% 22.48%
San Gabriel 4263 2852 7115 59.92% 40.08%
San Marino 1817 3266 5083 35.75% 64.25%
Santa Clarita 21113 31224 52337 40.34% 59.66%
Santa Fe Springs 2739 1203 3942 69.48% 30.52%
Santa Monica 26817 9164 35981 74.53% 25.47%
Sierra Madre 2759 2559 5318 51.88% 48.12%
Signal Hill 1871 1007 2878 65.01% 34.99%
South El Monte 2070 492 2562 80.80% 19.20%
South Gate 11093 2502 13595 81.60% 18.40%
South Pasadena 6456 3353 9809 65.82% 34.18%
Temple City 4318 3923 8241 52.40% 47.60%
Torrance 20974 23561 44535 47.10% 52.90%
Vernon 10 14 24 41.67% 58.33%
Walnut 4223 4021 8244 51.23% 48.77%
West Covina 14056 8930 22986 61.15% 38.85%
West Hollywood 11026 2457 13483 81.78% 18.22%
Westlake Village 1628 2308 3936 41.36% 58.64%
Whittier 12770 10409 23179 55.09% 44.91%
Unincorporated area of Los Angeles County 144758 78196 222954 64.93% 35.07%
           
Aliso Viejo 5363 8067 13430 39.93% 60.07%
Anaheim 29395 34529 63924 45.98% 54.02%
Brea 4546 8698 13244 34.32% 65.68%
Buena Park 8044 8476 16520 48.69% 51.31%
Costa Mesa 11389 15715 27104 42.02% 57.98%
Cypress 6129 8836 14965 40.96% 59.04%
Dana Point 4808 8555 13363 35.98% 64.02%
Fountain Valley 6960 12816 19776 35.19% 64.81%
Fullerton 14349 20155 34504 41.59% 58.41%
Garden Grove 16601 19682 36283 45.75% 54.25%
Huntington Beach 24769 43552 68321 36.25% 63.75%
Irvine 25659 30915 56574 45.35% 54.65%
La Habra 5750 7176 12926 44.48% 55.52%
La Palma 2109 2672 4781 44.11% 55.89%
Laguna Beach 5707 5259 10966 52.04% 47.96%
Laguna Hills 3703 6975 10678 34.68% 65.32%
Laguna Niguel 8450 16007 24457 34.55% 65.45%
Laguna Woods 4849 5096 9945 48.76% 51.24%
Lake Forest 8048 15745 23793 33.83% 66.17%
Los Alamitos 1607 2077 3684 43.62% 56.38%
Mission Viejo 11727 23818 35545 32.99% 67.01%
Newport Beach 10546 26983 37529 28.10% 71.90%
Orange 13839 24103 37942 36.47% 63.53%
Placentia 5344 9681 15025 35.57% 64.43%
Rancho Santa Margarita 4701 10550 15251 30.82% 69.18%
San Clemente 7829 16243 24072 32.52% 67.48%
San Juan Capistrano 3838 7681 11519 33.32% 66.68%
Santa Ana 27616 15471 43087 64.09% 35.91%
Seal Beach 5018 6999 12017 41.76% 58.24%
Stanton 3052 2837 5889 51.83% 48.17%
Tustin 6838 9770 16608 41.17% 58.83%
Villa Park 658 2552 3210 20.50% 79.50%
Westminster 9356 12705 22061 42.41% 57.59%
Yorba Linda 6889 19832 26721 25.78% 74.22%
Unincorporated area of Orange County 13177 29650 42827 30.77% 69.23%
           
Banning 3498 4219 7717 45.33% 54.67%
Beaumont 3413 4484 7897 43.22% 56.78%
Blythe 1739 881 2620 66.37% 33.63%
Calimesa 919 1635 2554 35.98% 64.02%
Canyon Lake 1000 2829 3829 26.12% 73.88%
Cathedral City 5475 4102 9577 57.17% 42.83%
Coachella 2806 530 3336 84.11% 15.89%
Corona 13285 17573 30858 43.05% 56.95%
Desert Hot Springs 2044 1657 3701 55.23% 44.77%
Eastvale 4222 4012 8234 51.28% 48.72%
Hemet 7235 10213 17448 41.47% 58.53%
Indian Wells 567 1764 2331 24.32% 75.68%
Indio 6854 6578 13432 51.03% 48.97%
La Quinta 4119 7699 11818 34.85% 65.15%
Lake Elsinore 3619 4314 7933 45.62% 54.38%
Menifee 7538 12231 19769 38.13% 61.87%
Moreno Valley 19145 11567 30712 62.34% 37.66%
Murrieta 8544 16493 25037 34.13% 65.87%
Norco 2100 4499 6599 31.82% 68.18%
Palm Desert 6043 9839 15882 38.05% 61.95%
Palm Springs 9848 5518 15366 64.09% 39.33%
Perris 4755 1911 6666 71.33% 28.67%
Rancho Mirage 2870 4269 7139 40.20% 59.80%
Riverside 31925 28034 59959 53.24% 46.76%
San Jacinto 3323 3493 6816 48.75% 51.25%
Temecula 7956 16088 24044 33.09% 66.91%
Wildomar 2601 4757 7358 35.35% 64.65%
Unincorporated area of Riverside County 38955 53470 92425 42.15% 57.85%
           
Adelanto 1739 1078 2817 61.73% 38.27%
Apple Valley 6237 12279 18516 33.68% 66.32%
Barstow 1880 1785 3665 51.30% 48.70%
Big Bear Lake 582 1356 1938 30.03% 69.97%
Chino 7556 8122 15678 48.19% 51.81%
Chino Hills 8771 12020 20791 42.19% 57.81%
Colton 5551 2454 8005 69.34% 30.66%
Fontana 18868 9922 28790 65.54% 34.46%
Grand Terrace 1664 1867 3531 47.13% 52.87%
Hesperia 6253 9419 15672 39.90% 60.10%
Highland 5746 5191 10937 52.54% 47.46%
Loma Linda 2119 2549 4668 45.39% 54.61%
Montclair 3549 1943 5492 64.62% 35.38%
Needles 536 489 1025 52.29% 47.71%
Ontario 15031 10177 25208 59.63% 40.37%
Rancho Cucamonga 19542 23661 43203 45.23% 54.77%
Redlands 9762 11635 21397 45.62% 54.38%
Rialto 10473 4035 14508 72.19% 27.81%
San Bernardino 19302 10638 29940 64.47% 35.53%
Twenty-nine Palms 1052 1604 2656 39.61% 60.39%
Upland 9207 11708 20915 44.02% 55.98%
Victorville 8747 8106 16853 51.90% 48.10%
Yucaipa 5284 9144 14428 36.62% 63.38%
Yucca Valley 2002 3504 5506 36.36% 63.64%
Unincorporated area of San Bernardino County 26125 37531 63656 41.04% 58.96%


I’ve opted to break down some of the larger counties and the ones that I know a lot about. Results by city are very telling. I’ve compared results just by the two way vote between Brown and Whitman, just to get a clearer look at how the both main parties match up head to head in each municipality. I got the numbers from the Secretary of State’s site, but I worked out the percentages myself with the help of Calc (please point any errors if you notice any).

Los Angeles County

As you can see, most of the usual pockets of Republican strength went to Whitman, with wealthier municipalities giving her the highest margins. The Senate results were almost identical, with only Lomita voting Democratic for Governor and Republican for Senate. The income polarization is very noticeable, the highest income place won by Brown was Beverly Hills. Malibu was probably the second highest income area Brown won, while Calabasas would likely rank behind it.

Orange County

Clearly, no surprise that most municipalities voted Republican and by sizable numbers. Laguna Beach, Santa Ana and Stanton voted for Brown. The lighter Republican voting areas aren’t that surprising, save for Laguna Woods, which is an exclusive retirement community. Again, income counts for a lot, since most of the municipalities won by Whitman are very high income and exclusive. Minority population growth has cause Republican numbers to erode, but it still is decisively Republican.

Riverside County

Whitman won the county overall, but well below the margins Republicans used to post here. Minority population growth has really boosted Democratic fortunes in Riverside County. Riverside proper and Moreno Valley have seen the biggest increase in minority population. Once again, the higher income communities are the darkest red, with exclusive Canyon Lake being the most heavily GOP voting.

San Bernardino County

Voted along the lines of Riverside County, but had a couple of split decisions. Barstow and Needles voted Democratic for Governor and Republican for Senate. I would imagine that Brown’s crossover appeal from his previous service helped him here a bit. Just like Riverside County, Whitman’s performance was well below what most Republicans in other states get in suburbs in good GOP years. Democrats have a solid foundation in Fontana, Ontario, Rialto and San Bernardino proper, which have grown a lot over time, with most of that growth being minorities who have left Los Angeles seeking better housing and work.

SSP Daily Digest: 4/11

Senate:

CT-Sen: William Tong, a state rep we mentioned once before, is supposedly gearing up to enter the Democratic primary. He was recently in DC “making the rounds,” and is reportedly trying to hire staff. I don’t really see how he has a chance, given that two big names are already in the race, but maybe he’s hoping for a good enough showing to improve his name rec with the political classes for a future run. (Tong’s only in his late 30s.)

NE-Sen: State Sen. Deb Fischer, a sorta dark-horse candidate given that two statewide officials are already running in the GOP primary, is getting encouragement from a one-time statewide office-holder: former Gov. Kay Orr, the first Republican woman to be elected governor in the United States. Interestingly, the man who stopped Orr in her bid for re-election in 1990 is the guy Fischer would take on: Ben Nelson.

OH-Sen: As promised early last week, Josh Mandel filed paperwork with the FEC to form a Senate campaign committee, but his mouthpiece insists that it’s not a formal statement of candidacy, just “a step.”

WI-Sen: GOP ex-Rep. Mark Neumann, on a two-race losing streak, is hoping that the third time’s the charm. After offering some recent hints, Neumann’s now explicitly saying he’s considering a run against Herb Kohl. He hasn’t offered any kind of timetable, except to suggest he’s kinda-sorta waiting on Rep. Paul Ryan, the guy who inherited his seat in the House. (I seriously doubt Ryan will run, given his prominence in the House GOP leadership.) Neumann was last seen losing the 2010 GOP gubernatorial primary to none other than Scott Walker. Before that, he’d been out of politics for a long time, narrowly losing the 1998 Senate race to Russ Feingold. Neumann has some personal wealth he could throw into the race, though of course Kohl has a ton of money (and a history of self-funding).

House:

NY-26: The cries of “splitters!” from the Judean People’s Front/People’s Front of Judea battle raging in upstate New York have just grown louder. The leaders of one teabagger group, TEA New York, issued an endorsement to Republican Jane Corwin, furious as they are over Crazy Jack Davis appropriating their good name and branding his ballot line the “Tea Party.” Meanwhile, another teabagger org, the Tea Party Coalition, gave their seal of approval to Davis, who denounced TEA NY as a tool of the GOP. Oh, it also helps that the leaders of the TPC are on the Davis payroll. But for the full flavor, I strongly encourage you to read Alan Bedenko’s hilarious summation of all this mishugas.

TX-26: Dianne Costa, a former GOP mayor of Highland Village (pop. 17K) has filed paperwork to run in the 26th CD, currently held by backbencher Michael Burgess. Odds are this is a Schrödinger’s Seat situation. (H/t FEC Kenobi)

Other Races:

Las Vegas Mayor: I’m borderline uncomfortable reporting polls from Strategic National, because their chief, John Yob, established himself as an untrustworthy partisan hack almost right out the gate. But in any event, Jon Ralston obtained a copy (warning: Word file) of a poll they just took in this race, showing Carolyn Goodman ahead of Chris Giunchigliani by a 48-34 spread. It’s not clear who if anyone the poll was taken for, but oddly enough, it tests some negative messages against both candidates – not something you usually see in a poll that gets released into the wild. It also features percentages that go into the thousandths, which means you know it’s extra-accurate.

Wisconsin Sup. Ct.: It’s sort of redundant to begin a bullet linking to 538 by saying “Nate Silver crunches the numbers,” because of course that’s what he’s just done. Anyhow, click the link for his look at whether the Wackiness in Waukesha points to incompetence or fraud (conclusion: “[I]f you want to allege that there’s a conspiracy afoot, the statistical evidence tends to work against you.) Craig Gilbert of the Journal Sentinel also thinks the new numbers are plausible. And for a more amusing tidbit that definitely tilts in favor of Waukesha County Clerk Kathy Nickolaus being a boob, check out this entertaining story from Michigan Liberal.

Meanwhile, despite now facing very challenging odds (or perhaps because of it), JoAnne Kloppenburg has hired Marc Elias, the attorney who led Al Franken’s legal efforts in his recount battle. David Prosser is tapping Ben Ginsburg, who, in addition to representing Norm Coleman, played a big role in the Bush Florida recount team.

Remainders:

Voter Suppression: Huh – why is Jon Husted, Ohio’s Republican Secretary of State, trying to sound reasonable on the issue of voter ID? In the fact of pending legislation which would require voters to bring a government-issued photo ID with them to the polls, Husted instead is in favor of allowing people to use other forms of identification, like a utility bill or government-issued check. Given how deep VOTER FRAUD!!!!!!!1111 runs in the teabagger bloodstream, this is one issue (like immigration) on which any sensible Republican with higher ambitions would be wise to avoid, yet here Husted is sticking his neck out on it. What gives?

Redistricting Roundup:

Colorado: Colorado’s new congressional map is now not expected until April 21st, instead of April 14th, as originally planned. Republicans are whining about the delay, which is partly due to the fact that 2010 precinct-level data is still being churned out by the Secretary of State’s office. (The SoS claims they usually don’t get it out until June 30th… why should it take eight months to do this?) Anyhow, I don’t really understand why Republicans would be better off if Dems don’t use the 2010 data, unless they think Democrats are dumb enough to redistrict solely based on 2008 numbers. (They aren’t.) It doesn’t matter, though, since the GOP isn’t going to get their way here.

Connecticut: The redistricting process is (slowly) starting here in CT.

Florida: This is fiendish: Republicans in the legislature are pushing a constitutional amendment which would split Florida’s seven-judge Supreme Court into separate five-member civil and criminal divisions, and which would also shunt the three most senior members into the criminal section. That would give Rick Scott three new appointments, and whaddya know! the four most junior justices are all Charlie Crist appointees, while the longest-serving three were all elevated by Dem Gov. Lawton Chiles. This is appearing in the redistricting roundup because Dems are (rightly) accusing the GOP of trying to pack the court in advance of the inevitable legal battles over redistricting. In order for this measure to appear on the ballot before Nov. 2012, though, it’ll require the support of some Dems in the House. Let’s hope they aren’t stupid enough to fall for this.

Anyhow, the legislature is starting work on redistricting, but it sounds like they are in no hurry to get the job done (the above story might be part of the reason): House Speaker Dean Cannon told members who want to be on the redistricting committee to expect to work hard into next year. Of course, we do things quite a bit fast around here, so if you want to play around with the latest redistricting toy, check out this new online tool for remapping Florida.

Iowa: Today is the deadline for members of Iowa’s advisory commission to issue its recommendations on the state’s new set of maps, after which the lege has to give them an up-or-down vote. All signs point to passage, which would make Iowa the first state in the nation to complete its redistricting process.

Louisiana: Well, after a quick start with a flurry of plans getting subject to scrutiny, things have definitely gone off the rails in Louisiana. Five of the state’s six Republican congressmen sent a letter to Gov. Bobby Jindal asking the legislature to delay federal redistricting until next year – and Jindal apparently agrees with the idea. Daily Kingfish describes this as a big setback for Jindal, given that his party controls the entire lege. It is a little surprising to me that one man, Rep. Charles Boustany, apparently has the power (and the allies in the state Senate) to mess with Jindal like this, but perhaps the governor simply thinks he can steamroll Boustany after the November elections, assuming Republicans gain more seats.

New Jersey: The fallout continues: Three NJ legislators have announced they will move into new districts so that they can run again this fall, and apparently all of them are being welcomed to do so by their own parties. Of course, it’s still early, and some people will definitely get squeezed out by the end.

Ohio: This is actually the same link at the voter suppression story above, but it contains a throw-away line at the end in which SoS Jon Husted says congressional districts need to be re-drawn by Sept. 1st in order for Ohio to hold its primary by March 2012. (Otherwise it would have to get moved – to May, according to the article, but if the process really drags on, who knows how late things could get shifted.)

Sacramento: You can redistrict the city of Sacramento, California in this online game.

Virginia: Played for fools – that’s what Virginia House Democrats are. GOP Lt. Gov. Bill Bolling is praising the Republican gerrymander of the state House, which passed with near-total Dem support in that body, despite representing a deliberate plan to fuck over Democrats, as having “strong bipartisan support.” At the same time, he’s slamming the Dem state Senate map, which GOPers had the good sense to vote against en masse, as some kind of unholy gerrymander. Duh! Bolling is trying to goad the lege into adopting maps produced by Gov. Bob McDonnell’s commission (not gonna happen), but he’s also suggesting that McDonnell could “substitute” the commission’s maps for whatever the legislature passes. I admit I’m not entirely clear on how that would work – a particularly egregious use of the line item veto, or something along those lines? Seems risky.

Of course, all of this is predicated on bipartisan incumbent-protection agreement which includes the federal map as well. But is this deal unraveling? Dem state Sen. Janet Howell, who created the senate map, says she “doubts” her body’s congressional map will match the House’s, which was released just last week (the Janis plan). I’m surprised to hear this, because I thought a clear understanding had been worked out between the two houses, but I suppose there is still some negotiation left to be done over the federal map.

The center part of the I-4 Corridor

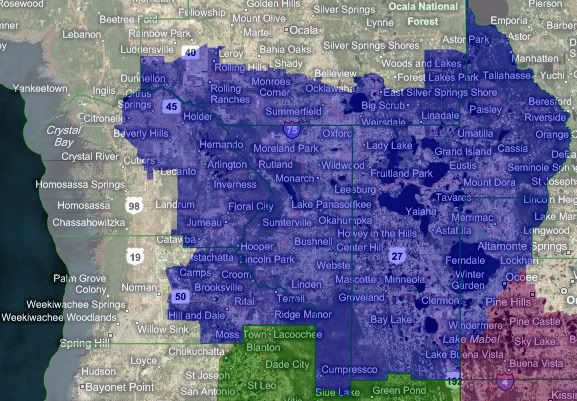
This area is kinda the I-4 corridor. I would say out of the 3 districts I drew which are about 780k people give or take. This is a fast growing area of Florida and this is merely a map that will focus on the communities of interest idea of this area.

Photobucket

Blue is for the elderly and exurban. The center of the district is The Villages|Lady Lake which looks to grow more and more and is very attractive for Republican identifiers all over the country to move to. This district if it were to be made smaller would likely remove the Lake County portion that would be more of a Daytona exurb. And some parts of Marion county that are not near The Villages into a district that would go to Gainesville or Tallahasse.

I used to live in Citrus county which is in the north and western portion of the district, the county is divided in half, using the potential extension of the Suncoast Parkway as a border. This district is very much a transition from North Florida into the I-4 corridor. I should mention that in modern Florida the plotting of major road corridors are for growth purposes by developers who run the show in this area. This blue district is quite Republican and save for the areas near Orlando it is nearly all red.

It should be noted that the growth here is in the 50+ population and perchance minority populations along State Road 50 for work in Orlando. If this district was to be split up even further the Black voters in western Orange county would probably prefer to be in the purple district; pushing that one further Democratic.

Counties: parts of Citrus, Marion, Hernando, Orange, and all of Lake and Sumter

Partisan rating: Likely Republican for awhile

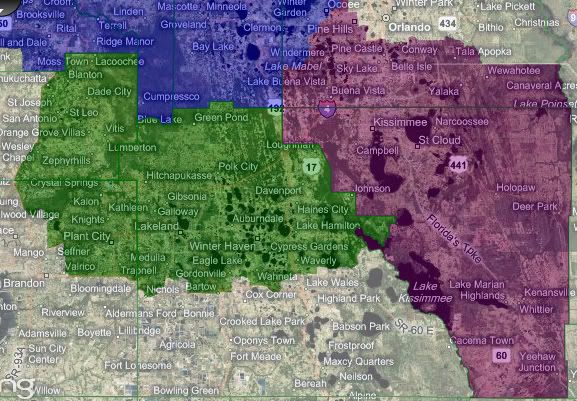
Photobucket

Green is for the suburbanite. The center of this district is the center-right Lakeland, a city between the sprawling cities of Orlando and Tampa which in turn could make Lakeland similar to Tacoma, Washington many years down the road (Think Seattle and Olympia with Tacoma in between). The area is southern for the most part in this area and middle class.

There are areas that are well to do but down the road there is going to be a large Hispanic plurality in some communities due to farm workers. One only has to drive I-4 to see why I drew this district into Hillsborough, once it his I-75 you see the tall buildings of downtown Tampa and though Plant City appears to be a Tampa suburb it is more similar to Lakeland and Polk county in appearance as well as proximity.

Counties: part of Pasco, Hillsborough and most of Polk

Partisan rating: Lean Republican, but tossup in 10 years

Purple is for Mickey. This district is just South Orlando with all its Theme Parks and its suburbs, it is a majority minority district with Whites having the VAP plurality and Hispanics having the plurality when it comes to the population as a whole. The area is very likely to elect a Democrat. The populations in Osceola county are either Farmers (low in number but Republican), Rich Whites (who occupy the planned communities adjacent to Disney and Universal), and Minorities who very much can bring this district home for Democrats.

Counties: Orange and Osceola

Partisan rating: Lean to Likely Democrat

I felt like putting this up for all to see since I have seen some diaries that split these areas up. Mind you I do not expect everyone to conform to what I think; but I am offering this as a guide for those interested in communities of interest in the I-4 corridor. This is absent actual partisan data but just an assumption on my part as someone who has spent a great part of the past few years traveling around this area.

If wanted, I would love to post a Tampa Bay and Orlando-Daytona maps finishing the I-4 corridor for reference.

By what margin will Bob Shamansky win?

View Results

Loading ... Loading ...

HI-Sen: Ed Case Gets In

I had really hoped we were done with this guy:

Former Democratic Rep. Ed Case, who finished third in last year’s special House election, announced his candidacy for U.S. Senate in Hawaii Sunday, releasing a video to supporters.

“I’m running for the Senate because I believe we can and must do better, and that our Hawaii offers a better way forward for our country,” he says in his announcement video. …

Case becomes the first official entrant into the state’s first open seat Senate contest since 1990.

Case is in fact coming off two straight losses, plus an embarrassing yank on the rip-cord. In 2006, he united the Hawaii political establishment against him when he challenged now-retiring Sen. Dan Akaka in the Democratic primary, losing 54-45. He then tried to stage a comeback last year, as Dave Catanese notes, splitting the vote with Colleen Hanabusa in a 1st CD special election prompted by now-Gov. Neil Abercrombie’s resignation. This allowed Republican Charles Djou to win with just 39% – despite an arrogant attempt by the DCCC to intervene on Case’s behalf. (The D-Trip insisted, without evidence, that Hanabusa was unelectable – even though the entire establishment was once again united against Case.) After the special, Case said he’d challenge Hanabusa in the Dem primary for the regular election last November, but dropped out just days later, probably realizing he’d get smoked in the primary. As a final coda, Hanabusa beat Djou in the general, showing just how misguided the DCCC’s interference was.

As I say, I would have thought this track record would have been enough to put an end to Case’s political ambitions, but ambition is what defines Ed Case – ambition, and douchiness. Case is truly a Dem in the DLC mold. Most notoriously, when he was running for Congress in 2002, he said he would have voted for the Iraq war resolution – and as late as 2006, he voted (and spoke) in favor of an open-ended military commitment in that country. He’s also been a regular supporter of anti-progressive legislation like the bankruptcy bill and the PATRIOT Act. In short, Hawaii can – and should – do a lot better than Ed Case. Indeed, his recent track record at the polls shows that Hawaiians already know this.

But I’m a bit concerned, because Case has been making amends with the other Dan – Sen. Dan Inouye, the dean of Hawaii politics. Case says he called Inouye last month to “apologize,” though exactly what he was apologizing for wasn’t clear. (Inouye took Case’s run against his buddy Akaka quite personally, it seemed.) And after Case dropped out of the HI-01 race last year, Inouye termed him a “real Democrat,” though I remain convinced Case bailed in order to avoid a third straight defeat, not because he was being a team player. So Case might no longer be the outcase he once was. Fortunately, Dems have quite a strong progressive bench in the state, so I’m hopeful someone like 2nd CD Rep. Mazie Hirono will step in and mop the floor with Case – soon.

CA :: Cook Uncooked, Part Deux

The latest release of the Political Data Inc.  redistricting package allows us to look at the 2010 election results by contest.  So, using the congressional results from last election cycle I was able to construct election results as if the Cook plan had been implemented.

An obvious caveat is that these elections never happened.  Incumbents who had an easy ride in the existing lines would be fighting a different battle.  But it’s also true that the challengers – many of which were unimpressive and unfunded – would be cut from a different mold in a newly competitive seat.

Cook Uncooked Part Deux