Illinois Downstate

So, I’ve decided to post the following partial map of Illinois just to get some opinions on how viable this seems.

My primary goal so far has been to create three Democratic districts in downstate Illinois. By my calculation, the IL-12, IL-15, and IL-17 districts on this map are each 53% Kerry districts. That means that the Democratic performance of IL-12 and IL-17 has been nudged up (they were 52% and 51% Kerry respectively) and a new, equally Democratic mid-cities district has been created (the orange IL-15 district).

Drawing three Democratic districts outside Chicagoland is obviously one lynchpin to a 14-4 Illinois map.

Meanwhile, I’m unsure when I’ll get the chance to work on Chicago & the collar counties some more (I’ve actually drawn them out in part, but I removed it from this map). My main priority has been collecting the Obama/McCain data for the entire state so that it can be uploaded to Dave’s App. I expect to have that done by the end of the upcoming week.

Note that the green districts on this map (IL-11 & IL-16) are just partially drawn. They are meant to ultimately be two of four GOP votesinks, the others being the yellow & tan districts on this map.

So, please give me feedback! Maybe it’ll inspire me to finish my map. 🙂

Apportioning the US Senate: A Weekend Fantasia

This diary explores the following alternate reality: What if the US Senate was apportioned like the US House? One hundred members, single-member districts, distributed just like House seats (ie, every state gets one seat and then the rest are apportioned using the rule of equal proportions.)

Using 2010 data, the map would look like this:
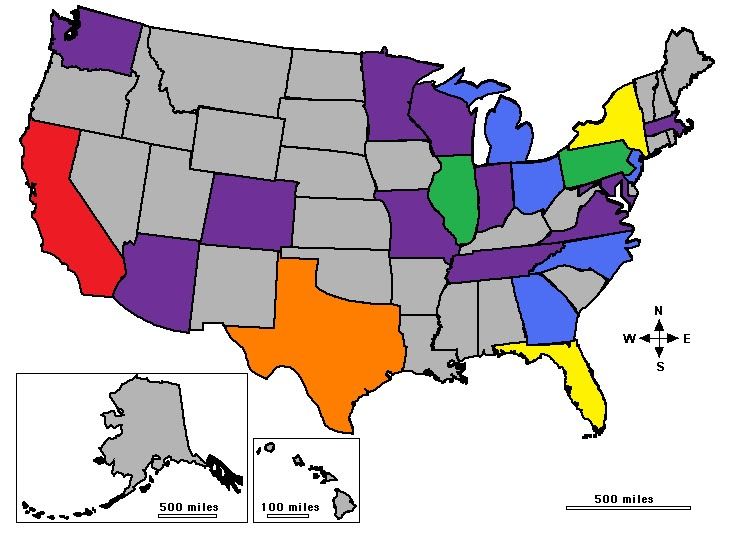
California, in red, would have 10 seats. Texas, in orange, would have 7. New York and Florida, in yellow, would have 5. Illinois and Pennsylvania, in green, would have 4. Georgia, North Carolina, Ohio, New Jersey, and Michigan – all in blue – would have 3. Eleven other states, in purple, would have their current 2. And the remaining twenty-eight states, in grey, would be down to 1.

Two seats would have moved as a result of the 2010 Senate reapportionment, with Texas and Colorado gaining at the expense of Ohio and New York.

(Figures are from the Census Bureau. Since we’re doing this just like the House, all you have to do is look at the House priority lists and cut it off at 100 instead of 435. See here for the 2010 data and here for the 2000 data.)

After the jump, I have maps for the 22 states that would have more than one senator in this alternate universe. Please feel free to post your own.

I’d also be very interested to hear who you all think would be in the senate in this alternate universe. I’m having a hard time figuring out how the one-third-at-time-up-for-election rule would work in a reapportioned body, so perhaps in the alternate universe, senators have four year terms and are elected at presidential midterm? That’s not a fixed rule for this hypothetical, just a guess.

Notes: The presentation of maps for states with more than one senator is sorted according to number of senators, then alphabetically. There’s a brief round up of the one-senator states at then end.

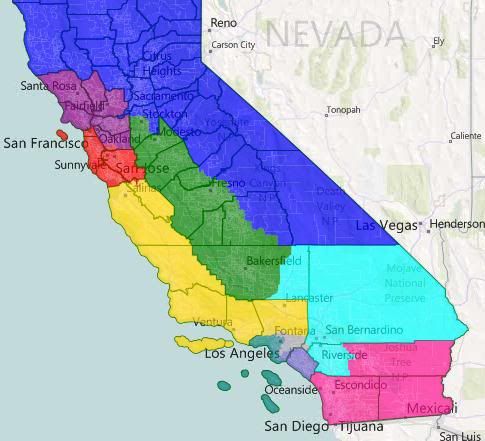
I’ve used the default colors throughout, so blue = CD-1, green = CD-2 purple = CD-3, red = CD-4, yellow = CD-5, teal = CD-6, grey = CD-7, slate blue = CD-8, cyan = CD-9 and pink = CD-10.

I’ve assumed that a compactionist ethic would be at play, and that minority opportunity districts would be favored, even if they’re not 50%+. Obviously, that’s another part of the alternate universe.

States with 3 or more senators

AKA those disadvantaged by the current system

California


Overview


LA Detail

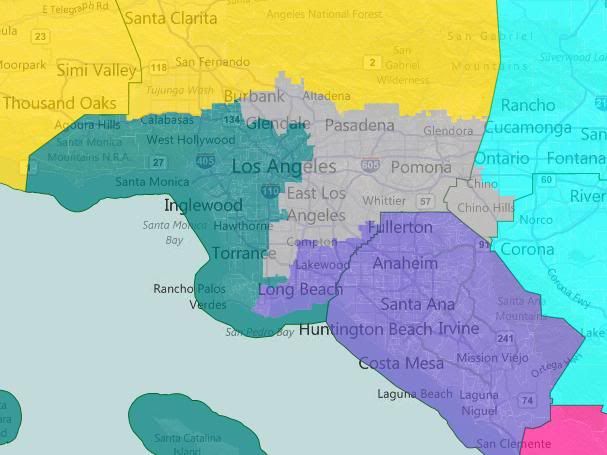
California has ten districts: (CD-1) North CA/Sacramento/Sierra Nevada, (CD-2) Central Valley, (CD-3) North Bay, (CD-4) South Bay, (CD-5) Central Coast, (CD-6) East LA County, (CD-7) West LA County, (CD-8) Orange County/Long Beach,

(CD-9) Inland Empire, and (CD-10) San Diego/Salton Sea.

CD-1 is the only one that’s majority-white by total population. CD-2, CD-5, CD-6, and CD-9 are plurality Hispanic. CD-07 is majority Hispanic.

My guess is that CD-3, CD-4, CD-6, and CD-7 would be safe Democratic, with the rest being some form of competitive (ie, between lean Dem and lean Rep). Say for the sake of argument that we would be holding two of them right now. That starts our running total at 6 D – 4 R.

Note: the voting block shapes for CA can be pretty large right now in Dave’s App. CD-6 is about 50k under populated with CD-07 about 50k over populated. If I swap the LA proper parts of CD-8 back to CD-6, that swaps to CD-8 being 30k under and CD-6 being 30k over. So, about half of that southern part of LA proper needs to go back to CD-6. For a fictional scenario, I figure this was an ok kludge.

Texas
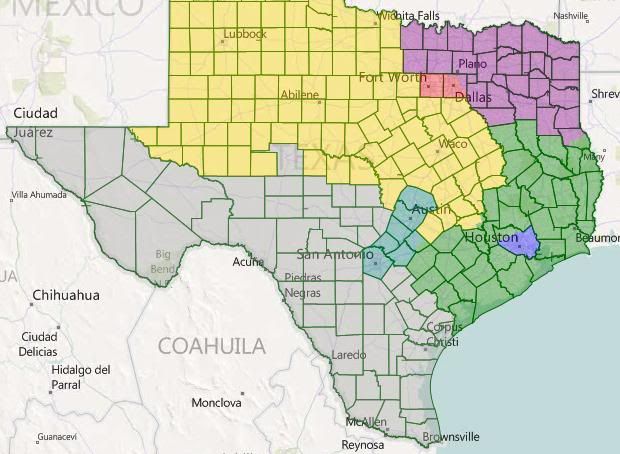
Texas has seven seats: (CD-1) Harris, (CD-2)Southeast Texas, (CD-3) Northeast Texas, (CD-4) Metroplex, (CD-5) North and Central Texas, (CD-6) San Antonio/Austin, and (CD-7) South Texas.

CD-7, of course, is heavily Hispanic. CD-1 is plurality Hispanic, and CD-4 and CD-6 are only plurality white.

I would think that CD-1 and CD-6 are easy gets for us, with CD-4 and CD-7 leaning our way. The other three are ubersafe for the GOP. Running total: Dem 10, Rep 7.

Florida
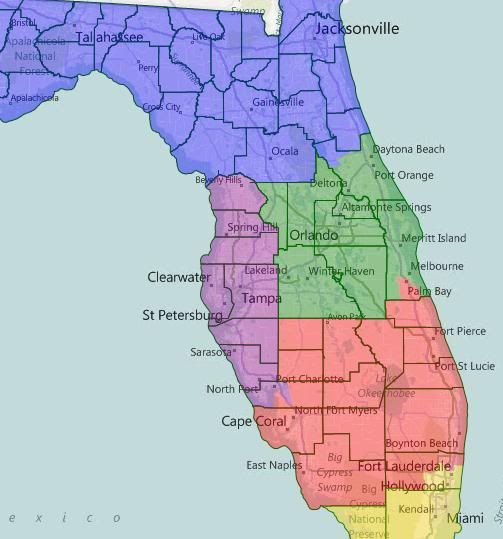
Five districts: CD-01 North Florida, CD-02 North Central Florida, CD-03 West Central Florida, CD-04 South Central Florida, CD-05 South Florida.

CD-05 is majority Hispanic, the rest majority white.

I’d like to think that these are all at least potentially competitive, but I’m going to be conservative here and say that we only hold one of these (Nelson in Orlando?). Running total: Dem 11, Rep 11.

New York
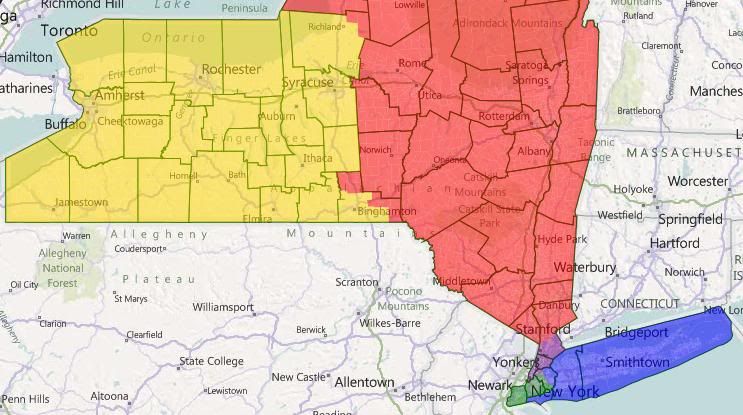


Overview
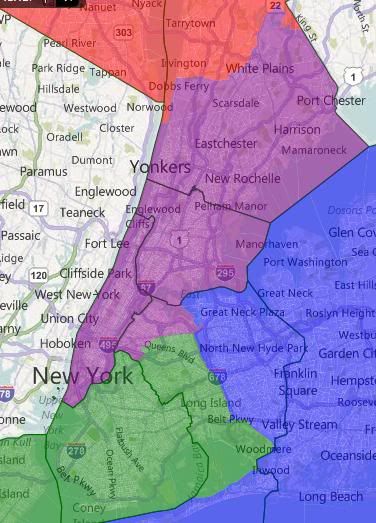


NYC Detail

Five districts: CD-01 Suffolk/Nassau/NW Queens, CD-02 Brooklyn/Staten Island/South Queens, CD-03 Manhatten/Bronx/Northwest Queens/South Westchester, CD-04 East Upstate, CD-05 West Upstate.

I forgot to save this map, so I don’t have racial stats. CD-02 and CD-03 were majority minority, I think.

Partisan breakdown here depends on whether 2010 factors into the equation. In a normal environment, I think CD-04 is the only truly vulnerable district, but we’ll spot the GOP CD-05 as well. Running total: Dem 14, Rep 13.

Illinois
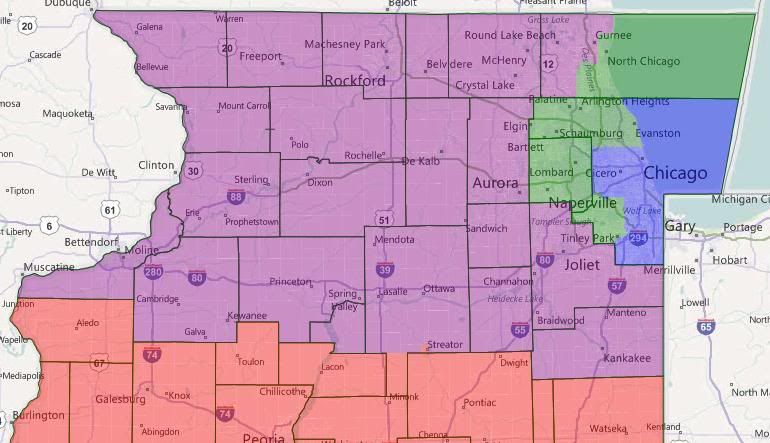
CD-01 Chicago, CD-02 Suburban Chicago, CD-03 Northern Illinois, CD-04 Southern Illinois. CD-01 is plurality black at 35% or so. The rest majority white. I’m going to call this a 2-2 split, so running total: Dem 16, Rep 15.

Pennsylvania
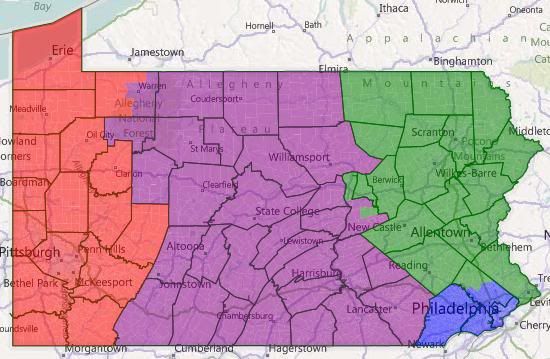
CD-01 Philadelphia, CD-02 Northeast PA, CD-03 Central Pa, CD-04 West PA. All majority white. I’m going to call this one a 2-2 split also, so running total Dem 18, Rep 17.

Georgia
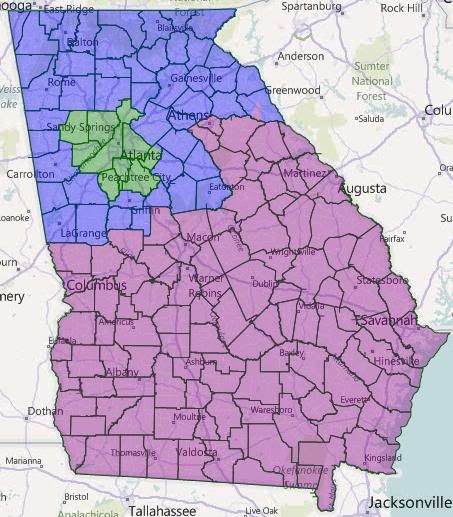
Three districts: CD-01 North Georgia, CD-02 Atlanta, CD-03 South Georgia.

Atlanta is plurality white and about 40% black, the rest are majority white.

I assume we’d take Atlanta and Republicans would get the other two. Running total: Dem 19, GOP 19.

Michigan
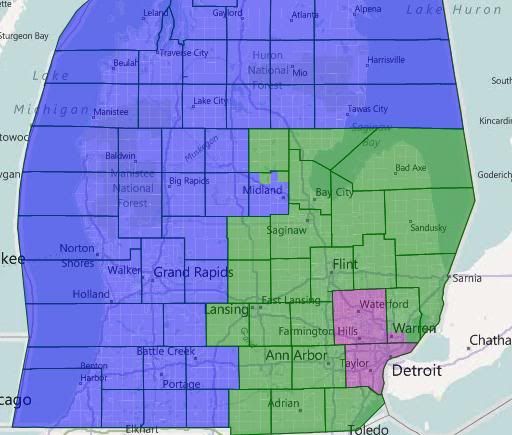
Three districts: CD-01 North and West Michigan, CD-02 Southeast Michigan, CD-03 Wayne/Oakland/South Macomb.

Looks like I forgot to save this map too. I’m pretty sure they’re all majority white.

CD-02 and CD-03 are safe Democratic (and would probably be represented by Stabenow and Levin, respectively.) CD-01 is likely Republican. Running total: Dem 21, GOP 20.

New Jersey
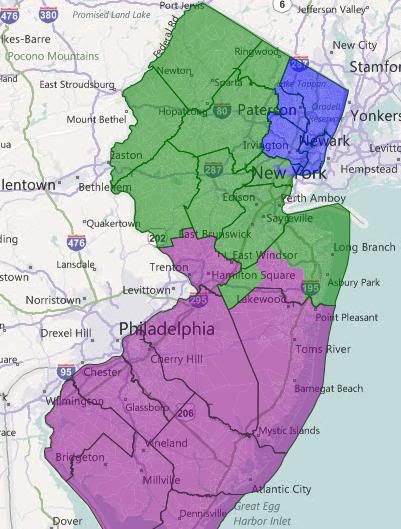
Three districts: CD-01 Greater Newark, CD-02 North Jersey, CD-03 South Jersey.

CD-01 is white plurality, the other two white majority.

I know a lot of Democratic strength is locked-up in CD-01, but we’d still be likely to hold at least two of these, right? Running total: Dem 23, GOP 21.

North Carolina
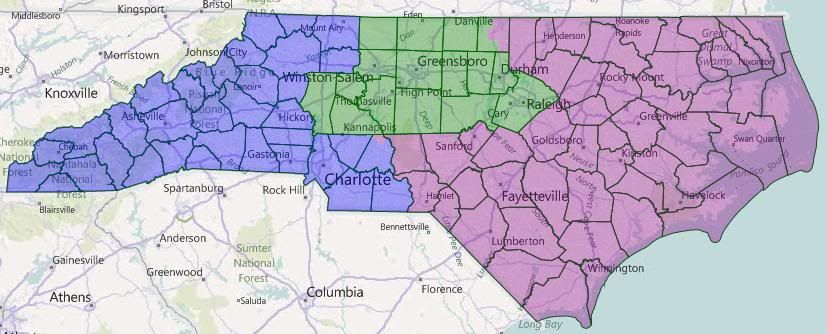
CD-01 Charlotte/West Carolina – Likely Republican?

CD-02 Triangle and Triad – Likely Dem

CD-03 East Carolina – Toss-up?

All are majority white; CD-03 has the highest black percentage at 27%. I’m going to give us a Blue Dog-ish Dem in the east, so running total: Dem 25, Rep 22.

Ohio
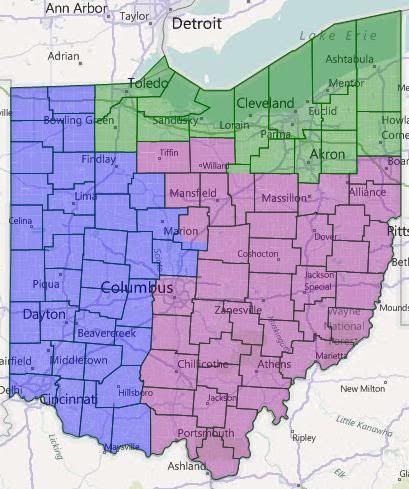
CD-01 West Ohio, Likely R

CD-02 North Ohio, Safe D

CD-03 Central and SE Ohio, Tossup?

All majority white. I’ll throw the R’s a bone here and call the running total: Dem 26, Rep 24.

Note that these eleven states account for half the senators in the alternate universe.

States with Two Senators

AKA the status quo

No geographic breakdowns anymore, I’m too tired. Remember, Blue = 1 and Green = 2.

Arizona
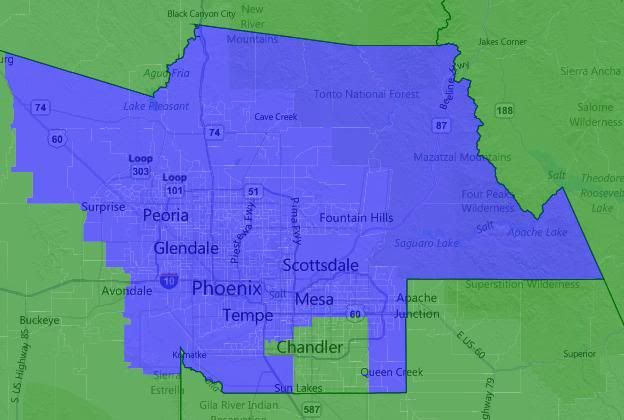
Both majority white at 58%. I have no idea if splitting Arizona between Maricopa and outstate helps us. I’ll assume not. Running total: Dem 26, Rep 26.

Colorado
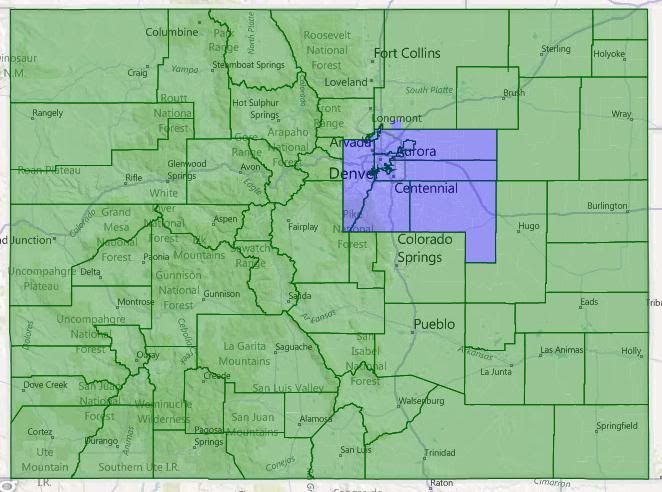
I assume that cutting out Denver is bad for us. Running total: Dem 27, Rep 27.

Indiana
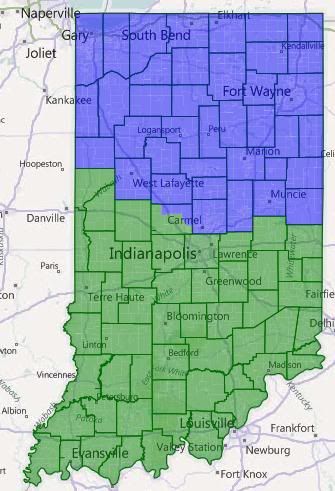
I could see both of these being competitive under the right circumstances. I’m going to give us the northern one. Running total: Dem 28, Rep 28.

Maryland
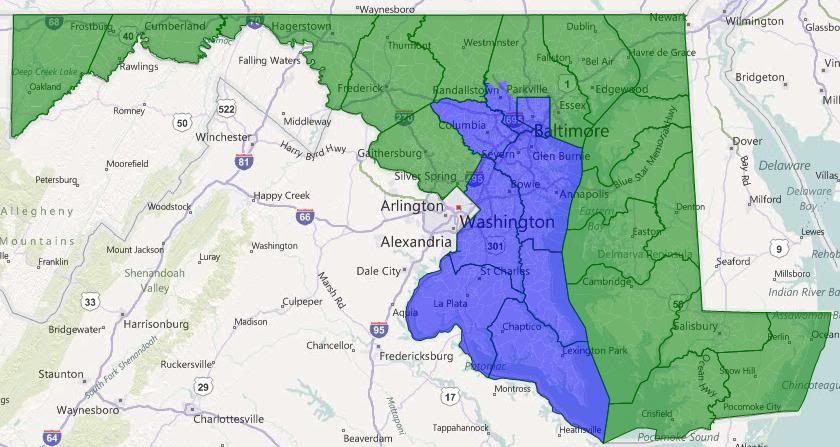
CD-01 is plurality black at 45%; this makes the other district more competitive than it ought to be. I still think we take both. Running total: Dem 30, Rep 28.

Massachusetts
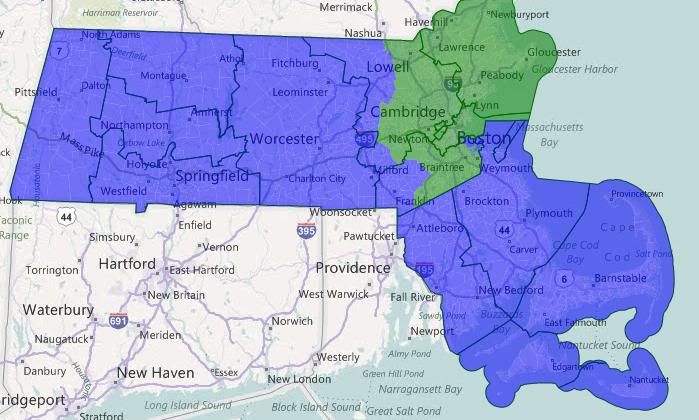
Let’s go ahead and assume Scott Brown. Running total: Dem 31, Rep 29.

Missouri
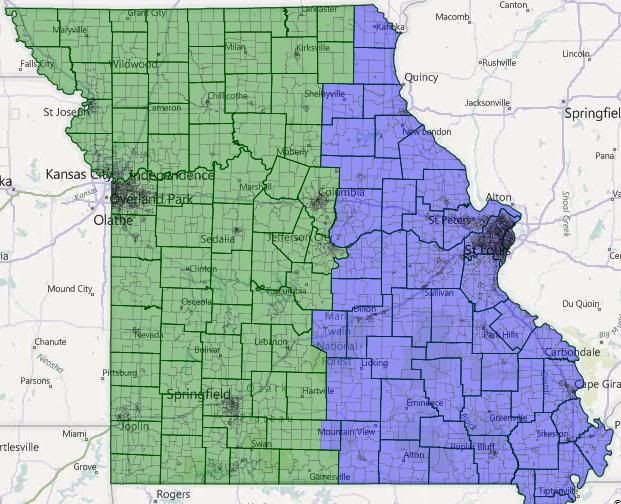
No idea what the ramifications of splitting Missouri are. I’m calling it split. Running total: Dem 32, Rep 30.

Minnesota
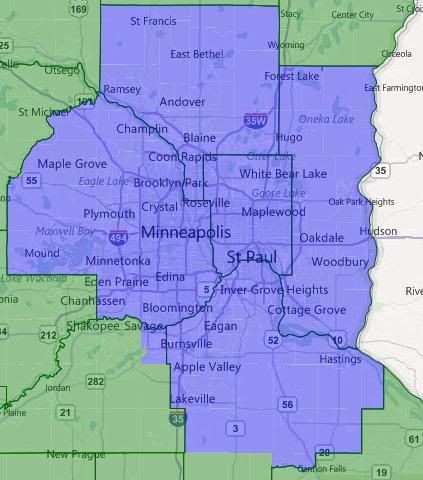
I assume we can hold both of these? Running total: Dem 34, Rep 30.

Tennesee

CD-01 is safe GOP. I could see us competing in CD-02. But running total: Dem 34, Rep 32.

Virginia
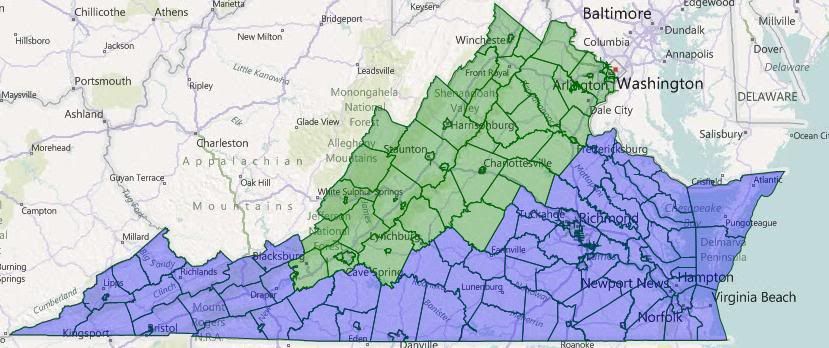
I’m not happy with this division, but everything else looked worse. Both districts should still be winnable for us, so running total: Dem 36, Rep 32.

Washington
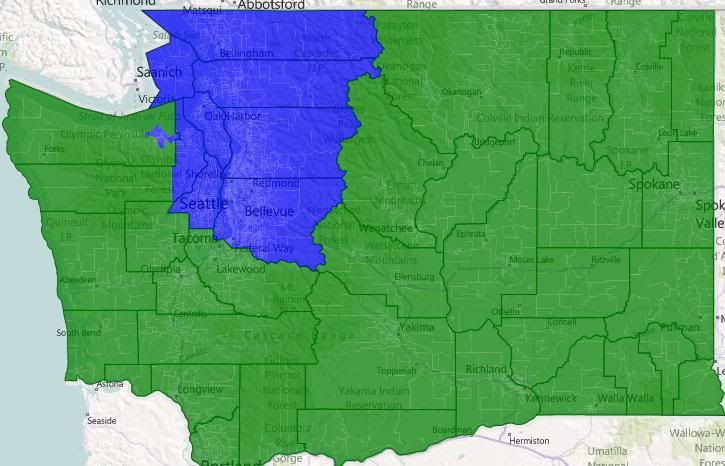
Probably the state where the split harms us most, unless Tacoma and Olympia can outweigh the rest of the state. I’m calling it split, so running total: Dem 37, Rep 33.

Wisconsin
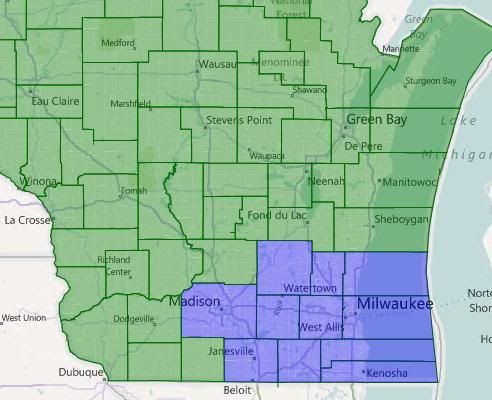
Madison and Milwaukee versus the Circle of Ignorance! The rest of Wisconsin looks on… I’m giving us both, so running total Dem 39, Rep 33.

The Single Senator States

AKA The unfairly advantaged

The remaining 28 states currently have almost enough votes to sustain a filibuster; in the alternate universe, they don’t even have enough to block one.

Northeast

I’d give us Delaware, Vermont, Connecticut, and Rhode Island. Maine and New Hampshire are probably toss-ups, so I’ll get us one of them. Running total: Dem 44, Rep 34.

South

They get Alabama, Mississippi, Kentucky, Oklahoma, and South Carolina. We get West Virginia. And I’ll split Arkansas and Louisiana. Running total: Dem 46, Rep 40.

Midwest

They get Kansas. I’ll split Iowa, Nebraska, and the Dakotas. Running total: Dem 48, Rep 43.

West

We get Oregon, New Mexico, Hawaii and Montana. They get Wyoming, Idaho, and Utah. That leaves splitting Nevada and Alaska. Final total: Dem 53, Rep 47.

Conclusion

Ok, that’s bizarre. I totally didn’t set out to end up where we actually are, it’s just where my guesses lead. Even if my take on this particular exercise didn’t show any partisan bias to the set-up of the Senate, it does highlight just how undemocratic that body is.

Again, please feel free to chime in about who you think would be in office in the alternate universe or to show off your (more gerrymandered?) versions of the alternate universe’s Senate districts.

Louisiana with 2 “VRA” districts?

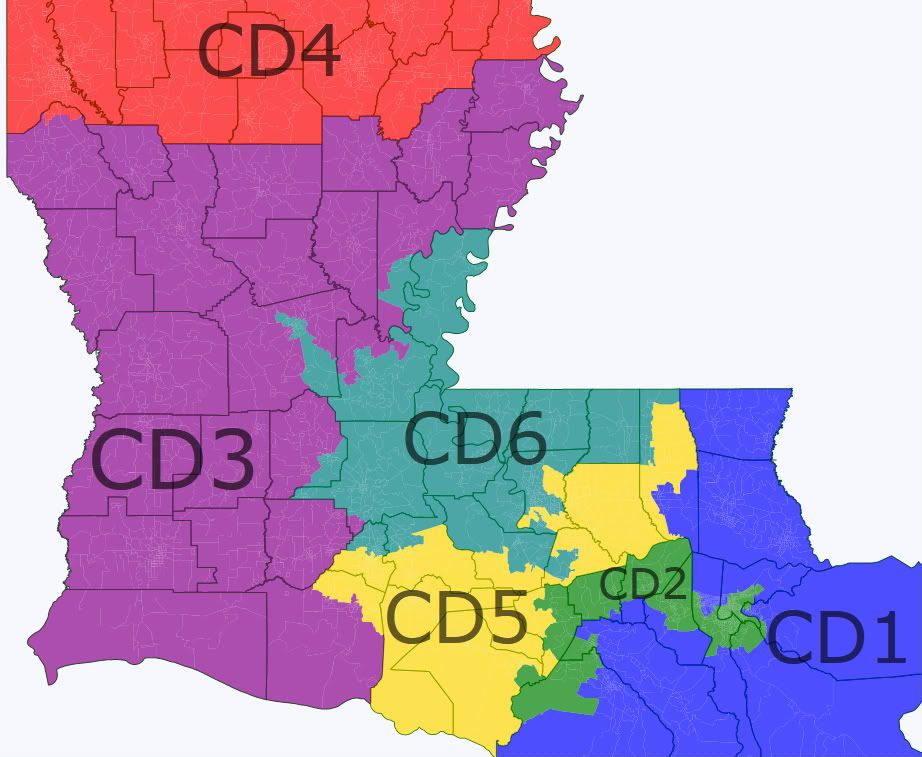
A few days ago in the discussion of the proposed Louisiana map someone drew a map with two majority-black districts but nothing else filled in. I drew this map to see (a) if I could get the New Orleans district to be more compact and (b) what the other districts would look like. As it turns out, the answer to (a) is yes, but it’s plurality black as opposed to majority black, and the answer to (b) is ugly.

Here’s the map.

louisiana

In district descriptions, the percentages are for voting age population. w is non-Hispanic white, b is black, h is Hispanic, and a is Asian.

LA1 (blue): 77.6w-12.3b-6.0h-1.7a. Still mostly a suburban New Orleans seat, but it was forced to move into the Thibodaux-Houma area by the positions of the VRA districts. Safe R.

LA2 (green): 41.7w-46.5b-7.3h-3.0a. Because of the depopulation of New Orleans, this district has to extend west and then south to pick up some heavily black areas. Probably likely D to safe D, as it’s still 58% minority and its white population is probably relatively moderate compared to the rest of the state. While less compact than a typical district, it’s far more compact than either its current or proposed versions.

LA3 (purple): 74.0w-20.7b-2.4h-0.9a. Ugh. It’s geographically impossible for it to take all of Cajun country, so it has to extend much further north. It wasn’t possible for it to take everything along the west side of the state up to and including Shreveport so I had to take it practically to the northeast corner of the state to avoid splitting up the Shreveport area. The result is a sprawling, incoherent mess that takes up maybe 40% of the state’s land area. Safe R.

LA4 (red): 59.8w-35.6b-2.4h-1.0a. The one clean district, the I-20 district. Likely R.

LA5 (yellow): 79.6w-13.9b-3.5h-1.7a. This ugly district with nodes in Baton Rouge and Cajun country connected by a narrow strip was necessary because the two VRA districts pass so close to each other. Safe R.

LA6 (teal): 44.6w-50.2b-2.6h-1.3a. The Baton Rouge-based majority-black district is nice and compact, but it has some community-of-interest issues as it takes pieces of Lafayette, Ville Platte, and Alexandria in addition to part of the capital city. Probably close to safe D even though it’s likely only D+6 or so: it looks like it would be easy for a Republican to get to 40% but nearly impossible to get over the hump. Compare it to Sanford Bishop’s current district, which is probably about as polarized as this LA6 would be but has black-white percentages that are basically the reverse of what this district has. It’s D+1.

I’m pretty sure that a court would accept this proposed LA6 if the state submitted it, as courts have accepted some really ugly and incoherent districts.  But here’s the question: would a court compel a state to draw something like the proposed LA6–which looks ok but slices and dices some widely separated cities–if the state isn’t inclined to draw it in the first place? Perhaps someone with a better understanding of the VRA can weigh in on this. Thoughts?

By what margin will Bob Shamansky win?

View Results

Loading ... Loading ...

IA-04: Christie Vilsack May Challenge King

This report from Nathan Gonzales is pretty interesting — and surprising:

Former Iowa First Lady Christie Vilsack (D) is likely to take on Cong. Steve King (R) in Iowa’s new 4th Congressional District, according to a Democratic source in the Hawkeye State. Vilsack, however, has not yet made a final decision.

Vilsack hails from Mount Pleasant, which is right in the heart of the new second district, where she was rumored to be interested in running for Congress. But with Loebsack staking his claim in the 2nd CD, it looks like she’s trying to avoid yet another tragic incident of Sack-on-Sack violence by exploring other options.

The 4th CD, as it stands today, is pretty tough territory: Obama lost it by 44-54, and Kerry got stomped by 39-60 back in 2004. Under the proposed lines, however, it’s now a district that Obama lost by only 48-50, and even John “Who Among Us Does Not Love NASCAR?” Kerry held down 44% under these lines. In short, that’s still tough terrain for a Democrat, but it’s significantly more fertile than before; with King’s penchant for letting his freak flag fly and a credible opponent working against him, this could be an interesting race.

WI Sup. Ct.: Prosser Declared Winner

Via the Milwaukee Journal Sentinel:

State Supreme Court Justice David Prosser emerged as the winner Friday over challenger JoAnne Kloppenburg in a heated election that drew national attention because of the fight over collective bargaining and a ballot reporting error in Waukesha County, following initial results that showed Kloppenburg leading the race.

A canvass of vote totals from the state’s 72 counties finalized Friday afternoon shows Prosser beating Kloppenburg, an assistant attorney general, by 7,316 votes. The final canvass of the April 5 vote was completed 10 days after the election, the maximum allowed by state law.

The margin – 0.488% – is within the 0.5% limit that would allow Kloppenburg to request a statewide recount at taxpayers’ expense.

Following the announcement, Prosser declared victory, but Kloppenburg did not concede. She has until Wednesday to request a recount, though obviously with a margin this wide, such an effort would almost certainly not change the outcome.

Also worth checking out is this analysis from the Brennan Center, which shows that conservative groups spent $2.22 million on the race, compared to $1.37 million from the lone progressive group, the Greater Wisconsin Committee. (For some reason, the Journal Sentinel calls the former figure “37% more” than the latter, but they simply have it backwards – the GWC spent 37% less than the conservative groups, which is still a pretty misleading way of putting, since the right-wing orgs spent over half-again as much as our side did.)

MI-Sen: Pete Hoekstra Won’t Run

I can’t say I’m terribly surprised:

Former U.S. Rep. Pete Hoekstra said today he won’t challenge Sen. Debbie Stabenow next year for her U.S. Senate seat.

“After serious consideration and many discussions with friends and supporters, Diane and I have made the decision that I will not be a candidate for the United States Senate in 2012,” Hoekstra said in a morning email to supporters. “We agreed that it was not in the best interest of our family at this time to enter the race.”

I guess this congressman from Michigan’s finally gonna go back home and build that turtle fence. In his honor, I have to post it one final time:

The Republicans don’t have a lot of good potential candidates waiting in the wings (not that Hoekstra was particularly great shakes). Of course, at this time last year, we were taking a lot of comfort in facts like that – but then absolute nobodies like Ron Johnson in Wisconsin went on to post wins. So while I don’t expect 2012 to wind up like 2010, recent events definitely inspire me to be more cautious when writing off Republican chances due to ostensibly poor benches. After all, at this point in 2009, I didn’t expect 2010 to wind up like 2010, either.

Home Means Nevada: Redistricting Congress “Fairly”

(Also at Nevada Progressive)

In our previous glimpses into redistricting Nevada’s Congressional Districts, we discussed what would happen if The Legislature redraws the lines based on certain politicians’ future aspirations. But this time, I’m throwing a curveball at you. What happens if The Legislature can’t agree on a map?

Today, the fun really begins with a glimpse of a possible court drawn map.

Yes, you heard me right. Two law suits have already been filed, one by the Nevada Democratic Party and another by the Nevada GOP, and more legal action may follow if The Legislature drags on without a map ready for 2012. If the increasingly brutal state budget battle drags on to Summer Special Session with no agreement in sight, there’s a good chance the gridlock will also extend to redistricting. And as much as Nevada Supreme Court justices do NOT want to wade into redistricting, I’ve been hearing that both they and the major parties are seeing it as more of a real possibility.

So what happens? Let’s take a look at just that, as a few angry judges throw out the political memos and guide a nonpartisan team to draw “fair” lines.

Share photos on twitter with Twitpic

Share photos on twitter with Twitpic

NV-02 (The Dark Green District)

Population: 674,932

69.3% White (73.7% VAP)

The State of Play

As you can see above, this is still a Washoe County based district. The good news for Republicans is that Washoe’s flirtations with Democrats can be offset by heavily Republican rural areas like Elko, Douglas, and Lyon Counties. However, the bad news is that swingy Mineral County and Carson City are also included. All in all, The 2nd District becomes slightly more Democratic.

Who’s All In?

Now that Kirk Lippold and Sharron Angle are officially in, let the tea-nuttery begin! It will be to fun to see those two out-crazy each other, then watch as “poor” Mark Amodei and Brian Krolicki try to get some of those teabagger votes without going too far off the deep end.

On the Democratic side, State Treasurer Kate Marshall is sounding more and more like a real candidate.

The Wild Cards

However, Marshall may not be alone. 2006 and 2008 NV-02 Democratic nominee Jill Derby is also looking at the race, along with Assembly Member Debbie Smith (D-Sparks) and Reno City Council Member Jessica Sferrazza. Now that all out madness is ensuing on the GOP side, Washoe Dems are increasingly liking their chances here… But it still won’t be an easy ride. Why? See below.

Estimated 2008 Results: 49-50% Obama (D)

Early Race Rating: Leans Republican for now, Tossup if Angle or Lippold wins the GOP primary

Share photos on twitter with Twitpic

NV-04 (The Purple District)

Population: 675,314

61.9% White (65.2% VAP)

The State of Play

Now here’s where things start to get wild! Notice some changes? For one, it’s the new district that now gets drawn into the rurals. The new 4th District starts in rural Churchill County (Fallon gets placed in NV-02 because it can be argued it shares a community of interest with the other Reno exurbs), but otherwise the other rural counties are left whole as the district stretches from Ely down to Pahrump, then finally to Clark County. And once the district crosses into Clark, it takes in northern rural areas, from Indian Springs to Overton & Mesquite, then drops into the valley to take in the once rapidly expanding Northwest and Southwest Las Vegas suburbs, as well as all of Summerlin and some whiter West Side neighborhoods.

In essence, this is THE classic swing district with a unique mix of rural Republican strongholds, urban Democratic bases, and a whole lot of evenly divided suburban battlegrounds that can very well go either way next year… And that’s how the court will want it.

Who’s All In?

Notice something else? There’s no incumbent here! Even though there technically is one in Shelley Berkley, we all now know what she’s up to. So in her absence, there should be a wild ride on both sides in vying for this seat.

On the Republican side, State Senator Barbara Cegavske‘s (R-Summerlin) wish will finally be fulfilled as she now has an open seat to compete in. But then again, she may get an unwanted surprise if local teabagger groups rally behind the newly crowned, tea-tinged superstar in State Senator Elizabeth Halseth (R-Northwest Vegas). State Assembly Member Scott Hammond (R-Northwest Vegas) may also feel the temptation.

On the Democratic side, Assembly Member Marcus Conklin (D-Northwest Vegas) may be real opportunity here. And considering his gracious concession earlier this month and offer to endorse Chris Giunchigliani for Las Vegas Mayor after 15 votes separated them in the primary, Larry Brown is busy re-earning goodwill that may come in handy should he run for Congress next year. (By the way, in case you were wondering, he’s also apologized for the confusion over his support for SB 283 and domestic partnerships for LGBTQ families.) And unless the Nevada GOP can sideline Cegavske and Halseth in favor of a more mainstream nominee, Dems may very well like their chances here.

The Wild Cards

Hey, isn’t it wild enough already!

Estimated 2008 Results: 51-54% Obama (D)

Early Race Rating: Tossup

Share photos on twitter with Twitpic

NV-01 (The Blue District)

Population: 674,765

47.0% Latino (41.2% VAP), 29.1% White (34.5% VAP), 14.6% African American (14.8% VAP)

The State of Play

Even if Shelley Berkley wasn’t running for Senate, the court would not care where she lives or where she “wants” to represent. But now that she’s definitely out of the picture, all bets are off! The 1st District contracts to just (all of) North Las Vegas and the older, more Latino and African American heavy parts of The City of Las Vegas, as well as a few heavily Latino unincorporated Clark County areas and the northern half of The Strip.

Who’s All In?

State Senate Majority Leader Steven Horsford (D-North Las Vegas) hasn’t done a great job of hiding his desire to head to DC. And thankfully for him, a court drawn map doesn’t prevent that, as this is designed to be a VRA protected minority-majority coalition district.

However, the path isn’t too clear for him. After all, this is a strong Latino plurality district, and State Senator Ruben Kihuen (D-North Las Vegas) is a fierce fighter who’s gaining broader appeal as a strong, progressive voice in The Legislature. Since this district overlaps with nearly all of his current Senate district, Kihuen definitely can’t be counted out.

The Wild Cards

State Senator John Lee (D-North Las Vegas) isn’t stupid, so perhaps he can’t entirely be counted out yet. But as I’ve said before, he’s acting far too conservative this session to really gain traction in a Democratic primary here.

And sorry, Republicans, but there’s really no GOPer who can compete here.

Estimated 2008 Results: 67-68% Obama (D)

Early Race Rating: Safe Democratic

Share photos on twitter with Twitpic

NV-03 (The Red District)

Population: 675,520

56.2% White (60.3% VAP), 23.1% Latino (19.8% VAP), 9.6% Asian American (10.0% VAP)

The State of Play

Now here’s where things get really crazy! Remember, the court is overseeing the drawing of this map. The judges don’t care what Joe Heck wants or who he wants to represent. All they care about are population equity and fair boundaries. So unfortunately for him, he’s forced to accept a Henderson based district that keeps the entire city intact while stretching north into the strongly Democratic East Side (which can be argued shares a community of interest with most of Henderson), and west across The Strip to heavily Democratic Spring Valley (which can be argued shares a community of interest with The East Side, and is needed for population equity), and across Eastern Avenue to Democratic leaning Silverado Ranch.

However, Democrats shouldn’t get too giddy here. Remember, ALL of Henderson is kept in here, including Joe Heck’s own MacDonald Ranch/Roma Hills base as well as the opulent, affulent, & Republican dominant Anthem & Seven Hills communities. Also kept in are more GOP heavy Boulder City, along with the rural communities of Searchlight and Laughlin further south (as well as Primm, added in from NV-02).

Who’s All In?

Obviously, Joe Heck wants another term. However, he will really have to rethink his strategy if The Legislature deadlocks on the state budget and redistricting gets determined in court. Since he’s likely to be kept in what will at least be a Democratic tilting district, he will need far more crossover support than he got in 2010 to survive next year in a district President Obama will probably win by double digits again.

So obviously, Heck looks to be an inviting target for Assembly Speaker John Oceguera (D-Silverado Ranch). He’s survived tough battles before, and he’s in the fight of his life now over the state budget. He may feel ready to take on Heck…

But there’s someone else waiting in the wings, someone who will have waited a year for the rematch she’s been looking for. Dina Titus definitely shouldn’t be counted out, especially since she only barely lost last time… And this time, many of the areas where she performed worst have been removed. Meanwhile, her East Side base is left intact, along with the Green Valley (Henderson) neighborhoods where she beat Heck.

The Wild Cards

Byron Georgiou has quickly turned from welcomed Democratic fundraiser to unwelcome Democratic pariah. Both Shelley Berkley and Harry Reid want him out of the Senate race, and rumors have surfaced about him possibly running for House instead. So will it be here? Or in the new NV-04 seat? Or maybe even NV-01? Whatever the case, a whole lot of Democratic strategists nervously await where Georgiou will land.

And of course, depending on what Joe Heck does, particularly how he votes in The House, there’s a chance of him being called for “tea time” in the GOP primary.

Estimated 2008 Results: 55-57% Obama (D)

Early Race Rating: Tossup for now, Leans Democratic if Heck has primary woes & Dems get a top notch nominee

So there you have it. This is just one scenario of what might happen if redistricting Nevada’s Congressional Districts is tossed to the courts for judges to decide and nonpartisan players to draw. An incumbent is thrown into jeopardy, two open seats lead to total feeding frenzies, and an epic rematch may be coming to doorsteps near me soon.

TX-SBOE Maps

Today in the Texas House, the Committee Substitute to HB 600 was read a 3rd time and passed.

HB 600 redraws the State Board of Education seats.

There has been some talk about increasing the size of the SBOE. It currently has only 15 members which means the ideal population size for the new districts is 1.6 million.

Who cares about some SBOE seats? Considering that Texas is one of the biggest buyers of textbooks (when the state has the money to purchase them), and that these 15 people decide what goes in the textbooks, these 15 seats can have a national impact.

So what did the House finally agree to?

It should be noted that all 15 of these seats will be up in 2012. The year after redistricting all of the members of the State Senate and the State Board of Education run.  They then draw to see who runs in 2 years (i.e. 2014) or 4 years (i.e. 2016)

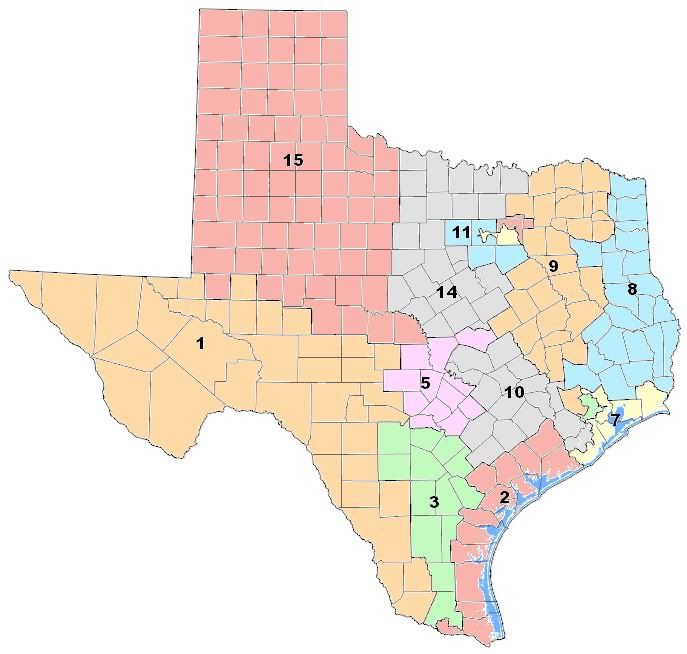
First, here’s a map of the current SBOE districts.

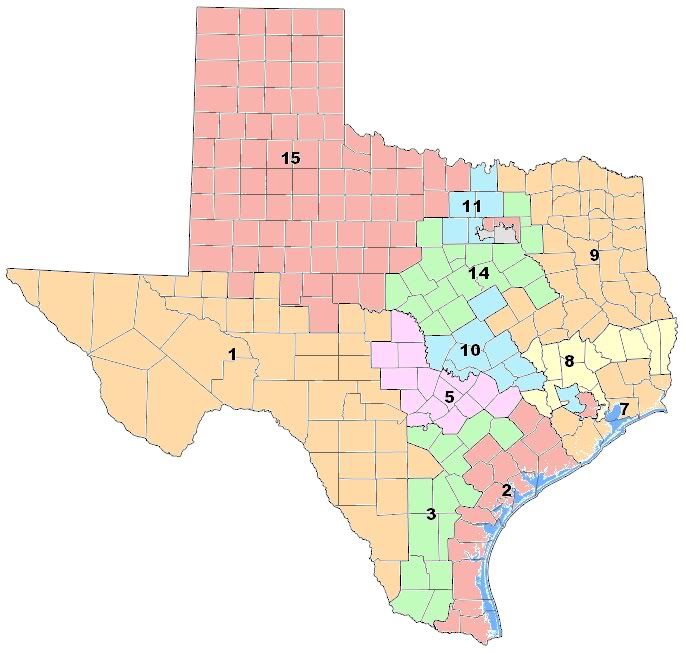
The new districts:

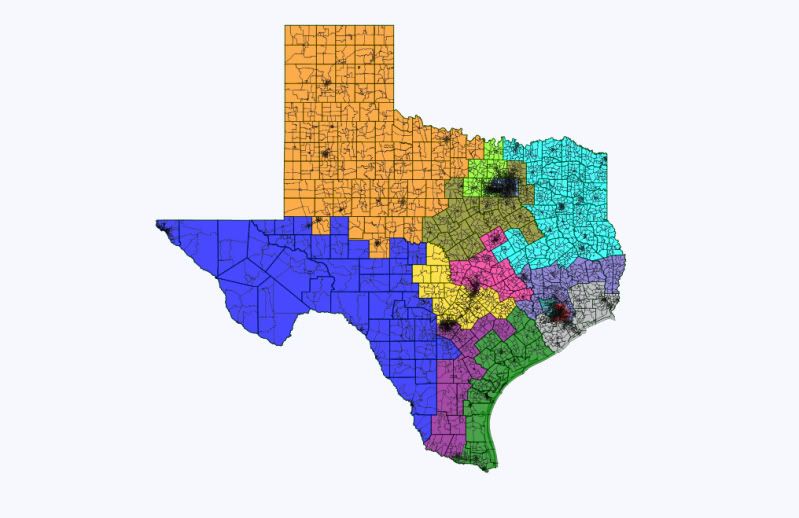
New districts in Dave’s App

These maps are from the state’s redistricting website, but they didn’t provide any partisan data. So I drew them using Dave’s App.

District 1

Lean-Likely D

55% Obama/45% McCain

73% Hispanic, 24% White, 3% Black, 1% Asian

This district is interesting because in 2010 it elected a Republican. The incumbent Democrat may have gotten a little complacent having been elected in 1988 and his only previously close election being in 1994 when he won 53% to 47%. Although with a district that contains both El Paso and Laredo, you have to think you’d be pretty safe as a Hispanic Democrat. Democrats have the chance to recapture this seat in 2012.

District 2

Lean D

52% Obama/47% McCain

69% Hispanic, 27% White, 3% Black, 1% Asian

This district features a longtime incumbent with Democrat Mary Helen Berlanga. She’s been on the board since 1982. That’s long enough to have been elected to the SBOE (in 1982), appointed to the SBOE (in 1984 when the Lege made it an appointed body), and elected again (in 1988 when it went back to an elected body).  In spite of the closeness of this district, Berlanga has managed to solidly win every time.

District 3

Safe D

60% Obama/39% McCain

68% Hispanic, 27% White, 7% Black, 2% Asian

This district pretty much stays safe for a Democrat.

District 4

Light Red (next to District 7)

Safe D

73% Obama/26% McCain

49% Hispanic, 30% Black, 16% White, 5% Asian

Stays a solid Democratic district.

District 5

Yellow

Lean-Likely R

44% Obama/54% McCain

60% White, 31% Hispanic, 6% Black, 4% Asian

This district still takes in heavily Republican areas in north Bexar County. In Bexar County it trades some Republican areas in NE Bexar County (Live Oak, Universal City, Converse, Schertz, and Randolph AFB) for some others (Alamo Heights, Olmos Park, and Terrell Hills). It keeps the Republican counties of Kendall, Comal, and Guadalupe. It only slightly increases its coverage of Travis County. It sheds Bell County which contains Killeen-Temple-Fort Hood.

District 6

Light Blue (below District 8, directly to the left of District 4)

Likely R

41% Obama/58% McCain

48% White, 30% Hispanic, 12% Black, 11% Asian

This district pretty much stays the same, only losing a small slice of Harris County.

District 7

Likely R

41% Obama/58% McCain

54% White, 18% Black, 19% Hispanic, 9% Asian

This district sheds east Harris County and adds 4 new counties. This could be a ripe district for Democrats to target because the new configuration includes Fort Bend County.  This county has been trending Democratic. In 2008, the county went 49% Obama/51% McCain. In 2010 it went 47% Bill White/52% Rick Perry.

District 8

Safe R

65% White, 20% Hispanic, 11% Black, 4% Asian

This district has some changes. Previously it ran up east Texas. It now moves south and becomes more compact.

District 9

Safe R

30% Obama/70% McCain

73% White, 15% Black, 11% Hispanic, 2% Asian

This district takes in a lot of the old 8th.

District 10

Toss Up

49% Obama/49% McCain

61% White, 21% Hispanic, 12% Black, 6% Asian

I never thought I’d be able to write tossup about either a State Senate seat or an SBOE seat. *The 2008 vote totals for this district were 298,091 for Obama and 298,430 for McCain. 339 votes. Democrats may finally be able to win a new seat on the SBOE.  If Judy Jennings wants another crack at this seat, 2012 is the year to do it with the presidential race and Travis County. This district now doesn’t go all the way from Austin to the Houston suburbs.

*Thanks to Greg at Greg’s Opinion for the updated numbers. And thanks to blank for the prodding that got the update.

District 11

Safe R

37% Obama/62% McCain

67% White, 17% Hispanic, 9% Black, 6% Asian

Takes in plenty of Republican areas to still make it safe for Republicans.

District 12

Red (covers northern portion of Dallas County and NE quadrant of Tarrant County)

Likely R

43% Obama/57% McCain

58% White, 21% Hispanic, 12% Black, 8% Asian

Here is another potential opportunity for Democrats. It sheds Rockwall County and a portion of Collin County, while adding a portion of Tarrant County. Thanks to the success of Dallas County Democrats, this district has the potential to be competitive.

District 13

Gray (weird looking district that covers Dallas and Tarrant counties)

Safe D

69% Obama/30% McCain

41% Hispanic, 26% White, 30% Black, 4% Asian

Takes in more of Tarrant County, but continues to be a safe Democratic seat.

District 14

Safe R

32% Obama/67% McCain

71% White, 14% Hispanic, 7% Black, 7% Asian

District 15

Safe R

25% Obama/74% McCain

65% White, 27% Hispanic, 6% Black, 3% Asian

Currently the board is split 4 D – 11 R. If Democrats play their cards right, they could conceivably wind up with a 6 D – 9 R split on the SBOE. Democrats should go for broke and make a serious play for Districts 5, 7, & 12, if only to try and get an idea of what the Democratic performance is like in the new districts.

Populations for districts are VAP from the state.

Virginia Redistricting: McDonnell Vetoes Maps

Not much so far except some tweets, such as:

Gov. McDonnell vetoes redistricting bill, has “significant concerns” that Senate plan may violate state and federal law.

I’m not clear on whether this means McDonnell is sending the legislature back to the drawing board, or whether he plans to substitute in maps of his own. So much for the grand bargain.