PBI (Party Brand Index) Part 6: West Virginia & New Hampshire

PBI or Party Brand Index is a concept I developed (with some much appreciated help from pl515) as a replacement for PVI.  PVI (Partisan Voting Index), which is measured by averaging the percentage of the vote from the last two presidential elections in each house district, and comparing it to the nation as a whole, is a useful shorthand for understanding the liberal v. conservative dynamics of a district. But PVI in my opinion it falls short in a number of areas. First it doesn’t explain states like Arkansas or West Virginia. These states have districts who’s PVIs indicates a Democrat shouldn’t win, yet Democrats (outside of the presidency) win quite handily. Secondly why is this the case in Arkansas but not Oklahoma with similar PVI rated districts?

Lastly PVI can miss trends as it takes 4 years to readjust. The purpose of Party Brand Index is to give a better idea of how a candidate does not relative to how the presidential candidate did, but compared to how their generic PARTY should be expected to perform. I’ve tackled IN, NC, CO, VA, MO, OK, AR, now I will look at the swing states of West Virginia and New Hampshire.

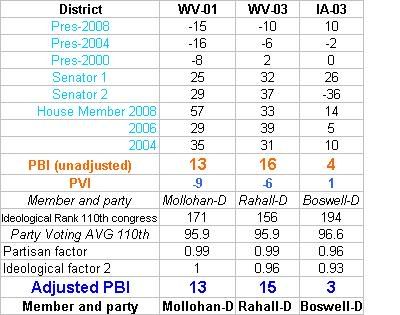
First like always I would like to post the data, then I will offer some analysis. My basic pattern is to work my way “out” from the “Purple States” to the more Blue and Red ones. Once in a while I like to skip my normal pattern of working out from purple states.  I’m often curious on how my model would work in states like that are deeply blue at the local level, but deeply red at the presidential level. I will offer a refresher on them later. But first let’s examine the swings state of New Hampshire and the “split” state of West Virginia.

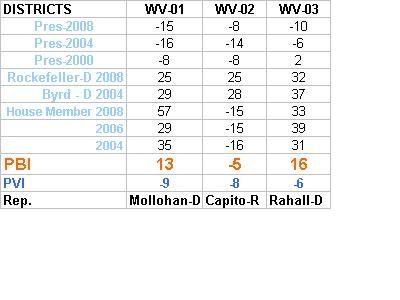
WEST VIRGINIA

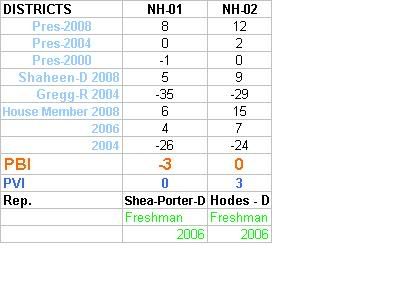
NEW HAMPSHIRE

Although PBI shows some level of pessimism for Carol Shea-Porter in the NH 1st, the trend in her district is truly astounding. From -26% to a +6% Democratic in 2 election cycles. Also during that time NH has seen a 5% rise in the percentage of the electorate that calls itself liberal (conservatives fell 2%) and the party split went from 32:25 Republican to 29:27 Democrat. Although this district isn’t completely safe the trend is good for Team Blue. She is still the top GOP target in the New England.

After I come across a few “conservative” Democrats, I run a “correction” factor to account for them being Blue dogs. The general idea is that the distance they are able to maintain from the national party may help them win over voters who are more reluctant to vote for Democrats. Interestingly enough both West Virginian Democratic Reps despite coming from a Red, Socially conservative state are not members of the Blue Dog caucus. I never the less ran there data to see how my model would respond. I actually was surprised where they fell on the partisan and ideological scale. As I explained a few diaries ago I will use ADJUSTMENT FACTOR 2 in all subsequent corrections.

THREE BLUE DOGS

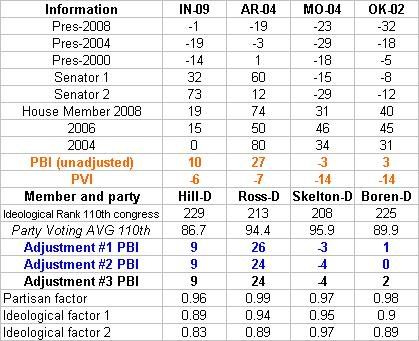
As a recap, here is the first “batch” of Blue Dogs that I examined correcting for partisanship and ideology. Notice the differences in both partisanship and ideology between the West Virginian congressman, and the AK and OK ones.  Nate Silver has been hopeful that Obama could recapture West Virgina for the Democrats. This data shows West Virgina although often lumped in with the other highland/Appalachia region that turned most heavily against Obama is quite a bit more progressive then other states in that area.  If they become comfortable with Obama’s race he could maybe overcome the recent red-tide there.

FOUR BLUE DOGS

As a reminder ranking a members ideology is a somewhat subjective decision. Potentially what’s one person “liberal” position, is another person “conservative” ones, remember the wingers developed a model that ranked the Sen. Obama as more liberal than Bernie Sanders or Russ Feingold. But partisanship, how often a member votes with their party is an absolute number. A Democrat who represents a “republican district” would be expected to “break with their party” on votes that don’t reflect their districts values.

I couldn’t find a website that ranks all the districts based on their PVI (I only could find list of them by state not rank, help please anyone), therefor I substituted a PVI ranking with where each member ranked in the Democratic caucus. In the 110th Congress the average Democrat had an ideological ranking of 170 (by the way this is a result of several members being tied, this is the medium not the midpoint). The average of members towards the center was 191, former Daily Kos celeb Ciro Rodriguez fell at exactly 191. The average of members towards the liberal side was 121, which falls between Rep. Larson of Conn. and Rep. Eshoo of CA. As or partisanship in the 110th Congress the average Democrat voted with their party 92.3% of the time.

As a clarification in Adjustment #1, I used a deviation factor based on how far each member was from the center of the Democratic caucus. Adjustment #2 was based on how far each member was from outside the standard deviation of the caucus. In Adjustment #3 I removed the partisanship factor to see what effect it would have. As I explained a few diaries ago I will use ADJUSTMENT FACTOR 2 in all subsequent corrections.

Because there are “only” 50 states (as opposed to evaluating 435 house members), I will at a later date have all the states ranked by PVI so I can adjust the Senator’s rankings. I developed Senate factors for the four states the four blue dogs came from. In the interest of full disclosure, my source for ideological rankings is Voteview, and for partisanship it was the Washington Post. This is still a work in progress, I’m making adjustments, and continuing to crunch numbers for more states. I also will use the adjustment factor on a liberal member of congress to see what effect that will have.

Florida, Part 1

In 2008, Illinois Senator Barack Obama won Colorado by 9.0%, Florida by 2.8%, and Indiana by 1.0%. Guess which one was the “swing state” in 2004.

The answer is Florida, and if that seems strange in light of the above – it is. In fairness, one might counter that Obama did relatively poorly in Florida (where he didn’t campaign in the primaries) and relatively well in Colorado (where the Democratic convention was held).

Here’s another question. Colorado, Florida, Indiana. Only one of these three sends a majority-Republican delegation to the House of Representatives. Which one is it? (A hint: it’s not Indiana.)

It turns out that Florida elects 15 Republican congressmen and 10 Democratic congressmen. Again, to be fair, one might note that Florida’s Republican-controlled state legislature gerrymandered Florida’s congressional districts to achieve an unbalanced result. This is relatively easy – most Democrats live in tightly clustered South Florida.

But that’s just it: Florida’s state legislature is Republican-controlled. In fact, Republicans have 60%+ majorities in both chambers. Florida’s governor is Republican Charlie Crist. Florida was voted Democratic in only two of the last eight presidential elections. John Kerry’s campaign was shocked by the margin he lost by in Florida. Bill Clinton won Georgia, of all states, while losing Florida in1992.

To be fair, I’m picking and choosing my numbers. If you go back to the past nine presidential elections, you’ll find Democrats batting three for nine, not two for eight. And three of those eight elections were big Republican victories.

But there’s only so many times one can say “to be fair.” There’s only so many excuses one can make for yet another indication of Republican dominance in Florida.

Because the closer one inspects as Florida, the more it begins to look less like a swing state than a conservative state with an unusually big Democratic base – which the media happens to call a swing state.

In the next section, I’ll be analyzing why exactly this is so.

PBI (Party Brand Index) Part 2: Colorado & Virginia (updated)

I have been working on (with some much appreciated help from pl515) a concept I’m calling PBI or Party Brand Index, as a replacement for PVI.  PVI (Partisan Voting Index), which is measured by averaging voting percentage from the last two presidential elections in each house district, and comparing it to how the nation as a whole voted, is a useful shorthand for understanding the liberal v. conservative dynamics of a district. But in my opinion it falls short in a number of areas. First it doesn’t explain states like Arkansas or West Virginia. These states have districts who’s PVI indicates a Democrat shouldn’t win, yet Democrats (outside of the presidency) win quite handily. Secondly why is this the case in Arkansas but not Oklahoma with similar PVI rated districts?

Secondly PVI can miss trends as it takes 4 years to readjust. The main purpose of Party Brand Index is to give a better idea of how a candidate does not relative to how the presidential candidate did, but compared to how their generic PARTY would be expected to perform. Last week I calculated PBI for Indiana, this week I tackled Colorado and Virginia.

My best case for arguing against PVI is Indiana.  Bush won Indiana quite easily in 2000 and 2004. The PVI of a number of it’s districts showed them to be quite Red. Yet in 2006 democrats won several districts despite their PVI’s. Also Obama won Indiana in 2008 a state, which based on the make up of the districts PVIs, made little sense. I therefore chose Indiana as my first test case for PBI:

Donnelly in the Indiana 2nd is a perfect example of my issues with PVI. Under PVI Donnelly is in a Republican district with a PVI of -2. But look at how Democrats have recently performed in this district. In 2008 Donnelly won reelection by 37%! Obama won this district by 9 points, and Bayh won it by 22%! Does this sound like a lean GOP district? Under PVI it is, under PBI it’s not it’s a +11 democratic district.

This week I tackled Colorado and Virginia. My general strategy is to work my way “out” from swing states. Both these states have undergone noticable ideological shift. Yet the PVI of their districts haven’t moved as much. This made them ideal candidates.

COLORADO

The big difference in Colorado is that Salazar’s district goes from being a lean Republican one under PVI (-5 Republican), to a lean Democratic one (+4 Democrat), considering that a Salazar has held this same seat for some time this makes more sense. Remember I measuring total party preference not just the presidential preference of a district like PVI measures.

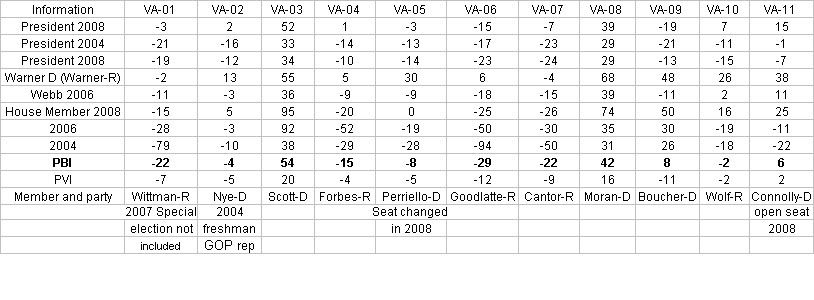
VIRGINIA

Virginia was the first time I had doubts on my ability to compute rough Senate numbers for House districts based on county totals. My estimates from Mark Warner Senate run yielded results of 3540% in Tom Perriello’s (VA-5th) district. This seemed way to high, even though now Senator Warner won the state with 65% of the vote.  At the time Virgil Goode was the representative from the VA-5th, and he lost by only a few hundred votes.- This lead me to do some additional research to try and discover if these numbers were published anywhere. Boy was I wrong Warner actually won the VA-5th by 65%!. Also several of the large victory margins were the results of representatives who ran unopposed. Fixed Party ID, and election results

________________________________________________________________________________

As a reminder I will review how I calculate Party Brand Index.

To compute PBI I basically did the following. I weighed the last 3 presidential elections by a factor of 0.45. Presidential preference is the most indicative vote since it’s the one politician people follow the most. The POTUS is the elected official people identify with or despise the most, thus illuminating their own ideological identification. I then weighed each house seat by 0.35. House seats are gerrymandered and the local leader can most closely match their districts make up in a way the POTUS can’t. So even though they have a lower profile I still gave them a heavy weight. Lastly I gave the last two Senate elections a weight of 0.2. Senatorial preference can make a difference, although I think it’s less than that of the President or the House members. Also (more practically) because I have to back calculate (estimate) Senate result totals from county results, a smaller number helps lessen the “noise” caused by any errors I may make. Under my system Democratic leaning have a positive number, the GOP has a negative number.

I then developed a way to weight for incumbents.  The reelection numbers for incumbents is so high it would be a mistake to weight a district solely on the fact that an incumbent continues to get elected. There is a long list of districts that have PVI that deviate from their incumbent members, whom none the less keep getting elected. These districts then change parties as soon as the incumbent member retires. This is evidence that incumbency can disguise the ideology of voters in a district.

Next I added a weighting of about 7% for House members. I remember reading that incumbency is worth about 5-10%. Nate wrote in a 538.com article that a VP pick from a small state was worth about a 7% swing, a house seat could in fact be thought of as a small state, that seems as good a number as any to start from. Conversely I will deduct 7% from an incumbents win. I think this will score them closer to the natural weight of a district. By the way I’m weighting the win 7% less, not actually subtracting 7% from the number.  Open seat races will be considered “pure” events and will remain neutral as far as weighting goes.  A seat switching parties will also be considered a neutral event. The 1st defense of a seat by a freshman house member will be given a weighting of 2%. The toughest race for any incumbent is their 1st defense. I decided to adjust for this fact. Note: Indiana’s bloddy 9th was a tough call a case could be made that when a seat keeps flipping, and the same two guys run 4 straight times in a row each election should be a neutral event.

Senate weighting is as follows. In state with a single House seat the Senate seat will be weighted the same as a house. In states with multiple seats, the Senate will get a weighting of 2%. Nate Silva stated that a VP pick in a large state is worth this amount. An argument could be made for a sliding scale of Senate weighting from 2-7%, this added complexity may be added at a later date. I will give incumbent presidents a 2% weighting, until I get better data on how powerful a “pull” being the sitting POTUS is, I will give them the same weighting as a senator.

______________________________________

Still to come:

The last major issue is how to deal with the “wingnut” factor. Sometimes a politician like Bill Sali (R-Idaho) or Marylin Musgrove (R-CO)lose because their voting record is outside of the mainstream of their district. I decided to try and factor this in.  

First I had to take a brief refresher on statistics. I developed a formula based on standard deviations. Basically I can figure out how much the average rep deviates from their district.  If I then compare where a reps voting pattern falls (in what percentile) and compare it to their district’s PVI, I can develop a “standard deviation factor”. Inside the standard deviation will get a bonus, outside a negative.

For example, if Rep X is the 42 most conservative rep, that would place her in the 90th percentile. But if her district’s PVI was “only” the in the 60th, their is a good chance her margins would be effected. Using a few random samples I found most reps lie within 12% of their district’s PVI.

Using these dummy numbers I then came up with this.  


   SQRT[(30-12)^2 /2] = about 13%

    Her factor would then be 100 – 13 = 0.87.

So her victory margin would be weighted by 0.87 because she is more than 12% beyond her acceptable percentile range it making the victories in her district approximate 13% less “representative”.

    My theory yields the following formula:

        If rep’s voting record is > PVI then

            100 – SQRT[({Record percentile – PVI} – Standard PVI Sigma)^2 /2] = factor

        else if rep’s voting record < PVI

             100 + SQRT[({Record percentile – PVI} – Standard PVI Sigma)^2 /2] = factor

To really do this I need to compute the standard deviation for all 435 reps, which is a pretty large undertaking. Instead  I will do a google search  to see if anyone has already done this. If not well it will take some time. But this would deal with the wingnut factor. Since politician tend to vote relatively close to their districts interest (even changing voting patterns over time) this may not be a major issue. But developing this factor may eventually allow the creation of a “reelection predictor”, so I am still going to work on it.

One last note, the corruption factor (for example Rep. Cao (R-LA) beating former Rep. Jefferson) is outside of any formula I can think of. The only saving grace here is that because my formula uses several elections, the “noise” from a single event will eventually be reduced.

NEXT UP: NC and MO

Introducing PBI (Party Brand Index)

I have been working on (with some much appreciated help from pl515) a concept I’m calling PBI or Party Brand Index, as a replacement for PVI.  PVI (Partisan Voting Index), which is measured by averaging voting percentage from the last two presidential elections in each house district, and comparing it to how the nation as a whole voted, is a useful shorthand for understanding the liberal v. conservative dynamics of a district. But in my opinion it falls short in a number of areas. First it doesn’t explain states like Arkansas or West Virginia. These states have districts who’s PVI indicates a Democrat would be in a hard position to win, never the less Democrats (outside of the presidency) win quite handily. Secondly why is that the case in Arkansas but not Oklahoma with similar PVI rated districts?

Secondly PVI can miss trends as it takes 4 years to readjust. The main purpose of Party Brand Index is to give a better idea of how a candidate does not relative to how the presidential candidate did, but rather compared to how their generic PARTY would be expected to perform. I’m calling this Party Brand Index.

My best case for arguing against PVI is Indiana.  Bush won Indiana quite easily in 2000 and 2004. The PVI of a number of it’s districts showed them to be quite Red. Yet in 2006 democrats won several districts despite their PVI’s. Also Obama won Indiana in 2008 a state, which based on the make up of the districts PVIs, made little sense. I therefor chose Indiana as my first test case for PBI.

Indiana also had a number of other oddity that made it an interesting test case. Indiana has Senators from opposite parties that each won election by large blowouts. Lugar’s in particular was enormous as he was essentially unopposed. Indiana also had a number of districts that flipped in the 3 election cycle expanse that I’m examining. Finally it makes the best case for why PVI can be misleading.

To compute PBI I basically did the following. I weighed the last 3 presidential elections by a factor of 0.45. Presidential preference is the most indicative vote since it’s the one politician people follow the most. The POTUS is the elected official people identify with or despise the most, thus illuminating their own ideological identification. I then weighed each house seat by 0.35. House seats are gerrymandered and the local leader can most closely match their districts make up in a way the POTUS can’t. So even though they have a lower profile I still gave them a heavy weight. Lastly I gave the last two Senate elections a weight of 0.2. Senatorial preference can make a difference, although I think it’s less than that of the President or the House members. Also (more practically) because I have to back calculate (estimate) Senate result totals from county results, a smaller number helps lessen the “noise” caused by any errors I may make.

I was then left with this chart:

I now began to look at the results. Under my system Democratic leaning have a positive number, the GOP has a negative number. Donnelly in the Indiana 2nd is a perfect example of my issues with PVI. Under PVI Donnelly is in a Republican district with a PVI of -2. But look at how democrats have recently performed in this district. In 2008 Donnelly won reelection by 37%! Obama won this ditrict by 9 points, and Bayh won it by 22%! Does this sound like a lean GOP district? Under PVI it is, under PBI it’s not it’s a +11 democratic district.

I then decided to go all Nate Silvaish and gave more recent elections a greater weight. I gave an addition 5% weight to each election as it got closer to the most recent election. To be honest I pulled 5% out of my dairy air but Nate gave a similar weighting to poll results as fresher ones came in 2008, so I copied this formula. This resulted in the following:

The next issue I decided to tackle was to develop a way to weight for incumbents.  The reelection numbers for incumbants is so high it would be a mistake to weight a district soley on the fact that an incumbat continues to get elected. There is a long list of districts that have PVI that devate from their incumbant members, whom none the less keep getting elected. These disticts then change parties as soon as the incumbant member retires. This is evidence that incumbancy can disguise the ideology of voters in a district.

I decided on a weight of about 7% for House members. I remember reading that incumbency is worth about 5-10%. Also Nate wrote in a 538.com article that a VP pick from a small state was worth about a 7% swing, a house seat could in fact be thought of as a small state, that seems as good a number as any to start from. Conversely I will deduct 7% from an incumbents win. I think this will score them closer to the natural weight of a district. By the way I’m weighting the win 7% less, not actually subtracting 7% from the number.  Open seat races will be considered “pure” events and will remain neutral as far as weighting goes.  A seat switching parties will also be considered a neutral event. The 1st defense of a seat by a freshman house member will be given a weighting of 2%. The toughest race for any incumbant is their 1st defense. I decided to adjust for this fact. Note: Indiana’s bloddy 9th was a tough call a case could be made that when a seat keeps flipping, and the same two guys run 4 straight times in a row each election should be a neutral event.

Senate weighting will be as follows. In state with a single House seat the Senate seat will be weighted the same as a house. In states with mutiple seat, the Senate will get a wighting of 2%. Nate Silva stated that a VP pick in a large state is worth this amount. An argument could be made for a sliding scale of Senate weighting from 2-7%, this added complexity may be added at a later date. I will give incumbant presidents a 2% weighting, until I get better data on how powerful a “pull” being the sitting POTUS is, I will give them the same weighting as a senator.

The main purpose of Party Brand Index is to give a better idea of how a candidate does not relative to how the presidential candidate did, but rather compared to how their generic PARTY would be expected to perform. I’m calling this Party Brand Index.

______________________________________

The last major issue is how to deal with the “wingnut” factor. Sometimes a politician like Bill Sali (R-Idaho) or Marylin Musgrove (R-CO)lose because their voting record is outside of the mainstream of their district. I decided to try and factor this in.

First I had to take a brief refresher on statistics. I developed a formula based on standard deviations. Basically I can figure out how much the average rep deviates from their district.  If I then compare where a reps voting pattern falls (in what percentile) and compare it to their district’s PVI, I can develop a “standard deviation factor”. Inside the standard deviation will get a bonus, outside a negative.

For example, if Rep X is the 42 most conservative rep, that would place her in the 90th percentile. But if her district’s PVI was “only” the in the 60th, their is a good chance her margins would be effected. Using a few random samples I found most reps lie within 12% of their district’s PVI.

Using these dummy numbers I then came up with this.  


   SQRT[(30-12)^2 /2] = about 13%

    Her factor would then be 100 – 13 = 0.87.

So her victory margin would be weighted by 0.87 because she is more than 12% beyond her acceptable percentile range it making the victories in her district approximate 13% less “representative”.

    My theory yields the following formula:

        If rep’s voting record is > PVI then

            100 – SQRT[({Record percentile – PVI} – Standard PVI Sigma)^2 /2] = factor

        else if rep’s voting record < PVI

             100 + SQRT[({Record percentile – PVI} – Standard PVI Sigma)^2 /2] = factor

To really do this I need to compute the standard deviation for all 435 reps, which is a pretty large undertaking. Instead  I will do a google search  to see if anyone has already done this. If not well it will take some time. But this would deal with the wingnut factor. Since politician tend to vote relatively close to their districts interest (even changing voting patterns over time) this may not be a major issue. But developing this factor may eventually allow the creation of a “reelection predictor”, so I am still going to work on it.

One last note, the corruption factor (for example Rep. Cao (R-LA) beating former Rep. Jefferson) is outside of any formula I can think of. The only saving grace here is that because my formula uses several elections, the “noise” from a single event will eventually be reduced.

Next Up: Colorado ( have the data done already) and Virginia

Redistricting 2011: Oklahoma & Wisconsin

This is now Episode 12 of my seemingly never-ending redistricting series. (In reality, it has a definite end — after this diary, there are only 9 states I’m planning to address: California, Washington, New Mexico, Maryland, West Virginia, Virginia, North Carolina, Kansas, and Tennessee. The other 15 states are either at-large states, or are unlikely to see substantive boundary changes.)

Today comes Oklahoma and Wisconsin. I struggled with whether to include Oklahoma at all, since my Oklahoma effort is barely different from the current map. But given the fluid partisan dynamics in Sooner State politics, and the potential issue over how to handle the “conservative Democratic” 2nd District, I thought it might be worth a look. On the other hand, I drew two maps for Wisconsin based on the highly changeable atmosphere in that state’s 2010 elections.

Previous efforts:

Diary 1: Massachusetts and Texas

Diary 2: Michigan and Nevada

Diary 3: Iowa and Ohio

Diary 4: Georgia and New Jersey

Diary 5: Florida and Louisiana

Diary 6: Pennsylvania and Utah

Diary 7: Illinois and South Carolina

Diary 8: Indiana, Missouri, and Oregon

Diary 9: Alabama, Arizona, and Kentucky

Diary 10: Colorado and Minnesota

Diary 11: Mississippi and New York

Hark, to the extended text!

Oklahoma

In a few short years, the legislature has gone from an eye-poppingly enduring history of Democratic reign as of 2004 to full GOP takeover by 2008. The governor’s mansion will be open in 2010 as popular Democratic Gov. Brad Henry is term-limited. Fortunately, the Democrats have two strong candidates to retain that office, but Republicans are still even odds at worst for a pickup. So what would GOP control of redistricting mean in 2011? There is only one Democrat in the delegation, the rebellious Dan Boren of the rural (and Native American-heavy) 2nd District. But my gamble is that, even with Republican control, district lines will only be adjusted, and no real effort will be made to dismantle Boren’s territory.

I can’t say my confidence in this prediction is exceedingly high, but look at the signs: even though Tom Coburn won this heavily evangelical, highly socially conservative district for the Republicans as recently as the late 1990s, the GOP has made no effort to target the seat, even when it was open in 2004 (their sacrificial lamb back then lost to Boren 66-34%, and Boren’s two reelections have both topped 70%). Considering Boren racks up urban New England-like Democratic margins in a district that broke 2-to-1 for McCain, and that Oklahoma redistricting has historically revolved around the preservation of culturally cohesive regions, it would seem a dangerous overreach for the GOP to aim its fire at Boren at the risk of softening up less conservative turf around Tulsa and Oklahoma City. Other than completely breaking the traditional boundaries around Eastern Oklahoma, how would they crack his constituency, anyway? And how much worse would it be for Boren to compete for votes in Tulsa than to compete for them in Little Dixie?

So that’s my gamble. And as a result, the differences between this map and the current one are scarcely visible:

Photobucket

There’s not much to even describe here, except that the Oklahoma City-based 5th is contracting in area as the two most rural districts (especially the 3rd) expand.

Wisconsin

As in neighboring Minnesota, circumstances of state politics pushed me to draw two possible maps for America’s Dairyland. The Democrats currently enjoy a redistricting monopoly here, but a tenuous one, with a narrow 52-47 edge in the Assembly, 18-15 in the Senate, and a controversial governor in Jim Doyle. Given the high possibility/probability that any one of these pillars of state power could flip to the Republicans in 2010 (the most likely loss being the governor’s mansion, Doyle’s approval rating hovering in the 30s), it seemed logical to draw a bipartisan compromise map to accompany a hypothetical Democratic gerrymander. Since it would be an incredible feat for the GOP to pick up all three levers in one election cycle, I thought it unnecessary to draw a Republican gerrymander map.

Democratic gerrymander first: this map creates two or three solid Democratic seats, just one solid Republican seat, and as many as five swing seats, all of which would have voted for Obama. Most importantly, it concentrates GOP areas in the 5th and pits two veteran Republican incumbents, Tom Petri of Fond du Lac and Jim Sensenbrenner of Menomonee Falls, against each other. Petri’s 6th is then opened up for Democratic poaching, as is Paul Ryan’s 1st south of Milwaukee. It’s possible Petri could move north and run for the 6th, but when he retired, this iteration would be a prime pickup opportunity. Meanwhile, all five Democratic incumbents are kept about as solid as they were (Kagen gets a very slight boost, though none are pointedly shored up). In toto, a good year under this map might produce a 7-1 Democratic majority; an average year would result in 6-2, and a bad year might retain the standing 5-3 edge, either with the status quo remaining, or with Kagen’s seat traded for Ryan’s.

Photobucket

District 1 – Paul Ryan (R-Janesville) — with all of Kenosha and Racine Counties along with 36% of Milwaukee County, Ryan would face his first truly difficult race in 2012 under these lines (though many think he’ll bail for a gubernatorial try in 2010), and as an open seat this district would be likely to elect a moderate suburban Democrat.

District 2 – Tammy Baldwin (D-Madison) — made only slightly less Democratic to help Dems in the 1st and 3rd.

District 3 – Ron Kind (D-La Crosse) — still somewhat Dem-leaning, as before. The three Dem seats in small town Wisconsin (Kind, Kagen, and Obey) are all only modest Obama districts, but seem to be a bit stronger for their incumbents.

District 4 – Gwen Moore (D-Milwaukee) — the other 64% of Milwaukee, plus 24% of GOP-friendly Waukesha County; a strong urban Rust Belt Democratic seat.

District 5 – Jim Sensenbrenner (R-Menomonee Falls) vs. Tom Petri (R-Fond du Lac) — geography would seem to favor former Judiciary Chairman Sensenbrenner, and Petri might choose to move north in this scenario, but muddying the waters was clearly my goal. This packs Republican votes as well as can be expected anywhere in Wisconsin.

District 6 (open) — without Petri, this would be a fairly good shot to elect a Democrat, with Obama having performed somewhere in the neighborhood of 51-53%. But much like the current 6th, if Petri ran, it would be on loan to the GOP until his retirement.

District 7 – Dave Obey (D-Wausau) — as chairman of the Appropriations Committee, Obey obviously has nothing to worry about, though Democrats have long noted the fairly marginal nature of the 7th. When he does retire, this will still probably be a somewhat Dem-leaning/Obama-friendly rural seat, but a slam dunk? No.

District 8 – Steve Kagen (D-Appleton) — I only had minimal room to strengthen his district, since most rural Wisconsin counties are competitively balanced, but made the necessary trades to up his chances a bit.

Now the bipartisan compromise map: this adhered to clean, simple, aesthetic district lines and made superficial efforts to help incumbents without going out of its way to do so. The reason I didn’t make an aggressive “incumbent protection” map is that the current lines are fairly incumbent-friendly, especially as Democratic strength has increased in the once-Republican 8th. So my primary goal for this scenario was pretty boundaries, with a dash of Petri, Ryan, and Kagen protection thrown in (for Petri, I had no concerns about his ability to be reelected, but rather about the GOP’s chances of holding the open seat). Needless to say, I’d rather see the Democrats retain control, but at least this map appeases my “good government” instincts.

Photobucket

Redistricting 2011: Mississippi & N.Y.

After a couple-week hiatus, I’m back to Episode 11 of my redistricting series! On tap for tonight’s episode: a magnolia founds the next world empire! Or, rather, I’ve paired two unlikely diary neighbors, New York and Mississippi.

There were a number of people who earlier asked me why I hadn’t yet covered New York, one of the obvious choices for an early redistricting diary. The reason is that back in March I drew a map for NY that assumed Jim Tedisco would win NY-20 and be primed for elimination in 2012. Just tonight I redrew New York to, on the contrary, make the 20th more Democratic to help Murphy (though the news wasn’t all good, and I’ll get to that momentarily).

Previous efforts:

Diary 1: Massachusetts and Texas

Diary 2: Michigan and Nevada

Diary 3: Iowa and Ohio

Diary 4: Georgia and New Jersey

Diary 5: Florida and Louisiana

Diary 6: Pennsylvania and Utah

Diary 7: Illinois and South Carolina

Diary 8: Indiana, Missouri, and Oregon

Diary 9: Alabama, Arizona, and Kentucky

Diary 10: Colorado and Minnesota

The chasm lies below…

Mississippi

With only four districts and a Democratic legislature offset by Republican Gov. Haley Barbour, the goal here was simple: help Travis Childers and make his 1st District considerably more Democratic without noticeably diluting the 2nd (a VRA-protected black-majority district). Much like ArkDem’s Mississippi map from some time ago, mine keeps the 2nd solidly black-majority while moving the needle in the 1st several points in the Democrats’ favor. Unfortunately, there seems to be literally no way to prevent Gene Taylor’s 4th, in 2008 McCain’s strongest district in the state, from eventually flipping to the GOP. The Gulf Coast counties are just too absurdly Republican (little-known fact: Trent Lott represented the 4th not long before Taylor, who won a 1989 special election when Lott’s GOP successor died).

Photobucket

District 1 – Travis Childers (D-Booneville) — the overwhelming Republican nature of Mississippi’s northernmost counties prompted me to make a truly audacious move (hat tip to ArkDem on this) in removing DeSoto County, a major source of GOP votes, from this district and putting it instead with the mostly black, Delta-based 2nd. This district carefully grabs more marginally Republican counties that were previously with the 3rd and some black counties that were in the 2nd without, I think, overreaching. McCain would likely have still won here, but not with 62% as before (since my methods are so low-tech, I can only guesstimate, and I’ll say with only minimal knowledge that this variation of the 1st is probably about 55-57% McCain, enough to keep Childers solid and keep the district well in play for a future Democrat).

District 2 – Bennie Thompson (D-Bolton) — other than its two-county northern reach, this district is heavily Democratic and hopefully at least 60% black, with an Obama percentage somewhere around 63-65%.

District 3 – Gregg Harper (R-Pearl) — once I had set aside most available Democratic turf for Thompson or Childers, and drawn a logical Southern Mississippi seat for Taylor, this constitutes what was left over (hint: a lot of white Republicans, who easily overwhelm the significant minority of black Democrats).

District 4 – Gene Taylor (D-Bay St. Louis) — I hoped against hope that there was a way to bring the McCain share under 60%, even under 65%, but that’s impossible as far as I can tell. Consider this district a loan that can be deferred only as long as Taylor chooses to stay.

New York

Well, then…I had to eliminate one seat (it’s possible the Empire State will lose two, as in the last reapportionment, but all models currently project that its 28th slot will barely be saved). Murphy winning NY-20, much as it thrilled me, put a real monkey wrench in my plans and forced me to start over with the upstate districts, especially since there are a handful of upstate Democrats with marginal districts needing protection (damn all those votes being wasted in the city!). I started my do-over looking for a way to eliminate Pete King without jeopardizing shaky Democratic strength on Long Island…turns out, not a good idea. Population loss is mostly confined to upstate, so any NYC or Long Island seat elimination will cause havoc with the necessarily illogical lines. Simply put, the dropped seat will have to be upstate. If New York ends up dropping two, maybe King can be drawn out.

I tried drawing upstate a few different ways, each messier and more gerrymandered than the last, until deciding to try something a little controversial: put Mike Arcuri at risk. Of course, I started this process wanting to shore up Arcuri, just like Massa, Murphy, Maffei, and Hall, but eventually discovered that his district would be the most difficult to shore up based on pure geography. It’s not hard to move the 20th north, or put a little Rochester into Massa’s district, but with so many narrowly GOP-leaning and swing counties in the middle of the state, helping Arcuri would have been a lot tougher.

So I paired Arcuri with veteran Republican John McHugh in a relatively even-handed district. That may bode ill for Arcuri (whose first reelection in 2008 was shockingly close) against the longtime incumbent from up north, but with Obama likely to again command some coattails in 2012 New York, maybe he has a good shot. On the flip side, McHugh hasn’t faced a tough race in forever and may bow out rather than test his probably rusty survival skills. So my proposed 23rd is a tough call, and Democrats in the legislature might prefer to seek a certain GOP loss, but they’ll be forced to resort to some mighty contortions of mapmaking to derive that result.

Other than that risky move, my other choices were, I think, logically conceived and beneficial to the Democrats. Murphy and Massa are the big winners in this map, as are Hall and Maffei to a lesser degree. It was hard not to spread upstate Dem votes too thin, especially since upstate counties tend to be within 55% one way or the other (unlike the overwhelming Democratic margins in the city), but I think I may have pulled it off, at least as well as I could while equipped with such minimal redistricting tools.

Photobucket

You can’t easily see the urban districts, which is good because I wasn’t able to be very precise with them (what with only a calculator, Excel, and Paint to guide me). In fact, my changes to the NYC and Long Island districts were so minimal that there’s little point to addressing each district individually. Suffice to say that, other than maintaining VRA racial protections, the only “downstate” district I thought carefully about was the 13th, which in my map comprises all of Staten Island plus a small portion of Brooklyn. Beginning at the bottom of the Hudson Valley, then:

District 17 – Eliot Engel (D-Bronx) — stretches from the Bronx to Orange County. I diluted Democratic strength a little bit to help John Hall, but the 17th stays a safe seat.

District 18 – Nita Lowey (D-Harrison) — entirely within Westchester County, safely Democratic.

District 19 – John Hall (D-Dover Plains) — 91% of Dutchess, 28% of Orange, all of Putnam, and 23% of Westchester = Dem-leaning and more clearly Dem-trending suburban/exurban district.

District 20 – Scott Murphy (D-Glens Falls) — altered not just to become more Democratic (and it obviously is, in this iteration) but specifically to strengthen Murphy, by grabbing more of the rural north and dropping most of Saratoga. Perhaps Murphy will do well in Saratoga in 2010, without a regional pol as his opponent, but since Obama’s numbers were stronger up north than in Saratoga anyway, this seemed like a sensible choice.

District 21 – Paul Tonko (D-Albany) — a bit less Democratic, this district still includes all of Albany County but also all of Schenectady and 79% of Saratoga. Tonko would represent three major upstate towns under my map, which may present occasional conflicts of interest, but certainly appeases the “geographical compactness” fetishists.

District 22 – Maurice Hinchey (D-Hurley) — sheds a few Democrats to help Arcuri and Massa, but stays Dem-leaning and reasonably compact. The toughest pill to swallow for Hinchey would be ceding liberal Tompkins County (Ithaca) to Arcuri/McHugh while picking up some moderate Republican turf in the Hudson Valley. This is what I mean about having to balance the interests of different Democrats upstate. Hinchey, and a future Democrat, should still be just fine here.

District 23 – John McHugh (R-Pierrepont Manor) vs. Mike Arcuri (D-Utica) — combines some of McHugh’s rural northern counties (the more Democratic of which were given to Murphy) with Arcuri’s Oneida County base and some overwhelmingly Arcuri-friendly territory down in Ithaca. Knowing McHugh’s moderate reputation, popularity with military interests, and seniority advantage, I went out of my way to give Arcuri a fighting chance. For whatever it’s worth, this district would have voted for Obama, as did both of the current districts — Arcuri’s 24th and McHugh’s 23rd.

District 24 – Dan Maffei (D-Syracuse) — what was involved with this district was more tinkering than careful strategy, as any reasonable take on Maffei’s district will result in something Onondaga County-heavy and Dem-leaning.

District 25 – Chris Lee (R-Clarence) — a true “leftovers” district after I had done everything within reason to put Massa’s 28th in the Obama column while keeping Slaughter and Higgins rock-solid. Other than Chautauqua County and some Buffalo-area neighborhoods, this district should be plenty Republican. And yes, I know some of you would have liked me to eliminate Lee, but there are enough GOP votes in this part of New York that Massa (or Higgins) would have been doomed for defeat under that plan.

District 26 – Brian Higgins (D-Buffalo) — literally stretches from Buffalo to Niagara Falls, for a Rust Belt-ish industrial and Democratic-leaning district.

District 27 – Louise Slaughter (D-Fairport) — much like its current form, this covers most of the “lakeshore curve” in Western New York, stretching east from Niagara Falls to Rochester (about 2/3 of Monroe County is here, with the other third given to Massa, who definitely could use the electoral aid, while Rules Committee Chairwoman Slaughter is safe as can be).

District 28 – Eric Massa (D-Corning) — if this district were a tourism ad, its slogan would be “where West and Central meet”. The Rochester portion of the district likely puts Massa in a much more advantageous position and results in a slightly Obama-supporting district (the current 29th voted for McCain). Monroe County is easily the largest population source, with Ontario, Steuben, Chemung, and Cayuga (88% of which is here) rounding out the top five. Though it’s far from a Democratic stronghold, this district may be my most effective upstate seat in terms of the overall change in its partisan composition.

Overall, this map does what we’d all like in somewhat solidifying a three-seat ceiling for the Republicans (a very bad year might result in defeats for Massa and either Hall or Murphy, but the average year would preserve at least 25 Democratic seats out of 28), one of which is quite vulnerable. More sophisticated technology would doubtlessly allow me to create more precise boundaries and more accurately estimate the partisan dynamics of each district, but given the limited resources I have, I think I did pretty okay.

Thoughts on either state? What else do you want to see from this redistricting series?

Governors 2009-10 outlook

Crossposted at Daily Kos

It’s been a while since I wrote one of these, and foolishly, I penned this diary yesterday evening with little sense that something as dramatic as a Supreme Court retirement was mere hours on the horizon…alas!

Irrespective of the indisputably riveting SCOTUS chatter, let’s start with the gov contests of 2009 before moving to 2010. Read about all 36 races below the fold…

First, a map of the entire gubernatorial state of play between 2009 and 2010:

Photobucket

As you may have guessed, light-colored states are open seats (10 Democratic, 7 Republican). The states with circular holes (Minnesota, Florida, and Wyoming) are states where it isn’t clear yet whether or not the incumbent will seek another term.

2009

New Jersey – Jon Corzine (D) seeking 2nd term

Outlook: Tossup

Polls still show Corzine losing to GOP frontrunner Chris Christie, a former U.S. Attorney; the latest poll, from Monmouth University, shows Christie leading 39-35, with Corzine’s job approval at 40% to 49% disapproval. While New Jersey politicians typically poll badly, it’s foolish to discount these numbers…Corzine is in serious trouble. If there is a silver lining, it is that as public confidence in the economy and the direction of the country has ticked up, Corzine’s numbers have inched closer to parity with Christie. I’ve heard the occasional rumor that the Governor will “pull a Torricelli” and bow out at the 11th hour in favor of someone less controversial. Three problems with that: the replacement candidate won’t have Corzine’s money, Garden State voters may (rightfully) grow tired of those sorts of antics, and who would the replacement be, anyway? (I don’t think popular former Gov. Dick Codey fancies a comeback.) For better or worse, Corzine may have to correct this ship himself.

Virginia (OPEN) – Tim Kaine (D) term-limited

Outlook: Tossup

As in 2005, a well-liked Democratic Governor is term-limited, the Republicans have united around the Attorney General as their nominee, and said Attorney General has a lead in most polls on the Democratic possibilities. Hopefully, as in 2005, dynamics will change after the June 9 Democratic primary. On the Dem side, Terry McAuliffe has seemingly catapulted into the lead, if the latest SurveyUSA poll is to be believed, with 38% to 22% each for State Del. Brian Moran and State Sen. Creigh Deeds. Each of the candidates narrowly loses to Attorney General Bob McDonnell, for now, but as I said, Kaine was well behind Jerry Kilgore all through summer 2005 as well. One odd item of trivia: the sitting President’s party has lost every Virginia gubernatorial election since Watergate. Such history is always subject to change (“bellwether Missouri” says hi), but it’s an amusing stat nonetheless.

And on the docket for 2010

Alabama (OPEN) – Bob Riley (R) term-limited

Outlook: Leans Republican

To date, the sole official GOP candidate is real estate developer Tim James, son of 1994-1998 GOP Gov. Fob James, though a run seems quite likely by the legendary (and not in a good way) Roy Moore, former Chief Justice of the state’s Supreme Court. The major Democratic candidates, Rep. Artur Davis and State Agriculture Commissioner Ron Sparks, seem a heck of a lot more impressive, but given the Yellowhammer State’s continued leanings (even a boost in black participation only pushed Obama to 39% here), the Republicans must warrant an early if narrow edge.

Alaska – Sarah Palin (R) seeking 2nd term

Outlook: Safe Republican

Congratulations to one Bob Poe and one Rob Rosenfeld, two Democrats who I assume are as unfamiliar to most Alaska voters as they are to the average political junkie, for choosing to run against Gov. Thanks But No Thanks. The drama surrounding Palin’s career — and there is plenty — is unfortunately unrelated to her prospects for reelection at the moment.

Arizona – Jan Brewer (R) seeking full term

Outlook: Tossup / Tilts Republican

According to Politics1, Brewer is already drawing several primary opponents even as not a single Democrat has yet announced. Insert all clichés here about the advantages of incumbency, but Arizonans I talk to seem dubious about Brewer’s ability to effectively confront the state’s fiscal problems. Dems hold their breath as Attorney General Terry Goddard mulls it over, and Phoenix Mayor Phil Gordon’s name has been tossed around more than once as well.

Arkansas – Mike Beebe (D) seeking 2nd term

Outlook: Safe Democratic

Beebe is one of the few governors presumably not suffering from declining approval ratings these days, and last I checked was one of the most popular in the nation.

California (OPEN) – Arnold Schwarzenegger (R) term-limited

Outlook: Leans Democratic pickup

At the moment, the Republican primary is, surprisingly, more crowded than the Democratic one, with former Rep. Tom Campbell, State Insurance Commissioner Steve Poizner, and former eBay CEO Meg Whitman duking it out. Most seem to give the well-financed Whitman an edge, though Poizner is the only candidate of the three to have successfully sought statewide office. On the Dem side, two Bay Area heavyweights are in (Attorney General and former Gov. Jerry Brown and San Francisco Mayor Gavin Newsom) while Lt. Gov. John Garamendi is out (underwhelmed by his poll numbers against Brown and Newsom, he is seeking to replace Ellen Tauscher in Congress if and when she is confirmed as one of Hillary Clinton’s deputies). The mega-name still weighing his options? Los Angeles Mayor Antonio Villaraigosa, the only Southern Californian and the only Hispanic being talked about in a state ever more ethnically diverse and heavily dominated by its southern counties. This race was assured long before it began to be a headliner.

Colorado – Bill Ritter (D) seeking 2nd term

Outlook: Leans Democratic

Most thought Ritter was one of the less obviously endangered governors in 2010 (and nearly all of them have taken a hit from economic worries and state budget crises), but a Public Policy poll shows trouble, with his approval in the red at 41-49 and mediocre numbers against potential opponents like former Rep. Scott McInnis and State Senate Minority Leader Josh Penry. There is plenty of time for Ritter to turn things around, but his supporters should certainly fight complacency.

Connecticut – Jodi Rell (R) seeking 2nd full term

Outlook: Likely Republican

There are credible Democratic candidates in former State House Speaker Jim Amann, Secy. of State Susan Bysiewicz, and Stamford Mayor Dan Malloy, but as far as I know Rell is still fabulously popular (as the New York Times puts it, her approval ratings read like the temperature in Honolulu) and should defeat all comers.

Florida – Charlie Crist (R) either seeking 2nd term or running for the Senate

Outlook: Likely Republican if Crist runs again, Tossup if he vacates

The new conventional wisdom seems to be that Crist is prepping to run for the Senate and will announce in a matter of days, not weeks. To sum up what would happen in that event, I’ll sum things up in four words: “open governor’s mansion, Florida”. Let the generous cash infusions from both national parties begin.

Georgia (OPEN) – Sonny Perdue (R) term-limited

Outlook: Leans Republican

This race saw an interesting shakeup recently when Lt. Gov. Casey Cagle, the putative frontrunner in the Republican primary and possibly in the general election as well, bowed out suddenly based on recent health concerns (there were other rumors about what informed his decision, but we’ll not go into those). The Republican primary is absurdly crowded, even if you only note the major candidates: Secy. of State Karen Handel, Insurance Commissioner John Oxendine, State Sen. Eric Johnson, Rep. Nathan Deal, and State Rep. Austin Scott. On the Democratic side, Atty. Gen. Thurbert Baker easily leads State House Minority Leader DuBose Porter and former Labor Commissioner David Poythress, but all eyes are on former Gov. Roy Barnes, who may mount a comeback and would probably be favored over Baker. After Obama’s 47% total in Georgia, Democrats are curious to test the waters either with a previous known quantity like Barnes or a well-known black candidate like Baker.

Hawaii (OPEN) – Linda Lingle (R) term-limited

Outlook: Leans Democratic pickup

The Republicans are lucky to have a well-known candidate like Lt. Gov. Duke Aiona, because any competent Democrat starts out favored in an open governor’s race in deep blue Hawaii (as an aside, remember circa 2004 when everyone fretted about future trends in the Aloha State?). The only Dem candidate so far is longtime Rep. Neil Abercrombie, but Honolulu Mayor Mufi Hannemann and State Sen. Colleen Hanabusa, two names perennially floated for statewide office, are each considering an entrance.

Idaho – Butch Otter (R) seeking 2nd term

Outlook: Safe Republican

Well, who do you have in mind?

Illinois – Pat Quinn (D) seeking full term

Outlook: Likely Democratic

Here is some food for thought from Public Policy Polling: Quinn’s approval rating is a healthy 56%, quite good for a governor in 2009’s political climate, yet Atty. Gen. Lisa Madigan, a possible primary foe, leads the incumbent 45-29. Could it simply be that Madigan is more popular than Quinn? Rumor has long favored a Madigan gubernatorial run with State Treasurer Alexi Giannoulias seeking the Senate seat, but the entire Blagojevich saga, and resulting ascent of the purportedly squeaky clean Quinn, may have cooled Madigan’s interest a bit. The GOP field includes at least two fairly big names in DuPage County State’s Attorney Joe Birkett and State Sen. Bill Brady, but either Quinn or Madigan would seem odds-on favorites for now.

Iowa – Chet Culver (D) seeking 2nd term

Outlook: Leans Democratic

Like Ritter in Colorado, Culver is appearing more vulnerable than was initially suspected, but the GOP bench is weak and plenty of Democratic governors seem more obvious targets. I hear that far-right icon Rep. Steve King is mulling a run, but that hardly seems reason for Culver to tremble given Iowa’s decidedly moderate electorate.

Kansas (OPEN) – Mark Parkinson (D) retiring after partial term

Outlook: Likely Republican pickup

It’s too bad the newly minted Governor isn’t interested in a full term, because he might actually have a fighting chance (though perhaps not against longtime Sen. Sam Brownback, probably the next Governor regardless of whom the Democrats eventually settle on).

Maine (OPEN) – John Baldacci (D) term-limited

Outlook: Leans Democratic (one assumes)

The only announced candidate right now with an electoral history is former Atty. Gen. Steve Rowe (D), after former Rep. Tom Allen declined. I’ve heard rumors about Rep. Mike Michaud, but it seems that few are yet anxious to capitalize on this once-every-eight-years opportunity.

Maryland – Martin O’Malley (D) seeking 2nd term

Outlook: Likely Democratic

O’Malley’s approvals are iffy but the GOP bench is virtually nonexistent, other than former Gov. Bob Ehrlich, who already lost to O’Malley in 2006.

Massachusetts – Deval Patrick (D) seeking 2nd term

Outlook: Likely Democratic

Patrick’s approval ratings are actually rather horrendous (27-68 according to SurveyUSA). The only announced challenger is an Independent, businessman Christy Mihos, and if Patrick has anything to feel good about, it’s the lack of quality GOP possibilities in the Bay State (odd considering their 16-year reign over the governor’s mansion). There has been gossip about a serious primary challenge, and with 27% approval, one assumes there would be room for that, but nothing has materialized just yet. This is definitely one to watch, for internecine fights if nothing else.

Michigan (OPEN) – Jennifer Granholm (D) term-limited

Outlook: Tossup

With redistricting around the corner and Michigan’s economy far worse even than the national one, this is a major concern for the Democrats. It is said that Lt. Gov. John Cherry (D) fails to impress as a stump speaker, but for now he is the odds-on primary favorite over Macomb County Sheriff Mark Hackel, MSU Trustee George Perles, State Rep. Alma Wheeler Smith, and former Flint Mayor Don Williamson (who resigned to avoid recall in February). Non-fans of Cherry’s hope to see State House Speaker Andy Dillon jump in. Major Republican candidates include Rep. Pete Hoekstra (ranking member on House Intelligence), State Sen. Tom George, Secy. of State Terri Lynn Land, and Atty. Gen. Mike Cox. The polls between Cherry and the Republicans are even at best, trending the wrong way at worst.

Minnesota – Tim Pawlenty (R) not sure whether he’ll seek 3rd term

Outlook: Tilts (not Leans) Republican if Pawlenty runs, Leans Democratic otherwise

Pawlenty has made no indications that he won’t seek a third term, but isn’t exactly jumping on a reelection campaign either. The Democratic field is crowded, with five current or former state legislators, Ramsey County Attorney Susan Gaertner, and former Sen. Mark Dayton. Until we’re clear on Pawlenty’s plans, the situation remains opaque. (And honestly, aren’t we all accustomed by now to long waits re: Minnesota electoral politics?)

Nebraska – Dave Heineman (R) seeking 2nd full term

Outlook: Safe Republican

Politics1 lists no announced or potential candidates. That about sums this one up.

Nevada – Jim Gibbons (R) seeking 2nd term

Outlook: Likely Democratic pickup if Gibbons wins primary, Tossup otherwise

Last I heard Gibbons’ approval is in the 20s. The good news is that he’ll be gone after 2010; the bad news is that he may well lose the GOP primary to a superior pick like former State Sen. Joe Heck. No official Dem candidate yet, but the bench is deep considering Democrats’ dominance of statewide offices and the beginning of term limits affecting the state legislature.

New Hampshire – John Lynch (D) presumably seeking 4th term

Outlook: Safe Democratic

Lynch was reelected with 74% in 2006 and 70% in 2008, so he would have had to crash and burn since then (and I don’t think he has) to face a tough race in 2010.

New Mexico (OPEN) – Bill Richardson (D) term-limited

Outlook: Likely Democratic

Lt. Gov. Diane Denish is Richardson’s obvious successor and the Republican bench in the Land of Enchantment is as poor as ever. I suppose the dynamics could shift here, but for now, this is looking like a snooze-inducing changing of the guard.

New York – David Paterson (D) seeking full term

Outlook: Tossup if Paterson wins primary, Likely Democratic otherwise

Did I read right when I saw his approval rating at 19%? Atty. Gen. Andrew Cuomo says he isn’t interested in running, for now, but players in the New York Democratic Party must be praying that he’s lying. Fortunately, New York is bluer than ever, but Paterson is damaged goods and someone simply must take the leap.

Ohio – Ted Strickland (D) seeking 2nd term

Outlook: Leans / Likely Democratic

Strickland’s approval is a healthy 56%, though it’s 48% on the state’s inarguable top issue, the economy. Personally, I give him kudos for somehow maintaining decent numbers while serving as Governor of economically battered Ohio during a severe recession. His only announced opponent so far is State Sen. Kevin Coughlin.

Oklahoma (OPEN) – Brad Henry (D) term-limited

Outlook: Tilts Republican pickup

This is something of a doppelganger to Hawaii. Like Linda Lingle, Henry has preserved his favorability in a politically adverse state, the incumbent party’s candidate(s) is (are) strong, but the overwhelming partisan leanings of the state give the opposition party a leg up. Democrats Jari Askins, the Lt. Governor, and Drew Edmondson, the Atty. General, are no hacks, but this state was John McCain’s best at 66-34 over Obama. Rep. Mary Fallin leads the GOP field for now, but media favorite former Rep. J.C. Watts is seriously floating his name as well.

Oregon (OPEN) – Ted Kulongoski (D) term-limited

Outlook: Likely Democratic

If Oklahoma is a sort of reverse Hawaii in 2010, Oregon is Maine’s twin. As in Maine, the Democrats, whose bench is deep, should be enthused about a chance at the top office opening up in a blue state, particularly since the incumbent Governor’s approvals were never stellar, but only a single serious candidate has yet jumped in (in this case, former Secy. of State Bill Bradbury).

Pennsylvania (OPEN) – Ed Rendell (D) term-limited

Outlook: Tossup

Along with Michigan, this will be big-ticket defense for the Democrats, and for the same reasons. In this case, history would appear to be on the Republicans’ side — Rendell has been Governor since 2002, the GOP was in power from 1994-2002, the Dems from 1986-1994, the GOP from 1978-1986, the Dems from 1970-1978, the GOP from 1962-1970, the Dems from 1954-1962…see a pattern? But history is always true until it isn’t anymore. Businessman Tom Knox is the only announced Democratic candidate but the names being bandied about are some big ones, including Pittsburgh heavyweights Dan Onorato, the Allegheny County Executive, and Jack Wagner, the state’s Auditor General. On the GOP side, Rep. Jim Gerlach is looking at the race (though the NRSC wants him to challenge Arlen Specter), while Atty. Gen. Tom Corbett is the frontrunner for now.

Rhode Island (OPEN) – Don Carcieri (R) term-limited

Outlook: Who the heck knows?

No Democrat or Republican is running yet to replace Carcieri in liberal Rhode Island. But former Sen. Lincoln Chafee (probably) is, and as an Independent. Chafee did serve in the Senate as a Republican, but now that he is a third-partyer there is little love left for him in the GOP, particularly with the Steve Laffey wing ascendant. Meanwhile, Democrats have no candidate to win what should be a slam dunk pickup. This could be interesting…

South Carolina (OPEN) – Mark Sanford (R) term-limited

Outlook: Likely Republican

Compared to Alabama and Georgia, the Palmetto State Democratic bench is weak. The current odds-on favorite to replace Sanford is backbencher Rep. Gresham Barrett (R), and rumors abound of a run by Lt. Gov. Andre Bauer, who would give Barrett a competitive primary. For now, it’s hard to see Democrats running seriously here.

South Dakota (OPEN) – Mike Rounds (R) term-limited

Outlook: Safe Republican assuming Rep. Herseth Sandlin (D) doesn’t run

The gossip about Rep. Stephanie Herseth Sandlin (D) has visibly died down, so drama will likely be reserved for the Republican primary (currently headlined by Lt. Gov. Dennis Daugaard and State Senate Majority Leader Dave Knudson).

Tennessee (OPEN) – Phil Bredesen (D) term-limited

Outlook: Leans Republican pickup

State Senate Minority Leader Roy Herron, former State House Majority Leader Kim McMillan, and businessman Mike McWherter (son of former Gov. Ned McWherter), are credible choices on the Democratic side, but momentum has long been with the Republicans in Tennessee (along with Louisiana, West Virginia, Arkansas, and Oklahoma, it was one of five states to move against the Democrats and Obama in the 2008 presidential election compared to 2004). Between Shelby County D.A. Bill Gibbons, Knoxville Mayor Bill Haslam, State Senate Speaker Ron Ramsey, and Rep. Zach Wamp, the GOP should be well positioned to snatch this one (for redistricting purposes, Democrats should stay focused on races for the evenly divided state House).

Texas – Rick Perry (R) seeking 3rd full term

Outlook: Likely Republican

My gut tells me all statewide races in Texas should automatically be put as Safe Republican unless specific conditions indicate otherwise, but the lack of certainty about this race’s development forces me to stay open-minded. As we all know, Perry faces a stiff and long-anticipated (by long-anticipated, I mean that it’s been chatted about for eight years at least) primary challenge from Sen. Kay Bailey Hutchison. Hutchison was expected to trounce Perry, but the governor’s recent appeal to far-right secessionists and fundamentalists seems to have helped his viability against the famously popular Hutchison. And the Democrats? Former Ambassador to Japan Tom Schieffer and — yup — Kinky Friedman.

Vermont – Jim Douglas (R) seeking 5th term

Outlook: Tilts Republican

Douglas has routinely maintained good approvals and capitalized on a divided left due to Vermont’s electorally strong Progressive Party, but the Democrats seem ready to give him a real race in 2010, with Secy. of State Deb Markowitz and State Sen. Doug Racine (who lost to Douglas by a hair in 2002) both announced candidates. If the third parties sit this one out for once, there may be a real shot at turning Vermont’s state government wholly blue, especially with an energized left in the wake of gay marriage’s statewide enactment.

Wisconsin – Jim Doyle (D) seeking 3rd term

Outlook: Tossup / Tilts Democratic

Doyle’s fundraising hints at a third bid, and familiar Republicans like former Rep. Mark Neumann and Milwaukee County Executive Scott Walker are lining up to take him on. With Doyle’s approvals a measly 32-63, color me surprised that more commentators aren’t characterizing him as seriously vulnerable.

Wyoming (OPEN???) – Dave Freudenthal (D) term-limited?

Outlook: Safe Democratic if Freudenthal runs, Likely Republican pickup otherwise

Freudenthal is term-limited, but has been floating the idea of challenging the state’s term limit law in court, particularly since similarly worded state legislative term limits were overturned as unconstitutional a few years ago. Everyone seems to agree that Freudenthal is nearly unbeatable as an incumbent, but that few Democrats stands a chance in his absence.

OVERALL OUTLOOK: Gubernatorial races are looking to be the most fluid of elections in 2010, between term limits and a bevy of possible game-changing decisions by big names. With Democrats likely to stay firmly in the driver’s seat on Capitol Hill, Republicans would be wise to look for rebirth in governor’s mansions, as the gubernatorial map runs far less favorable to the Democrats in 2010, at least upon first glance. While the GOP will likely make a big sacrifice in California, and may be forced to defend Florida seriously should Crist seek the Senate seat, the Democrats will be playing major defense in New York, Michigan, and Pennsylvania, three key states for redistricting (Ohio is not yet in the bag either). Meanwhile, plenty of sitting governors sit on less than fantastic approval ratings, and many seem primed for an electoral scare. Of all offices being contested in 2010, governor’s mansions are, at this early date, on track to host the most volatile, crowded, and unpredictable election fights…and considering the implications (governors’ future high profiles, the role states as laboratories for national policy, and the more pedestrian question of redistricting), we should all be paying attention.
Redistricting 2011: Colo. & Minnesota

I am now on Episode 10 of my redistricting series, if you can believe it! Tonight we cover Colorado and Minnesota. I drew two maps for Minnesota — one if the Republicans hold Tim Pawlenty’s governorship in 2010, and the other if Democrats manage a gerrymandering monopoly. (The Dems have solid state legislative majorities, so that element seems set in stone.)

Previous efforts:

Diary 1: Massachusetts and Texas

Diary 2: Michigan and Nevada

Diary 3: Iowa and Ohio

Diary 4: Georgia and New Jersey

Diary 5: Florida and Louisiana

Diary 6: Pennsylvania and Utah

Diary 7: Illinois and South Carolina

Diary 8: Indiana, Missouri, and Oregon

Diary 9: Alabama, Arizona, and Kentucky

Jump below, if and only if you dare!

Colorado

The process here is fairly straightforward. Whether Democrats hold their current monopoly in 2010 or lose the governor’s mansion (the state legislature seems locked-in), incumbent protection will be the name of the game, aimed especially at solidifying Democratic Reps. Betsy Markey and John Salazar (most pointedly the former). Democrats would be foolish to try for a 6-1 majority and no one seems to think they’ll try it.

My map definitely solidified Markey without hurting DeGette, Polis, or Perlmutter, but it didn’t go as far as I hoped in protecting Salazar (my 3rd remains quite rural and is more of a swing district, but far from strongly Dem-leaning). Given the need to dole out favorable Denver suburbs to Polis, Perlmutter, and Markey, there’s little Denver-area turf left to give Salazar. What to do?

Colorado

District 1 – Diana DeGette (D-Denver) — all of Denver and 19% of Arapahoe preserves a solidly liberal district.

District 2 – Jared Polis (D-Boulder) — it may look rural and Rocky-heavy on the map, but the population anchors are Boulder County, which is kept whole, and Adams County, of which 35% is included. Less strongly Dem than before, but still plenty safe, with a moderate-liberal bent.

District 3 – John Salazar (D-Manassa) — my disappointment is that I only moved the needle a couple points in Obama’s direction here. It’s still very rural, and competitive in an open seat situation. There are big pockets of population in Grand Junction, Pueblo, and Jefferson County.

District 4 – Betsy Markey (D-Fort Collins) — New and improved for enhanced Democratic performance! 100% of Larimer, 65% of Adams, and 53% of Weld make for a safe district.

District 5 – Doug Lamborn (R-Colorado Springs) — meant to pack Republicans tightly.

District 6 – Mike Coffman (R-Littleton) — ditto in that this low-elevation “Colokansas” district packs GOP votes efficiently. I did cause some mischief by putting Coffman’s home in the 7th.

District 7 – Ed Perlmutter (D-Golden) — decidedly Democratic suburban Denver seat comprising half of Arapahoe and 80% of Jefferson.

Minnesota

This is the first state for which I drew two maps, one a Dem gerrymander and the other a bipartisan compromise map. Since Minnesota is expected to lose a seat for a new total of seven, there were some key differences in how I handled the dropped district (as well as how I drew the urban/suburban Twin Cities seats). Collin Peterson’s new 6th and Jim Oberstar’s new 7th are configured similarly in both maps, with Oberstar’s diluted a bit and Peterson’s shored up a tad to create two mildly Dem-friendly rural districts (though Peterson’s is still tough, especially with its geographical identity changing as population loss forces it to leech toward the Iowa border!).

I will run through the bipartisan map first since Republicans currently hold the gov’s mansion:

Minnesota Split

District 1 – Tim Walz (D-Mankato) vs. John Kline (R-Lakeville) — honestly, Walz vs. Kline was the only logical, not-too-awkward bipartisan incumbent showdown I could seem to configure. This district would be more or less evenly divided in partisan performance and evenly weighted in population between Walz’s southern base and Kline’s exurban territory.

District 2 – Erik Paulsen (R-Eden Prairie) — this map being the bipartisan variation, Paulsen gets a clearly more Republican district comprising Anoka County, 35% of Hennepin, and 26% of Carver.

District 3 – Betty McCollum (D-St. Paul) — anchored in Ramsey County, safely Democratic.

District 4 – Keith Ellison (D-Minneapolis) — 65% of Hennepin County, and that’s it, for a mostly urban Minneapolis district.

District 5 – Michele Bachmann (R-Stillwater) — I wanted to soak up all the Republicans I could find (and Bachmann will need them if she keeps up this way).

District 6 – Collin Peterson (D-Detroit Lakes) — how to protect Peterson without giving Oberstar an untenable district? Knowing the district would have to extend south, I tried to improve the PVI a bit by taking some rural Dem counties from his neighbor, but not move the needle too dramatically as that would jeopardize the esteemed Transportation & Infrastructure Committee Chairman.

District 7 – Jim Oberstar (D-Chisholm) — more of a swing district than before; Oberstar would be safe but Dems would have to fight for this as an open seat. Is it worth shoring up Peterson’s seat at the cost of making this one equally swingy? I’m no longer convinced.

Overall summary: two safe Dem seats (McCollum and Ellison), two relatively safe GOP seats (Paulsen and Bachmann), two swing seats that would remain safe for their current Dem incumbents (Peterson and Oberstar), one battleground (Walz v. Kline in the 1st).

And now, the hypothetical Democratic gerrymander should luck break our way in the governor’s race (and that certainly didn’t happen in 1990, 1994, 1998, 2002, or 2006, but I suppose the DFL is overdue for some good fortune in this given area):

Minnesota Dem

The two North Country districts certainly don’t look much different, but the other five, I think, would be quite altered under a Democratic plan.

District 1 – Tim Walz (D-Mankato) — this version mostly steers clear of the Twin Cities area and is heavier in small towns and southern counties that know and like Walz. I can’t knowledgeably estimate the presidential numbers here, but assume Obama would have still won, as I pointedly tried to avoid weakening Walz for other Democrats’ benefit.

District 2 – John Kline (R-Lakeville) vs. Michele Bachmann (R-Stillwater) — yay, a chance to eliminate Bachmann! Except that, based purely on factors of geography, media coverage, and name recognition, Bachmann would have a good fighting chance in a Republican primary here. Oh well, at least it’s an eliminated GOP seat.

District 3 – Erik Paulsen (R-Eden Prairie) — given how hard it will be to shore up Collin Peterson land without undermining Oberstar’s Iron Range seat, you can bet the Democrats would milk the Twin Cities for every vote they’re worth, and that means messing with Paulsen. Here his district comprises 58% of Anoka, 20% of Dakota, and 42% of Hennepin, for a moderately Dem-leaning/Obama-friendly suburban seat.

District 4 – Betty McCollum (D-St. Paul) — Give and take, give and take. So the 4th gets diluted a bit as it suburbanizes; it’s still plenty solid, but doesn’t waste votes as before.

District 5 – Keith Ellison (D-Minneapolis) — extends into Anoka County to hurt Paulsen but remains liberal and overwhelmingly Democratic.

District 6 – Collin Peterson (D-Detroit Lakes) — not a heck of a lot different than in the bipartisan map.

District 7 – Jim Oberstar (D-Chisholm) — ditto.

This map only includes one super-safe GOP seat, two very safe Dem seats, three swing seats that would be strong for their Dem incumbents (Walz, Peterson, Oberstar), and one swing seat that would be vulnerable to ousting its GOP incumbent (Paulsen).

Thoughts on either state are much appreciated!

Redistricting 2011: Ala., Ariz., & Ky.

Here is Episode 9 of my never-ending redistricting series, in which I cover three states (Alabama, Arizona, and Kentucky) with little in common demographically other than all voting for John McCain.

Previous efforts:

Diary 1: Massachusetts and Texas

Diary 2: Michigan and Nevada

Diary 3: Iowa and Ohio

Diary 4: Georgia and New Jersey

Diary 5: Florida and Louisiana

Diary 6: Pennsylvania and Utah

Diary 7: Illinois and South Carolina

Diary 8: Indiana, Missouri, and Oregon

Jump below!

Note that Arizona was originally intended to share a diary with New York, but the delay in the NY-20 election has forced me to put off a final New York plan (if Tedisco wins, my NY map applies, but if Murphy pulls it out in the final count, I need a do-over).

Alabama

The overriding goals here were clear, and are regardless of which party wins the governor’s mansion in 2010. Either a Republican or Democratic Governor will contend with a legislature controlled by conservative Democrats, and so protecting Rep. Bobby Bright of Montgomery will be Priority #1 (a major flaw in my reasoning here: if Bright loses to a Republican in 2010, a very real possibility, the 2nd will be preserved more or less as-is or made more Republican to accommodate the hypothetical freshman GOPer). Anyway, I assumed Bright survives 2010 and is the big winner from redistricting. As a direct result of protecting Bright, another winner is made clear, Republican Mike Rogers of Anniston (his district was carved to elect a Democrat in 2002 and, well, that didn’t work out, so for the sake of helping Bright, Rogers will get more favorable turf).

The other districts weren’t altered much; Artur Davis’ VRA-protected 7th was made a tad less heavily African-American but should still be about 60% so, keeping it clear from controversy, and the other four seats barely change at all in partisan or racial composition.

Alabama (split) width=500

District 1 – Jo Bonner (R-Mobile) — heavily Republican Gulf Coast districts stays mostly unchanged.

District 2 – Bobby Bright (D-Montgomery) — again, this map assumes he survives in 2010. Race tracking closely with partisan behavior in this state, the obvious tack was to boost the 2nd’s black population, so I dumped the district’s southernmost counties and anchored it in the eastern half of Alabama’s Black Belt, with the main population band stretching from Selma almost to the Georgia border, adding an arm up in Talladega.

District 3 – Mike Rogers (R-Anniston) — Rogers would now represent the only clear gerrymander in the state, and its lines are, I assure you, only as ugly as they are for a good purpose: I had to connect the heavily Republican counties northeast of Talladega with the heavily Republican counties bordering Florida’s Panhandle, so that meant creating a skinny north-south band along the Georgia line, in counties that were otherwise reserved for Bright. It’s unaesthetic, yes, but it gets the job done, and I wouldn’t be surprised to see legislative Democrats and Republicans agree on a plan like this for the mutual benefit of helping both Bright and Rogers.

District 4 – Robert Aderholt (R-Haleyville) — heavily Republican Appalachia-Tuscaloosa-exurban Birmingham mix.

District 5 – Parker Griffith (D-Huntsville) — as before, it’s socially conservative and mostly white, but with a good bench of local Democrats. Unlike Bright’s district, the 5th couldn’t be shored up much since there are no African-American areas nearby that aren’t necessary to keep the 7th VRA-protected.

District 6 – Spencer Bachus (R-Vestavia Hills) — meant to soak up every possible Republican between Birmingham and Montgomery.

District 7 – Artur Davis’ (D-Birmingham) replacement — Davis is running for Governor in 2010, but whichever Democrat succeeds him will retain a black-majority district anchored in Birmingham, Tuscaloosa, and the heavily black counties of western Alabama.

Arizona

The nonpartisan redistricting commission typically seeks to draw districts with geographical communities of interest in mind, and does little or nothing to protect incumbents. This means we shouldn’t expect a plan that explicitly shores up any of the three marginal Democratic districts (the rural 1st, suburban 5th, or mixed urban-rural 8th). While the 2001 plan created a new Hispanic-majority district for the Democrats and a competitive new rural seat (dubbed the 1st), I found that 2011’s map is due for a GOP seat in the suburban/exurban Phoenix area, based in fast-growing Pinal County. Since Arizona will be gaining two seats, the other may be of a less predictable nature, though everyone expects that it, too, will be based in metro Phoenix. My proposed 10th is a mixed Phoenix district with a considerable Hispanic population (one problem: said Hispanic pop. under my plan may be big enough to move the VRA-protected 7th out of majority-Hispanic status, which would be a non-starter).

One thing that made my numbers less-than-perfect was the lack of reliable data on Hopi Reservation population in northern Arizona (Hopi and Navajo areas are kept in separate districts due to traditional tensions between the two tribes). I used rough statistical guesstimates to separate the reservations into the 2nd and 1st, respectively. This, and my lack of certainty regarding the Hispanic percentage in Grijalva’s 7th District in this map, are the two potential demographic issues present here (and note that I used 2007 Census estimates, before 2008 numbers were available, making the data already obsolete).

All those caveats aside, I think the general spirit of Arizona’s next district map is present here:

Arizona (I) width=500

District 1 – Ann Kirkpatrick (D-Flagstaff) — still rural with the highest Native American population in the state. Personally, as someone who is admittedly ignorant about Hopi/Navajo history, I think it unfortunate that the tribes insist on being separated, since moving the Hopi reservation into this district would put its Native population over 25% and possibly close to 30%, a clear VRA opportunity when coupled with the district’s Hispanic and other minority populations.

District 2 – Trent Franks (R-Glendale) — though it appears rural, this district is a lot more Maricopa County-heavy than one might assume.

District 3 – John Shadegg (R-Phoenix) — Republican neighborhoods of Phoenix and suburban Maricopa County keep Shadegg in the clear, for the near future at least.

District 4 – Ed Pastor (D-Phoenix) — combines the Latino neighborhoods of Phoenix to remain a strong VRA seat.

District 5 – Harry Mitchell (D-Tempe) — as before, this comprises traditionally Republican Phoenix suburbs that are trending the other way with time. In Mitchell’s current 5th, Obama garnered a respectable 47%, though I haven’t a clue how he would have fared in my 5th since my method is so low-tech and crude.

District 6 – Jeff Flake (R-Mesa) — weary though I am of this guy and his precious privileged resolutions, this 6th would stay safe for him.

District 7 – Raúl Grijalva (D-Tucson) — if the Hispanic pop. is under 50-55% in this proposed Maricopa-free iteration (and it may indeed be), then it is worth a reconfiguration, this time using 2008 stats. Regardless how accurate my map may or may not be, the commission will ensure a VRA majority-Hispanic seat for Grijalva.

District 8 – Gabrielle Giffords (D-Tucson) — now very Tucson-dominated and free of Hispanic-majority Santa Cruz County.

The new District 9 – anchored in Pinal County with significant chunks of Maricopa and Pima for a Republican-leaning suburban/exurban seat between Phoenix and Tucson.

The new District 10 – entirely within southwest Maricopa County, possibly Hispanic opportunity (but cannot dilute the Hispanic pop. in District 7, so I question whether the commission would draw something quite like this…I’m a bit more certain of the rough boundaries for a new GOP seat in District 9).

This being a commission-run redistricting process, no incumbents are deliberately protected, and only logic, geography, and racial consideration go into the process. It’s a double-edged sword, really, but makes a private citizen’s map-making simulation much simpler (no gerrymandering to help Congressman X, that is). Other than my possible trespass in District 7, I’m not aware of any probable controversy with boundaries roughly akin to these.

Kentucky

Like Alabama, the process here is likely to be split between the parties, and Democrats are assured a strong hand by holding both the governor’s mansion and the House. Even if redistricting is delayed after the 2011 elections and a Republican is elected Governor, the Democratic House majority seems too large to overcome in a couple cycles, making it likely that Rep. Ben Chandler (D-Versailles) will be protected (and that, of course, assumes he doesn’t run for another office in 2010 or 2011). Making Chandler’s 6th a tad more Democratic for future insurance was the only clear priority of this map, which otherwise leaves lines mostly unaltered.

Kentucky (split)

District 1 – Ed Whitfield (R-Hopkinsville) — expands in area due to lagging population growth, but remains strongly Republican and mostly rural or “small town”.

District 2 – Brett Guthrie (R-Bowling Green) — changes only minimally, remains GOP-friendly with several pockets of urban population and (somewhat outnumbered) Democratic votes.

District 3 – John Yarmuth (D-Louisville) — comprises 99.7% of Jefferson County, and that’s it. Talk about simple!

District 4 – Geoff Davis (R-Hebron) — looks virtually identical to its prior incarnation as an Ohio River-based, heavily GOP district.

District 5 – Hal Rogers (R-Somerset) — heavily rural and Republican, possibly the most socially conservative seat in Kentucky, but drops some traditionally Dem areas for the 6th’s benefit, picking up the slack elsewhere.

District 6 – Ben Chandler (D-Versailles) — McCain won Chandler’s current 6th 55-43 but the incumbent is very popular and is likely unbeatable. Still, he has long held statewide ambitions, and one of these days he will vacate for bigger things, making it a priority for House Democrats and the Governor to shore up the 6th for a future Democratic candidate. Thus, an equestrian-heavy Central Kentucky seat is reconfigured as a Frankfort-Lexington-coal mines district with stronger Dem history. McCain may still have won here, but not with more than 51-53%, making it that much easier for a future Dem to win.

Other states I hope to cover soon include: Colorado, Kansas, Maryland, Mississippi, New Mexico, Oklahoma, and West Virginia. There are some key states (among them, California, Minnesota, North Carolina, Tennessee, Virginia, Washington, and Wisconsin) that could or will require two maps each based on different hypothetical outcomes regarding seat distribution or partisan control. It isn’t clear what the seat count will be in California, North Carolina, or Washington, and in the other four states, partisan control of redistricting is utterly up in the air between now and after the 2010 elections. So most likely, these states will be those that I cover last.

Redistricting 2011: Ind., Mo., & Oregon

This, Episode 8 of my never-ending redistricting series, is a diary of firsts. It is the first time I have covered three states instead of the customary two (the reason being that I was pairing a larger state with a smaller one, and this diary covers three mid-sized states), and the first time I have covered a state not expected to either gain or lose seats in the next reapportionment (Indiana, which should hold even at 9 seats).

Previous efforts:

Diary 1: Massachusetts and Texas

Diary 2: Michigan and Nevada

Diary 3: Iowa and Ohio

Diary 4: Georgia and New Jersey

Diary 5: Florida and Louisiana

Diary 6: Pennsylvania and Utah

Diary 7: Illinois and South Carolina

Jump below!

First, why these three states? Well, they are three states of contrast. Number-crunchers anticipate that Oregon will gain a seat, Missouri lose one, and Indiana hold even after the 2010 Census and resulting reapportionment. (I should note that Oregon and Missouri are both on the fringes; a slowdown of Midwest-West migration in the next year could easily keep both at their current sizes, preventing Oregon from hitting 6 seats and saving Missouri from dropping its 9th spot). Further, the map in Oregon is likely to be drawn by Democrats, in Indiana by Republicans, and in Missouri through bipartisan negotiation (Republicans dominate the legislature, but the Governor is Democrat Jay Nixon, and his veto authority should force a relatively incumbent-friendly map).

First, Indiana

As if the redistricting process weren’t already enough of an ego-driven, virulently partisan power grab in most states, Indiana makes it worse; even though the Democrats run the state House, Republicans are almost assured to ram through a GOP-friendly gerrymander. This is because Indiana gives the legislature two ways to go about drawing maps: the chambers can work together to pass a consensus map (since the Senate is in GOP hands and the House under Dem control, this would likely mean incumbent protection), or if one party has both the governor’s mansion and one chamber of the legislature, that party has the power to draw the maps regardless of who runs the other chamber. This is a unique provision, from what I can tell, and not one of which I particularly approve (why have two chambers if one of them can bypass the other by dealing with its own party’s governor?). But at least you can’t accuse the Republicans alone of abusing it; Democrats rammed through their own map in 2001, which a large part of why Joe Donnelly and Brad Ellsworth are now in Congress. Since GOP leaders in the Senate are unlikely to want a feel-good compromise after seeing the Dems get their way last round, I’m counting on the most aggressive possible GOP map in the state.

The good news is this: the Democrats have three marginal districts, and because of trends in the state, I believe the Republicans can only dismantle two. Who are the unlucky two? As I see things, they are Donnelly and Baron Hill. (I don’t remember which poster here on SwingStateProject originally suggested such a situation to me, but whoever you are, I now think you’re 100% right!)

“What?”, the astute SSP junkie is thinking. “Obama won IN-02 easily and tied in IN-09…why wouldn’t they go after Ellsworth, whose district McCain won by a modest margin?”

The answer is two-pronged: first, wrecking Donnelly’s seat is not that hard, even if Northern Indiana does lean Democratic nowadays. Dem votes can easily be packed into Pete Visclosky’s already-safe and very slow-growing district, leaving the 2nd District a lot more Republican and small town/rural-dominated. But in Southern Indiana, there is enough Democratic support between the 8th and 9th Districts that both cannot reasonably be cracked. Between Obama nearly winning the 9th, and doing respectably in the 8th, an effective gerrymander will ruin Dem chances in one seat while packing blue-leaning counties into the other. The reason for solidifying Ellsworth and targeting Hill? Ellsworth has a proven track record of hugely over-performing the Democratic base vote, while Hill’s bipartisan popularity is less established. That, and many of the Dem-friendly cities in the region (Terre Haute, Evansville, Bloomington) fit better geographically in the 8th. I believe Republicans see Ellsworth as more capable of surviving an unfriendly map than Hill, which is why they will do the unthinkable by effectively ceding (for the next few cycles, anyway, or as long as Indiana remains a closely-divided state) the famed Bloody 8th to the Democrats.

Here’s what I see in the cards:

Indiana (R)

District 1 – Pete Visclosky (D-Merrillville) — with all of Lake and Porter Counties, and nearly half of LaPorte, this is a quintessential Democratic seat along the lakeshore.

District 2 – Joe Donnelly (D-Granger) — outside of Dem-leaning St. Joseph County being intact, there’s little for Donnelly to like about this district. The Obama vote is still probably in the mid-40s here, but no doubt this is would be a Republican seat in most election cycles. Donnelly should take a serious look at statewide office if he gets dealt a hand like this.

District 3 – Mark Souder (R-Fort Wayne) — solid GOP seat centered on Allen County.

District 4 – Steve Buyer (R-Monticello) — I thought of diluting this hyper-GOP district a bit to hurt Ellsworth but realized that the lines would start to get bizarre and that, as mentioned in the intro, there are too many Democrats in western and southern Indiana to be cracked up without influencing at least one district.

District 5 – Dan Burton (R-Indianapolis) — I think the current lines in this district are silly and prefer my more compact version, still safely Republican but not so “stretchy”.

District 6 – Mike Pence (R-Columbus) — to help the odious Pence just a tad (he doesn’t need much), I gave Obama-supporting Madison County to Burton to split up the swingy/moderately Dem-friendly Anderson/Muncie/Richmond area between two GOP districts.

District 7 – André Carson (D-Indianapolis) — entirely within Marion County, as before, and still strongly Democratic.

District 8 – Brad Ellsworth (D-Evansville) — all Ellsworth seems to need to win easily is the combined electoral power of Terre Haute and Evansville, so putting on my bizarro world GOP thinking cap, knowing that it would be easier to dislodge Hill, I attempted to give Ellsworth an actual Democratic seat, one that would have voted for Obama. The coup de grâce, both for packing the 8th with Democrats and for cracking the 9th, was the addition of Monroe County (Bloomington) with its Obama-crazed college students. For a Republican mapmaker, making Ellsworth Congressman-for-life is a small price to pay for winning back the 9th (possibly with Mr. Déjà Vu himself, Mike Sodrel).

District 9 – Baron Hill (D-Seymour) — He is likely toast as these lines are drawn, since his tougher battles (2002, 2004, 2006) were all made or broken by Dem GOTV in Bloomington. While the district lacked Bloomington back in its 1990s iteration, southeast Indiana was also very accustomed to Lee Hamilton back then, and Hill was clearly the beneficiary of some lingering Hamilton popularity both in 1998 and 2000. As for this take on the 9th, a couple of its Ohio River counties are traditionally Democratic, but the district is more rural and conservative than ever before, so conditions would be just right for Sodrel to finally triumph after losing three of his last four races against the venerable Hill. With a district this unfriendly, Hill might also consider statewide office. He ran respectably against Dan Coats in 1990…and Richard Lugar will be 80 years old in 2012. I’m just saying!

While this map is bad from a Dem standpoint, its worst possible scenario is a 6-3 GOP edge, not as bad as the 7-2 delegation seen between 2004 and 2006. Back then we fretted about the real possibility of 8-1, given Julia Carson’s repeated underwhelming performance in the 7th…thanks to Indianapolis turning deep blue and most of southern Indiana moving into swing territory (with some clear Democratic strongholds), 6-3 seems bad in the context of Indiana circa 2009. So, from a broad perspective, Obama genuinely changed the game for the Democratic Party in Hoosierland. And who knows…by 2012, maybe even this unfriendly version of the 2nd District could be held.

Missouri

With a GOP legislature and a Dem Governor, this is an entirely different story. The Show Me State should shed a seat if projections are accurate, but actually surprised demographers a bit by growing sufficiently between 2007 and 2008 to regain a notional loss from 2006. So it wouldn’t be too odd if Missouri rebounded enough before the 2010 Census to barely hang on to that 9th seat, possibly depriving a state like Oregon, Washington, North Carolina, or Texas from adding another.

The real question for me was which districts to combine. With power balanced between the parties, it was obvious that one Republican and one Democrat had to face off in a “fair fight” district, leading to an obvious solution: a suburban St. Louis seat forcing Todd Akin (R) and Russ Carnahan (D) together. I tried to draw a district that would be as close to 50-50 as possible for this purpose, knowing the legislature won’t draw anything too friendly for Carnahan’s south-of-the-city base, and that Gov. Nixon would balk at a map too heavy in Akin’s northern suburbs.

The other problem in Missouri was what to do with Ike Skelton’s (D) heavily Republican district spanning the rural areas between Kansas City and Columbia. I figured that a bipartisan plan means incumbent protection, and the Democrats know Skelton will be 81 when the 113th Congress convenes and is not far from retirement. I thus drew a swing district stretching from the close-in Kansas City suburbs to college town Columbia that would not only easily reelect Skelton, but provide a future Dem with a decent shot at holding the 4th District.

I do have one question, though, about this: Missouri redistricting authority was split in 2001, with a Democratic Governor and House, and a narrowly GOP-controlled Senate. Bipartisan plans almost always help incumbents; why on earth didn’t Skelton get a stronger district then? Perhaps mapmakers knew he would be around for the duration of the decade, and didn’t care to gerrymander more friendly territory for future insurance?

Anyway, other than eliminating a St. Louis seat and shoring up the 4th, this map doesn’t do a lot else of interest. As a result of Blaine Luetkemeyer’s inconvenient choice of residence in Miller County, and Ike Skelton’s wholesale capture of Boone County, the 6th is unaesthetic, but the other districts are reasonably shaped.

Missouri (split)

District 1 – William “Lacy” Clay, Jr. (D-St. Louis) — all of the city of St. Louis as well as 39% of St. Louis County. VRA-protected as a black-majority seat, so if my lines don’t fit those guidelines, ignore them and assume I preserved an African-American majority here.

District 2 – Todd Akin (R-Town and Country) vs. Russ Carnahan (D-St. Louis) — I realize Carnahan lives in St. Louis itself, but compactness suggests keeping the city whole in District 1, so he’d do well to move to the county. The remaining 61% of decidedly Democratic St. Louis County is here, along with 37% of Akin-friendly St. Charles, so clearly I was aiming for a swing seat either man could win.

District 3 – Blaine Luetkemeyer (R-St. Elizabeth) — the loss of Dem-leaning Boone County is counteracted by the addition of most of Jefferson County, but overall the district favors a Republican, ideally from the greater St. Louis area.

District 4 – Ike Skelton (D-Lexington) — you can’t imagine what it took to get a swing seat out of this territory without violating population equality laws! I don’t know why legislators didn’t try to protect the 4th for future Democrats back in 2001, but with Skelton’s exit from Capitol Hill just a cycle or two away, now is the time to dramatically reshape the 4th’s boundaries, whether the rurally inclined Armed Services chairman likes it or not. Between the competitive counties north of Kansas City and the Dem base in Columbia, this district could actually be held when Skelton retires, unlike the current Charlie Stenholm-like rural monstrosity he represents. If Skelton announces his retirement ahead of redistricting in 2011-12, there’s actually a good chance the district will be eliminated entirely, but without that foresight I had to attempt a genuine shoring-up.

District 5 – Emanuel Cleaver (D-Kansas City) — I’m proud that I was able to help “blueify” the 4th while respecting the ideal of compactness in putting Jackson County whole in the 5th. It would have been a lazy solution to split Kansas City itself between the districts, and so I did otherwise, while still moving the 4th’s PVI a good 10 points more Democratic.

District 6 – Sam Graves (R-Tarkio) — because Skelton picks up its Kansas City burbs, this is now a big blob of rural Missouri goodness, as heavily Republican as ever.

District 7 – Roy Blunt (R-Strafford) or his 2010 replacement — still the heavily evangelical southwest Missouri seat, the most conservative district in the state.

District 8 – Jo Ann Emerson (R-Cape Girardeau) — other than a couple exurban St. Louis-area counties, this district is dominated by small towns and is safely Republican.

So there would be four safe Republican seats, two safe Democratic seats, and two swing seats (one of them safe for an incumbent Democrat as long as he chooses to run). Believe it or not, this is probably the closest thing to a Dem-friendly map one could get from today’s Missouri legislature.

Finally, Oregon

While Democrats must defend the governor’s mansion and both chambers of the state legislature in 2010, observers tend to agree that they have the upper hand to retain the monopoly heading into redistricting, giving them the opportunity to decide how to configure the state’s likely new seat. The only problem is that Dem strength is already more or less maximized, with a lopsided 4-1 delegation in a 57-40 Obama state.

Is it realistic to try for 5-1, or should Democrats aim to protect what they have and concede a likely 4-2 split? I initially thought that the latter solution was inescapable, but upon crunching the numbers myself, concluded that it was possible (if risky) to carve five Dem-leaning seats and one ultra-Republican district.

Under my plan, one of the five seats could, however, easily switch to the GOP in an unfriendly election cycle. In a downright terrible year like 1994, two easily would. But in a generic stalemate election year, a 1998 or 2000 sort of situation, and certainly in a Democratic wave year like 2006 or 2008, 5-1 would be the expected outcome.

I weakened both Portland incumbents, David Wu and Earl Blumenauer, to help Kurt Schrader and allow for the creation of a new Dem (or swing, at worst) seat based in Washington County. As notanothersonofabush pointed out, diluting Blumenauer’s district may not have been the greatest idea considering his staunchly liberal voting record, but with a strong Portland base mostly intact, he should be okay under my map.

While Greg Walden would probably choose to run in the über-Republican 2nd I drew, I did choose to mess with him a bit too by putting his home, in heavily Democratic Hood River County, in Blumenauer’s 3rd. All in a day’s work…

Oregon (D)

District 1 – David Wu (D-Portland) — The 37% of Multnomah County included dominates, with 50% of Marion County serving as a secondary population anchor. I wanted to give Wu as diluted a Dem-leaning district as possible given the need to milk every last precinct in Oregon redistricting.

District 2 – Greg Walden (R-Hood River) — Move, Congressman, and get yourself life tenure in Congress under my plan. Medford/Ashland is the only obvious source of Democratic strength anywhere in this vast rural seat.

District 3 – Earl Blumenauer (D-Portland) — I’m actually a little worried about Blumenauer, one of my personal favorites in Congress, in this map. With 31% of Multnomah along with Hood River and Wasco Counties, he should have enough of a Dem base to win, but might he be too progressive for this district? Splitting Portland three ways was meant to “spread the love” and help Schrader, while splitting the more conservative areas around Salem was meant to do the opposite (“share the pain” to lessen its influence), but have I diluted Democratic numbers out of Multnomah too much to give them power in all three districts?

District 4 – Pete DeFazio (D-Springfield) — Lane County is intact and the conservative reaches of southern Oregon are gone; even the solid liberal that seeks to succeed DeFazio some years down the road will be safe here.

District 5 – Kurt Schrader (D-Canby) — oddly, I probably made it safer than Blumenauer’s district by drawing a district for Schrader that stretches from Lincoln County/Corvallis to Portland. Knowing what I know now, I might not have gone so out of my way to shore up the 5th and instead work to prevent extreme dilution of the 3rd and its Portland base.

And the new District 6 – Washington County and 27% of Clackamas — this is designed to elect a moderate Washington County Democrat; it should be the swingiest of the five Dem seats, but with a narrow yet distinct lean akin to the 3rd’s. Oregonians will be more familiar with the local bench than I.

At the very least, this admittedly flawed map creates five districts that voted for Obama and one that packs McCain votes. But Obama performance does not necessarily equate to Democratic performance at the congressional level. The 3rd, and especially the 6th, could be disposed to a charismatic, moderate Republican in certain cases. The good news is that the entire West Coast from Puget Sound to San Diego has been trending liberal for the past 20 or so years and is getting less and less tolerant of even the most likable Republican candidates. Thus time is working against the viability of GOP candidates in traditional “swing districts” in a state like Oregon, and assuming Democrats retain control of the redistricting process, they will have an unprecedented chance to get aggressive in the Beaver State (even if the legislature deadlocks with the governor on forming a plan, the Secretary of State, Democrat Kate Brown, is authorized to draw her own map). So before too long, even my arguably marginal 3rd and 6th Districts should be out of reach for GOP contenders.