IN-06: It’s Barry Welsh’s Birthday!

My name is Betsy Decillis and I am the Finance Director for the Barry Welsh for Congress Campaign.  I’ve got some exciting news!

First off, today is Barry’s birthday.  He turns 49 years young and I wanted to make sure everyone had a chance to send him their well wishes.

Secondly, you can still get Sherri’s recipe for Double Chocolate Drop Cookies!  Just donate $12.10 in honor of Barry’s Birthday here and she will e-mail you the recipe.  Thanks to everyone that has donated so far!

Call to action – Congressional House candidates needed in Texas

Candidate filing in Texas closes in less than a month – 2nd January – and we still don’t have confirmed candidates in a large number of Congressional House districts!

Once again go and take a look at the  

2008 Race Tracker Wiki.

Below the fold for details………….

Texas has 32 Congressional House districts. 13 are held by Democrats who according to the Texas Dems website are all running again as follows: (Note that I have included the Cook PVI scores for each district also.)

TX-09 – D+21,

TX-15 – D+3,

TX-16 – D+9,

TX-17 – R+18,

TX-18 – D+23,

TX-20 – D+8,

TX-22 – R+15,

TX-23 – R+4,

TX-25 – D+1,

TX-27 – R+1,

TX-28 – R+1,

TX-29 – D+8,

TX-30 – D+26,

That leaves 19 Republican held districts.

Again according to the Texas Dems website there are challengers in 4 of those 19 districts:

TX-04 – R+17,

TX-10 – R+13,

TX-26 – R+12,

TX-31 – R+15,

These four districts thus have candidates that have officially filed. That leaves 15.

Five further districts have confirmed candidates that are yet to file officially:

TX-03 – R+17,

TX-07 – R+16,

TX-08 – R+20,

TX-13 – R+18,

TX-32 – R+11,

That leaves ten districts with no confirmed candidate – yep more than half of the GOP held districts have no Democratic candidate at this point!

And here they are:

TX-01 – R+17,

Not a peep of a candidate here!

TX-02 – R+12,

Conrad Allen announced that he was forming an exploratory committee, set up a campaign website (now defunct) and disappeared off the face of the earth.

TX-05 – R+16,

Not a peep of a candidate here!

TX-06 – R+15,

Not a peep of a candidate here!

(our 2006 candidate is definitely not running either.)

TX-11 – R+25,

After Brad Vincent withdrew earlier this year Floyd Crider has apparently been collecting petition signatures but has yet to file with the TDP or the FEC and does not yet have a campaign website. Any further news on him?

* This is one of ten districts we did not contest in 2006!*

TX-12 – R+14,

Not a peep of a candidate here!

TX-14 – R+14,

We had a candidate then he switched parties!

(2006 candidate is out.)

TX-19 – R+25,

Not a peep of a candidate here!

TX-21 – R+13,

Not a peep of a candidate here!

TX-24 – R+15,

According to a comment at Daily Kos a real estate agent Bill Eden has filed. He hasn’t yet filed with the TDP or the FEC.

Less than a month to go and we need 10 candidates – do you know anyone that could run?

Calling All Millionaires!

“We have been very fortunate in our recruiting efforts.  There will be a number of credible Republican challengers running for Congress next year that happen to have access to personal financial resources. They are in position to run strong, well-financed grass-roots campaigns next year in some of our top targeted districts.”

Ken Spain, National Republican Campaign Committee spokesman

When the polls don’t look so hot and when the money runs out, who do you turn to in order to rebuild?  Why, the grassroots, of course.

Facing a potentially crippling financial disadvantage against their Democratic counterparts, the NRCC is turning to their “base” — of insanely wealthy people — in order to kill two birds with one stone: plug some crucial recruiting holes where more established candidates have taken a pass, and help lessen the committee’s load by opening up their own bank accounts in a gambit to make these seats competitive.

Let’s take a look at some of these brave rank-and-file Republicans, who put down their ruby-studded walking sticks and answered the NRCC’s call to wage caviar-powered grassroots campaigns against Democrats this next year.

  • NJ-03: In any other year, Republicans may have fielded Diane Allen, a popular state Senator, to replace retiring Rep. Jim Saxton in this swing district.  Here’s the problem: Allen came a-knockin’ on the NRCC’s door, hoping to score $2 million in outside assistance in order to buoy her chances.  The cash-starved GOP must’ve came up short, because Allen pulled the plug on her bid last week.
  • So who is the NRCC looking to tap here?  Look no further than the defense industry, a key “grassroots” constituency in the Republican Party.  Their ranks have produced Christopher Myers, a vice president at Lockheed Martin and “a real man’s man“.  Allen may have had the moderate creds and a proven ability at winning blue areas in a district that Al Gore won by 11 points in 2000, but Myers has the fat stacks of war booty that he can put to good use.  A no-brainer.

    • CT-05: Put yourselves in the NRCC’s shoes here.  Let’s say you’ve already recruited a fresh-faced state Senator, David Cappiello, considered a up and comer in local circles, to take on freshman Democratic Chris Murphy.  He’s raised some respectable cash and seems presentable.  The only snag?  

    Projection: Democrats Would Pick Up 25 More House Seats

    (Fascinating stuff; be sure to check below the fold for the full analysis.  What’s your take? – promoted by James L.)

    Based on recent generic ballot polls and the current distribution of Republican incumbent and open seats, Democrats would pick up about 25 more House seats in the 2008 election if it were held today.  Republicans might pick up a couple to offset that.

    And that’s before we account for future Republican retirements and the massive fundraising advantage Dems have this year.

    Of course, the generic ballot numbers will probably change over the next year, one way or the other.  Here’s how the number of House seats Democrats would win varies as the Democrats’ generic ballot advantage changes so you can keep track at home (based on retirements known as of November).  

    Free Image Hosting at www.ImageShack.us

    Click to enlarge.

    The colored bands show the maximum and minimum calculations, but the actual numbers are most likely to be close to the solid lines.  Currently the average Democratic generic ballot advantage is about 12; the max I’ve seen this year is 18, the min is 7.

    Below, the explanation and the fine print.

    Cross posted at DailyKos and Open Left.

    Bonus Fun Calculation

    If  Democrats in 2006 had had the same wealth of seats available to them to contest as Republicans did in 1994, they would have picked up an estimated 59 seats!  This means the election of 2006 was just as big a win for Democrats in terms of performance as the election of 1994 was for Republicans.

    The Fine Print

    1.  These calculations are based on the average generic ballot advantage in the final week of the campaign, which we don’t know yet.  All we know are what the current polls say.  So if Democrats maintain their current generic ballot advantage through the end of the campaign season, then we would expect 25 more Democratic seats.

    2.  The calculations are based on the current known Republican retirements in the House.  The more Republican retirements, the better for Democrats.  I will post an update later in 2008 once retirements have settled out.

    3.  I assume that the campaigns and party strategies in 2008 will be similar enough to those in 1994-2006.  This assumption could be wrong, if, for example, Democrats work just as hard at challenging incumbents as they do at going for open seats.  In that case, the current estimates would be a few seats too optimistic (but the generic ballot advantage would likely increase by a large amount and more than offset that).

    4.  Strictly speaking, we wouldn’t want to make any predictions for a generic ballot advantage greater than what we saw in 2006, because it is beyond the range of previous experience.  I wouldn’t worry too much about going a little beyond the generic ballot advantage of 2006, but once we get up into the 18 point generic ballot advantage range, things get uncertain.  And at that point, who cares about predictions?  It would be celebration time….

    Predicting the House

    The relationship between generic ballot numbers and the numbers of seats won by Democrats is not that great.

    Why not?  After all, the generic ballot number takes into account every major and minor factor in individual races, including the national mood.  

    The problem is that the number and distribution of seats held by each party varies over time.  For example, in 1994, Republicans had a rich field of conservative and moderate districts held by Democrats to try to take.  Today, there are far fewer.  (Another problem may be changing political habits over long periods of time.)  Previous calculations that took the distribution of seats into account for the 2006 election were almost exactly right.

    In this diary, I use the eight most recent elections to create a way to calculate the number of incumbent or open seats won by either party.  The only numbers needed for this calculation are the Democrats’ generic ballot advantage (from polls), the percent support for Bush in 2000 in each district, and the status of each race (incumbent Democrat, open seat held by Democrat, incumbent Republican, or open seat held by Republican).  Note that the best way make these calculations is to run thousands of simulations and count up the outcomes, something I did not do.

    The Details

    So, how does partisan makeup of a district relate to the chance of a seat switching parties, on average?  In 2006 we had a lot of seats switch from Republican to Democrat – so we can try to answer this question for the R to D switch at least.

    Here’s a graph showing the percent chance that a seat switched when the incumbent was a Republican.  The data are divided into categories with a range of 3 points in Bush’s 2000 vote.  Please note:  this graph, or any of the following, is not useful for predicting the chance of a specific seat changing parties in the 2008 elections.

    Free Image Hosting at www.ImageShack.us

    Click to enlarge.

    There’s a regular and not unsurprising pattern here.  Democrats were more likely to win in the more moderate districts.  Looking at the data another way (not shown) leads me to believe this is pretty close to the shape of a common type of curve, so we can model it:

    Free Image Hosting at www.ImageShack.us

    Click to enlarge.

    The ‘center’ of the curve shows us where Democrats were able to win 50% of the Republican seats: in districts where Bush received 44% of the vote.  Now let’s add in open seats held by Republicans:

    Free Image Hosting at www.ImageShack.us

    Click to enlarge.

    With far fewer open seats, the data points look far less organized.  Note that the curve for open seats shifts 8 points to the right.  This shows us the total advantage of being a Republican incumbent.  Of this advantage, 2 points can be accounted for by the inherent incumbency advantage identified after taking fundraising into account (name recognition and so forth); the rest is probably attributable to stronger opponents with more money running for open seats.

    These curves have two numbers that are used to describe them: one tells us where the center is – what the level of Bush support was in 2000 in districts where Democrats won 50% of the time – and the other tells us how steep the curve is.  The steepness is about the same for incumbents and open seats.  

    At this point we could quit and go home and use these curves alone, because as it turns out, the generic ballot for 2008 is sitting right about where the generic ballot for 2006 was.  But we’d like to get some idea of the possible range we might see for a given generic ballot number, and what happens if the generic ballot numbers change.  

    The only other recent year with a fair number of Democrats winning Republican seats is 1996, but it’s still not enough to get a very accurate curve.  Even so, when you look at the numbers, the steepness is not significantly different from the 2006 curves.  The center is shifted 7 points to the left.

    But what about the other years?  It turns out we have another way to estimate the center.  We can plot the percent that voted for the Republican in each district versus the percent Bush had in 2000, and with a regression curve, estimate where half the Republicans lose (fall below 50%), which is our number for the center of the curve.  Several different types of regressions lead to similar numbers.

    If we assume the curves all had the same steepness in every year, we can check our estimates by seeing if we can predict how many Republican seats Democrats won in each year by multiplying the number of districts with a given support of Bush in 2000 by the chance that districts with that level of support were won by Democrats.  This is repeated for incumbent seats and open seats.  The center is shifted 8 points to the right for open seats.  As it turns out, these estimates work great.  

    Repeating the process for Democratic-held seats, using the 1994 election as a basis, is a little trickier because Democrats seem to be a lot better at holding on to seats in conservative districts.  The upshot is the estimates of Republican wins of Democratic seats have a lot more error associated with them.  Fortunately, right now the generic ballot is in the range where even a large relative error in the number of seats picked up by Republicans doesn’t make much difference – 1 plus or minus 300% is still only a few seats.  But, what we can do now is generate some rough curves for Democratic seats in 2006, even though no Democrats lost their seats.  And for fun, let’s look at 1994 too.

    Free Image Hosting at www.ImageShack.us

    Click to enlarge.

    One thing that jumps out is that Democrats seem to have a much bigger total incumbency advantage than Republicans.  This, again, may be related to the tendency of Democrats who represent conservative districts to retain their seats.  Or, the Republicans maybe have a bigger actual total incumbency advantage than the 8 points found above.

    Now, the key question: can we predict where the center of these curves will be from polling data?  Here’s a graph of the estimated or modeled center versus the final week’s generic ballot advantage for Democrats running against Republican incumbents:

    Free Image Hosting at www.ImageShack.us

    Click to enlarge.

    Looks good.  Two points are hollow – 1994 and 1996 – because I am not sure I have all the polling in the average (the other years came from pollingreport.com).  The line is about the same with or without those two points though.  The dashed lines show the range we expect the center to be in 95% of the time, given a known generic ballot advantage.  So now we have a way to relate the generic ballot to the center of our curves up above, and we can use the curves to estimate the number of Republican seats won by Democrats:

    Free Image Hosting at www.ImageShack.us

    Click to enlarge.

    Not too shabby.  If you split it up between open and incumbent seats, the calculations for incumbents are usually a little too optimistic, and the calculations for open seats are a little too pessimistic.  This might mean the actual total incumbency advantage for Republicans is more like 10-12 points than the 8 points calculated above for 2006.    

    Repeating the exercise with Democratic-held seats results in a much greater error, as there was more error in generating the curves for each year, but again, this doesn’t matter much at the current generic ballot range.

    Thus Ends the Adventure

    This is the last in a short series related to House elections.  Other diaries discuss the current political climate nationally and factors such as retirements, recruitment, and fundraising in the House races; the the changing landscape in the House since 1994 as far as the seats controlled by each party; the change in voting behavior at the presidential level from 1988 to 2004 (with an eye towards the next redistricting session); and finally, two more diaries showing how much various factors (money, incumbency, party, scandal) hurt or help candidates for the House on average.

    Congressional District Analysis: Median Income, Rural vs. Urban, and Democratic vs. Republican

    This is the second in a series of analysis of congressional districts.

    Note that one should not use these analyses to make statements about individuals. That’s called the ecological fallacy, and it can lead you very far astray, very quickly.

    Also, please ask questions.  Don’t look at the graphs and equations and run away…..ask.  There are no dumb questions*.  I will *not tell you you are stupid for asking.  Statistics is confusing to lots of people, not just you!  So ASK!

    Today, I started off by looking at median income and Cook PVI.  That led to other things.  More below the fold

    (cross posted from DailyKos)

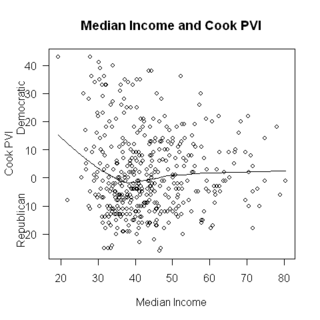
    My suspicion, before looking at the relationship between median income and Cook PVI was that higher median income districts would be more Republican.  I did know that some high income districts were quite Democratic, but I thought these were exceptions.  Well, one reason to explore the data is to see whether your suspicions are correct.   Here’s a graph of median income and Cook PVI across 435 districts:

    My favorite professor in grad school used to say “If you’re not surprised, you haven’t learned anything”.  I’m surprised, but what can we learn?

    The very poorest districts are, indeed, very Democratic. At the extreme, the poorest district (NY16) is also the most Democratic (Cook PVI is D + 43).  But above a median income of about 30,000, there is only a modest relationship, and, what there is points to wealthier districts being more Democratic….. hmmm.

    When results surprise you in this way, one thing that may be going on is that there is some third variable that is affecting the relationship.  I know that people in rural areas have different views than those in urban areas….

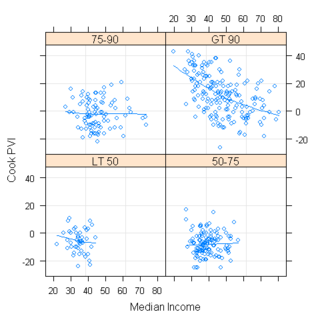
    The language I used to draw these plots R offers a tool called conditioning plots, that lets you look at three variables in an interesting way.  You divide the third variable into groups, and then plot the first two in each group.   Easier to show than tell:

    Each panel of the graph is congressional districts of a certain level of urban-ness.  The lower left is less than 50% urban, lower right is 50-75%, upper left is 75-90% and upper right is over 90% urban.  (Note, it is probably better to think of ‘urban’ as ‘urban or suburban’ or, perhaps ‘rural’).  This is interesting!  

    First thing that strikes me is that there is almost no relationship between median income and Cook PVI except in the highly urban districts, where it is strong and in the expected direction: Higher median income = more Republican.  

    Next, we can see that more urban districts are, generally, more Democratic: All but one of the districts with Cook PVI over D+20 are over 90% urban.  

    Third, all the high income districts are mostly urban.  Of districts with median income above $60,000 or so, none were mostly rural, and most were 90%+ Urban.

    Graphs are good for exploration, now let’s look at a model.  In specific, let’s look at several regression models, with the dependent variable being Cook PVI and the IVs being different combinations of urban and median income.

    First, Cook PVI as a function of median income (I measured median income in thousands of dollars):

    The resulting equation is:

    CookPVI = 3.69 – .051*MedInc.

    What this means is that the predicted PVI for a district with a median income of 0 is D+4, and that it declines by .05 for each thousand dollar increase in median income.  This difference wasn’t significant, and the R^2 for this model was only 0.0001, meaning that almost none of the variation in CookPVI is accounted for by median income.

    Second, Cook PVI as a function of %Urban

    This gives:

    CookPVI = -29.45 + 0.39*Urban

    that is, when urban = 0, the predicted CookPVI is R + 29, and it gets more Democratic by 0.39 points for each percent increase in Urban.  So, for a 50% urban district the predicted Cook value would be -29 + 50*.39 = R+9, and for a district that’s 100% urban, it would be D + 10.

    R^2 here was 0.29 indicating that urban-ness accounted for 29% of the variation in Cook PVI

    Finally, a model with both urban and median income:

    Cook PVI = – 18.8 – 0.41*Median Income + 0.48*Urban

    that is, for a district with median income = 0 and urban = 0, the predicted Cook PVI was R + 19, and this got more Republican by 0.41 units for each thousand dollar increase in median income, but got more Democratic by .48 units for each unit increase in Urban.

    Both urban and median income were very significant, and this model had R^2 of 0.38.

    How many House Candidates are there – DEM? (2 of 2)

    Well 6 more districts now have candidates:

    CA-49 – R+10,

    FL-07 – R+3,

    KY-05 – R+8,

    MO-02 – R+9,

    TX-03 – R+17,

    TX-07 – R+16,

    And candidate filing season has started with Illinois filings which closed with us filling all 19 races a great start.

    But one race now no longer has a confirmed Democratic candidate:

    MT-AL – R+11 (our candidate withdrew owing to ill health),

    Once again go and take a look at the  

    2008 Race Tracker Wiki.

    **I have included Cook PVI numbers where possible after blogger requests to do so!**

    Below the fold for all the news……

    359 races filled! This of course includes 233 districts held by Democratic Congresscritters.

    But we also have 126 GOP held districts with confirmed Democratic opponents.

    So here is where we are at (GOP Districts):

    Districts with confirmed candidates – 126

    Districts with unconfirmed candidates – 2

    Districts with rumoured candidates – 25

    Districts without any candidates – 49

    1) The GOP held districts with confirmed Democratic challengers are as follows:

    AL-01 – R+12,

    AL-03 – R+4,

    AL-04 – R+16,

    AK-AL – R+14,

    AZ-01 – R+2,

    AZ-02 – R+9,

    AZ-03 – R+6,

    AZ-06 – R+12,

    AR-03 – R+11,

    CA-03 – R+7,

    CA-04 – R+11,

    CA-21 – R+13,

    CA-24 – R+5,

    CA-26 – R+4,

    CA-40 – R+8,

    CA-41 – R+9,

    CA-42 – R+10,

    CA-44 – R+6,

    CA-45 – R+3,

    CA-48 – R+8,

    CA-49 – R+10,

    CA-50 – R+5,

    CA-52 – R+9,

    CO-04 – R+9,

    CO-06 – R+10,

    CT-04 – D+5,

    DE-AL – D+7,

    FL-01 – R+19,

    FL-05 – R+5,

    FL-07 – R+3,

    FL-08 – R+3,

    FL-09 – R+4,

    FL-10 – D+1,

    FL-12 – R+5,

    FL-13 – R+4,

    FL-14 – R+10,

    FL-15 – R+4,

    FL-24 – R+3,

    GA-01 – R+?,

    GA-09 – R+?,

    GA-10 – R+?,

    ID-01 – R+19,

    IL-06 – R+2.9,

    IL-10 – D+4,

    IL-11 – R+1.1,

    IL-13 – R+5,

    IL-14 – R+5,

    IL-15 – R+6,

    IL-16 – R+4,

    IL-18 – R+5.5,

    IL-19 – R+8,

    IN-03 – R+16,

    IN-04 – R+17,

    IN-06 – R+11,

    IA-04 – D+0,

    IA-05 – R+8,

    KS-04 – R+12,

    KY-04 – R+11.7,

    KY-05 – R+8,

    LA-01 – R+18,

    MD-01 – R+10,

    MD-06 – R+13,

    MI-02 – R+9,

    MI-07 – R+2,

    MI-09 – R+0,

    MI-11 – R+1.2,

    MN-02 – R+2.7,

    MN-03 – R+0.5,

    MN-06 – R+5,

    MO-02 – R+9,

    MO-06 – R+5,

    MO-09 – R+7,

    NV-03 – D+1,

    NJ-03 – D+3.3,

    NJ-04 – R+0.9,

    NJ-05 – R+4,

    NJ-07 – R+1,

    NJ-11 – R+6,

    NM-01 – D+2,

    NM-02 – R+6,

    NY-13 – D+1,

    NY-23 – R+0.2,

    NY-25 – D+3,

    NY-26 – R+3,

    NY-29 – R+5,

    NC-03 – R+15,

    NC-05 – R+15,

    NC-06 – R+17,

    NC-08 – R+3,

    NC-09 – R+12,

    NC-10 – R+15,

    OH-01 – R+1,

    OH-02 – R+13,

    OH-05 – R+10,

    OH-07 – R+6,

    OH-12 – R+0.7,

    OH-14 – R+2,

    OH-15 – R+1,

    OH-16 – R+4,

    OK-05 – R+12,

    PA-03 – R+2,

    PA-09 – R+15,

    PA-15 – D+2,

    PA-16 – R+11,

    PA-18 – R+2,

    TX-03 – R+17,

    TX-04 – R+17,

    TX-07 – R+16,

    TX-08 – R+20,

    TX-10 – R+13,

    TX-13 – R+18,

    TX-26 – R+12,

    TX-31 – R+15,

    TX-32 – R+11,

    VA-01 – R+9,

    VA-05 – R+6,

    VA-06 – R+11,

    VA-10 – R+5,

    VA-11 – R+1,

    WA-04 – R+13,

    WA-08 – D+2,

    WV-02 – R+5,

    WI-01 – R+2,

    WI-05 – R+12,

    WI-06 – R+5,

    WY-AL – R+19,

    2) The following GOP held districts have a candidate that is expected to run but is yet to confirm:

    KY-02 – R+12.9,

    SC-04 – R+15,

    3) The following GOP held districts have rumoured candidates – please note that some of these “rumours” are extremely tenuous!

    AL-02 – R+13,

    FL-06 – R+8,

    FL-21 – R+6,

    GA-03 – R+?,

    GA-06 – R+?,

    GA-07 – R+?,

    GA-11 – R+?,

    ID-02 – R+19,

    MS-03 – R+14,

    MT-AL – R+11,

    NE-02 – R+9,

    NE-03 – R+23.6,

    NV-02 – R+8.2,

    NJ-02 – D+4.0,

    NY-03 – D+2.1,

    OH-03 – R+3,

    OK-03 – R+18,

    OK-04 – R+13,

    PA-06 – D+2.2,

    TN-07 – R+12,

    TX-02 – R+12,

    TX-11 – R+25,

    TX-24 – R+15,

    UT-03 – R+22,

    VA-02 – R+5.9,

    4) And last but not least the following districts have not a single rumoured candidate:

    AL-06 – R+25,

    CA-02 – R+13,

    CA-19 – R+10,

    CA-22 – R+16,

    CA-25 – R+7,

    CA-46 – R+6,

    CO-05 – R+15.7,

    FL-04 – R+16,

    FL-18 – R+4,

    FL-25 – R+4,

    IN-05 – R+20,

    KS-01 – R+20,

    KY-01 – R+10,

    LA-04 – R+7,

    LA-05 – R+10,

    LA-06 – R+7,

    LA-07 – R+7,

    MI-03 – R+9,

    MI-04 – R+3,

    MI-06 – R+2.3,

    MI-08 – R+1.9,

    MI-10 – R+4,

    MS-01 – R+10,

    MO-07 – R+14,

    MO-08 – R+11,

    NE-01 – R+11,

    OH-04 – R+14,

    OH-08 – R+12,

    OK-01 – R+13,

    OR-02 – R+11,

    PA-05 – R+10,

    PA-19 – R+12,

    SC-01 – R+10,

    SC-02 – R+9,

    SC-03 – R+14,

    TN-01 – R+14,

    TN-02 – R+11,

    TN-03 – R+8,

    TX-01 – R+17,

    TX-05 – R+16,

    TX-06 – R+15,

    TX-12 – R+14,

    TX-14 – R+14,

    TX-19 – R+25,

    TX-21 – R+13,

    UT-01 – R+26,

    VA-04 – R+5,

    VA-07 – R+11,

    WA-05 – R+7.1,

    Praise to those states where we already have a full slate of house candidates – Alaska, Arizona, Arkansas, Connecticut, Delaware, Hawaii, Illinois, Iowa, Maine, Massachusetts, Maryland, Minnesota, New Hampshire, New Mexico, North Carolina, North Dakota, Rhode Island, South Dakota, Vermont, West Virginia, Wisconsin and Wyoming.

    It is also interesting to note that we have only one race left to fill in Colorado, Idaho, Indiana, Kansas, Nevada, Montana, New Jersey, New York, Oregon and Washington. Thats 22 states with a full slate, and 10 states with one race to fill! That is more than half the states with a full or nearly full slate of candidates 12 months before election day, an impressive feat indeed!

    Please note that in some races others at the racetracker site have confirmed candidates that I haven’t. This is because to satisfy me a confirmed candidate has either filed with the FEC, The Sec of State or has an active campaign website, or even if they come and blog and say yep I am running. Others are not so rigorous.

    It is also great to see candidates in AZ-06, CA-42, FL-12, VA-06, and WI-06; 5 of 10 districts we did not contest in 2006!

    We are well on track to beat the 425 races we contested in 2006.

    ** Tips, rumours and what not in the comments please.**

    MO-09: A Challenger for Hulshof?

    The last time we checked in with Rep. Kenny Hulshof (R-MO), his candidacy for the University of Missouri presidency apparently hit a brick wall after another candidate was offered the gig, ending our brief dreams of an off-year special election here.

    Hulshof’s district is not a typical Democratic target.  Its PVI (R+6.5) and its 18-point margin for Bush in 2004, coupled with the incumbent’s uncontroversial tenure would have most analysts slotting this district in the “safe” column.  But while the GOP can’t even recruit top challengers to defend GOP seats lately (see: NJ-03), Democrats are shooting for the fences, even in red districts like this one.

    Earlier this fall, the DCCC put Hulshof on its SCHIP hit list, and targeted the incumbent with radio ads slamming him for his cold-shouldered vote against America’s poorest kids.  

    Now, it looks like Hulshof may finally get an opponent in state Rep. Judy Baker, who filed her papers to form an exploratory committee and begin raising money for a congressional campaign.  A Baker candidacy would be a big step up for local Democrats, who haven’t fielded a candidate with elected experience against Hulshof since 2000.

    For Baker, her gut is telling her that now is the time to run:

    Baker said she’s done some “initial analysis” and says there is opportunity to run in the Ninth this year. She cited significant anxiety over the status quo in Washington and “a very strong swing toward doing something different.”

    “I think I am able to fill that gap,” Baker said. “But it’s also for me – I feel like I can’t do anything else. I keep trying to say, ‘No, this is not the time, this is not the year, this is not the race.’ But it kind of grabs me and won’t let me go. Because I feel that the issues are so critical at such a critical juncture that I feel like the whole thing won’t even let me go.”

    Hulshof’s vote against SCHIP would likely be a key campaign issue for Baker, should she make her bid official:

    Most recently, she has been critical of Hulshof for voting against expansion and reauthorization of the State Children’s Health Insurance Program.

    “That is going to be a huge issue for the next two decades,” Baker said. “We need someone who’ll stand up for people who need health care and not just say ‘we’re not going to supply it.’ … There are numerous other issues and it’s not just health care — economy, the war, health care – all of these add up to people wanting a new perspective and new set of eyes to look at our problems and move us forward.”

    This would be a challenging district for any Democrat, especially against an incumbent.  But any opportunity to make the GOP sweat should be seized upon.  And you never know — perhaps Hulshof isn’t that thrilled with his job and might jump ship for another opportunity.  We know that he’s been looking for an easy out already.

    How many House Candidates are there – GOP? (1 of 2)

    After a number of requests in previous diaries here it is. The same style diary, the same methodology and the same layout so as to allow you dear reader to compare us to them!

    So below the fold to see how the Repubs are doing in House candidate recruiting for 2008!

    And remember part two of this series appears tomorrow, a Dem House update. A hint – three weeks ago we had 354 candidates.

    276 House races have confirmed Republican candidates – yep only 276!!! So as not to give any Repub trolls any hints this diary is very light on for analysis.

    However it goes without saying that from these numbers the Repubs are really struggling to find candidates for House races in 2008. Wonder why? Just look at the number of unfilled races in California and New York.

    Before we crack open the bubbly however a few cautionary notes.

    I didn’t trawl through Repub blogs as much as I would through ours (try it yourself and you will see why!)

    Very few State Repub Party sites had up to date lists of candidates. More Dem State Party sites did.

    The Repubs don’t have a Swing State Project or 2008 Race Tracker wiki so again it is harder to find their candidates.

    Expect a lot more of their 2006 candidates to step up as sacrificial lambs later in the cycle.

    I am sure I have missed some candidates but not many as I FEC searched all 2006 candidates as well as checking out their websites for updates.

    ** Despite all that hedging we are soooo far in front of them!!!**

    So here is where we are at (Democratic Districts):

    Districts with confirmed candidates – 74

    Districts with unconfirmed candidates – 4

    Districts with rumoured candidates – 21

    Districts without any candidates – 134

    The Democratic held districts with confirmed Republican challengers are as follows:

    AL-05 – R+6,

    AZ-05 – R+4,

    AZ-07 – D+10,

    AZ-08 – R+1,

    CA-05 – D+14,

    CA-08 – D+36,

    CA-09 – D+38,

    CA-10 – D+9,

    CA-11 – R+3,

    CA-17 – D+17,

    CA-23 – D+9,

    CA-29 – D+12,

    CA-43 – D+13,

    CA-47 – D+5,

    CA-53 – D+12,

    CT-02 – D+8,

    CT-05 – D+4,

    FL-02 – R+2,

    FL-11 – D+11,

    FL-16 – R+2,

    FL-22 – D+4,

    FL-23 – D+29,

    GA-08 – R+8,

    GA-12 – D+2,

    GA-13 – ?,

    IL-01 – D+35,

    IL-03 – D+10,

    IL-08 – R+5,

    IL-09 – D+20,

    IL-12 – D+5,

    IN-01 – D+8,

    IN-02 – R+4,

    IN-07 – D+9,

    IN-08 – R+9,

    IN-09 – R+7,

    IA-02 – D+7,

    KS-02 – R+7,

    KS-03 – R+4,

    KY-03 – D+2,

    ME-01 – D+6,

    MD-04 – D+30,

    MD-08 – D+20,

    MA-04 – D+17,

    MA-06 – D+10,

    MI-01 – R+2,

    MI-05 – D+12,

    MN-01 – R+1,

    MN-05 – D+21,

    MO-03 – D+18,

    MO-05 – D+12,

    NV-01 – D+9,

    NH-01 – R+0,

    NH-02 – D+3,

    NY-01 – D+3,

    NY-19 – R+1,

    NY-20 – R+3,

    NY-22 – D+6,

    NC-07 – R+3,

    NC-11 – R+7,

    OH-10 – D+6,

    OH-18 – R+6,

    PA-04 – R+3,

    PA-10 – R+8,

    PA-12 – D+5,

    PA-17 – R+7,

    TX-09 – R+21,

    TX-22 – R+15,

    TX-23 – R+4,

    TX-29 – D+8,

    VA-08 – D+14,

    VA-09 – R+7,

    WA-02 – D+3,

    WV-03 – D+0,

    WI-08 – R+4,

    The following Democratic districts have candidates that are expected to run but are yet to confirm:

    HI-01 – D+7,

    ME-02 – D+4,

    OR-05 – D+1,  

    WA-07 – D+30,

    The following Democratic districts have rumoured candidates – please note that some of these “rumours” are extremely tenuous!

    CA-06 – D+21,

    CA-12 – D+22,

    CA-20 – D+5,

    CA-37 – D+27,

    CO-02 – D+8,

    KY-06 – R+7,

    MD-05 – D+9,

    MD-07 – D+25,

    MA-05 – D+9,

    MA-09 – D+15,

    MN-08 – D+4,

    NY-24 – R+1,

    NC-13 – D+2,

    ND-AL – R+13,

    PA-07 – D+4,

    PA-08 – D+3,

    PA-11 – D+5,

    RI-01 – D+16,

    SD-AL – R+10,

    TX-18 – D+23,

    WA-01 – D+7,

    And last but not least the following districts have not a single rumoured GOP candidate:

    AL-07 – D+17,

    AZ-04 – D+14,

    AR-01 – D+1,

    AR-02 – R+0,

    AR-04 – D+0,

    CA-01 – D+10,

    CA-07 – D+19,

    CA-13 – D+22,

    CA-14 – D+18,

    CA-15 – D+14,

    CA-16 – D+16,

    CA-18 – D+3,

    CA-27 – D+13,

    CA-28 – D+25,

    CA-30 – D+20,

    CA-31 – D+30,

    CA-32 – D+17,

    CA-33 – D+36,

    CA-34 – D+23,

    CA-35 – D+33,

    CA-36 – D+11,

    CA-38 – D+20,

    CA-39 – D+13,

    CA-51 – D+7,

    CO-01 – D+18,

    CO-03 – R+6,

    CO-07 – D+2,

    CT-01 – D+14,

    CT-03 – D+12,

    FL-03 – D+16,

    FL-17 – D+35,

    FL-19 – D+21,

    FL-20 – D+18,

    GA-02 – D+2,

    GA-04 – D+22,

    GA-05 – ?,

    HI-02 – D+10,

    IL-02 – D+35,

    IL-04 – D+13,

    IL-05 – D+18,

    IL-07 – D+35,

    IL-17 – D+5,

    IA-01 – D+5,

    IA-03 – D+1,

    LA-02 – D+28,

    LA-03 – R+5,

    MD-02 – D+8,

    MD-03 – D+7,

    MA-01 – D+15,

    MA-02 – D+11,

    MA-03 – D+11,

    MA-07 – D+18,

    MA-08 – D+31,

    MA-10 – D+8,

    MI-12 – D+13,

    MI-13 – D+32,

    MI-14 – D+33,

    MI-15 – D+13,

    MN-04 – D+13,

    MN-07 – R+6,

    MS-02 – D+10,

    MS-04 – R+16,

    MO-01 – D+26,

    MO-04 – R+11,

    NJ-01 – D+14,

    NJ-06 – D+12,

    NJ-08 – D+12,

    NJ-09 – D+13,

    NJ-10 – D+34,

    NJ-12 – D+8,

    NJ-13 – D+23,

    NM-03 – D+6,

    NY-02 – D+7,

    NY-04 – D+9,

    NY-05 – D+18,

    NY-06 – D+38,

    NY-07 – D+28,

    NY-08 – D+28,

    FL-10 – D+14,

    NY-10 – D+41,

    NY-11 – D+40,

    NY-12 – D+34,

    NY-14 – D+26,

    NY-15 – D+43,

    NY-16 – D+43,

    NY-17 – D+21,

    NY-18 – D+10,

    NY-21 – D+9,

    NY-27 – D+7,

    NY-28 – D+15,

    NC-01 – D+9,

    NC-02 – R+3,

    NC-04 – D+6,

    NC-12 – D+11,

    OH-06 – D+0,

    OH-09 – D+9,

    OH-11 – D+33,

    OH-13 – D+6,

    OH-17 – D+14,

    OK-02 – R+5,

    OR-01 – D+6,

    OR-03 – D+18,

    OR-04 – D+0,

    PA-01 – D+36,

    PA-02 – D+39,

    PA-13 – D+8,

    PA-14 – D+22,

    RI-02 – D+13,

    SC-05 – R+6,

    SC-06 – D+11,

    TN-04 – R+3,

    TN-05 – D+6,

    TN-06 – R+4,

    TN-07 – R+12,

    TN-09 – D+18,

    TX-15 – D+3,

    TX-16 – D+9,

    TX-17 – R+18,

    TX-20 – D+8,

    TX-25 – D+1,

    TX-27 – R+1,

    TX-28 – R+1,

    TX-30 – D+26,

    UT-02 – R+17,

    VT-AL – D+8,

    VA-03 – D+18,

    WA-03 – D+0,

    WA-06 – D+6,

    WA-09 – D+6,

    WV-01 – R+6,

    WI-02 – D+13,

    WI-03 – D+3,

    WI-04 – D+20,

    WI-07 – D+2,

    Woo hoo to the Democratic Party we are implementing the 50 State Strategy in spades whilst the GOP are playing rats jumping off a sinking ship.

    NY-19: More GOP Recruitment Follies

    The GOP continues to hit brick walls when it comes to House recruitment.

    First, uber-wealthy businessman Andrew Saul aborted his bid to topple frosh Dem Rep. John Hall after some light was shed on some very shady donations to his campaign.  Now, former Assemblyman Howard Mills, a moderate Republican who some thought could wage a competitive campaign, says that Team Red can count him out.

    Just a wild guess: Mills probably didn’t want to be associated with the troglodytes in the House GOP caucus.

    (H/T: The Albany Project)

    NJ-03: GOP Frontrunner Won’t Run

    This is pretty big news.  After Rep. Jim Saxton (R-NJ) shocked us all by announcing his retirement earlier this month, the GOP felt pretty good about holding his seat.  They had well-liked state Senator Diane Allen on hand, who was very interested in making a race of it.  The only problem?  Allen, a former broadcaster with a moderate reputation, wanted assurance from the NRCC that her bid would be well-funded.  With potential primary challengers nipping at her heels and the NRCC coffers empty, I guess it didn’t take long for Allen to reach a final decision:

    State Sen. Diane Allen says she will not be a candidate for Jim Saxton’s open House seat next year.

    “Now is not the time in my life that I feel prepared to again fight a Democrat opponent as well as a rouge faction of the Burlington County Republican Party simultaneously,” Allen said.

    Allen, a longtime legislator and former CBS news anchor in Philadelphia,  had been expected to seek the 3rd district seat, and her sudden departure amidst a major intra-party battle in Burlington extends the turmoil of the Republican campaign to hold Saxton’s seat in 2008.  It also enhances the chances of an Ocean County Republican winning the GOP nod.

    Ouch!  So in addition to losing a good deal of incumbents, the GOP is having great difficulty recruiting top tier challengers to replace them.  Could the picture get any clearer?