Just Whistling Dixie: Unlikely Pro-Democratic Maps for Four Southern States (AL, KY, LA, VA)

After the jump, I present a survey of maps that are demographically possible if political improbable. They are presented mostly for holiday slow-time discussion fodder. The states covered are Alabama, Kentucky, Louisiana, and Virginia. Republicans will control the process in Alabama; the Democrats control a single house of the legislature in the other three states. So the Democrats are unlikely to get maps as good as these. My redistricting instincts tend towards “good government” aesthetics, so these maps are about what’s possible with relatively compact districts.

Alabama

Top-line results: 5 R – 2 D. (Neutral year, open seat, quality candidates, my impression)

This map creates two majority-black districts in Alabama, while pushing the Huntsville-based 5th in slightly more Democratic direction.

The estimates in Dave’s App put Alabama at 4.66M people. The actual Census figure is 4.78M.

The 1st and 2nd engage in extensive territory swapping with the 2nd. The 1st gains gains the southeastern corner of the state; the 2nd gains much of Mobile proper. This roughly doubles the black percentage of the 2nd, taking it to 53% black, 43% white. Martha Roby should be in trouble. The 7th is very slightly diluted, dropping from 61% to 59% black. Making the 2nd majority black also let me shore up Mike Roger’s 3rd, which lost about 8 points off its black percentage.

In the north, the 5th needed to shrink. Glancing over the last decades worth of county-level results, the eastern side of the district seemed slightly more Democratic than the western side, so I lopped off Jackson County. Mo Brooks would probably still be fine here, but I’d rate this as the district most likely to flip to the Democrats outside of the majority-black ones.

I’m not entirely sure what the Republican will do with their control. The current 4th and 6th are R+26 and R+29 respectively, so a well-executed unpacking of those districts should end shoring up the other four GOP-held districts.

Kentucky

Top-line results: 3 R – 2 D – 1 S (Neutral year, open seat, quality candidates, my impression)

This map shores up Ben Chandler’s 6th district, while pushing the Paducah-based 1st into a potentially swingy seat. (I might be over-estimating Democratic chances there.)
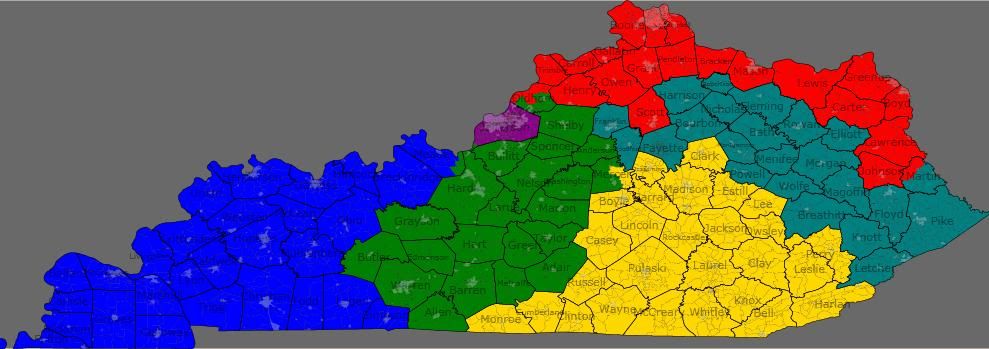
The estimates in Dave’s App put Kentucky at 4.04M people. The actual Census figure is 4.34M.

Looking at recent governor and US senator races, I noticed that the geographically largest areas of Democratic support in Kentucky is in the central portion of western eastern half of the state. That support is currently cracked into parts of three districts. I consolidated that support into Chandler’s 6th (teal), which should go from swingy to solidly Democratic.

In doing so, I forced the 5th (yellow) to the west, eating up areas that are contributing to Republican margins in the 1st (blue). (The new 5th is very Republican — it’s the only district without a single county that went Democratic in either of the last two US Senate races.) This new 1st should be winnable for a Democrat under the right circumstances — for example, by eyeballing it, I estimate that Mongiardo probably won in the 2004 Senate race.

I actually think that my 6th might have a decent shot of being created if the state House Democrats can force incumbent-protection. It’s just that the first will need to be solidified for the Republicans by some territory swaps with the 2nd and 5th.

Louisiana

Top-line results: 3 R – 2 D – 1 S. (Neutral year, open seat, quality candidates, my impression)

This map creates two majority-black districts in Louisiana, while trying to make the Shreveport-based 4th as Democratic as possible.

The estimates in Dave’s App put Louisiana at 4.41M people. The actual Census figure is 4.53M.

The 2nd (green) and 6th (teal) are the intended majority black districts. The actual figures are more like 49.6% in each. The 4th (red) is 54% white, 41% black. I hope that’s enough to make the 4th competitive for the Democrats.

Most speculation I’ve seen indicated the Republicans will be trying to make a single Baton Rouge-to-New Orleans majority-black district. Given the recent rate of party switching in the Louisiana state legislature, I imagine they’ll probably succeed.

Virginia

Top-line results: 5 D – 4 R – 2 S (Neutral year, open seat, quality candidates, my impression)

I originally presented this map in a comment in diary by drobertson. It fits the theme though, so I’m reposting it for consideration. This map is probably the most “good government” of these maps – each district basically corresponds to an existing political/cultural region of Virginia.

Its most notable feature is that presents two plurality black districts in the southeastern part of the state.

The estimates in Dave’s App put Virginia at 7.77M people. The actual Census figure is 8.00M.

1st (blue) – Peninsulas – Obama 46, McCain 54

2nd (green) – Suburban Hampton Roads – Obama 49, McCain 51

3rd (purple) – Urban Hampton Roads – Obama 69, McCain 31 — VRA: 49% black, 42% white

4th (red) – Richmond, Petersburg, and South Virginia – Obama 61, McCain 39 — VRA: 50% black, 44% white

5th (yellow) – Piedmont – Obama 47, McCain 53

6th (teal) – Shenandoah – Obama 43, McCain 57

7th (grey) – Richmond suburbs – Obama 42, McCain 58

8th (slate blue) – Arlington, Alexandria, north Fairfax- safe D

9th (cyan) – southwest Virginia – Obama 40, McCain 60

10th (magenta) – Prince William and Loudoun – Obama 56, McCain 44

11th (lime) — south Fairfax and Manassas – ???

The presidential percentages are back-of-the-envelope style. I used the 2008 figures to the nearest hundred and counted split cities/counties as if they were wholly within the district they were most in. I didn’t feel like delving into Fairfax precincts for the 8th/11th. The 8th should be just as safe as it is now, and I think, though I’m not 100% certain, that this version of the 11th is more Democratic than the current one. (Drobertson questioned this assertion at the time I made it, but agreed that this new district ought to be better for Gerry Connolly if not Generic D.)

The 2nd is more Republican than listed, but I don’t know how much more. I counted Isle of Wight and Suffolk as if they are wholly in it, but they are both donating their most heavily black precincts to the neighboring 4th and 3rd, respectively.

There’s a similar dynamic for the 4th and 7th, which are probably even more firmly in their respective parties’ control than it appears. I counted all of Richmond and Henrico in the 4th, but the majority white parts of each are actually in the 7th.

Notes on incumbents: Wittman, Scott, Cantor, Goodlatte, Moran, and Connolley are all fine. Rigell and Forbes would share the 2nd. Hurt lives in the new 4th. Griffith lives in the new 6th. Wolf lives in the new 8th. I assume all three of them would continue to run in the same districts anyway — all of them are in counties adjacent to their districts.

In the real world, the Virginia state senate Democrats should be able to force incumbent-protection, but seperating Richmond from Hampton Roads for two black opportunity districts won’t be happening.

Illinois Redistricting 12-4-2

Illinois looks to be one of the few bright spots for Democrats in redistricting.  An unexpected hold of the Governor’s seat gives Illinois Democrats the vaunted trifecta.  This map assumes blank things:
1) There will be 3 black VRA districts and a single Hispanic district.  In the next redistricting there will likely finally be 2 Hispanic seats.  For now the Hispanic community is too spread out to effectively draw a district.

2) Comebacks aren’t the most effective way to go.  Some of those had no right to be blue (see IL-14, IL-8), drawing a map based on those districts isn’t the wisest path for a Democratic gerrymander.

3) The Democrats won’t shy away from drawing districts that require a fight.  There’s an impulse toward the safest path in the Democratic party.  A map with about 10 surefire Democratic seats may be possible, but this year it’s worth it to push for the extra seats.

It’s been done to death, but it’s where I live and work so, without further ado:

Image Hosted by ImageShack.us

Image Hosted by ImageShack.us

Image Hosted by ImageShack.us

Image Hosted by ImageShack.us

CD 1 (Blue)- Bobby Rush (D)

W: 39% B: 54%

Major Cities: Orland Park, Tinley Park, Orland Park, Blue Island, Homer Glen, Chicago

Safe Democratic

Bobby Rush’s southwest side district remains mostly the same.  It is significantly less black than it was before, but it is still a majority.  The district reaches out and grabs a significant chunk of the current 13th district.  It will remain a safe Democratic district, if not so overwhelmingly.

Image Hosted by ImageShack.us

CD 2(Dark Green)-Jesse Jackson Jr. (D)

W: 32% B: 54% H: 11%

Major Cities: Chicago Heights, Calumet City, Peotone, Chicago

Safe Democratic

Similar to the 1st district the 2nd grabs some Republican leaning areas and becomes significantly less black.  Like the 1st it’s still a solid Democratic district and Rep. Jackson’s as long as he wants it.

Image Hosted by ImageShack.us

CD 3 (Purple)-Dan Lipinski (D) or Judy Biggert (R)

W: 64% H: 27%

Major Cities: Hinsdale, Burbank, Oak Lawn, Berwyn, Cicero, Chicago

Safe Democratic

Judy Biggert’s home is technically in the 3rd, but running here would be an uphill fight for her.  More likely she’ll decide that at 75 her decades of public service are enough.  The core of the Lipinski family’s 3rd district is still there.  It picks up more Hispanic areas in the east to offset the areas of DuPage it grabs.

Image Hosted by ImageShack.us

CD 4(Red)-Luis Gutierrez (D)

W: 19% H: 70%

Major Cities: Chicago

Safe Democratic

It’s still super-Hispanic.  The northern enclave is somewhat larger and the southern one somewhat smaller.  The connection between the sections is less painfully gerrymandered.

Image Hosted by ImageShack.us

CD 5(Yellow)-Mike Quigley (D)

W: 64% H: 23%

Major Cities: Addison, Bensenville, Elmwood Park, Chiago

Lean Democratic

The 5th district grabs a large chunk of downtown Chicago and a large chunk of DuPage County.  I’m most worried about this district’s safety, back of the envelope numbers and a couple of guesses say the district should be safe, but actual results would make me feel better about the seat.  Quigley does hold onto most of his base and the majority of the district is in Chicago.  Admittedly I’m being over cautious.

Image Hosted by ImageShack.us

CD 6(Teal)-Peter Roskam (R), Randy Hultgren (R), or Judy Biggert (R)

W: 75% A: 9% H: 10%

Major Cities: Wheaton, Naperville, Downers Grove, St. Charles, Barrington Hills

Safe Republican

Bench: Fred Crespo-HD 44

The 6th district becomes a suburban Republican vote sink.  Roskam’s district keeps its Wheaton base, grabs Republican strongholds in Naperville, St. Charles, and Barrington Hills.  All of the west and northwest suburban precincts that are unpleasant for Democrats get stuffed in here.  If Democrats insist on running a candidate who is more than a placeholder, state rep Fred Crespo held his seat in November and could run.  It’s a bad idea, but if the party insists.  On the Republican side both Roskam and Hultgren live in the district.  Both represented the 48th district in the state Senate and a primary fight between the two would be something to see.  A big part of Biggert’s base is in the district.  She could decide to run here, but is as likely to retire.  Which is disappointing because I’d pay to see a three-way brawl between sitting Republican Congressmen.

Image Hosted by ImageShack.us

CD 7(Silver)-Danny Davis (D)

W: 25% B: 53% H: 16%

Major Cities: Villa Park, Elmhurst, Bellwood, Oak Park, Chicago

Safe Democratic

Davis’ district picks up some new territory in DuPage.  It’s still a majority black district (though less than before).  And it’s still a Democratic district, though less than its current D+35.

Image Hosted by ImageShack.us

CD 8(Purple)-Joe Walsh (R) or Vacant

W: 67% H: 19%

Major Cities: Waukegan, Lake Forest, Highland Park, Vernon Hills, Grayslake, Gurnee

Lean Democrat

Bench-Rep. Melissa Bean, Sen. Susan Garrett LD-29, Sen. Terry Link-LD 30

The 8th pulls almost entirely out of Cook County and takes the whole of Lake County plus a sliver of Barrington.  It’s a swing district.  Bean may have been able to hold it this year, especially against Walsh.  This district leans ever so slightly Democrat.  Bean could run again here, she’s not a retread for most of the district.  She kept the score close throughout Lake County in 2010, and won it in 2008.  Even Dan Seals won the parts of Lake in the 10th in 2010 and 2008.  If Bean doesn’t make an attempt to reclaim her seat State Senators Susan Garrett and Terry Link are positioned to make a run for Congress.

Image Hosted by ImageShack.us

CD 9(Blue)-Jan Schakowsky (D)

W: 64% A: 11% H: 14%

Major Cities: Evanson, Park Ridge, Des Plaines, Evanston, Chicago

Safe Democrat

Schakowsky’s seat doesn’t change much.  She loses much of Skokie and Niles and picks up more of Chicago and Republicans areas around Northfield, Wheeling and Rosemont.  If anything her seat comes out stronger.

Image Hosted by ImageShack.us

CD 10(Pink)-Bob Dold (R)

W: 70% A: 14% H: 12%

Major Cities: Schaumberg, Rolling Meadows, Arlington Heights, Skokie, Northbrook

Lean Democrat

Bench: Rep. Elaine Nekritz HD-59, Sen. Jeff Schoenberg LD-9, Julie Hamos, Dan Seals

This seat should have been a Democratic seat ages ago.  Any gerrymander should be sure to put the 10th over the top.  The 10th now stays mostly within Cook County, ducking into DuPage for just a few thousand votes.  If Democratic strongholds in Schaumburg, Niles, Skokie, Northbrook and Winnetka combined with Democratic trending Hoffman, Elk Grove and Palatine can’t produce a Democrat in this district then there truly is a curse.  Popular state Senator Jeff Schoenberg could make a successful run for the seat, though the real boon would be state rep Elaine Nekritz.  Nekritz is an archetypical suburban Democrat: socially progressive and fiscally moderate.  She would run the table in a district like this.  Some area Democrats are hoping for a Julie Hamos comeback.  I dislike the idea personally because of the first rule of suburban Chicago politics: if you can’t beat Dan Seals you don’t get a second chance.  Which leads us to Dan Seals, who could take a fourth crack at the seat.  By no means should he, but by no means should he have run this year, so we’ll have to see.

Image Hosted by ImageShack.us

CD 11(Blue)-Adam Kinzinger (R) or Tim Johnson (R)

W: 79% B: 11%

Major Cities: Champaign-Urbana, Bloomington-Normal, Decatur, Danville, Kankakee

Tossup

Bench: Sen. Mike Frerichs-LD 52

The 11th grabs every Democratic leaning city in eastern Illinois.  The college towns Champaign-Urbana (People’s Republic of) and Bloomington-Normal as well as the union towns of Decatur and Danville make up half to two-thirds of the district.  The rest of the district is decidedly anti-Democrat.  Putting this district in the D-column comes down to a turnout fight.  Sen. Mike Frerichs is a Democrat who can win right-leaning voters.  He’ll be able to stop a Republican from running up the score in between the cities.  Tim Johnson lives in Urbana and represents the 15th district currently.  He could run here and have a chance to win, but up-and-comer Adam Kinzinger also live in the district.  Johnson has seniority, but Kinzinger has the potential to be a rising star of the party.  Here’s hoping for a cage match.

Image Hosted by ImageShack.us

CD 12(Blue)-Jerry Costello (D)

W: 79% B: 16%

Major Cities: East St. Louis, Edwardsville, Carbondale, Alton, Cairo

Safe Democrat

The 12th is relatively unchanged.  It picks up some new territory in Calhoun County and around Edwardsville, drops some of Williamson and Jefferson Counties, and remains a safe district for incumbent Costello.

Image Hosted by ImageShack.us

CD 13(Pink)-Randy Hultgren (R) or Vacant

W: 61% B: 11% H: 24%

Major Cities: Joliet, Aurora, Lockport, Romeoville, Batavia

Lean Democratic

Bench: Rep. Bill Foster, Rep. Linda Chapa LaVia-HD 83, Sen. Linda Holmes-LD 42, Sen. Arthur Wilhelmi-LD 43.

The 13th district picks up Aurora and Joliet for its loses in DuPage.  This district is distinctly more Democratic.  It’s not a district to take for granted, but in a fair fight expect a Democratic win.  Bill Foster could run for this district from Batavia, or any member of the deep bench in the area could rally a coalition of minority and working class voters in the area.  Sen. Wilhelmi would, I believe be the strongest candidate on the Democratic side.  Hultgren could run here if the party moved to protect Roskam.  It would ultimately be a fools errand; in 2010 Foster pounded Hultgren 61-37 in Aurora.

Image Hosted by ImageShack.us

CD 14(Brown)-Joe Walsh (R) or Vacant

W: 71% H: 19%

Major Cities: Elgin, Rockford, McHenry, Crystal Lake, Batavia

Tossup

Bench: Rep. Jack Franks-HD 63, Rep. Keith Farnham-HD 43, Sen. Mike Noland-LD 22

Joe Walsh could run here.  He’s claiming his home is in McHenry now.  McHenry County was good to Walsh in 2010 and he may want to stay with his base.  The district is not as Republican as it looks at first glance.  Democratic Rockford and Elgin make up about half of the district while McHenry county not is the wasteland it was five or ten years ago.  Democrat Jack Franks has kept his northwest McHenry county seat Democratic for more than a decade now.  If Franks runs it’s a narrow advantage for the Democrats, if he doesn’t it’s a complete tossup.

Image Hosted by ImageShack.us

CD 15(Orange)-Tim Johnson (R) or John Shimkus (R)

W: 93%

Major Cities: Charleston, Effingham, Colinsville, Metropolis, Centralia

Safe Republican

Bench: Rep. Jay Hoffman-HD 112, Rep. Brandon Phelps-HD 118, Sen. Gary Forby-LD 59

The Republicans have to go somewhere.  This is one of them.  Any democrat running here is a ConservaDem placeholder.  The interesting thing to watch could be two powerful Republicans wailing on each other.  If Johnson is pushed out of the 11th to make way for Kinzinger then it’s likely that he’ll hop the border and try to run in the 15th.  About a third of Johnson’s old 15th remains in the new 15th.  If neither Johnson nor Shimkus feel like retiring things could get fun down here, grab the popcorn.

Image Hosted by ImageShack.us

CD 16(Light Green)-Don Manzullo (R)

W: 87%

Major Cities: Freeport, Galena, Rochelle, DeKalb, Morris, Lasalle

Lean Republican

Bench: Rep. Careen Gordon-HD 75, Rep. Frank Mautino-HD 76

Manzullo’s old district, less Rockford, Boone County and McHenry County plus north-central Illinois.  This 16th will generally be a Republican hold, but is not as monolithic as the other downstate Republican seats.  Bureau, LaSalle, Jo Daviess, Carroll, and Stephenson are willing to vote Democratic if they’re given a good enough reason.  Combined with liberal Putnam county and left trending exurban counties (DeKalb, Kane, Kendall) this seat could turn blue for a short while in a Democratic wave year.

Image Hosted by ImageShack.us

CD 17(Purple)-Bobby Schilling (R) or Aaron Schock (R)

W: 82% B: 10%

Major Cities: Peoria, Quad Cities, Springfield, Galesburg, Sterling, Macomb

Lean Democratic

Bench: Rep. Mike Boland-HD 71, Sen. Mike Jacobs-LD 36, Sen. David Koehler-LD 46, Rep. Phil Hare.

This was a Democratic seat for some 30-years.  It still is; it fell prey to a weak candidate and a terrible year in an area that has passed recession and is economically depressed.  There is no problem with keeping a western Illinois Democratic district.  This map strengthens the 17th, cutting Republican Adams and Hancock Counties and picking up Peoria, Mason County, and the rest of Springfield while holding the Democratic core of Knox, Henderson, Mercer and Rock Island Counties.  A number of Democrats have expressed interest in taking back what will be one of DCCC’s top targets in 2012.  Any of them should have a good chance to beat the Republican.  Bobby Schilling currently represents the 17th, but Aaron Schock now lives in the district.  He’ll likely keep running in the 18th though.

Image Hosted by ImageShack.us

CD 18(Yellow)-Aaron Schock (R)

W: 95%

Major Cities: Quincy, Jacksonville, Pekin, East Peoria

Safe Republican

Bench: Sen. John Sullivan-LD 47, Sen. Deanna Demuzio-LD 49

Schock’s district gets stronger.  He picks up Macoupin County and its Democratic machine, but more than cancels it out with Adams, Hancock and Tazewell Counties.

Madigan may balk at this map.  It somewhat weakens Lipinski while strengthening Schakwsky (Madigan likes Lipinski and dislikes Schakowsky) and it likely takes Jack Franks out of the House, a seat that will probably flip without Franks.  Also, rather than going for a more sure 13-5 split the map tries to run up the score to 14-4.

This map isn’t necessarily a prediction of what we’ll see.  But it is, I believe, the most aggressive map Democrats can draw.  And as a Democrat its the map I hope to see.

All I Want for Christmas is a Nevada Redistricting

Merry Christmas to everyone who celebrates it, whether on 25 December or otherwise. While waiting for the ham to be done, I drew up a map of Nevada with four shiny new districts, just what the U.S. Census Bureau ordered.

The way I drew it, we’re basically looking at a 2-2 map, with three if not all of those districts being somewhat “soft” (potentially competitive in the right cycle) due to the quirks of Nevada geography, politics, and geopolitics. Some people on other threads (the Missouri one, for example) have suggested that Gov.-elect Sandoval and the Republicans will probably be satisfied to shore up Rep.-elect Heck somewhat in exchange for letting the Democrats have their way, to an extent, with the new NV-04. I’m inclined to agree. Also, drawing a safe 1-3 map for a rapidly blueing state like Nevada is not terribly easy.

I don’t usually go out of order, but we should probably start at the top here (geographically rather than numerically) because Nevada is an oddly shaped state.

NV-02 (green, safe lean Republican)

Rep. Dean Heller, a Republican, is thought to be prepping a Senate bid against Sen. John Ensign, the scandal-tarnished Republican incumbent whose unreliability and moral flexibility has been a thorn in the side of Republican leadership in Nevada and in Washington for several years now. If he decides to forgo a bid for statewide office in favor of running for reelection, I doubt he’ll have a problem here. Washoe County may be swingy, but Heller is popular, and any Republican can run up crushing margins in the cow counties. If Heller runs for Senate in 2012, though, Republicans and Democrats alike will want to put a lot of effort into recruiting top-tier candidates here.

NV-01 (blue, safe Democratic)

Vegas, baby! This is Rep. Shelley Berkley’s district, and she’s considered the likeliest Democrat to run for Ensign’s seat in 2012. I figure she’ll vacate, and it’s just as well, because although Nevada isn’t a VRA preclearance state, the Department of Justice may lean on the incoming Sandoval administration to ensure a minority-majority seat. Latinos are actually about a quarter of Nevada’s population, they’re the fastest-growing demographic, and it’s pretty easy to draw a compact Latino-plurality district. This district is actually 28% white, 14% black, 6% Asian, and 49% Latino, going off 2008 population estimates, and I’ll bet dollars to doughnuts it’s outright Latino-majority in the new census data. Sandoval himself may do okay here, but it’s a safe Democratic district.

NV-03 (purple, likely Republican)

Rep.-elect Joe Heck edged Rep. Dina Titus, flipping the present “fair fight” incarnation of this district from blue to red, last month. One of Sandoval’s top priorities will be shoring him up. Adding a bunch of cow counties and consolidating the district’s hold on white-collar Clark County precincts is a decent way of accomplishing that. While Sharron Angle might lose this district, and Titus could conceivably take it back, it now tips pretty firmly in Heck’s favor.

NV-04 (red, likely Democratic)

One of the big reasons why the current NV-03 is a swing district is that it includes both Democratic and Republican areas along with some subdivisions that go both ways (no, not like that, most of those are pretty heavily Democratic). I gave most of those Republican areas to my NV-03, or at least I tried to, while NV-04 takes over most of the Democratic areas, centering around Spring Valley. It’s a mostly suburban district, though it includes just a bit of rural Clark County up Highway 95. Titus or another strong Democrat with a suburban base should be pretty solid here except in particularly gruesome cycles, although a socially moderate or libertarian Republican could potentially win it.

As a Christmas bonus, I’m also going to repost my revised and updated map for Missouri, which shrinks to eight districts in 2012’s redistricting, without much commentary:

This isn’t necessarily the most favorable map Democrats can possibly get, but it’s probably the most favorable map they’re likely to get in 2012. (There’s a whole discussion about this on the other diary.) It’s probably a 3-5 map, with Democratic Rep. Russ Carnahan’s MO-03 (purple) likely playing host to a deathmatch between Carnahan and Republican Rep. Jo Ann Emerson of Cape Girardeau in 2012.

A few quick notes: Democratic Rep. Lacy Clay’s MO-01 (blue) is 48% white, 47% black, remaining VRA-compliant. I was of the school of thought saying it couldn’t be done without throwing Carnahan overboard, but there you have it. Carnahan’s share of St. Louis County consists almost entirely of precincts that voted for then-Sen. Barack Obama in the 2008 presidential election, so I think Mr. Local Boy has a good base there. And Republican Rep. Todd Akin’s home in rich white Town and Country remains in his district of MO-02 (green).

Not much to add here. Democratic Rep. Emanuel Cleaver in MO-08 (slate blue), renumbered from the current MO-05, still doesn’t get a VRA district, but he’s a good politician who is popular with both white and black Democrats in Kansas City. I resisted the urge to dismember Republican Rep.-elect Vicki Hartzler’s MO-05 (yellow), renumbered from the current MO-04, because I didn’t think the Republicans in the Missouri state legislature would let such a plan get to Democratic Gov. Jay Nixon’s desk.

Hope everyone is dividing their time as they see fit between family, friends, and politics. Thoughts on either map are welcome and appreciated.

Missouri Redistricting (Updated!)

I don’t know much about Missouri politics, but I do know the state is ending up with eight districts (down one) after redistricting, and Democratic Gov. Jay Nixon gets the opportunity to veto any map that is submitted by the legislature. So, I drew up a quick-and-dirty map.

I think Nixon and the Democrats are likely to settle for a 2-5-1 map. Anything better for the Democrats isn’t going to pass muster in the legislature, and anything better for the Republicans is going to get vetoed.

MO-01 (blue, safe Democratic)

Democratic Rep. William Lacy Clay gets to keep his safe urban district, which remains narrowly minority-majority (48% white, 47% black). Not much to add here. I definitely don’t think the northward excursion into St. Charles County will be enough to give a Republican an opening, especially with the racial demographics staying pretty much as is. If Clay gets to draw his own district, it might end up more confined to St. Louis City than in this drawing, but I think Nixon will be talking to Clay and other African American legislators to ensure a 2-5-1 map. If he can keep them safe, there’s no real reason for them to throw Democratic Rep. Russ Carnahan in MO-03 to the wolves altogether.

MO-02 (green, likely Republican)

This wealthy, white suburban district, currently held by Republican Rep. Todd Akin, has been consolidated somewhat. I think he should retain it barring a stern Democratic challenge, although a Democrat with suburban appeal might be able to make him sweat considering the lack of ruby-red rural areas. And I don’t know exactly where Rep. Carnahan lives, but if he and Akin are drawn into the same district, that would be a marquee battle.

MO-03 (purple, swing)

Assuming Rep. Carnahan runs in this district, I think he might have a tougher go of things than before. It includes a lot more of rural Missouri along the Mississippi River, though it includes enough of St. Louis and its suburbs to remain competitive. Republican Rep. Jo Ann Emerson has also been drawn into this district, so it’d be a classic urban-rural matchup.

MO-04 (red, safe Republican)

Rep.-elect Billy Long should be able to keep this seat Republican despite having a lot of new territory to cover.

MO-05 (yellow, likely Republican)

Republican Rep.-elect Vicki Hartzler gets some new ground, too, including most of the current MO-07, but I don’t really see this district swinging either way, maybe unless Democratic Rep.-elect Ike Skelton ran again. But I doubt he will.

MO-06 (teal, safe Republican)

It was a bit of a pain to keep Rep. Blaine Luetkemeyer, the Republican congressman for the current MO-09 (which encompasses most of this district), in this district. He’d be fine here.

MO-07 (grey, safe Republican)

Republican Rep. Tom Graves overcame his stiffest challenge in 2008 with flying colors. He’s solid here, despite this district including so much of (suburban) Jackson County. No reason to think he’s not safe.

MO-08 (slate blue, safe Democratic)

This district is basically Democratic Rep. Emanuel Cleaver’s current MO-05, urban Jackson and Clay counties stealing a few precincts from the urban parts of Cass and Platte counties. Cleaver should be just fine here.

Thoughts? Expertise from more Missouri-savvy SSPers?

Colorado Bipartisan Map (Updated!)

Cross posted on my blog http://frogandturtle.blogspot….

By winning one race by only 157 votes, Republicans control one house of the Colorado State Legislature so Democrats do not hold the trifecta in Colorado anymore. So instead of a possible Democratic gerrymander where they could retake the 3rd and 4th districts, the Democrats will probably end up with a bipartisan incumbent protection which is more favorable to the Republicans. The new Republicans may feel vulnerable because many of the new ones are in marginal districts they won in a very Republican year so the Democrats might work out a deal at protecting those Republicans in exchange for controlling congressional redistricting. That is not very likely though and I drew this map assuming it is a bipartisan deal. Ed Perlmutter (D) of Colorado’s 7th district is strengthened as well as newly elected Scott Tipton (R) of Colorado’s 3rd district and Cory Gardner (R) of Colorado’s 4th Congressional district. In 2002, Colorado was 5-2 Republican and in 2008, it shifted to 5-2 Democratic. The Republicans have the majority in the delegation now though with 4-3. Although Republicans came back a bit in 2010, I still think Colorado is trending Democratic due to Democrats moving into the Denver area from California. This movement could make districts such as the 6th competitive in the future, but for now, all incumbents will be much safer. Now, here are the maps:
link for current maps: http://www.nationalatlas.gov/p…

Photobucket

Denver area

Colorado’s 1st Congressional District: Diana DeGette (D) Blue

Obama won 70% (estimate)

Demographics: 8% African American, 37% Hispanic, 49% White

Old Demographics: 10% African American, 33% Hispanic, 52% White

Major Cities: Denver, Barr Lake

Status: Safe Democratic

DeGette’s district actually becomes a bit more Republican. I removed the Democratic suburbs around Englewood and replaced them with more moderate suburbs such as Brighton and Barr Lake. DeGette may not like having the new territory (and she even loses some Denver neighborhoods) but since the district is still mostly in Denver, she should have no problems at all facing reelection. Her district is now the only minority majority district in Colorado.

Colorado 2 Jared Polis (D) Green

Obama won 66% (estimate)

Demographics: 15% Hispanic, 80% White

Old Demographics: 18% Hispanic, 76% White

Major Cities: Boulder, Broomfield, Aspen

Status: Safe Democratic

Polis was already safe but his district becomes a Democratic vote sink to shore up the 3rd district now held by Scott Tipton (R). If Democrats had the trifecta here, they could have unpacked this district to make the 3rd district Democratic enough for John Salazar (D) to retake but as it is, the 2nd will take Democratic areas out of the 3rd. The 2nd loses all of Adams and Larmier Counties. The 2nd is more of a Rocky Mountain district now by picking up Democratic ski resort counties such as Routt (Steamboat Springs,) Pitkin (Aspen,) and Gunnison (Crested Butte.)

Photobucket

North Colorado

Photobucket

South Colorado

Colorado 3 Scott Tipton (R) Purple

McCain won 52% (estimate)

Demographics: 22% Hispanic, 73% White

Old Demographics: 22% Hispanic, 73% White

Major Cities: Pueblo, Grand Junction

Status: Likely Republican

Under a bipartisan plan, Tipton will be strengthened but due to the current demographics, strengthening Tipton is difficult without making convoluted lines or putting the 4th district Republican in jeopardy. I strengthened Tipton by removing Pitkin County (Aspen) as well as some other ski areas that I put in the 2nd. I added conservative Park County and a few conservative rural counties in southeastern Colorado. Obama also over performed the district’s usual Democratic percentage here due to high turnout in the ski areas but the district may become competitive again if Hispanics keep trending Democratic. This would be an opening for Salazar who is Hispanic and could do win enough Hispanics to beat Tipton. Salazar has an uphill battle though with the ski areas in the 2nd district though.

Colorado 4 Cory Gardner (R) Red

McCain won 52% (estimate)

Demographics: 18% Hispanic, 78% White

Old Demographics: 19% Hispanic, 76% White

Major Cities: Fort Collins, Greeley, Lamar

Status: Lean Republican

Due to population purposes, strengthening this district was difficult but I still made Gardner safer. I removed some Democratic areas in Adams and Boulder Counties. The district needs to shed territory anyway due to population growth but I added Elbert County as well as the conservative rural parts of Adams and Arapahoe Counties. Betsy Markey (D) who held this district from 2008 to 2010 might be able to win in a Democratic year here but the district’s changes will make winning harder for her.

Colorado 5 Doug Lamborn (R) Yellow

McCain won 59% (estimate)

Demographics: 5% African American, 13% Hispanic, 76% White

Old Demographics: 5% African, 13% Hispanic, 75% White

Major Cities: Colorado Springs, Castle Rock

Status: Safe Republican

At a first glance, this district appears to undergo major changes but population wise, it does not. It just loses some rural counties to the west to make the 3rd district more Republican while picking up a large portion of Douglas County. Lamborn was already safe with strongly Republican Colorado Springs in his district but he is just as safe now, if not safer.

Colorado 6 Mike Coffman (R) Teal

McCain won 52% (estimate)

Demographics: 9% Hispanic, 82% White

Old Demographics: 8% Hispanic, 84% White

Major Cities: Parker, Centennial

Status: Likely Republican

Coffman’s district says pretty similar demographically but his district becomes more difficult to hold. He picks up a large portion of Lakewood which formally was in the Democratic leaning 7th district while losing part of heavily Republican Douglas County. Although Coffman may be safe now, Jefferson and Araphaoe Counties are becoming more Democratic and now that they have more people in the district, Coffman may be in trouble in the end of the decade. That should however give him enough time to become entrenched in his district so he can fend away any challenge. The Republicans probably want Coffman to have more territory but that will be hard because the 3rd and 4th districts need their Republican areas.

Colorado 7 Ed Perlmutter (D) Orange

Obama won 62% (estimate)

Demographics: 7% African American, 27% Hispanic, 60% White

Old Demographics: 6% African American, 26% Hispanic, 61% White

Major Cities: Aurora, Lakewood, Arvada

Status: Safe Democratic

Although Obama won 59% under the current lines, the district was originally drawn as a swing district so Perlmutter will probably have a safer district on his wish list. This is what the new map does by adding in a few Denver neighborhoods. It also picks up more of Democratic Aurora while losing the less Democratic parts of Lakewood. Perlmutter also gains more of Adams County by picking up more of Westminister although he loses the rural eastern part to the 4th district. Perlmutter should be much safer, although he seemed to be doing fine already.

Updated:

After looking at the suggestions, here is my new version of Colorado:

Photobucket

Colorado

Photobucket

Denver area

Colorado 1

10% African American, 39% Hispanic, 46% White

(minority majority!)

Colorado 2

13% Hispanic, 81% White

I send it to Fort Collins to help shore up the 4th but Polis should be safe since he still has Boulder, he picked up Routt County and Fort Collins went for Obama.

Colorado 3

22% Hispanic, 73% White

This district is now basically split by picking up Eagle County.

Colorado 4

19% Hispanic, 77% White

This district is now safely Republican with the loss of Fort Collins and the inclusion of Douglas County.

Colorado 5

6% African American, 13% Hispanic, 75% White

The lines are basically the same as the old district.

Colorado 6

9% Hispanic, 83% White

Colorado 7

5% African American, 25% Hispanic, 63% White

This district gets a bit whiter but picks up some white parts of Denver so this district is more Democratic than it looks.  

By what margin will Bob Shamansky win?

View Results

Loading ... Loading ...

2010 Census Reapportionment Numbers

The Census Bureau has released its 2010 reapportionment numbers. All of today’s data dump can be seen here; the most important items of data are here, in the form of the map showing today’s winners and losers.

If this graph looks familiar, I’m using the last few rounds of Election Data Services projections as a yardstick for the actual results. (Kudos to them — or to the Census Bureau’s annual estimates, really. They basically nailed it.)


State Actual 2010 2009 2008 2007
Arizona 1 1 1 / 2 2 2
California 0 0 -1 / 0 -1 / 0 0 / 1
Florida 2 2 1 1 / 2 1 / 2
Georgia 1 1 1 1 1
Illinois -1 -1 -1 -1 -1
Iowa -1 -1 -1 -1 -1
Louisiana -1 -1 -1 -1 -1
Massachusetts -1 -1 -1 -1 -1
Michigan -1 -1 -1 -1 -1
Minnesota 0 0 -1 -1 -1 / 0
Missouri -1 -1 0 -1 -1
Nevada 1 1 1 1 1
New Jersey -1 -1 -1 -1 -1
New York -2 -2 -1 -1 -2
North Carolina 0 0 0 0 / 1 0 / 1
Ohio -2 -2 -2 -2 -2
Oregon 0 0 0 0 / 1 1
Pennsylvania -1 -1 -1 -1 -1
South Carolina 1 1 1 1 0 / 1
Texas 4 4 3 / 4 4 4
Utah 1 1 1 1 1
Washington 1 1 1 0 0

A few various other tidbits shared at today’s news conference: the fastest growth rates, among states, were Nevada, Arizona, Utah, Idaho, and Texas. Slowest growth were Michigan (the only one to decline since 2000), Rhode Island, Louisiana, Ohio, and New York. With a national population of 308,745,538, the average House district will have 710K constituents (up from 646K in 2000).

Gentlemen, start your redistricting engines!

UPDATE: Courtesy of Jeffmd, we’ve got the last 15 and first 15 (in other words, which states were most on the bubble, in order). Minnesota was the narrowest escapee, holding its 8th seat at North Carolina’s expense by less than 15,000 people.


# Last 15 # Next 15
435th Minnesota 8th 436th North Carolina 14th
434th California 53rd 437th Missouri 9th
433rd Texas 36th 438th New York 28th
432nd Washington 10th 439th New Jersey 13th
431st Florida 27th 440th Montana 2nd
430th South Carolina 7th 441st Louisiana 7th
429th Georgia 14th 442nd Oregon 6th
428th California 52nd 443rd Ohio 17th
427th Pennsylvania 18th 444th Virginia 12th
426th Texas 35th 445th California 54th
425th New York 27th 446th Illinois 19th
424th Michigan 14th 447th Texas 37th
423rd Illinois 18th 448th Massachusetts 10th
422nd California 51st 449th Pennsylvania 19th
421st Alabama 7th 450th Florida 28th

Redistricting Wisconsin

With all the redistricting fun, I feel as if I should take a stab at my home state, Wisconsin.  Unfortunately for Democrats, this past cycle was an absolute bloodbath.  We lost basically everything that was competitive, with the exception of Ron Kind’s seat and some State Senate and Assembly seats, even the State Senate Majority leader and Speaker of the State Assembly were defeated.   Thus this leaves Republicans with complete discretion with redistricting.  While there is plenty to do with the state legislative seats (of which I also created a map of State Senate seats that can potentially lock Democrats out for years), there simply is not that much that can be done with congressional seats.  While Republicans might take this year’s results as a sign that Wisconsin will have a permanent conservative majority, it is instructive to look at the 2008 map and see how it is basically the complete opposite.  As a result, with the exception of the Milwaukee area, the Madison area, and a few other areas, most of the state is basically swing areas, as the 2008 and 2010 maps indicate.
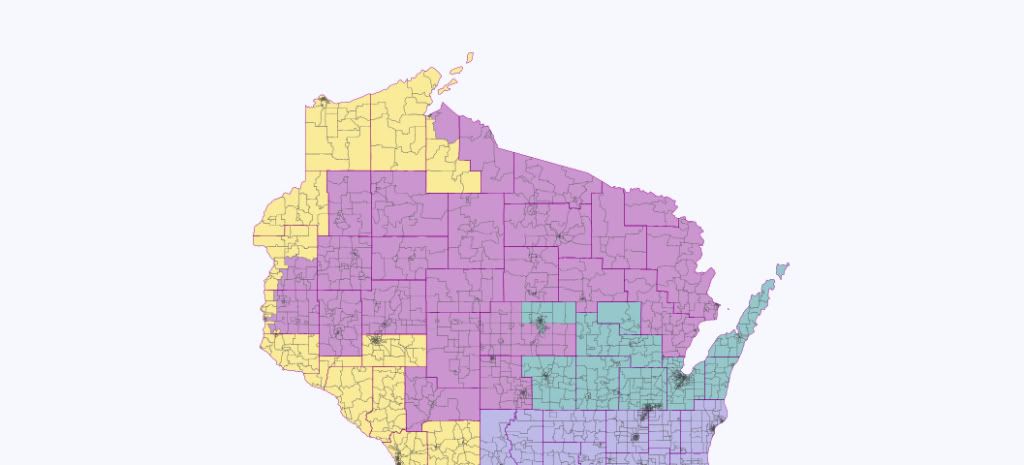
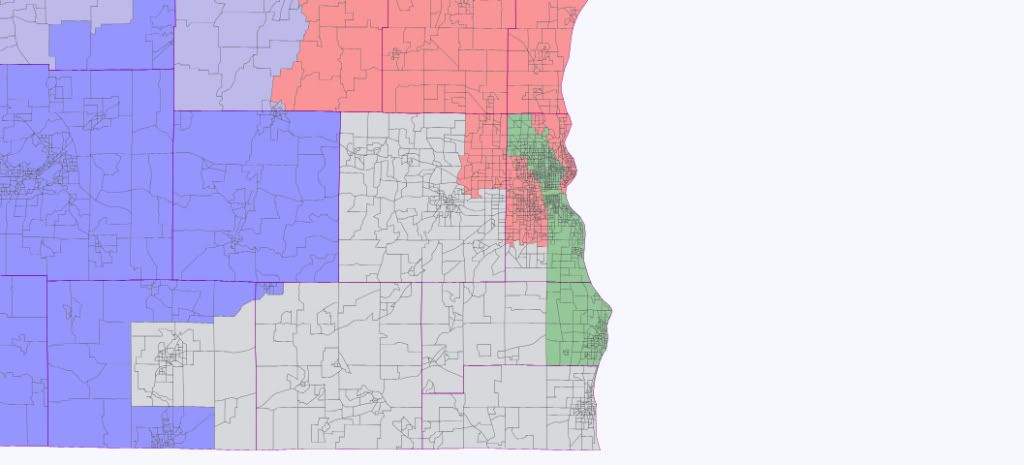
Thus, the problem for the Wisconsin GOP is that Wisconsin will support at least 3 Democratic seats.  Milwaukee and Madison are simply too large and too Democratic to get rid of Moore and Baldwin. Besides I cannot imagine a Republican wanting to take on inner-city Milwaukee or lefty Madison.    As for Ron Kind, if he can stand a year like this, he has his seat for life.  Additionally, Wisconsin is peculiar in that it has a number of rural Democratic voters in the West and Southwest parts of the state, so it would be difficult to get rid of a third Democratic seat.  

With this in mind, I decided that the best and safest path would be not necessarily an incumbent protection map, but protecting Ryan and Duffy.   With Ryan being Budget Chair in the House, I simply cannot see him wanted to change shift.  He has no reason for running for Governor and for him to run for Senate would see him give up his seat for at best a 50/50 run and more importantly, give up his power in the House.  He is probably more powerful in the House than in the Senate, so I think he would stay put.  However, his district has become quite marginal, so much so even Obama won his district.  Thus, I wanted to make him safer so that his district is more in line with his views.  Additionally, I view Duffy as an asset to protect because he is young, telegenic, and could eventually be statewide material.  Thus, I wanted to move his district a few more points Republican.  This meant weakening Ribble, but I think he should still be fine in his district and I see protecting Duffy more important in the long run.  

So here we go:

Photobucket

Photobucket

Photobucket

Photobucket

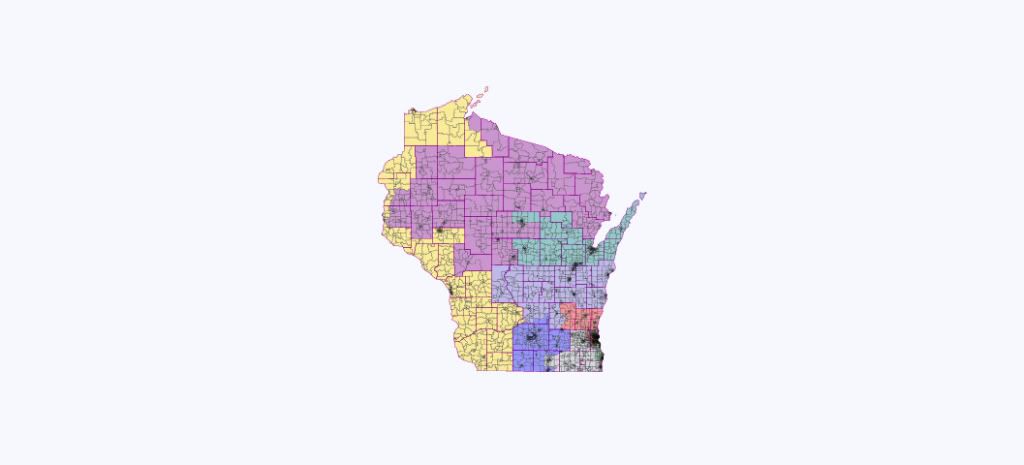
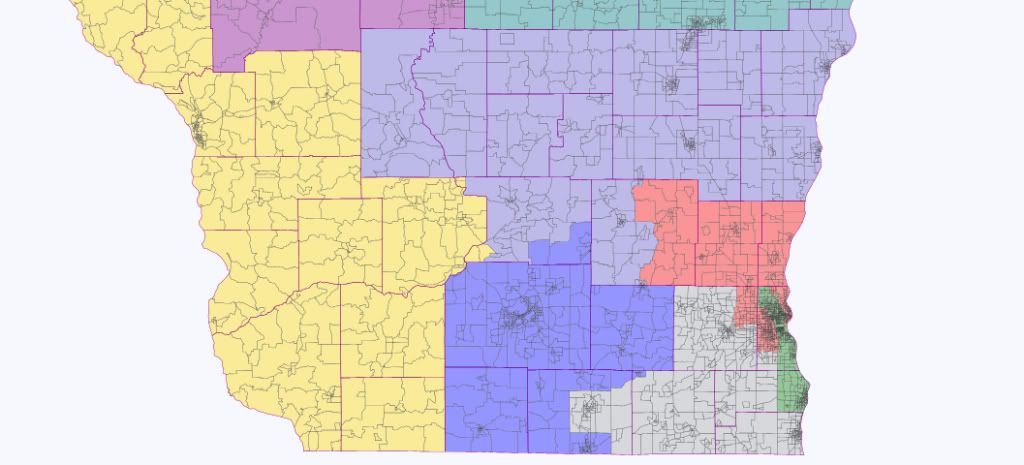
First District (Gray): This district becomes significantly more Republican with the subtraction of the city of Racine, which is heavily Democratic, and the addition heavily Republican Waukesha county.  Even if Ryan were to retire, or venture a run for Senate or some White House gig, this would likely elect another Republican.  However, given Ryan’s clout in the House, I really cannot see him wanting to give that up.

Second District (Blue) This does not change that much.  Still based in heavily Democratic and fast growing Dane County.  Baldwin or any Democrat would be favored to hold.  

Third District (Yellow):  If the GOP could not take out Ron Kind this year, they will never take him out. This still contains the lean Democratic rural parts of Wisconsin. However, to help out Duffy, I added the very Democratic northern counties and subtracted some Republican-trending Minneapolis exurbs, making this district a little more Democratic.

Fourth District (Green):  This Milwaukee-based district expands to include Racine, in order to help out Ryan.  This is actually a majority non-white district.  With Milwaukee and Racine, this still remains the most Democratic and most partisan (PVI-wise) district in the state.

Fifth District (Red):  While Sensenbrenner’s district is weakened to help Ryan is still is solidly Republican. This district does contain more of Milwaukee county, but that is more than overwhelmed by the heavily Republican and heavy turnout Washington and Ozaukee counties.  While it is likely Jim will retire soon, this will return a Republican as the Democrats have basically no Bench in this area.

Sixth District (Indigo): As Petri is also liable to retire soon, this could become ripe for a pickup.  However, the district remains a lean Republican district, so it would be an uphill climb for any Democrat.  

Seventh District (Purple):  As stated above, my other goal was to help out Duffy as I can see him becoming a potential statewide threat.  The issue is that so much of this area is fundamentally swingy.  However, with the subtraction of Wausau, Stevens Point, and the Lake Superior counties (although still keeping his home in Ashland), and the addition of some Twin Cities exurbs and traditional Republican NE Wisconsin territory, this shifts a few points Republican.   This takes out a significant amount of the Democratic bench, so this should help out the freshman significantly.

Eight District  (Teal): The downside of helping out Duffy is hurting another freshman Ribble.  The territory swap is enough to perhaps swap the PVIs.  Since this district contains so many Democratic cities (Appleton, Green Bay, Wausau, Stevens Point) this might become a marginally Democrat district. However, most of this district is traditionally Republican areas, so it is not as if Ribble is being let out in the cold.  

So the conclusion of this is that the current 5-3 split in the delegation is likely to remain, with the Young Guns of the state seeing an improvement in their districts.

California: 53-0 with 59% Obama or more

Well, here is my bid for find the limits of a Gerrymander redistricting of California. Really a lot of work for balance all the map. Only for read and paint all these precincts it is a lot of work, I can imagine the work of include all the the data and do these maps. And the work for update the maps after the census.

Like you will see in the forms of the districts, many of them with a lot of corners I force the big majority of the districts until the extreme, and other what seems better are too following the same extreme rules.

My goal doing this map is not do a nice map with nice districts, my goal here is find the limits respecting the rules for redistricting in the best way what I can do. I wish the people know and see the limits for have a good idea about the maps what we will see for California.

California has now 20 R+ districts and 19 republican incumbents. Here they are a lot of room for improve the numbers of the democratic delegation. I know not if the new commission will do something possitive for the democratic side.

All the new districts in this bid are over 59% Obama (at least D+6). I think they are enough hard for the republicans, few can survive, the map keep not their current basis.

In California is not a condition to live inside the district, but I try give to every democratic incumbent his district. For the incumbents what lives in small towns and cities I try to keep all inside his new district, and for the people what lives in the biggest cities I try to keep his home or his office inside every district. I hope do it enough well.

South California is a little less democratic than North California, but still I’m able for keep this D+6+ level for all the south. For North California I can up to 60% Obama as minimum despite to be a little more difficult find the geographic ways.

You can see the color and the data of every district in the image. The counter of the population leaves a remaining population what I see not where are, and the map have some little areas what get not colored. Nothing important for this way of use the application.

MINORITIES

HISPANIC

Hispanic majority (>50% hispanic)

Old map: 10 districts

My map: 10 districts

Hispanic-White (minority-majority district with Hispanic as first group and White as second)

Old map: 2 districts

My map: 7 districts

Hispanic-Black (minority-majority with Hispanic as first group and black as second)

Old map: 3 districts

My map: 1 district (the other 2 will be White-Black)

Hispanic-Asian (minority-majority with Hispanic as fist group and asian as second)

Old map: –

My map: 1 district

ASIAN

Asian-Hispanic (minority-majority with Asian as fist group and Hispanic as second)

Old map: –

My map: 1 district

White-Asian (minority-majority district with White as first group and Asian as second)

Old map: 4 districts

My map: 3 districts

Hispanic-Asian (minority-majority with hispanic as first group and asian as second)

Old map: –

My map: 1 district

BLACK

White-Black (minority-majority district with White as first group and Black as second)

Old map: 1 district

My map: 3 districts

Hispanic-Black (minority-majority with hispanic as first group and black as second)

Old map: 3 districts

My map: 1 district

As resume my map gives:

– 6 White majority districts

– 1 White-Asian minority-majority

+2 White-Black minority-majority

+5 Hispano-White minority-majority

– 2 Hispano-Black minority-majority

+1 Hispano-Asian minority-majority

+1 Asian-Hispano minority-majority

In this work the most difficult is to keep the level for the asian minority in North California and for the Black minority in South California. New hispanic districts appear without effort despite this map use not the data of the 2010 census.

I would need to see if the new census data make not possible the White-Black districts. If it is not possible, the map would change a little but the limit would be the same. If you take the right way more or less hispanic population in every district affect not to the limits.

MAPS

All the state

Photobucket

North California

Photobucket

South California

Photobucket

CA-01

Incumbent: M Thompson (D)

White majority district.

Photobucket

CA-02

Incumbent: –

White majority district.

Photobucket

CA-03

Incumbent: –

White majority district.

Photobucket

CA-04

Incumbent: –

White majority district.

Photobucket

CA-05

Incumbent: D Matsui (D)

White-Hispanic minority-majority district.

Photobucket

CA-06

Incumbent: L Woolsey (D) vs W Herger (R)

White majority district.

Not the best moment for her retirement since the point of this map.

Photobucket

CA-07

Incumbent: G Miller (D) vs D Lungren (R)

White majority district.

Photobucket

CA-08

Incumbent: N Pelosi (D)

White-Asian minority-majority district.

The safest district. Not casual.

Photobucket

CA-09

Incumbent: B Lee (D)

White-Black minority-majority district.

Photobucket

CA-10

Incumbent: J Garamendi (D) vs T McClintock (R)

White majority district.

Photobucket

CA-11

Incumbent: J McNerney (D)

White majority district.

Photobucket

CA-12

Incumbent: J Speier (D)

White-Asian minority-majority district.

Photobucket

CA-13

Incumbent: P Stark (D)

White-Hispanic minority-majority district.

Photobucket

CA-14

Incumbent: A Eshoo (D)

White majority district.

Photobucket

CA-15

Incumbent: M Honda (D)

Hispanic-Asian minority-majority district.

Photobucket

CA-16

Incumbent: Z Lofgren (D) vs D Nunes (R)

Hispanic-White minority-majority district.

Photobucket

CA-17

Incumbent: S Farr (D) vs E Gallegly (R)

White majority district.

Photobucket

CA-18

Incumbent: D Cardoza (D) vs J Denham (R)

White-Hispanic minority-majority district.

Photobucket

CA-19

Incumbent: –

White majority district.

Photobucket

CA-20

Incumbent: J Costa (D)

Hispanic majority district.

Photobucket

CA-21

Incumbent: –

White-Hispanic minority-majority district.

Photobucket

CA-22

Incumbent: –

White-Asian minority-majority district.

Photobucket

CA-23

Incumbent: L Capps (D)

White majority district.

Photobucket

CA-24

Incumbent: –

White majority district.

Photobucket

CA-25

Incumbent: H McKeon (R)

White majority district.

Photobucket

CA-26

Incumbent: D Dreier (R)

White majority district.

Photobucket

CA-27

Incumbent: B Sherman (D) vs K McCarthy (R)

Hispanic-White minority-majority district.

Photobucket

CA-28

Incumbent: H Berman (D)

Hispanic-White minority-majority district.

Photobucket

CA-29

Incumbent: A Schiff (D)

White majority district.

Photobucket

CA-30

Incumbent: H Waxman (D)

Hispanic-White minority-majority district.

Photobucket

CA-31

Incumbent: X Becerra (D) vs K Calvert (R)

Hispanic majority district.

Photobucket

CA-32

Incumbent: J Chu (D) vs G Miller (R)

Asian-Hispanic minority-majority district.

Photobucket

CA-33

Incumbent: K Bass (D) vs J Campbell (R)

White-Black minority-majority district.

Photobucket

CA-34

Incumbent: L Roybal-Allard (D)

Hispanic majority district.

Photobucket

CA-35

Incumbent: M Waters (D)

Hispanic-Black minority-majority district.

Photobucket

CA-36

Incumbent: J Harman (D)

White-Hispanic minority-majority district.

Photobucket

CA-37

Incumbent: L Richardson (D)

White-Black minority-majority district.

Photobucket

CA-38

Incumbent: G Napolitano (D) vs E Royce (R)

Hispanic majority district.

Photobucket

CA-39

Incumbent: Linda Sanchez (D)

Hispanic majority district.

Photobucket

CA-40

Incumbent: M Bono Mack (R)

Hispanic majority district.

Photobucket

CA-41

Incumbent: –

White-Hispanic minority-majority district.

Photobucket

CA-42

Incumbent: –

Hispanic-White minority-majority district.

Photobucket

CA-43

Incumbent: J Baca (D) vs J Lewis (R)

Hispanic-White minority-majority district.

Photobucket

CA-44

Incumbent: –

Hispanic majority district.

Photobucket

CA-45

Incumbent: –

Hispanic majority district.

Photobucket

CA-46

Incumbent: –

White-Hispanic minority-majority district.

Photobucket

CA-47

Incumbent: Loretta Sanchez (D)

Hispanic majority district.

Photobucket

CA-48

Incumbent: D Rohrabacher (R) vs B Bilbray (R)

White majority district.

Photobucket

CA-49

Incumbent: D Issa (R)

White-Hispanic minority-majority district.

Photobucket

CA-50

Incumbent: –

Hispanic majority district.

Photobucket

CA-51

Incumbent: R Filner (D)

Hispanic-White minority-majority district.

Photobucket

CA-52

Incumbent: – (likely D Hunter (R))

White majority district.

Photobucket

CA-53

Incumbent: S Davis (D) vs D Hunter (R)

White majority district.

Photobucket

Just the remaining votes what leaves the counter and some need in the area of north San Diego county make I need to leave the CD-33, CD-35 and CD-37 with higher deviation than the other districts. Still is inside the limit what gives the law if I’m not wrong, and cause of this I make not more corrections. I would need to move a decent number of districts for down the deviation, but I would not have major trouble cause of this.

Holiday Whimsy: 8 Gerrymanders that won’t happen

I don’t see the point in trying to draw actual maps until we get the Census numbers next week (and when the precinct numbers are very different from projections, updated in Dave’s app), but that doesn’t stop me from drawing new districts.  I’ve taken district counts I know won’t happen to draw districts that are hopefully different from the current ones in an interesting way.

The maps:

Indiana 7

Kentucky 8

Mississippi 3

Nebraska 4

Nevada 5

Oklahoma 7

Oregon 9 (two of these)

Indiana 7

Image Hosted by ImageShack.us

In this map, we avoid putting any of Gary (CD1, blue, 72% white), South Bend (CD2, green), and Fort Wayne (CD3, purple, also picking up Muncie) in the same district, giving three relatively vertical districts.  Considering how the population numbers didn’t really work for districts pairing these, I don’t see a Gary-South Bend district coming, especially as the Indiana GOP says they don’t want particularly ugly districts.

Image Hosted by ImageShack.us

Marion County (CD4, red, 65% white) is just under the population for a CD, so it picks up a tiny bit of the northern suburbs.  We then get districts for central Indiana (CD5, yellow, with West Lafayette, Anderson, and Indianapolis exurbs), southeast Indiana (CD6, teal), and southwest Indiana (CD7, gray, with Evansville, Terre Haute, and Louisville KY suburbs).

Kentucky 8

Image Hosted by ImageShack.us

I’m not particularly familiar with the state, so this will be brief.  We have 4 rural districts (blue, green, gray, and light purple) that are almost certainly safe R.

Image Hosted by ImageShack.us

The teal district (Richmond, Elizabethtown) is probably also Republican.  We then have a Cincinnati suburb district (purple), a Lexington to Louisville district (red), and a Louisville district (yellow, 69% white).

Mississippi 3

Image Hosted by ImageShack.us

Pretty straightforward, the state would still have one VRA seat.  CD1 [was 2] (blue, 56% black, 41% white) contains Jackson and the Mississippi River valley.  CD2 [was 1] (green, 66% white, 30% black) contains northern Mississippi with Tupelo, Columbus, and Meridian; and CD3 [was 4] (70% white, 24% black) contains Hattiesburg and the gulf.  This map might have been interesting before this year, as the 1 GOP congressman from MS was drawn out of a district.

Nebraska 4

Image Hosted by ImageShack.us

Pretty straightforward, we still have basically concentric rings around Omaha.  CD1 (blue, 72% white) shrinks to contain only part of Omaha, while CD2 contains the rest of the Omaha area and the city of Lincoln.  CD3 contains the remaining part of the east out to Grand Island, and CD4 contains the rest.

Nevada 5

Image Hosted by ImageShack.us

The largest visual change is that the Reno/Carson City area now has enough population for a district (CD5, yellow, 70% white) without rural Nevada, which is joined to the Las Vegas exurbs.

Image Hosted by ImageShack.us

CD4 (red, 71% white) is almost certainly safe R.  The other 3 seats were drawn mostly arbitrarily, we have CD1 (blue, 40% white, 40% hispanic), CD2 (green, 38% white, 38% hispanic, 15% black), and CD3 (purple, 66% white) picking up the Las Vegas area.  Looking at those percentages, I’m surprised the VRA hasn’t come up more when discussing Nevada redistricting, I wouldn’t be shocked if the new seat is considered VRA (assuming Dave’s numbers are correct).

Oklahoma 7

Another state I’ve never been in and aren’t terribly familiar with.  Despite the reasonably high non-white population, I don’t see any way to draw a VRA district here, especially as it would be a black-hispanic-native coalition district.

Image Hosted by ImageShack.us

CD1 (blue, 74% white, 10% hispanic) and CD2 (green, 76% white, 10% native) are on the Texas border, and I assume would behave similarly to northern Texas seats.  CD5 (yellow, 76% white, 11% native) is similarly on the Kansas border.

Image Hosted by ImageShack.us

We have a compact CD3 (58% white, 17% black, 16% hispanic) in Oklahoma City, and a larger CD4 (78% white) surrounding it to the east.

Image Hosted by ImageShack.us

CD6 (teal, 67% white, 12% black, 11% hispanic) contains most of the Tulsa area, and CD7 (gray, 70% white, 15% native) covers eastern Oklahoma.  I assume CD7 would be the closest equivalent to Dan Boren’s district.  Apart from that and CD3, I assume everything is safe R.

Oregon 9

A state so fun I did it twice.  The first was relatively neutral, the second time turned into what I believe is a GOP gerrymander.

Image Hosted by ImageShack.us

As much as a map can when adding 4 districts, this looks similar to the current map.  We have a large eastern CD1 (blue), a coastal CD2 (green) containing medford, and a CD3 (purple) containing Bend and Eugene.

Image Hosted by ImageShack.us

CD4 (red) contains Corvalis and what looks like semi-rural Western Oregon, CD5 (purple) is Salem based.  CD6 (teal) is the northwest corner of the state, and reaches into the Portland suburbs.

Image Hosted by ImageShack.us

I don’t think it really matters how the lines are drawn for CD7 through 9, all should be safe D.

Image Hosted by ImageShack.us

The most obvious change is that Eastern Oregon. is split between two districts.  CD2 (green) contains Medford and southeast Oregon, while CD3 (purple) contains Bend and northeast Oregon.  We also gain a very coastal CD1 (blue).

Image Hosted by ImageShack.us

Now this is a gerrymander.  CD4 (red) contains the cities of Eugene, Corvalis, Albany, and Salem and very little else.  CD5 (yellow) surrounds it and covers other rural areas.

Image Hosted by ImageShack.us

As the northeast coast isn’t being drawn into Portland districts now, there are 4 districts entirely within this shot instead of just 3.