SSP Daily Digest: 12/17

AZ-Sen: There have been vague rumblings that maybe Jon Kyl, the GOP’s 68-year-old #2 in the Senate, may not be running for another term… but that seems to be coming into sharper relief all of a sudden. Kyl has refused to publicly discuss his plans, the GOP’s state chair is saying Kyl is not likely to run again, and people are starting to notice that he’s sitting on only $620K CoH and hasn’t engaged in any fundraising yet. (Although it’s likely, once he decides, that he could quickly do whatever fundraising was needed to win.)

CT-Sen: Ex-Rep. Rob Simmons sounds torn about another Senate run in 2012, and refuses to rule it out. However, he sounds unenthused, not so much because of his odds in the general as the likelihood of butting heads with the NRSC in the primary, whom he thinks has a fixation on Linda McMahon and her self-funding ability. Meanwhile, Rep. Chris Murphy is busy framing his “no” vote on the tax compromise in populist terms, clearly trying to set up some contrasts with Joe Lieberman.

NE-Sen: I’d thought AG Jon Bruning was supposed to be some sort of killer-app for the local GOP to go against Ben Nelson, but you wouldn’t know it by the way they’ve kept casting about for more talent. Local insiders are still publicly airing their wish list, adding a couple more prominent names to it: Rep. Jeff Fortenberry and state Auditor Mike Foley. One lower-tier option is also floating her own name: state Sen. Deb Fischer, who represents that big empty north-central part of the state and says she’ll decide on a run once the legislative session is over.

OR-Sen: Best wishes for a quick recovery to Ron Wyden, who will be undergoing surgery on Monday for prostate cancer. While it sounds like he’ll be back on his feet soon, he’ll be unable to vote for anything next week, which could complicate the final rush to wrap up stuff in the lame duck.

TN-Sen: Bob Corker occasionally gets mentioned, at least in the rightosphere, as the possible recipient of a tea party primary challenge in 2012. The Hill finds that this may be fizzling on the launching pad, for the very simple reason that no one seems to be stepping forward to consider the race.

WI-Sen: PPP is out with its poll of the 2012 GOP Senate primary, with another one of those let’s-test-everyone-and-their-dog fields, but unlike some of the other states they’ve looked at in the last few weeks, a U.S. Rep. wins, rather than a statewide figure. Paul Ryan (who probably gets enough Fox News attention to trump the disadvantage of representing only 1/8th of the state) is far in the lead at 52. Ex-Gov. Tommy Thompson (who if he didn’t run this year surely isn’t going to in 2012) is at 14, ex-Rep. Mark Green is at 9, AG JB Van Hollen and new Lt. Gov. Rebecca Kleefisch are at 6, new Rep. Sean Duffy is at 5, and already-forgotten 2010 contender Dave Westlake is at 1.

IN-Gov, IN-09: Baron Hill says he most likely isn’t going to be running for anything in 2012, not Governor, and not his old seat in the 9th, saying he’s looking into private sector jobs for now, though also leaving the gubernatorial door “slightly open.” Interestingly, he seemed more enthused about a run for Governor in 2016 (which may be a tougher road to hoe, if there’s an entrenched GOP incumbent then instead of an open seat like 2012), although he also commented that “I don’t know if I’ll be alive in 2016.”

MO-Gov: In case there was any doubt, Democratic incumbent Jay Nixon confirmed that he’ll run for re-election as Governor in 2012. Nixon also said that he’s raised $1 million for that race just since November; he’ll need it.

WV-Gov: For what it’s worth, two of the state’s largest unions would like to see an expedited special election to replace Joe Manchin. Democratic House Speaker (and likely gubernatorial candidate) Rick Thompson agrees with them, saying there’s a constitutional conflict of interest in acting Gov./Senate president Earl Ray Tomblin’s dual position. In what may not be a surprise, Tomblin disagrees, saying that the law is clear that the special will be held in 2012.

CA-06: Rep. Lynn Woolsey is seeming like she may be one of the first retirements of the cycle, if the flurry of activity among lower-level Marin County politicos jockeying for position is any indication. The 73-year-old is publicly weighing retirement, and state Assemblyman Jared Huffman has already formed an exploratory committee to run in her stead. State Sen. Noreen Evans, Sonoma Co. Commissioner Shirlee Zane, and Petaluma mayor Pam Torliatt are also listed as possible replacements.

FL-25: It certainly didn’t take newly-elected Rep. David Rivera to get in legal trouble, and it’s something completely new, instead of anything having to do with that whole let’s-run-that-truck-off-the-road incident. He’s under investigation for an alleged $500,000 in secret payments from a greyhound track that he helped out to a marketing firm that’s “run” by his septuagenarian mother.

ID-01: Don’t count on a rematch from Walt Minnick (or a run for higher office in Idaho, either): he says he’s done with elective politics. An oft-overlooked fact about Minnick: he’s a little older than your average freshman, at 68. He wasn’t going to be in the seat for much longer or look to move up anyway.

NY-14: Remember Reshma Saujani, after losing the Dem primary in the 14th, said “I’m definitely running again” and “There’s no way I’m going to be ones of those folks who runs, loses, and you never see them again.” Well, fast forward a few months, and now she’s definitely not running again, although she may be looking toward a run for something in 2013 at the municipal level.

DCCC: The DCCC held its first real strategy session of the cycle yesterday, and the list of top-tier targets that emerged is pretty predictable (Dan Lungren, Charlie Bass, Charlie Dent, Bob Dold!) except for one: Leonard Lance, who’s proved pretty durable so far. They may be counting on Lance’s NJ-07, which occupies roughly the middle of the state, to get tossed into the blender in the redistricting process.

Votes: Here’s the vote tally from yesterday’s vote in the House on the tax compromise. It was a very unusual breakdown, with Dems breaking 139 yes/112 no and the GOP breaking 138 yes/36 no, with the “no”s coming generally from each party’s hard-liners, in a manner vaguely reminiscent of how the TARP vote broke down. (Also, some defeated or retiring Blue Dogs still voted “no,” like Allen Boyd, Gene Taylor, and Earl Pomeroy… while Dennis Kucinich was a “yes.”)

History: Here’s an interesting story about the end of a little-known but important era in North Dakota politics: the effective end of the Non-Partisan League, a vaguely-socialist/populist farmers’ party that cross-endorsed Democrats for many decades, and had an outsized influence on the state (as seen in their state-owned bank and similar enterprises). With Byron Dorgan retired, most NPL stalwarts dead or aging, and agribusiness having replaced the family farm, it looks like the end of the NPL’s line.

Redistricting: Dave Wasserman is out with a preview of next week’s reapportionment, and he’s rightly treating it like the NCAA playoffs draw, in that there a bunch of states on the bubble of getting or losing seats. Here’s how that plays out:

Georgia, Nevada, and Utah are all but certain to gain an additional seat in the House, while Iowa, Louisiana, Massachusetts, Michigan, Missouri, New Jersey, and Pennsylvania are all but certain to lose a seat and Ohio is all but certain to lose two seats…. the ten states in contention for the “last five” seats in the House (in order of likelihood to make the cut) are South Carolina, Florida, Minnesota, Washington, Texas, New York, California, Arizona, North Carolina, and Illinois.

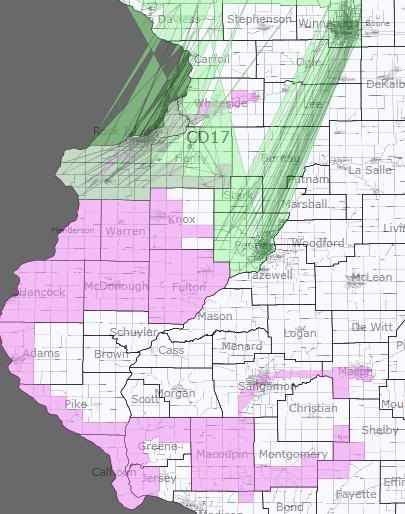
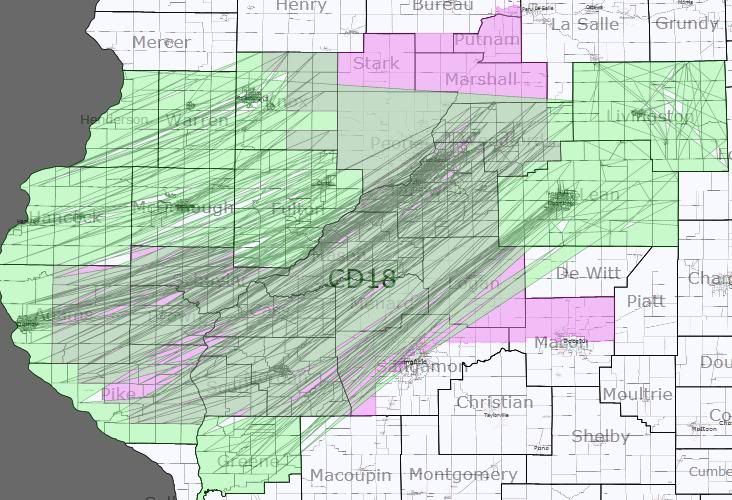
He’s also been tinkering around with Dave’s Redistricting App, and has some maps that you’ll want to check out. Maybe most interestingly, there’s a solution to the IL-17 problem that actually makes it more Democratic while letting Aaron Schock and Bobby Schilling get much better acquainted with each other (the Fix also takes a look at Illinois today, coming up with similar ideas). Also worth a look: a good 10-district Washington map that gives Dave Reichert a heaping helping of eastern Washington.

Site news: Due to holiday travel, other time commitments, and hopefully what will be a very slow news week, the Daily Digest will be on hiatus all next week. Don’t worry, though: I’ll make sure to be around on the 21st for the Census reapportionment data release (hell, maybe I’ll even liveblog the news conference), and if there’s any important breaking news, someone will get it up on the front page. In the meantime, happy holidays from the whole SSP team!
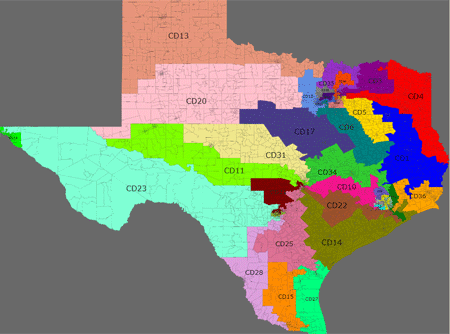
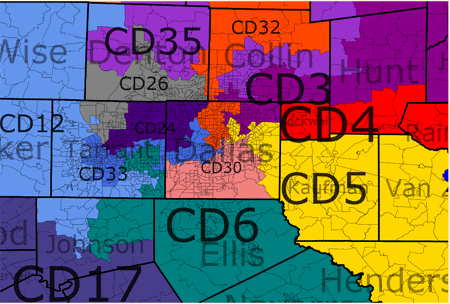
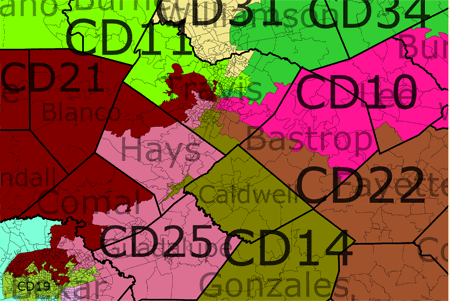
Texas 25R-9D-2 Non-Dummymander

Redistricting Texas was a bit of a chore.  To do this with an eye to how the GOP legislature might do so requires balancing a number of considerations.  These are at loggerheads with each other to some degree:

(1) A desire to protect new GOP incumbents Farenthold and Canseco;

(2) A desire to shore up increasingly vulnerable GOP incumbents in TX-10, TX-24 and TX-32

(3) Compliance with the VRA.

First, a primer on the VRA.  It does not require that a state with a 38 percent population have 38 percent of its districts be Hispanic opportunity districts.  It doesn’t necessarily require any.

Instead, it requires only that distinct populations be given a reasonably compact district if it is possible to draw one.  This is a problem in Texas, where the Hispanic population is fairly subsumed within the anglo and African American populations.  West Texas has a fairly large Hispanic vote, but it is impossible to create anything approaching a minority majority district there — in fact, almost all of these districts have at least a 15% Hispanic population, but they can’t be used to draw a compact district. In the 2006 Texas redistricting litigation, the district court found that Texas could support only 6 Hispanic opportunity districts (although I counted 7).  I don’t think it has increased all that much recently.

There’s a second complication in Texas, which is that there’s a difference between the population and the voting population.  Both undocumented and documented workers count for census purposes, even though neither can vote.  In Texas this creates a substantial discrepancy between the numbers shown by census voting-age population (VAP), and the Citizen Voting Age Population (CVAP).  Throw in lower turnout among hispanics in general, and it gets very difficult to draw VRA districts.

The basic theory behind the map, therefore, is as follows.  Keep all the present Hispanic opportunity districts as close to the current lines as possible.  Anything that’s around 60 percent Hispanic should be an Hispanic opportunity district (the district Court in 2006 seemed to accept that TX-25 would be an Hispanic opportunity district with 55% Hispanic population; it was struck down because it was not sufficiently compact to count as a VRA district).  If you can keep the white vote below 30% or so, that can change, although an African American population that starts to approach the Hispanic population can overwhelm it in a Dem primary.

I created something looking like an Hispanic opportunity district in the DFW area.  To illustrate just how difficult this is, you’ll note that this and the 30th are now awfully close to electing an Anglo Democrat, and these lines are pretty convoluted.  It may well be that the VRA doesn’t require any additional minority-majority districts in Texas, although drawing close to one in DFW is a good idea for shoring up GOP incumbents.

A few other notes.  I didn’t know exactly where Blake Farenthold lived, so I drew his new district to where Farenthold Consulting was located.  The baconmander of Dallas county is avoidable with precise locations for the incumbents; because I didn’t want to draw two Congressmen together, I kept the Dallas portions of their old districts more-or-less intact.

The centerpiece of the map is the 8-way split of Austin.  I don’t know where Lloyd Doggett lives and I don’t think it matters; he runs in a 58 percent McCain district no matter what.

I have to say, given what I did, I was pleasantly surprised that the districts look as regular as they do.  It might actually look better than the current map . . .

Without further adieu…

Photobucket

(1, Gohmert) 31% Obama/68% McCain, 70W/17B/11H (old 31O/69M, 68W/18B/13H) — Gohmert’s district goes further South now, but retains the Tyler base.  Without the Dallas Baconmander, it could be made more compact.

Photobucket

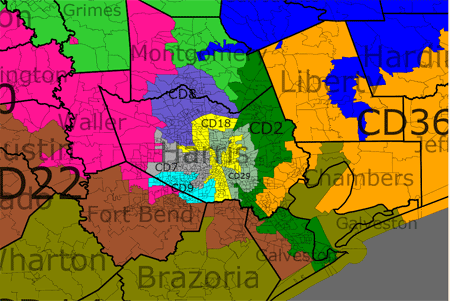
(2, Poe) 40Obama/60McCain, 61W/13B/22H (old 40O/60M, 57/21/18) — This district grew 14 percent and has to shrink — it is now contained almost entirely within Harris County.  A leg goes down to Galveston and Texas City to take Democratic votes from the 14th to offset the votes that district gains in Austin (cue ominous foreshadowing music).

Photobucket

(3, Johnson) 40Obama/59McCain, 65W/11B/16H (old 42O/57M, 56/10/21) — This baconmander would be avoidable if I knew where Johnson resided (even better if he retired . . .).  For now, it takes in its old portion of Dallas, and then extends out to rural North Texas.  It is made slighly more Republican.

(4, Hall) 30O/70M, 75W/16B/7H (old 30/69, 75/10/11) — Because of the situation with the Third district, this has to be pretty grotesque.  This one is also much easier if Hall retires, or with his precise location (as that would allow using some of Rockwall to shore up the third without putting it out in N Texas, which in turn would allow the 4th to keep its old shape.

(5, Hensarling) 39O/61M, 69W/13B/14H (old 36/63, 65/13/19) — Hensarling’s district doesn’t change all that much, though due to population growth it loses some heavily Republican rural portions.  Still, he should have a nice home for the rest of the decade.

(6, Barton) 37O/63M, 68W/12B/15H (old 40O/60M, 58/15/21) — Normally I wouldn’t have shored up a district, but Barton is a bit, um, controversial, so I thought he would want to know that his district would be safe through 2020.

(7, Culberson) 40O/59M, 62W/6B/24H (old 41O/58M, 59/8/23) — This district retains much of its old territory.  I made it a touch more Republican.  I figured if Culberson got 56% of the vote while being outspent 2-1 in 2008, he was going to be pretty safe.  My first time through I had this at 61 percent, but then my computer crashed before I wrote it up.  So this could be improved.

(8, Brady) 31O/68M, 74W/6B/14H (old 26O/72M, 77/9/12) — This district is now entirely within Harris and Montgomery Counties, which should make Brady happy.  It’s a bit more Democratic, but I don’t think he’ll notice.

(9, Green) 74O/26M, 19W/34B/34H (old 77/23, 14/36/40) — Al Green’s district expands to pick up some more African American voters, and sheds some white voters to the 7th.  Not much change here.

Photobucket

(10, McCaul) 40O/59M, 62W/12B/21H (old 44/55, 59/10/25) — McCaul is one who could use some help — although in a terrible Republican year he beat back a stiff challenge handily.  His district gets some more Houston suburban lovin’, which ratchets it up a few notches.

(11, Conaway) 41O/59M, 64W/6B/26H (old 77M/24O, 61/4/33) — This district retains its Midland base, but picks up a chunk of Austin to become quite a bit more Dem.  Still — and this is important to remember for the rest of the map — 59%McCain is still roughly R+13, which should be enough to win throughout the decade.

(12, Granger) 35O/64M, 79W/4B/11H (old 36/63, 63/6/27) — Not a lot of changes here; drops some of its minority population to create the new 33rd.

(13, Thornberry) 23O/76M, 69W/6B/23H (old 23/76, 70/6/21).  Not much you can do here — the district is Amarillo, and there isn’t another Democratic hub within 500 miles of the place.  Note, however, that the district is a quarter Hispanic.  This is what I’m talking about re the problems of creating Hispanic majority districts here.  

(14, Paul) 41O/58M, 57W/8B/32H (old 33O/66M, 59/9/27) Paul gets a chunk of Austin as well.  It is a more Democratic district, but he should still be able to win pretty handily.

Photobucket

(15, Hinojosa) 66O/33M, 13W/0B/85H (old 60/40, 17/2/80) — This district has grown a lot, and so it shed some of the anglo counties to the north.  Hinojosa actually had a bit of a close call in ’10, but that won’t happen again in this district.

(16, Reyes) 68O/31M, 15W/3B/81H (old 66O/33M, 14/3/81) — No big changes here.

(17, Flores) 35O/64M, 67W/15B/15H (old 32O, 67M, 69/10/18) — This district is a bit more Democratic, but its a ton of new territory, which should prevent a Chet Edwards comeback.

(18, Jackson Lee) 83O/16M, 19W/51B/26H, (old, 77O/22M, 16/38/42) — The original Texas minority-majority district, it sees its African American percentage increased substantially, as it shed white voters to the 7th and Hispanics to the 29th.

(19, Gonzales) 66O/33M, 22W/9B/66H (old 63/36, 21/6/70) — I switched the 19th and 20th, because I’m colorblind and was having troubles with the 19th and 23rd.  This gives up some population to the 28th, which allowed me to do an ugly gerrymander that shored up the 21st to compensate for getting parts of Austin.

(20, Neugebauer) 27O/72M, 67W/6B/24H (old 27O, 72M, 61/5/32) — Again, not much you can do with these voters.  In theory you could put this one into Travis County as well, but that would be greedy.  Also, note the 32 percent Hispanic population.

I really should have broken this into two pieces.

(21, Smith) 40O/58M, 70W/3B/23H (old district 40O/59M, 63W/7B/26H) — Smith never had any troubles in his old district, so the addition of the Austin territory shouldn’t hurt him.  It’s not downtown Austin, so we’re not talking heavily Dem stuff.

(22, Olson) 41O/58M, 60W/9B/22H (old district 41O/58M, 51W/13B/24H) — this gets some of Austin as well.  But unless Olson gets himself indicted for money laundering and the GOP runs a write-in candidate with a hyphenated last name, he should be ok.

(23, Canseco) 47O/52M, 36W/2B/60H (old district 51O/48M, 29W/3B/66H) — I think this is testing the outer limits of what you can do and still comply with the VRA here.  It should still be considered an Hispanic opportunity district though, although one that leans more to the right.  In a bad GOP year, it will probably elect a Democrat.

(24, Marchant) 38O/61M, 68W/6B/18H (old district 44/55, 53/12/25) — Marchant is another big winner from the creation of the 33rd.  A substantial increase in Republican performance here.

(25, Ducky) 43O/56M, 61W/5B/31H (old district 59O/39M, 51W/9B/37H) — A small sliver into Corpus connects Farenthold to what is essentially a new South-Central Texas district.  I would have liked to have gotten the GOP percentage up a few more notches, since he is so weak, but it just isn’t feasible.  This doesn’t go much into downtown, so I don’t think I picked up Dogget’s residence.

(26, Burgess) 37O/62M, 77W/6B/11H (old district 41O/58M, 62/13/19) — Burgess is another Dallas winner.  his district has seen massive growth, so this is quite a bit more compact.  He loses quite a bit of minority population to the 33rd.

(27, open) 53O/46M, 27W/2B/69H (old district 53O/46M, 25W/2B/71H) — Since the old district elected a very weak Republican once, I figured that I should keep it more-or-less intact if possible, on the off chance that it might do so again.  The only real change is that a few rural precincts are added, and three Corpus precincts are put into the 25th.

(28, Cuellar) 70O/30M, 11W/3B/85H (old district 56O/44M, 19W/1B/79H) — This district gets a bigger chunk of Hispanic voters in San Antonio who are apparently MUCH more reliable Democratic votes than those on the border.  Cuellar may actually not be able to survive here.

(29, Green) 63O/36M, 20W/10B/67H (old district 62O/38M, 16/10/72) — This remains an Hispanic opportunity district, which would probably still elect an Anglo Democrat.  Again, this illustrates just how tough it is to really create a Hispanic opportunity district here.

(30, Johnson) 79O/21M, 26W/44B/27H (old district 82/18, 17/39/41) — This district has to become quite a bit whiter in order to help make the 33rd.  Still, Johnson should win the primary and the general.

(31, Carter) 40O/58M, 71W/7B/18H (old district 41/57, 63/12/19) — Carter gets a little boost in Republican performance, but he was never really in any jeopardy in the first place.

(32, Sessions) 40O/59M, 69W/6B/19H (old district 46/53, 44/8/42) — After a relatively close shave against a weak opponent in 2008, Sessions gets a big boost from creating the 33rd.  It is a bit ugly; in reality if I knew where Johnson and Hall lived, I’d probably push it more into the 3rd, push the 3rd more into the 4th, and have the 4th get a lot of this northern Collin County territory.  But I might inadvertantly put those guys in the same district, so you get what you get.

(33, new) 71O/29M, 25W/21B/50H Minority-majority district.  Its ugly, and it still might elect a white Democrat.  But its the best you can do and even if the GOP doesn’t HAVE to draw it, it will probably still try to do so to shore up the other Reps.

(34, new) 39O/60M, 67W/11B/18H

(35, new) 35O/63M, 78W/5B/11H

(36,new) 37O/62M, 66W/17B/13H

Minnesota Redistricting Part 1

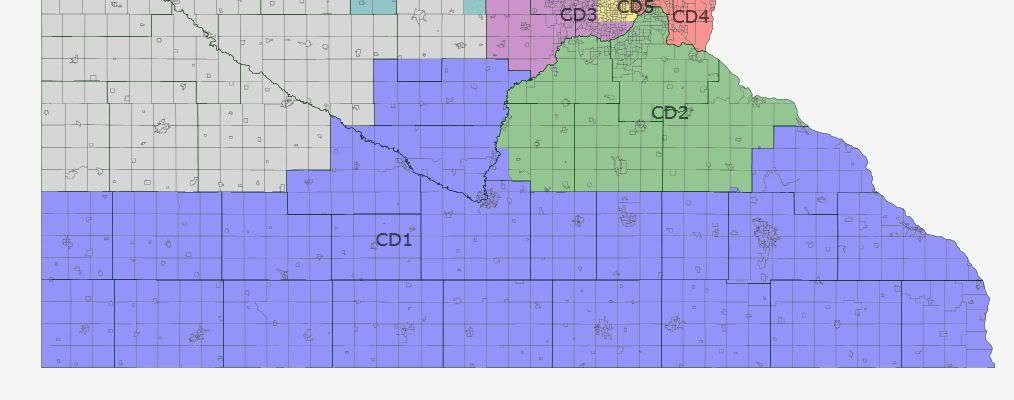
Well, seeing as how I just finished a short research paper on Minnesota congressional districts for one of my classes, I thought it would be a good idea to give the diary thing a try before I get too busy with finals. This is the first in a series of Minnesota maps, some possible and others, unfortunately not. The first map is below:

My goal with this map was to predict the outcome of the redistricting process given the current situation – Republican legislature and Democratic governor. I assumed that Minnesota will keep its eigth seat becasue new estimates suggest that will happen and Minnesota had a very high census response rate. I may have been too optimistic by drawing Craavack out of the 8th (God I hope that happens) but if that were to happen to anyone, it would be him since he has the least seniority and influence. Close ups of the districts are below. In some of the close ups, green represents new additions to the district and purple/pink represents areas that were lost.

First District – Blue – Walz (DFL)

Likely DFL

The 1st remains largely unchanged, picking up Sibley county (53-30 Emmer, 58-39 McCain) and small pieces of Le Sueur, McLeod, Goodhue for population balance. This new district voted 40-46-13 Dayton/Emmer/Horner but reelected Tim Walz. Obama would likely have one this district in 2008 as well since very little has changed.

Second District – Green – Kline (R)

Safe R

Not much happens to Rep. Kline’s southern suburbs district either. It pulls out of Washington and Carver counties to make way for the urban districts to expand. It takes West St. Paul back from the fourth to preserve county lines and gives up a few precints on the southern edge for population balance. Emmer won this district 38-49-19 as well as McCain. The new Chariman of the Education and Labor Committee won’t have a problem holding this.

Third District – Purple – Paulsen (R)

Likely R

Hennepin County has lost some population and so Paulsen’s district has to expand outward. It picks of Carver County and a small part of Anoka County that used to be in the fifth district. This district currently has a PVI of D+0 but the expansion into Carver County (57-42 McCain, 28-58-13 Emmer) it becomes more Republican. This may be winnable for a moderate Democrat in a good year but otherwise, Paulsen should be safe.

Fourth District – Red – McCullom (DFL)

Safe DFL

This district gives its part of Dakota County back to the second district and picks up the southern half of Washington County. I wanted to add all of Washington so that Bachmann’s home would be here but that isn’t realistic to expect the Republican legislature to agree to that. It may happen if the courts draw the lines and only pay attention to population but that is unlikely. This district is currently D+13. It may have dropped slightly in this map with the addition of part of Washington County but not significantly.

Fifth District (College) – Yellow – Ellison (DFL)

Safe DFL

There isn’t much to see here. The fifth district gives up the little piece of Anoka County (Fridley and Columbia Heigths) and picks up a slightly bigger piece (population wise atleast) in the southwest inner suburbs (Edina). This district is currently D+23 and probably would stay that way.

Sixth District – Teal – Bachmann (R)

Likely R with Bachmann, Safe R with anyone else

Bachmann’s district undergoes the biggest changes. The sixth district trades Sherburne and part of Stearns (St. Cloud, home of Tarryl Clark)for Isanti and Chisago (Chip Cravaack’s home). It also picks up Meeker County and small parts of Anoka, Washington, and McLeod while giving up part of Washington to McCullom. With the loss of St. Cloud and the addition of Meeker, this district becomes more Republican. Since Bachmann is so crazy, this may be likely R with a great DFL candidate and a good year. This would definitely be safe with any other Republican. Cravaack also lives in this district but would Bachmann would easily defeat him at the district convention or primary.

Seventh District – Grey – Peterson (DFL)

Safe DFL with Peterson, Lean R when open

This district is mostly the same with just few changes in central Minnesota. It picks up the rest of Beltrami as well as all of Hubbard, Cass, and Wadena from the eigth district. It loses Meeker, Sibley, and part of McLeod to balance out the population. This mostly rural district voted for McCain 47-50 and likely voted for Emmer over Dayton. This is Safe DFL with Peterson running but would probably be lean R at best when he decides to retire.

Eigth District (Home) – Slate Blue – Cravaack (R)

Lean DFL

A few weeks before the election, I confidently declared that Jim Oberstar would not lose. Unfortunately, I was wrong but now Rep.-elect Chip Cravaack is high on the target list for 2012. His new district trades Chisago and Isanti for part of Stearns (St. Cloud) and Sherburne. Cravaack no longer lives in this district but could easily move 20 miles up I-35 if he wanted to. Drawing Cravaack may not be possible with the Republican legislature but, since he has no seniority and very little influence, pretty much everyone has little incentive to listen to him. With Cravaack as the incumbent, this district is Lean DFL and woud be Likely DFL if the incumbency effect was not in place.

Overall, this map produces a 5DFL-3R split that would hold up in all but the worst years (like 2010). Once Peterson retires, it would become 4DFL-4R unless the DFL could find a moderate/populist to run.

Any suggestions and comments are welcome. this is my first complete map and diary so any insight would be greatly appreciated especially since I’m young don’t know a lot about the history of politics in Minnesota and how that might affect the results using this map or any historic district boundaries. Any information on that would be helpful too. Thanks!
What if Oregon Gets That Sixth District?

Oregon is one of the closest states, at last projection, to adding a House seat (and an electoral vote). I believe the Democrats should be cheering for this outcome, and here is why.

I think this map should shake out to a 5D-1R split in a neutral year, although Republicans may be able to swing the new OR-06 in an especially good year.

OR-01 (salmon, safe Democratic)

Democratic Rep. David Wu’s district consolidates to the western Portland suburbs, Portland’s West Hills, Columbia County, and the Oregon side of the Columbia River Delta. Wu is safe now in a district that includes a lot more reddish territory. He’s safe here.

OR-02 (red, safe Republican)

Eastern Oregon will never, ever vote for a Democrat. As incumbent Republican Rep. Greg Walden, who lives in Hood River, has been drawn out of this district, I think the electorate here would be happy to elect a more conservative Republican. State Senate Minority Leader Ted Ferrioli of John Day would be a top recruit, but really, Some Dude could win here as long as he touted his conservatism and ran on the Republican ticket.

OR-03 (green, safe Democratic

This district is basically just most of Multnomah County. Democratic Rep. Earl Blumenauer could get reelected here until the day he dies. After that, I’m sure this district would be happy to elect any other Democrat.

OR-04 (purple, safe Democratic)

Yes, it still includes Linn County. Yes, it retains most of Douglas County. It also includes all of Lane County, including the People’s Republic of Eugene. It also includes the most liberal parts of the Oregon Coast. Democratic Rep. Peter DeFazio is safe here. If and when he retires, I like Albany Mayor Sharon Konopa to succeed him, although I have no idea if she’s interested; running on a platform of environmental conservation and responsible urban growth management in a city renowned for being a conservative island in the middle of the sapphire Willamette Valley, she stomped the chairwoman of the Linn County Republican Central Committee in a nonpartisan election last month.

OR-05 (yellow, likely Democratic)

Yamhill and Polk counties are Republican, but Benton County is Democratic, and Marion County is bluer than not, especially with the influx of Latinos along the I-5 corridor from Salem to Aurora. The district also includes southern precincts of Washington and Clackamas counties. Democratic Rep. Kurt Schrader has been drawn out of this district, but Brian Clem, a Salem-area state representative who briefly was a candidate for governor this cycle, is probably in line to succeed him in any district centered on Salem. Fellow Salem-area representatives Kevin Cameron and Vicki Berger are probably the likeliest Republican entries, although I think Berger is too moderate to win in a primary. Matt Wingard, a representative from Wilsonville, could pick up support from the conservative wing of the party if he ran, but any competent Democrat would clean his clock in a district like this.

OR-06 (blue, lean Democratic)

This is the new district, and it could swing. But it includes the Democratic stronghold of Hood River County, most of blueing Clackamas County, and all of blueing Deschutes County. Not sure if it would have gone Republican this year; I believe Gov.-elect Kitzhaber narrowly lost the portions of the state included in this hypothetical district, but Sen. Wyden won it pretty handily. Democratic Rep. Kurt Schrader and Republican Rep. Greg Walden have both been drawn into this district. The terrain is more familiar for Walden, but Schrader has a base in populous Clackamas County and probably an overall advantage in terms of what politics are likely to play here. If Walden wants to move next door, Chris Telfer, a Bend-area state senator, would be the Republicans’ top recruit here; if Schrader would prefer to run in OR-05, his current district, the Democrats would probably like to turn to Rick Metsger, a Mount Hood-area state senator.

This whole exercise may be entirely academic. We’ll know for sure on 21 December…

10-3 Republican Non-Dummymander of North Carolina

Photobucket

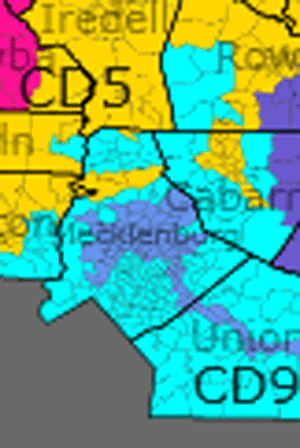
This was intended to test the extent to which the GOP could wreak havoc with North Carolina redistricting, while remaining VRA-compliant.  The key to the map is taking Mel Watt’s 12th district, and sending it eastward instead of northward (which is what the Bush Administration was trying to force NC to do in the early 1990s.  This allows massive packing of Democrats in the RTP/Greensboro/Winston-Salem area into a heavily Democratic district, that is a borderline third VRA district.  As an additional bonus, it places McIntyre, Watt and Kissell in the same district.

This would obviously engender a Shaw v. Reno-type challenge, but again, this is simply meant to test boundaries.  You can smooth the lines out in the 12th and 1st to make them not all that much worse than they presently are, especially if you don’t try to pack the three Congressmen together into the 12th.

I assumed that any district that gave McCain at least 54% of the vote would be pretty safe for Republicans, especially considering that high African American turnout probably skews these districts a touch toward the Democrats right now.

Without further adieu . . .

First District (Butterfield) — 70% Obama, 30% McCain, 42% White, 50% Black, 5% Hispanic (old district 63% Obama, 37% McCain, 50% black, 43% white, 4% H.).  This district needs to gain population, and the only way to do that is to extend it into Raleigh or Durham.  I chose the latter.  In reality, it is difficult to keep this black-majority, but you probably don’t need to do that to remain VRA compliant, which allows some smoothing of the lines (at the expense of making the 3rd/13th more Democratic).

Second District (Ellmers) — 45% Obama, 54% McCain, 67% White, 23% Black, 6% Hispanic (old district 53/47 Obama, 58/29/10 W/B/H).  This district no longer resembles a dragon viewed from above.  Ellmers loses Democratic portions of Fayetteville and Wake County, and trades them for Republican areas there.

Third District (Jones) — 42% Obama, 57% McCain, 72% White, 21% Black, 4% Hispanic (old district 62/38 McCain, 75/16/5 W/B/H).  Jones’ district loses some heavily Republican precincts on the western edge of the 1st, and gains Democratic areas in Duplin and Pender. If the 1st has to be smoothed out some, I’d extend this one down to downtown Wilmington to shore up the 7th.

Photobucket

Fourth District (Price/new minority Rep) 79% Obama, 20% McCain, 45% White, 42% Black, 8%Hispanic (old district 62/37 Obama, 66/19/8 W/B/H) — This basically packs as many Democratic precincts in the area as possible into one district.  I think this is probably a third VRA district, since African Americans would probably control the Democratic primary, and the district would almost certainly elect whomever comes out of that primary.

Fifth District (McHenry) — 59% McCain, 40% Obama, 78% White, 16% Black, 4% Hispanic (old district 63/36M, 83/9/5 W/B/H).  I flipped the district numbers here just to make the maps more readable.  McHenry gets a lot of new territory, but most of it is reliably Republican and he should have little difficulty winning here.

Sixth District (Coble) — 43% Obama, 56% McCain, 83% White, 11% Black, 5% Hispanic (old district 63%/36% McCain, 82%W, 10%B,6%H).  Coble actually gets to keep a lot of his old territory.  You could smooth out the lines with the 13th and make it look a lot more “normal” without affecting its performance that much.

Seventh District (Open) — 44%Obama, 56% McCain, 69% White, 23% Black, 5% Hisp, 2% NA (old district 52%M/47%O, 64/21/6 W/B/H, 8% NA) — The black/hispanic percentages don’t change much; the key is moving Lumbee Native Americans from Robeson County into the minority-majority 12th.  McIntyre goes with them,and this new district should easily elect a Republican.

Eighth District (Open) — 44% Obama, 55% McCain, 81% White, 10% Black, 5% Hispanic (old district 52/47 Obama, 58/28/9 W/B/H) — Kissell gets moved into the 12th.  It would be pretty simple for him to move into this district, but it is much less hospitable for him.  The new GOP voters in Randolph County and thereabouts are true GOPers, not the remnants of Southern Democrats that inhabit the current 8th.

Photobucket

Ninth District (Myrick) — 44% Obama, 55% McCain, 83% White, 10% Black, 4% Hispanic (old district 55/45 McCain, 77/13/6) — The topline numbers don’t change on Myrick’s district, but the racial composition changes a hair.  It’s whiter now, meaning that in years where the GOP doesn’t completely alienate everyone, it will swing further to the right than its current makeup.

Tenth District (Foxx) — 43% Obama, 56% McCain, 88% White, 6% Black, 4% Hispanic (old district 61/38 McCain, 85/7/6).  She gets a chunk of Asheville, in order to shore up the GOP #s in the 11th, but this is still Republican enough that she should win handily.

Eleventh District (Shuler) — 57% McCain, 42% Obama, 89% White, 5% Black, 3% Hispanic (old district 52/47 McCain, 88/5/4 W/B/H) — Shuler loses most of Asheville, and I think he’d have a very, very difficult time winning this.  He’d have lost by about 6 points to a no-name in 2010.

Twelfth District (Watt, Kissell, McIntyre) — 72% Obama, 27% McCain, 38% White, 43% Black, 8% Native American, 7% Hispanic (old district 71/29 Obama, 41/44/11 W/B/H) — Not too much to say here, except that this is the lynchpin of the entire plan.  It’s what makes the 8th and 7th very, very difficult to win for Democrats.

Thirteenth District (Miller) — 45% Obama, 54% McCain, 77% White, 18% Black, 3% Hispanic (old district 60/40 Obama, 60/28/9 W/B/H).  I don’t know what precinct Miller is in; he may well be drawn into the First (or could easily be drawn there).  Regardless, I have a hard time seeing him winning here, except if 2012 is a very good Democratic year.

Thoughts?

Daves Redistricting 2.0.2

Last night I uploaded Version 2.0.2. This fixes a couple of bugs with 2.0.1 and introduces a new feature that I hope you like… Change Colors!

You can now change CD colors and change the opaqueness of the CDs essentially making them lighter or darker)! I also made the Old CD lines a little thicker and changed the county line color.

Launch Page

Please let me know what you think. Also, check out the Help page for lots of good information.

This will be all the changes for a little while, unless a bad bug is found. I’m working on a plan for next year and will let you all know about that when it’s ready.

Thanks!

Maryland Redistricting: 7-1 Democratic

Cross posted on Daily kos  http://www.dailykos.com/story/…

and my blog http://frogandturtle.blogspot…. which you should visit for more redistrcting maps and election analysis.

Like in 2001, Democrats hold the trifecta in Maryland again. This means that not only do they control the Governorship, they also control both houses of the state legislature. In 2001, the congressional delegation was 4-4 but Democrats redrew the maps to make a favorable Democratic map that accomplished its goal of removing 2 of the 4 Republican representatives. After 2002, there were no party changes until 2008 when Frank Kratovli (D) ran in the 1st district which contains conservative Baltimore suburbs and the Eastern Shore. He barely won against an extremist candidate. Unfortunately for the Democrats, he lost in 2010 by 13 points. Therefore, the delegation has returned to its original 6-2 Democrats. Maryland has turned more blue though since 2002 due to more African Americans moving into Prince Georges and Charles Counties. Also, Hispanics, Asians and white liberals are moving into Montgomery County and even Frederick County. The Baltimore suburbs are actually trending Republican but that’s a different post for a different day.  

Still, with Maryland trending Democratic overall, it is now possible to construct a 7-1 Democratic map. I have even seen some 8-0 Democratic maps but some districts are too shaky and can result in a dummymander when Republicans are able to pick up 1,2 or even 3 of those seats. I chose to draw a 7-1 map because I think it is close to what the state legislature will draw. While drawing the map, I made sure the 4th and 7th districts remained majority African American because of the VRA requiring 2 African American majority districts. While drawing the map, I made sure no district except for the Republican 6th fell below 54% Obama. Also, I made sure 6 of the districts were at least 58% for Obama. This map should protect all the Democratic incumbents, one Republican incumbent and create a new district that leans Democratic. Now here is Maryland’s current map:

Maryland’s current map: http://www.nationalatlas.gov/p…

Maryland

             Statewide map of Maryland

Maryland’s 1st Congressional District: Andy Harris (R) (blue)

Partisan Data: Obama 137,680 54%, McCain 113,225 44%

Demographics: 23% African American, 5% Hispanic, 68% White

Old District’s Partisan Data: McCain 58%, Obama 40%

Major Cities: Annapolis, Salisbury

Status: Likely Democratic

This district makes some major changes when I moved conservative suburbs in Harford and Anne Arundel out into other districts such as the 6th and 7th while adding in Democratic Annapolis and some neighborhoods in heavily Democratic Prince Georges County and places in Anne Arundel County such as Odenton which will become more Democratic due to in migration by African Americans. Harris’s base is in conservative Harford County which I removed. Frank Kratovli (D), the representative before 2010 of the 1st now has a great shot at retaking this district because of the new Democratic areas in the district. The district’s Democratic lean may be overstated due to high Obama turnout in Prince Georges County but as the areas in Anne Arundel keep getting more Democratic, they should offset any drop in turnout. Also, Kratovli tends to over perform in the Eastern Shore so with big margins in Prince Georges and Anne Arundel Counties, he should win here.

Baltimore Area

                                       Baltimore Area

Maryland’s 2nd Congressional District: Dutch Ruppersberger (D) (Green)

Partisan Data: Obama 155,376 58%, McCain 107,691 40%

Demographics: 24% African American, 68% White

Old District’s Partisan Data: Obama 60%, McCain 38%

Major Cities: Baltimore, Towson, Dundalk

Status: Safe Democratic

Ruppersberger’s district gets less convoluted by losing all of its Anne Arundel County portions and picking up swingy Towson which was originally in the 3rd district. Although the 2nd district retains some Republican suburbs around Edgemere, it still remains Democratic by picking up more Baltimore City neighborhoods. They also help balance out the loss of some heavily Democratic precincts in Randallstown. Ruppersberger should be fine here.

Maryland’s 3rd Congressional District: John Sarbanes (D) (Purple)

Partisan Data: Obama 164,297 62%, McCain 96,626 36%

Demographics: 26% African American, 8% Asian, 60% White

Old district’s partisan data: Obama 59%, McCain 39%

Major Cities: Randallstown, Columbia, Catonsville

Status: Safe Democratic

I am aware of the fact John Sarbanes does not live in this district but it still contains Democratic Columbia. The district undergoes some major changes though. It retains parts of Baltimore County but loses nearly all of Baltimore City and all of Anne Arundel County. It even picks up some Republican areas in southern Carroll County. Sarbanes is still safe though because his district picks up some heavily African American areas in west Baltimore County, bringing the African American population in the district from 16% to 26%. I am not sure the state legislature will support this district though because in their mind, it may need more of Sarbanes’s old district and they may not want to extend this into Montgomery County. Still, this is a safe district for Sarbanes.

Washington Suburbs

                                       Washington Suburbs

Maryland’s 4th Congressional District: Donna Edwards (D) (Red)

Partisan Data: Obama 212,819 88%, McCain 27,795 11%

Demographics: 54% African American, 17% Hispanic, 6% Asian, 21% White

Old District’s Partisan Data: Obama 85%, McCain 14%

Major Cities: Fort Washington, Chillum, Silver Spring

Status: Safe Democratic

The district remains VRA protected and gets even more Democratic although Edwards was more than safe here already. The district becomes smaller and loses more moderate areas in northern Montgomery County while picking up part of Wheaton in Montgomery County. I would have extended this district out into more swingy areas in Montgomery County but the 3rd district took them for population reasons. I am not sure if the legislature will send Edwards’s district to pick up some Republican areas to help protect other incumbents or make a district similar to mine.

Maryland 5th Congressional District: Steny Hoyer (D) (yellow)

Partisan Data: Obama 176,048 66%, McCain 89,006 33%

Demographics: 36% African American, 5% Hispanic, 53% White

Old District’s Partisan Data: Obama 66% McCain 33%

Major Cities: St. Charles, Bowie

Status: Safe Democratic

Hoyer’s district remains strongly Democratic although retaining Republican St. Mary’s, Calvert and Anne Arundel Counties. The Democratic votes in Charles (which is getting even more Democratic due to migration from Prince Georges County,) and Prince Georges County more than counterbalance the Republican areas. The only changes in this district are the addition of Fairland in Montgomery County which leans Democratic and the switching around of some Prince Georges County precincts. Hoyer should be happy with his new district.

West Maryland

                                        West Maryland

Maryland’s 6th Congressional District: Roscoe Bartlett (D) Teal

Partisan Data: Obama 105,718 36%, McCain 183,765 62%

Demographics: 5% African American, 90% White

Old District’s Partisan Data: Obama 40% McCain 58%

Major Cities: Hagerstown, Bel Air, Cumberland

Status: Safe Republican

This district contains the fast growing red Baltimore suburbs, the D.C suburbs that lean Republican and the older communities in the Appalachian Mountains. At a first glance, it appears that the lines do not change much. Actually, they do change a bit and these changes make the district more Republican by removing most of Frederick which leans Democratic. The district loses a bit of Carroll County to the 3rd district but picks up some conservative Harford County suburbs from the old 1st district. The location affects Bartlett who lives in Frederick (which is mostly in the 8th on this map) but since the new 6th district is so similar to the old one, he will probably run there and win easily (unless Republicans try to teabag him which is possible.)

Maryland’s 7th Congressional District: Elijah Cummings (D) Gray

Partisan Data: Obama 193,995 70%, McCain 77,987 28%

Demographics: African American 50%, White 43%

Old District’s Partisan Data: Obama 79% McCain 20%

Major Cities: Baltimore, Glen Burnie, South Gate

Status: Safe Democratic

Although the 7th district still is anchored in Baltimore, it swings off in a different direction now. Instead of heading through west Balitmore County to west Howard County, the 7th district heads south into the conservative Anne Arundel County suburbs. It picks up Republican areas such as Glen Burnie which were formerly in the 1st district when it was very Republican. Although there are some precincts there that voted as high as 70% for McCain, precincts in Baltimore City that voted as high as 99% for Obama make this district heavily Democratic. The 50% African American population is a bit low for a VRA district but it should work because almost all of the Democratic primary voters are Democratic. Also, a 70% Obama district is way too high for any Republican to win, even in a good year.

Maryland’s 8th Congressional District: Chris Van Hollen (D) light purple

Partisan Data: Obama 173,125 69%, McCain 74,721 30%

Demographics: 12% African American, 14% Hispanic, 13% Asian, 59% White

Old District’s Partisan Data: Obama 74% McCain 25%

Major Cities: Bethesda, Frederick, Gaithersburg, Rockville

Status: Safe Democratic

This district gets a bit more Republican. I removed Wheaton from the district as well as the heavily Democratic small part of Prince Georges County which helped Van Hollen beat Connie Morella (R) in 2002. Also, Van Hollen’s district heads out into Republican leaning Frederick County but takes up the parts that lean Democratic such as the City of Frederick. These changes bring down the Obama percentage from 74% to 69%. Van Hollen will probably want a safer district but Montgomery County has grown much more Democratic since the 90’s when it elected Morella. Frederick County is getting more Democratic too so Van Hollen should have no problems.  

By what margin will Bob Shamansky win?

View Results

Loading ... Loading ...

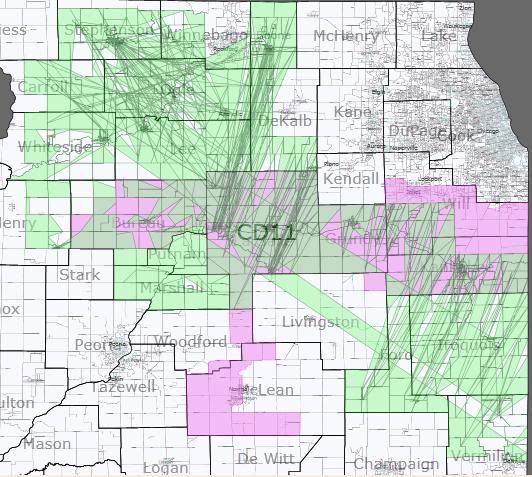
Disincumbenting Illinois: A Democratic Redistricting Plan

This diary presents an 18-seat map for Illinois. Illinois is a particularly difficult state for me to get my head around politically, so in this diary I am  going to highlight a particular strategic approach to redistricting. I’m calling it “disincumbenting” — I don’t think I’ve encountered an existing term of  art anywhere that covers quite the same ground.

The basic idea of disincumbenting is to make the new districts as unlike the current districts as possible. Doing so reduces the value of incumbency (hence  the name) by reducing the number of constituents who are familiar with the incumbent representative.

Illinois strikes me as a particularly fertile environment for the technique, because the party out of power on the state level has a large number of  contiguous seats. The Democrats have unified control over the line-drawing. In the most recent election, they lost four outstate districts, resulting in the Republicans controlling every non-Cook-County-based district except for Jerry Costello’s 12th district in the far southwest. (The Republicans also control  the Cook-County-based 9th.) With so much adjacent territory under the control of the opposition party, it is fairly easy to draw new lines that wreak havoc  on the political bases of each incumbent.

As I said above, I find it difficult to get my head around Illinois’ politics. This is because recent elections have been so very unrepresentative. 2010 was a Republican wave year. 2008 was a Democratic one, compounded by Obama’s favored son status. Blagojevich’s election numbers are impacted by the presence of a  significant Green candidacy. And so on. I tried to design the new districts so as to maximize the number of “Democratic opportunity” districts outside of  Cook County as best I could, but these districts aren’t as numbers-based as I would like. I welcome any feedback from those who know Illinois better.

Aside from the goals of disincumbenting Republican incumbents and maximizing Democratic chances outstate, I had two other, inter-related goals: create a second Hispanic majority seat in cook County, thereby eliminating Lipinski’s district. In a previous diary, I had created a second Hispanic seat by (inadvertantly) messing with Quigley. Geoneb suggested that Lipinski should be the target instead, so here’s a plan that does that. These two goals have an unintended spillover effect of somewhat disincumbenting the Chicago Democratic representatives. If resistance from the Democratic incumbents proves too great, these two goals could be abandoned.

To demonstrate the disincumbenting strategy, in my district descriptions I’m making use of silverspring’s Territory Transfer Percentage (TTP), introduced here. TTP is the percentage of the new district’s population that was part of the old district. My impression is that Silverspring introduced it with the general intent of keeping TTPs relatively high. Because of the set of goals I applied to the creation of this map, I’m actually trying to keep TTPs low (at least in the Republican districts.)

Pictures and descriptions of the plan start after the jump.

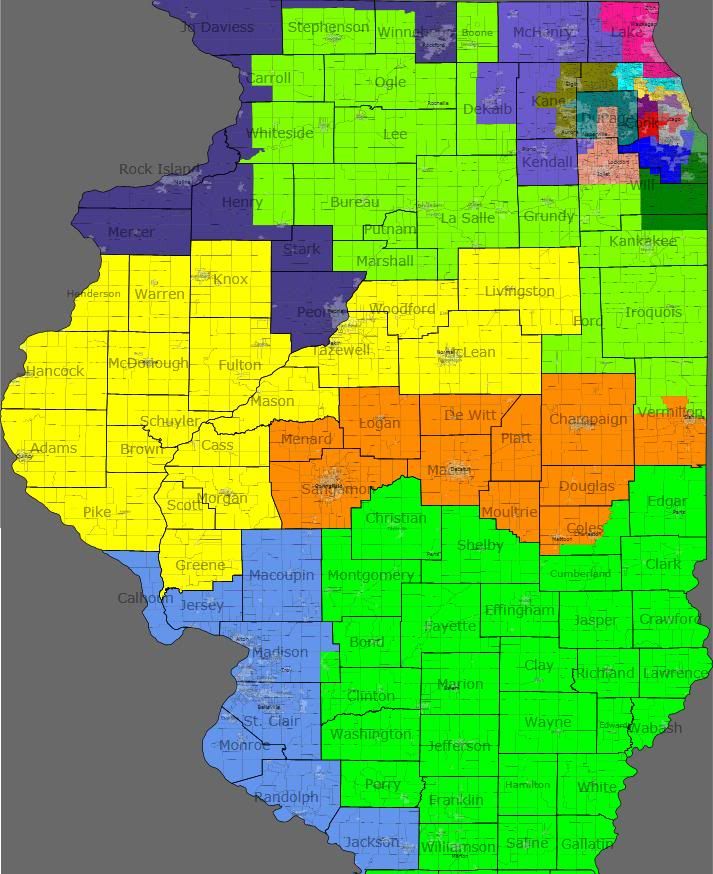
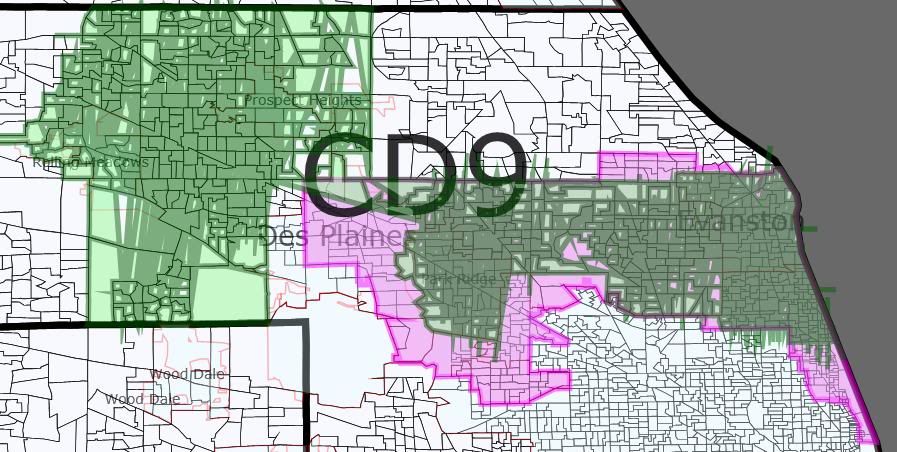
Overview Map

Note that the 16th is (roughly speaking) the seat lost through reapportionment. I relocated it south to cover for the missing number 19.

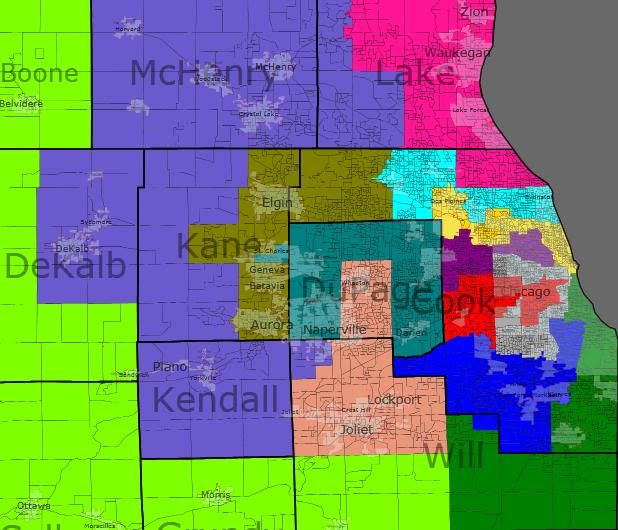
Chicagoland Map

District-By-District

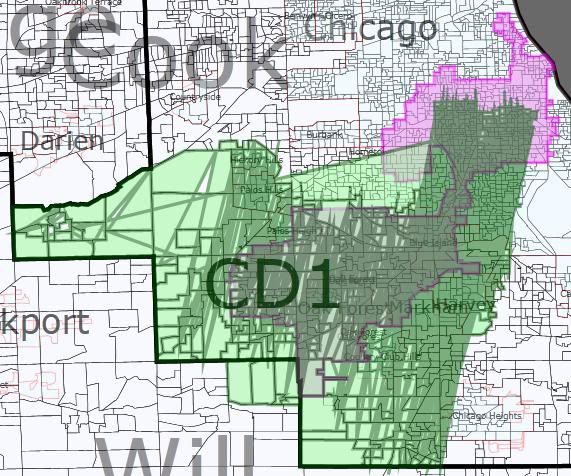
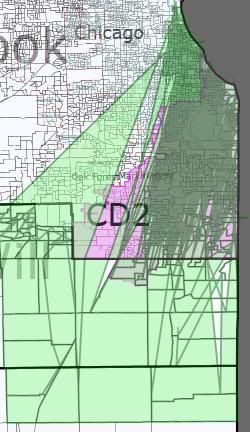
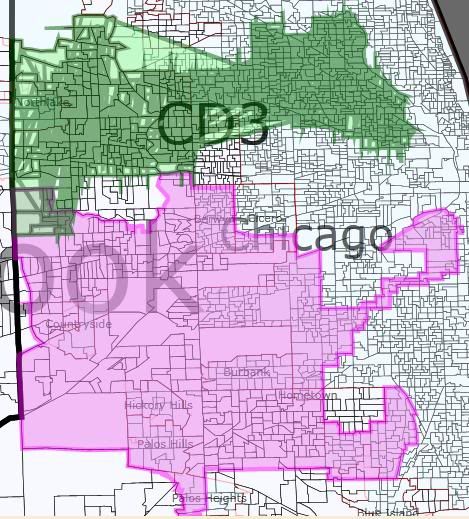
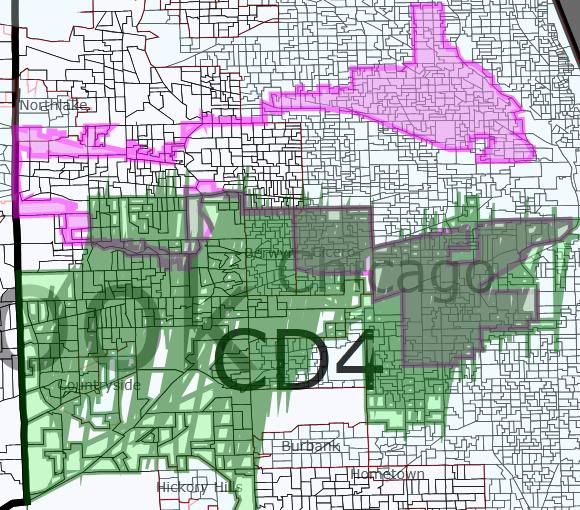
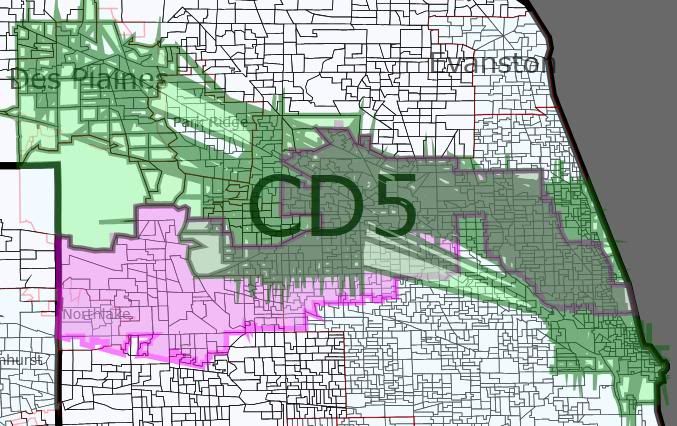
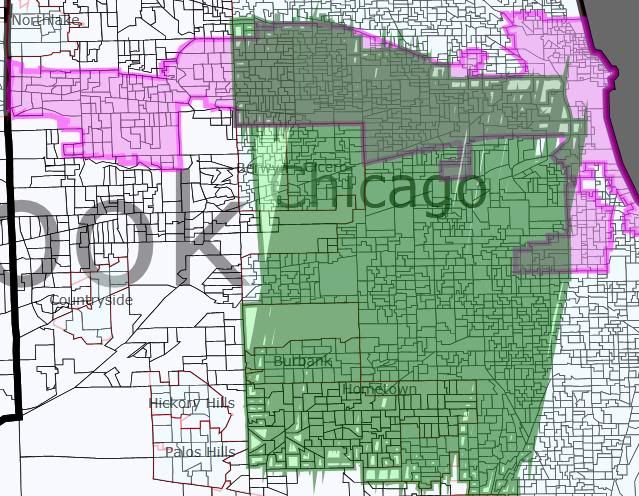
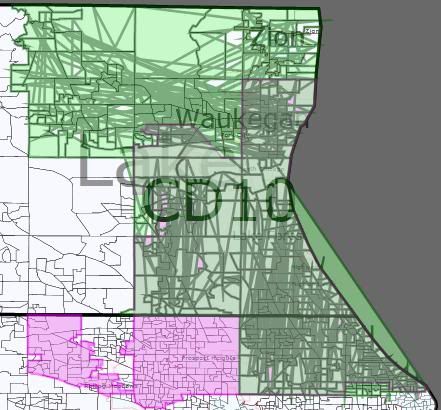
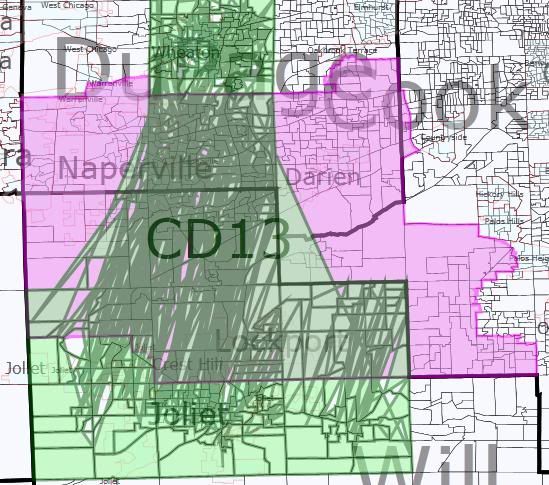
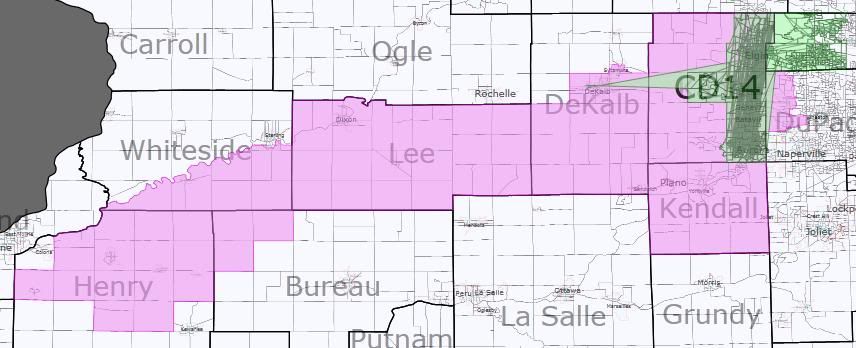
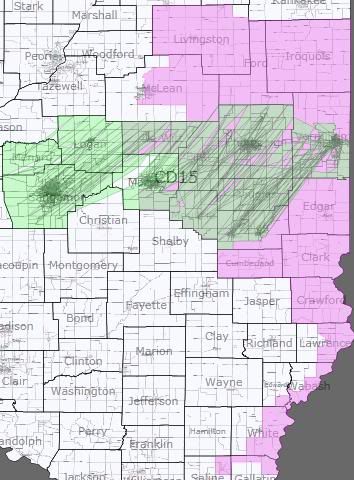
Given the strategy I’m following here, I’m presenting the old/new maps for each district. The pink outline is the old district. The green squiggles represent the new district.

Democratic Held Seats

My intention was that all of these seats would remain solidly Democratic. In the absence of sound numbers though, I’m slightly worried about the 9th. (And, I guess, the 12th — but I think I actually improved the 12th’s Democratic performance.)

District 1 — Bobby Rush (D)

VRA: B 53% W 35%

TTP: 49%

Rush’s district slides south somewhat, expanding into parts of what is currently the 2nd and 13th. I’m not sure if Rush still lives in this version of the district. Wikipedia says he used to represent the 2nd Ward. If he still lives there, it’s a relatively easy fix to swap some territory with the 2nd while keeping both majority African American.

District 2 — Jesse Jackson, Jr (D)

VRA: B 54% W 32% H 11%

TTP: 56%

Jackson’s district narrows slightly to expand significantly to the north and south. Again, I’m not sure if Jackson lives here, but his wife represents the 7th Ward, so I think he probably does.

District 3 — Open Seat (D)

VRA: H 52%, W 34%

TTP: 2%

[Update: Per sapelcovits in the comments, my description of the ethnic background for the 3rd and 4th are flipped. This is Guiterrez’s district. It’s the 4th that’s open.]

This was Lipinski’s district, now almost entirely relocated to become a second Hispanic majority district. (The old district is split roughly evenly between the new 4th and 7th, both of which are still majority-minority.) My understanding is that the Hispanic population here is largely Mexican, so voting participation rates might not be enough to elect a Hispanic representative.

District 4 — Luis Guiterrez (D)

VRA: H 58%, W 35%

TTP: 51%

Guiterrez’s seat now takes in only the southern half of his old district (along with a good part of the old 3rd). My understanding is that the Hispanic population here is largely Puerto Rican (and therefore US citizens), so this district should pass VRA muster.

District 5 — Mike Quigley (D)

VRA: W 68%, H 15%

TTP: 53%

Quigley’s seat shifts northwest on its western end, now taking in Des Plaines instead of Northlake. I believe he should still live in the district; if not, the territory swap needed to make it happen shouldn’t be too difficult.

District 7 — Danny Davis (D)

VRA: B 50% W 34% H 11%

TTP: 50%

Sadly one of the less informative old/new maps. You might need to refer back to Chicagoland overview. Davis’s seat lurches south radically as part of the dismemberment of the old 3rd. The 29th Ward that he used to represent is still in the district, so I assume he is too. If 50% is too low an African-American percentage, some territory swaps with the 1st and/or 2nd could probably be arranged.

District 9 — Jan Schakowsky (D)

VRA: W 62% H 15% A 14%

TTP: 60%

Schakowsky’s district stretchs significantly further west now. This is the only Democratic-held district I’m concerned about whether I weakened it significantly. Perhaps she and Quigley could swap Elk Grove for Des Plaines? (Is that even an improvement for her?)

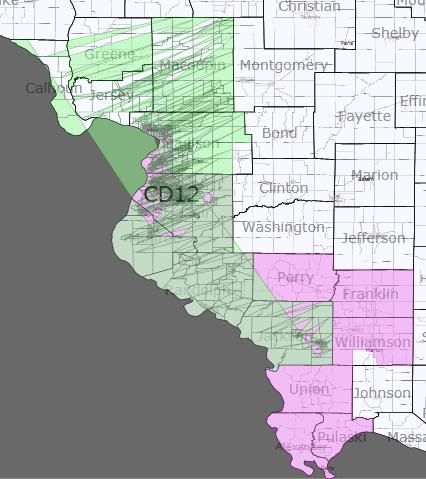
District 12 — Jerry Costello (D)

VRA: W 80%, B 15%

TTP: 71%

Costello’s district shifts north, and in doing so becomes more Democratic (I think.) One danger: I’ve technically drawn Shimkus into this district, but I’m assuming he’d run in what is now the neighboring 16th. I don’t think Shimkus is a problem (71% TTP for Costello!), but if he is, he could be drawn into the 16th properly. But I’m guessing that would require decreasing the 12th’s Democratic performance.

Republican Held Seats

Now the fun begins! Republicans, please met your new districts.

I have no firm idea what the Democrat’s chances in any of these districts are. I’m hoping that disincumbenting the Chicago suburban Republicans will make them vulnerable. Outstate from Chicagoland, I think I created two new districts that are at least competitive for the Democrats.

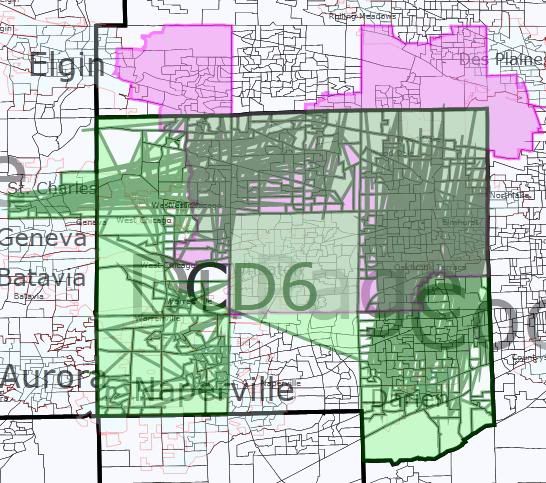
District 6 — Judy Biggert (R) vs Randy Hultgren (R)

VRA: W 71% H 14% A 10%

TTP: 55%

While remaining DuPage-based, the 6th now pairs the residences of two incumbent Republicans — neither of whom are the incumbent in the 6th! Its upside-down U-shape is to keep incumbent Peter Roskam’s hometown of Wheaton out of the district. The listed TTP is if Roskam ran here anyway. If Biggert ran here, her TTP would be 34%; for Hultgren, 11%.

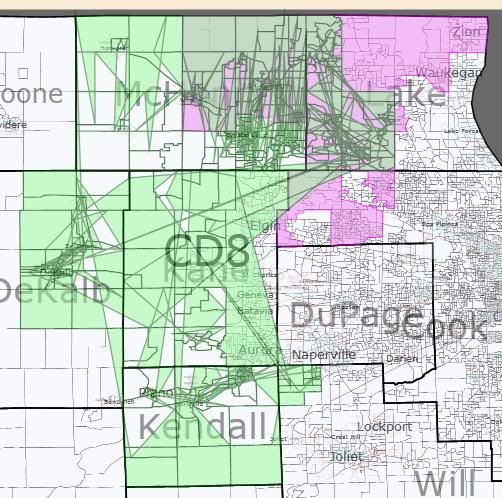
District 8 — Joe Walsh (R)

VRA: W 82%, H 11%

TTP: 35%

No longer stretching to Lake Michigan, Walsh’s seat now heads south into eastern Dekalb, western Kane, and Kendall Counties. Sadly, I suspect that this territory as at least as favorable to Walsh as his current one. Walsh would have nearly the same TTP if he ran in the new 10th at 30%. Representatives Manzullo and Hultgren would be at 28% and 29%, respectively, if they ran here — despite, you know, not living here.

As a side note, I believe Bean lives in my new 14th.

District 10 — Bob Dold (R)

VRA: W 67%, H 19%

TTP: 68%

The GOP district I most failed to disrupt. Any suggestions on what I can do with this?

District 11 — Don Manzullo (R) vs Adam Kinzinger (R)

VRA: W 86%

TTP: 46%

Contains parts of no fewer than 6 current districts. The TTP listed is for Kinzinger, the incumbent by district number and by largest TTP. Manzullo’s TTP is 28%. I’m pretty sure that this is a Republican vote sink. I do feel like I’m wasting LaSalle County, though, which I understand to be a reliable source of Democrats votes. Maybe there’s a better way to draw this vis-a-vis the 8th?

District 13 — Peter Roskam (R)

VRA: W 68%, H 15%, B 10%

TTP: 50%

Biggert’s old district now stretches from Wheaton to Joliet. She no longer lives here (Roskam does), but the TTP listed is hers. If Roskam run here, his TTP would only be 17%; Kinzinger would have a TTP of 34%.

District 14 — Open Seat (R?)

VRA: W 62%, H 25%

TTP: 61%

Compacts immensely — no longer stretching out towards the Quad Cities, it is now limited to eastern Kane and far northwestern Cook. This is technically an open seat, since Hultgren lives in the neighboring 6th, although the TTP is his. I believe that both Foster and Bean live in this district. Walsh would have a TTP of 23%. It’s not as disincumbented as I was hoping for — any suggestions?

District 15 — Tim Johnson (R)

VRA: W 83%, B 10%

TTP: 54%

Switches orientations from north-south to east-west, dropping rural areas to pick up Decatur and Springfield. The Springfield area seems to be unusually Republican-friendly for a state capital, so I don’t think this hurts him as much as might be hoped. Nonetheless, this is one of the three districts outstate that I consider a potential D pick-up. Schock’s TTP is 22%, Schilling’s is 17%.

District 16 — Open Seat (R)

VRA: W 93%

TTP:  60%

Entirely relocated from the northwest to the southeast, where it takes over for the reapportioned-away 19th. (This also results in no old/new picture, since the number changes — you’ll have to scroll up to the overview.) Although technically an open seat, I assume that Shimkus would run here; the TTP is his. Johnson’s TTP is 21%; Costello’s is 14%. The second of the downstate Republican vote sinks.

District 17 — Aaron Schock (R) vs Bobby Schilling (R)

VRA: W 78%, B 11%

TTP: 45%

Of the Republican-held seats, this is the one I most strongly suspect would flip Democratic under my plan. A succesor in spirit, if not in form, to the current 17th. It strings together Rockford, the Quad Cities, and Peoria. The TTP listed is actually Manzullo’s, who doesn’t live in the district. Schock’s TTP is 26%; Schilling’s is 25%.

District 18 — Open Seat (R)

VRA: W 91%

TTP: 38%

Drops Peoria County and the northern suburbs of Springfield to pick up Bloomington-Normal. This is my third and last Republican vote sink. The listed TTP is Schock, the closest this district (which covers parts of five current ones) comes to an incumbent. Schilling’s TTP is 32%; Johnson’s is 15%; Kinzinger’s is 14%.

Summary

With the caveat again that Illinois is a hard state for me to judge, I think that this map averages around a 12-6 Democratic advantage. Best case scenario: 15-3. Worse case scenario: 8-10 (ie, the status quo, minus one Republican from reapportionment.)

Again, the goals for this map were to demonstrate two things: a possible way to disincumbent the Republicans by making their districts as different as possible from the current set-up and a possible way to swap out Lipinski for a new Hispanic representative. I remain curious about what people who actually understand Illinois think about my plan.

SSP Daily Digest: 12/7

DE-Sen: Here’s an amusing look back at the Delaware race, where it turns out that Christine O’Donnell raised $7.3 million over the course of the campaign (a somewhat large improvement on her $63K from her previous Senate bid) and then proceeded to lose by 16 points. O’Donnell apparently had the same problem that I suspected that Sharron Angle did (though we don’t have any confirmation on Angle yet)… there weren’t any media outlets with available slots to pour all that late-breaking money into.

MO-Sen: Jim Talent has offered his timeline on publicly deciding whether or not to run for Senate (which has seemed to get less likely over the last few days, if you believe the scuttlebutt). He won’t decide until the New Year, and possibly won’t announce anything until the state GOP’s Lincoln Day festivities in mid-February.

MT-Sen: PPP offered some GOP Senate primary numbers, although I’m not sure how useful they are given that Marc Racicot, the former Governor and RNC chair, eats up a lion’s share despite not having really ever been associated with the race. (Although, who knows… maybe this will suddenly prompt him to get interested.) At any rate, the two guys with name rec, Racicot and Rep. Denny Rehberg, are at 40 and 37, respectively. The two little-known guys who are actually the ones running (so far), Steve Daines and Neil Livingstone, are at 5 and 4.

RI-Sen: Although John Robitaille seems to be getting all the attention in terms of the GOP’s pick to challenge Sheldon Whitehouse, Warwick mayor Scott Avedisian is still stoking the fires of vague interest. Avedisian is a moderate and an ally of newly-elected Gov. Lincoln Chafee.

WA-Sen: The race against Maria Cantwell seems to already be a casualty write-off for the GOP, seeing as how the state’s entire viable GOP bench (aka Rob McKenna) will most likely be running for Governor. The state GOP’s usual M.O. in such situations is to turn to some random rich guy as a place-holder (see Mike McGavick, Cantwell’s 2006 opponent, or oft-threatened but never-happened candidate John Stanton), but it may turn out that Clint Didier, the tea partier whose GOP primary bid against Dino Rossi didn’t go anywhere and who’s now interested in trying again, gets left holding the bag this time. Didier, who refused to endorse Rossi and castigated him at every turn, isn’t likely to be able to count on much NRSC or even state GOP goodwill this time, though.

MN-Gov: Nothing like a little post-electoral cat fud, even if it means exiling pretty much your entire pantheon of elder statesmen. The state GOP just excommunicated more than a dozen key moderate Republicans who had jumped ship to support Independence Party candidate Tom Horner in view of Tom Emmer’s extremism. These aren’t just run-of-the-mill PCO-types, either: the list includes an ex-Senator (David Durenberger) and two ex-Govs (Arne Carlson and Al Quie). And if you’re wondering how Emmer is faring in the court of public opinion amidst the recount non-drama, PPP’s out with a snap poll: by a 68-22 margin, voters think it’s time for Emmer to give up (which matches the 68-21 margin of people who think that Mark Dayton was the election’s rightful winner).

OH-17: Wondering who the third-party candidate who fared the best was, in this year’s House races? It was none other than ex-con ex-Rep. Jim Traficant, who picked up 16.1% of the vote against Tim Ryan, the best showing of any indie with both Dem and GOP opponents (and he did it without spending a penny). He fared better than Randy Wilkinson in FL-12, who ran a more credible campaign and was widely viewed as a potential spoiler. In fact, Wilkinson finished 3rd at 10.7%; some random conservative, Dan Hill, got 12% in NE-03 by running to Adrian Smith’s right, although that was a race that Dems barely contested. What about MI-01’s Glenn Wilson, who made waves for approximately one day with his pledge to spend $2 million of his own money (although it’s dubious if he spent more than a fraction of that)? He barely registered, at 7%.

WV-01: Here’s an unexpected comeback, and probably one that’s not a good idea. Alan Mollohan, who couldn’t survive a Dem primary and most likely wouldn’t have won the general even if he’d gotten over the first hurdle, is publicly expressing his interest in running in 2012 for his old seat. He’s opened an FEC account for ’12 and has been reaching out behind the scenes.

NY-St. Sen.: This is basically a Hail Mary at this point, but when it’s the chance to tie the state Senate, it’s a chance you take. Craig Johnson officially filed an appeal yesterday of the judge’s ruling certifying Jack Martins as winner in SD-7 (giving the GOP a 32-30 edge there). He’s asking for a hand count, to see if any votes were missed in the state’s switch this year to electronic voting machines. Given the recent abject fail in finding all the votes cast in Queens, it’s not out of the realm of possibility.

Redistricting: The Fix has another installment in its ongoing redistricting previews, this time focusing on Georgia. The GOP-controlled state legislature should have little trouble adding a GOP-friendly 14th seat in Atlanta’s northern tier of exurbs, where most of the state’s growth has occurred. The real question will be whether they can do anything to turf out either of the two remaining Dems in slightly lean-Dem districts in south Georgia, Sanford Bishop or John Barrow? Although neither of their seats are truly minority-majority, the VRA might be implicated if their seats get messed with too much. Bishop’s GA-02 is likely to be shored up in order to make freshman Austin Scott safer in the 8th. Barrow seems like an easier target, but to do so would not only risk VRA litigation but also make Jack Kingston’s 1st less safe, meaning incumbent protection might be the result.

Demographics: There was a massive dump of U.S. Census data yesterday, although none of it is the actual hard count from 2010 (which is due by the end of the month, including state populations for reapportionment purposes). Instead, this is the Demographic Analysis (used to estimate undercounts in the actual count, although there won’t be any adjustments made to the counts for redistricting purposes in this cycle). The big number was the total population estimate, ranging from 306 million to 313 million, with a midrange estimate of 308.5 million (which would put the average House district, for redistricting, at 709K). Also worth noting: Hispanics accounted for essentially the nation’s growth in youth population in the last decade, and Hispanics have grown from 17% of the nation’s under-20 population in 2000 to 22% now; without Hispanics, the number of young people would have actually gone down since 2000.

California Redistricting Patterns by Region

The coming redistricting in California will see two significant forces working to give the new lines.  The first is population, how it has grown and shifted since the last maps were drawn.  The second is the commission process that will follow set rules around keeping cities and counties together, compactness, communities of interest, and drawing lines without considering where candidates live.

To survey the political landscape I put together this chart showing population growth in each congressional district.  While the commission does not need to start from the existing lines, this does show the disparity in population growth among current districts.

Swing State readers should quickly realize that districts with the greatest overages are Republican.  This is seen statewide where Republican congressional seats are on average 42,000 over target population, and Democrat-held seats are 28,000 under.

Tightly packed Democratic seats like those in Los Angeles will have to geographically expand, stealing population from other neighboring Democrats to gain the requisite number of residents.  Conversely, Republican districts will be contracting as they give up voters, and could provide more opportunity to other Republicans.

Current Congressional Districts and Variation from 2010 Projected Targets

Member Residence Variation

1 Mike Thompson D St Helena Under By 19,552

2 Wally Herger R Chico Over By 23,927

3 Dan Lungren R Gold River Over By 52,873

4 Tom McClintock R Elk Grove Over By 78,971

5 Doris Matsui D Sacramento Over By 21,151

6 Lynn Woolsey D Petaluma Under By 82,302

7 George Miller D Martinez Under By 47,071

8 Nancy Pelosi D San Francisco Under By 28,457

9 Barbara Lee D Oakland Under By 47,004

10 John Garamendi D Walnut Grove Under By 4,079

11 Jerry McNerney D Pleasanton Over By 68,602

12 Jackie Speier D Hillsborough Under By 73,416

13 Pete Stark D Fremont Under By 59,603

14 Anna Eshoo D Atherton Under By 47,104

15 Mike Honda D San Jose Under By 17,541

16 Zoe Lofgren D San Jose Under By 7,756

17 Sam Farr D Carmel Under By 63,360

18 Dennis Cardoza D Merced Over By 27,745

19 George Radanovich R Mariposa Over By 49,586

20 Jim Costa D Fresno Over By 18,060

21 Devin Nunes R Tulare Over By 75,114

22 Kevin McCarthy R Bakersfield Over By 71,524

23 Lois Capps D Santa Barbara Under By 54,321

24 Elton Gallegly R Simi Valley Under By 29,472

25 Howard McKeon R Santa Clarita Over By 4,084

26 David Dreier R San Dimas Over By 10,372

27 Brad Sherman D Sherman Oaks Under By 41,458

28 Howard Berman D Los Angeles Under By 37,913

29 Adam Schiff D Burbank Under By 39,041

30 Henry Waxman D Los Angeles Under By 31,871

31 Xavier Becerra D Los Angeles Under By 55,157

32 Judy Chu D Monterey Park Under By 54,149

33 Diane Watson D Los Angeles Under By 36,444

34 Lucille Roybal-Allard D Los Angeles Under By 47,705

35 Maxine Waters D Los Angeles Under By 39,585

36 Jane Harman D Los Angeles Under By 34,005

37 Laura Richardson D Long Beach Under By 36,943

38 Grace Napolitano D Norwalk Under By 51,103

39 Linda Sanchez D Lakewood Under By 44,407

40 Ed Royce R Fullerton Under By 37,637

41 Jerry Lewis R Redlands Over By 100,829

42 Gary Miller R Diamond Bar Under By 10,593

43 Joe Baca D Rialto Over By 57,355

44 Ken Calvert R Corona Over By 191,982

45 Mary Bono Mack R Palm Springs Over By 200,712

46 Dana Rohrabacher R Huntington Beach Under By 40,074

47 Loretta Sanchez D Anaheim Under By 43,323

48 John Campbell R Irvine Over By 437

49 Darrell Issa R Vista Over By 65,129

50 Brian Bilbray R Carlsbad Over By 13,076

51 Bob Filner D San Diego Over By 7,693

52 Duncan Hunter R Lakeside Under By 25,845

53 Susan Davis D San Diego Under By 25,626

The following shows variations for congressional districts by region, however they do not match county growth perfectly as several Congressional districts overlap counties and skew the numbers.

Variation from Ideal 2010 Population, by Congressional Districts in Regions

.: Northern California +4.5% 4 districts over by 175,000, 1 under

.: San Francisco Bay -5.8% 11 districts are under by 415.000

.: Central Valley +6.9% 5 districts over by 240,000

.: Los Angeles -5.5% 13 districts under by 550,000

.: Orange County +1.4% 1 district is over, 4 are under

.: San Diego +1% 2 districts are under, 3 over

.: Inland Empire +11.4% 8 districts are over by 640,000

Regional Differences…

San Francisco Bay Area

Bay Area congressional districts have largely not kept up with statewide growth, putting them under the required population by about 4.5%.  The only exception is the Jerry McNerney district, but the growth in this district is primarily within the San Joaquin portion.  Excluding McNerney, the remaining ten districts need to expand to capture another 415,000 residents.  

Excluding the McNerney district the remaining Bay Area seats have to grow 6% on average.  This does not seem significant when looked at for an individual district where it is like adding the city of Pacifica.  However, as each district takes from the next, the impact is added up.  In the end the last district is going to shift by the equivalent of gaining or losing a city the size of Oakland.

Central Valley and Norcal

Tightly packed urban Democratic seats like those in the Bay Area will have to geographically expand, stealing population from other neighboring Democrats to gain the requisite number of residents.  Conversely, Republican districts like these in the Central Valley and Northern California will be contracting as they give up voters, and could provide more opportunity to other Republicans as these regions add a district.

Aside from population, the requirements for geographic compactness and keeping cities and counties together will wreak havoc on the current districts.

Los Angeles

As can be seen above, the cumulative impact of shrinking population is that LA districts have to go searching for an additional 540,000 residents.   In a redraw that follows the new commission rules this should cause the loss of one congressional seat for the region.

The greatest volatility could come in the San Gabriel Valley where population growth has been slowest. The districts of Grace Napolitano (CD 38), Judy Chu (CD 32) and Xavier Becerra (CD 31) have only had growth of 2-2.5% – putting them under the state average by approximately 8%.  Furthermore, South and West facing beaches limit the ability for districts in the City of LA to move in either of those directions, meaning that expanding districts must shift North and East – likely toward the Inland Empire that has seen the highest growth rate in the state.

The only district in Los Angles with an overage is also the only district held by a Republican.

Orange County

Orange County congressional districts have largely not kept up with statewide growth putting them under the required population by about 5%.  The only exception is the Ken Calvert district, but the growth in this seat is primarily within the Riverside portion of the district.  Excluding Calvert, the remaining five districts need to expand to capture another 130,000 residents.

While Orange County currently has six congressional members, it only has four who live within the county.  The districts held by Miller and Calvert extend from Orange County into Riverside and San Bernardino where those members live.  Given Orange County population estimates, the county should have 4.25 members of congress.  

San Diego

Overall growth in San Diego is just 1% above the state average.  Yet that shifts to about 1% under the state average after accounting for the Issa District that overlaps with Riverside and the Filner district that takes in the Inland Empire.  As can be expected, it is the southern, more densely populated portion of San Diego that has had the least growth.

Inland Empire

Past redistricting efforts have not done a good job of keeping the Inland Empire intact or creating lines that benefit this growing portion of the State.  The area has eight congressional seats with only three districts entirely within its boundaries and five that overlap from Los Angeles, San Diego and Orange Counties.   Half of the Inland Empire’s congressional representatives live outside of the three-county area.

In a redraw that respects city and county lines and pays no regard to where current members live, it can be expected that the three Congressional districts entirely within the Inland Empire would increase to five, and the districts that only dip into the Inland Empire would be stopped at the county lines.  This would be an increase in the region’s true representation, but a decrease in the number of representatives that have any part of the Inland Empire.