SSP Daily Digest: 12/6

AK-Sen: This shouldn’t come as a surprise and I highly doubt that Joe Miller would listen to anything Mark Begich would say even if it weren’t a surprise, but Begich is now encouraging Miller to drop his pointless challenge to Lisa Murkowski so Murkowski can get sworn in on schedule and the pork can continue to flow to the Last Frontier. Meanwhile, Miller is now actually saying that he would have gotten away with it, if it weren’t for those meddling Inuits. In a Washington Times column, Miller blames the Native Alaskan corporations for backing Murkowski (via the Alaskans Standing Together PAC), and even (gasp! call the Fox voter fraud hotline!) putting boots on the ground to teach people how to spell “Murkowski” and bus people to the polls!!1!

FL-Sen: If you were wondering if there was still a flicker of possibility that Jeb Bush was going to run against Bill Nelson, that’s pretty much extinguished: Bush himself acknowledged that over the weekend, admitting there’s a major problem given his support for immigration reform (and opposition to Arizona’s new law) that puts him at odds with the ascendant teabaggery. Mike Haridopolos is also letting everyone know that he wouldn’t be running if Bush were going to run, but that he’s gotten Bush’s green light. (The latter article also includes a few additional GOP names that we haven’t seen yet in connection with this race, like sophomore Rep. Tom Rooney and Adam Hasner, the former state House majority leader.)

IN-Sen: State Sen. Mike Delph is waving his arms around madly trying to get the tea partiers’ attention for a possible primary against GOP apostate Richard Lugar, with a widely-circulated post to his own blog saying that he’s “increasingly concerned” with Lugar’s actions, especially support for the DREAM Act. The real question is whether state Treasurer Richard Mourdock gets in; Lugar’s best shot at getting through, like Dan Coats in the 2010 Senate primary, is to have the multiple teabaggers cannibalizing each others’ votes.

NV-Sen: Democratic Rep. Shelly Berkley is mentioning some sort of timeline for deciding on whether to run for the Senate against John Ensign (or whoever decapitates him in the GOP primary): she’s saying early 2011, probably before mid-February. Worth noting: she’s sitting on $1.1 million CoH, more than your average Rep. and a good head start for a Senate bid.

WV-Sen: John Raese, who has run and lost four times statewide, is pretty much ruling out another run for office, aware that it’s probably not a good investment of his family fortune. Also, he says he’s “worn out” (and probably wants to spend more time with his new glass conservatory). As for who will actually run, Shelly Moore Capito is naturally at the top of the GOP’s wish list, but it sounds like she’s more interested in running for Governor in 2012, making a run from some other self-funding B-lister against Manchin seem likely.

MN-Gov: Tom Emmer’s legal team, over the weekend, pulled a large number of frivolous challenges: 2,600 of them, all from Hennepin County (Minneapolis). Between this token act of perceptions-management, and signals from Emmer attorney (and ex-state supreme court chief justice) Eric Magnuson that Emmer isn’t likely to prevail, it looks like we may actually get some resolution on this sooner rather than later.

CA-11: I’m not sure if anyone was still wondering if David Harmer had conceded this race, as Jerry McNerney declared victory nearly a month ago and the AP also called it a few weeks ago, but he finally pulled the plug over the weekend. Harmer says he has no plans to run again.

VA-09: Um, oooops. Here’s one veteran Dem who seems to have gotten caught with his pants down, when a late move in the polls in what had previously seemed an OK race (recall the spike in the last SurveyUSA poll of this race) seemed to come too late for him to do a last-minute ad blitz. Rick Boucher had by far the most money left over of any House Dem who lost: $699K. (Chris Carney came in second with $262K.)

House: Here’s a long pointless list of races where the loser is operating in the usual “not ruling another run in or out” post-election mode: Glenn Nye in VA-02, Tom Perriello in VA-05, Chet Edwards in TX-17, Patrick Murphy in PA-08, and Republican Ilario Pantano in NC-07.

DCCC: Another changing of the guard at the DCCC: Robby Mook is taking over as executive director, from Jon Vogel. He’s following the same path as Vogel, having led the DCCC’s independent expenditure arm during the 2010 cycle.

NY-St. Sen.: The last two races in the New York state Senate are more or less resolved. Suzi Oppenheimer, as expected, has been declared the victor, and GOP opponent Bob Cohen has conceded. Craig Johnson, on the other hand, has lost, or at least was on the wrong end of the recount, although he plans to appeal. Assuming nothing changes in SD-7, the GOP will control the Senate 32-30 for this session.

Redistricting: In Massachusetts, Democratic Secretary of State Bill Galvin is floating the idea of switching to an independent redistricting commission (albeit one that would apparently be non-binding). That’s odd, since if there’s one state where the Dems have firm control of the trifecta, it’s the Bay State. As you might expect, Dem legislative leaders are expressing little interest in the idea. They’re moving full speed ahead on the 2012 process, with state Senate president pro tem Stan Rosenberg in charge just as he was in 2002. As far as tea leaves for who might get protected in the elimination of that tenth House seat: I’m not sure if Rosenberg would be considered a John Olver ally, but it’s worth noting that Rosenberg is, like Olver, from Amherst, and succeeded Olver in the state Senate, taking over Olver’s old seat in 1991 upon Olver’s special election to the House.
Trying to Predict Redistricting in New York

As an ex-New Yorker, I keep my eyes perennially glued to New York politics.  It did not shock me terribly that Republicans took back a fair number of upstate New York house seats.  There were a lot of 27-1 or 28-0 nonsense maps put on this website last winter that failed to take into account that Republicans in New York often vote Democratic for president when they think the national candidate is too extreme but have no problem voting Republican downballot the rest of the way.  This may eventually change, like the voting habits of Dixicrats in the South apparently have, but it will take a while.

What shocked me the most was that it appears that the State Senate, and with it the Democratic trifecta that everyone was counting on last winter, has switched back into narrow GOP control pending the recounts in a few still undeclared State Senate seats.  With the lost of the North Buffalo seat to a Republican candidate, it appears our best hopes lay on working to a 31-31 tie.  Still, even were the lieutenant governor to cast a tie-breaking vote to organize the chamber for the Democrats, we have to keep in mind that there are quite a few scumbags in the delegation (Carl Krueger always tops the list in my view now that Espada and Montserrate are gone) who are more than willing to cut a deal with Dean Skelos (the GOP leader in the State Senate).  I therefore assume the following:

1) The GOP will have a seat at the table with redistricting.  Even with the very best scenario of the state senate breakdown of 31-31, it would be very hard to pass a Democratic gerrymander through the state legislature.  That’s just the reality.  

2) It will be an incumbent protection map that discomfits only those chosen to be drawn out.  

3) Despite Cuomo’s enthusiasm for a commission drawing the maps, it will not be passed in time to affect this round of redistricting and probably won’t be passed ever.  I can hardly ever see Shelly Silver giving up on drawing the State Assembly lines and that’s what it would take for Cuomo’s idea to prevail.  The Democratic leadership of the State Assembly perennially sold their party brothers and sisters over in the State Senate down the river for decades in going along with all the pro-GOP gerrymandering of the State Senate.  I hardly see anything different now.  

So this will be an agreement brokered between 3 men in a room, like the state budget or anything in New York State politics.  (For those of you not from New York or familiar with this phrase, it refers to the governor, the Assembly Speaker (always Democrat) and the State Senate President (usually historically Republican).

4) In addition to protecting the 4 black VRA districts and the 2 Hispanic VRA districts, a 3rd Hispanic district out of Joe Crowley’s currently minority-majority district that is Queens/Bronx will likely have to be passed to pass VRA preclearance.  This complicates greatly the map for downstate in a way that 2000 did not.  I would imagine that one of the three Queens white Democrats (Ackerman, Weiner, Crowley) gets the axe but expect there to be bitter racial tension over this.  Even if the GOP is closed out from redistricting through some act of miracle like the Buffalo state senator deciding to caucus with Democrats and/or Craig Johnson and Suzi Oppenheimer both winning their recounts, all it takes is one or two disgruntled Latino politicians that their constituency isn’t getting their “fair share” of congressional districts for them to bolt tactically to the Republicans.  If you don’t think this is a serious concern, I consult you to the 2001 mayoral election as a textbook example.  Fernando Ferrer sat on his hands – the Bronx Democratic machine did nothing on election day – and Bloomberg won.

So the crux of the matter is that a third Hispanic district will be created, very likely in the Queens/southern and eastern Bronx area.  Despite the fact that Crowley has close ties to Shelly Silver, he seems likeliest to be discomfited the most by the stark demographic realities of New York City.

5) In the past, New York State politicians in Albany have tended to privilege clout above all else.  Anyone who sits on Appropriations (Israel, Hinchey, Lowey, Serrano), Ways and Means (Rangel for now, Crowley, Higgins), or Financial Services because of the state’s ties to Wall Street and the large donations these members can draw (Maloney, Velazquez, Ackerman, Meeks, McCarthy) are generally immune from losing their districts.  I would add to this list Peter King (the incoming chair of Homeland Security – very important in swinging money to NYC and the State which overrides national partisan political objectives) and Slaughter (on Rules, which if the national Democrats get their act together and win back the House, she will again chair).

6) Western New York, which took the brunt the last time will not this time around, even though that is the part of the state that is losing the most population.  Either a prettier version of the dumbells will be created again for Slaughter, or there will be a Buffalo-Niagara Falls and a Rochester-Monroe County district.

7) The Hudson Valley (which gave up the other lost seat in 2002) will also not lose a seat.  Nita Lowey is too powerful to consent to a Westchester brawl between her and Nan Haysworth.  Hinchey’s on the powerful appropriations committee so a Hudson Valley conglomerated district between him and Haysworth also isn’t going to happen, either.  Given the state GOP’s desire to want to protect their most imperiled pickup, Buerkle’s surprise defeat of Dan Maffei in the Syracuse-based district, Hinchey’s elongated Southern Tier-Hudson Valley district will be needed to suck up ultra liberal votes out of Tompkins County.

Therefore, who might get targeted for elimination?

If New York only loses one seat, it seems easy to me to predict the outcome.  Bill Owens and Chris Gibson will be merged together in an Eastern Upstate New York congressional district that combines the northern most counties with the upper Hudson Valley, swooping around Albany.  It would be, depending on how you draw the lines, anywhere between a 52-54% Obama district and truly a “fair fight.”

What I’ve been struggling with is who gets the axe in addition if it’s a two-seat casualty loss and New York only has 27 seats after 2010.  In this scenario, the bipartisan redistricting scenario would require one Democratic and one Republican seat to vanish.  Upstate New York is where they would almost definitely take the Republican seat from.  Bill Owens would be left alone and Hanna and Gibson or Gibson and Haysworth would be merged.

Okay, so far so good.  Which Democrat gets the axe?  Remember, NYC is an universe all to itself and city politicians have a tendency to privilege the maintenance of clout and seniority over all else.  Also, it seems to me that even when I run the numbers on Dave’s redistricting app, a 3rd Hispanic district will still have to likely be created; therefore Crowley is still in a lot of peril one way or the other.

My guess is Eliot Engel of the north Bronx will eventually get the axe.  He is not well-liked in the delegation, nor by the Bronx party machine.  The demographic realities of a two-district loss mean that upstate will push a bit south even with losing one seat (because all of the population growth has been Hudson Valley-South for the past 2 decades at least) and there isn’t enough room in the Bronx to maintain a white district for him.  He sits on Foreign Affairs, which is a plum committee, but for pork barrel and “I scratch your back, you scratch mine” New York parochial politics, that aint good enough when push comes to shove.

The only thing that gives me pause is that when I play with it on Dave’s application, it does make the map a bit messy.  Haysworth swings south a tiny bit, like in the current map, to grab up more Republican-leaning or mixed areas of northern Westchester and northern Rockland.  Lowey takes the rest of Rockland and Westchester easily enough.  Then you would have Nadler swing north into Riverdale and left-over parts of Yonkers not needed in Lowey’s district.  Rangel could then have retain a black-plurality for his district by going into the north Bronx, Mt Vernon and parts of New Rochelle.  And then you would have room enough to create the 3rd Hispanic district in the southeast Bronx/northern Queens areas.  Down in Brooklyn, Grimm gets the heavily McCain precincts, the two black districts expand a bit more in that direction to gain new population, and Anthony Weiner gets the rest of the area that Nadler gives up.  Weiner is exactly the kind of Democrat that these voters would vote for so that’s not a big problem.

My only other guess is what to do out in Long Island.  Is it possible to really help Bishop at the expense of Israel or (ripple effects) McCarthy?  Bear in mind that Peter King has a safe pass given a) his position as the chair of Homeland Security and b) Dean Skelos being a fellow Nassau County Republican.  Realistically also, and this was the major flaw in many of the maps I saw it last year, no New York City politician wants to have to represent Long Island – there is just this hostility between the two regions as well as this narrow parochialism that is a New York City disease (and I can say that being a former New Yawker myself – I absolute refuse to give up rooting for my often lousy Mets).

So Peter King gets a safe GOP district, but unless you go into the City and have some of the City districts come out into the Island a bit, there are only enough Democrats for 2 districts (the current 2nd and 4th, both at 59% Obama performance).

So that’s what I foresee happening; Bishop not being helped all that much (except maybe the removal of Smithtown and the home of Altschuler) with some minority areas of Islip Town being added in its place.  This brings his district up from 52-53% Obama to 55% Obama, not that much of a help frankly.  It would have to be done in such a way not to imperil Israel most of all (as an appropriator he has a tremendous amount of clout) and McCarthy indirectly (because if you have Israel grab black areas in Nassau to compensate for losing minority voters in Islip, you risk imperiling McCarthy).

So the likeliest Democratic casualty if it is a 2-district loss seems to me to be Eliot Engel.  The only other possible scenario that I keep playing in my head is that perhaps Weiner gets the axe with everyone expecting (including himself all these years) that he will run for mayor in 2013.  I also note that he does not sit on any important clout committee – Education and Labor is not important enough in steering resources or in protecting tax provisions for Wall Street for Albany politicians to care much to want to protect him.  Engel still might not out of the woods with this scenario, though.  Might Shelly Silver protect his protege Crowley by drawing Eliot Engel into a Hispanic-majority district, axeing Weiner and drawing Crowley a dream Queens district where he can marshal the Queens Democratic machine behind him?  Intriguing possibilities….

I welcome your thoughts on this.  As someone who, because of my job, now resides in southern Illinois and only comes back to the City 2-3 times a year or to the Hudson Valley (where I’m originally from), my political radar antenna isn’t as perceptive as it might be were I still resident in New York.  

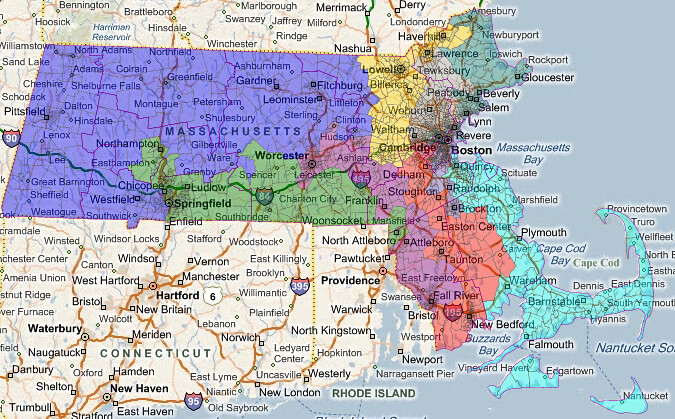
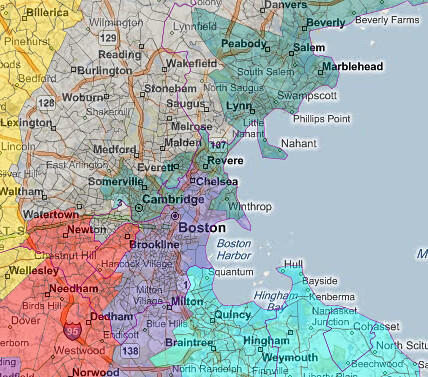
A possible Gerrymander of Massachusetts

The assumption behind this map is that Capuano runs for Senate and all other incumbents are protected.  All cities and towns are kept intact, excepting Boston.

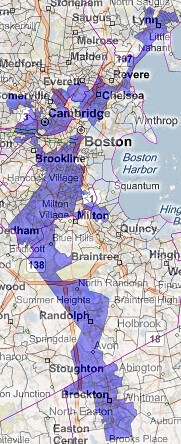
Boston Detail:

1st district – Oliver (Blue)

Gains some Worcester suburbs and some 495 belt towns, which makes it slightly more conservative, but at D+14 it has some room to spare.

2nd District – Neal (Green)

Adds a couple Republican towns in the East and Democratic ones in the West, overall not much changed.

3rd District – McGovern (Purple)

Keeps its Worcester and Fall River anchors, in fact gaining the portion of Fall River that Frank used to have.  The district shifts slightly, losing the Northern suburbs of Worcester and gaining other towns in Norfolk and Bristol counties.  Overall, not much change in partisan composition.

4th District – Frank (Red)

Like the 3rd, this district retains it’s anchors, but shifts slightly East.

5th District – Tsongas (Gold)

This district is made safer, swapping its 495 belt towns for more liberal towns in the Metrowest area.  (Fun fact: Framingham, at 67,000 inhabitants, is the largest town in New England)

6th District – Tierney (Teal)

Embattled rep Tierney needs some shoring up, so he gets the biggest prize from Capuano’s district: Cambridge and Somerville.  While this should make him safe in the general, if Tierney’s ethics troubles get any worse, he could be vulnerable in the primary, especially since much of the territory in this district is new to him.

7th District – Markey (Gray)

This district, while picking up the Alston-Brighton neighborhood of Boston, gets slightly more conservative overall, as it trades the metrowest towns that Tsongas picked up for some more conservative ones that Tierney lost. At D+15 it still has a strong liberal inner suburb base and should be fine.

8th District – Lynch (Periwinkle)

Lynch’s district changes radically in order to preserve the majority-minority district required (maybe?) by the VRA.  Lynch may not be too happy about this, since he has the most conservative voting record of any of the delegation and will now have a very Liberal district.  He could be vulnerable to a primary challenge, perhaps from State Senator Sonia Chang-Diaz.

9th District – Keating (Cyan)

This district doesn’t change much, unfortunately.  There are only so many ways to draw a district that stretches from Quincy to Cape Cod.  If O’Leary had won the primary we would have had more options.

The new 8th district is 48% non-hispanic white, which is comparable to the current 8th.  Just for fun, I tried to draw a district that would bring this number as low as possible:


40% White, 27% Black, 10% Asian, 21% Hispanic, 2% other.

Texas: Predicting Redistricting [Update II]

Now that we know that the Texas House and Governor’s mansion will be safely in the hands of the Republican Party during redistricting, I decided to draw a map using Dave Bradlee’s application that predicts what the Republicans might do.  (I used 1.0 instead of 2.0 because I had a previously drawn map that I could easily modify in 1.0.  If there is an easy way to convert a 1.0 map to a 2.0 map, then please let me know in the comments.) Again to be clear, this is a prediction of what I think the new map might look like, not what I hope happens.  I really wish I was sharing a more liberally friendly map than this one.  

It’s also a pretty boring map with the following objectives:

1) Keep all incumbents with their base voters, except McCaul.

2) Draw a Republican safe district for McCaul.

3) Draw a non-VRA Republican safe district using the suburban-exurban part of Nueces for Farenthold.

4) Draw a non-VRA Republican safe district using the Northern part of Bexar for Canseco.

5) Draw a new Republican safe district in Harris.

6) Draw a new VRA Democratic safe district in DFW.

7) Draw two new VRA Democratic safe districts from the current 23 and 27.

I suspect objectives (1)-(5) are real Republican goals, and objectives (6)-(7) will likely be required by the Obama DOJ.  Here are the maps with the pretty colors.

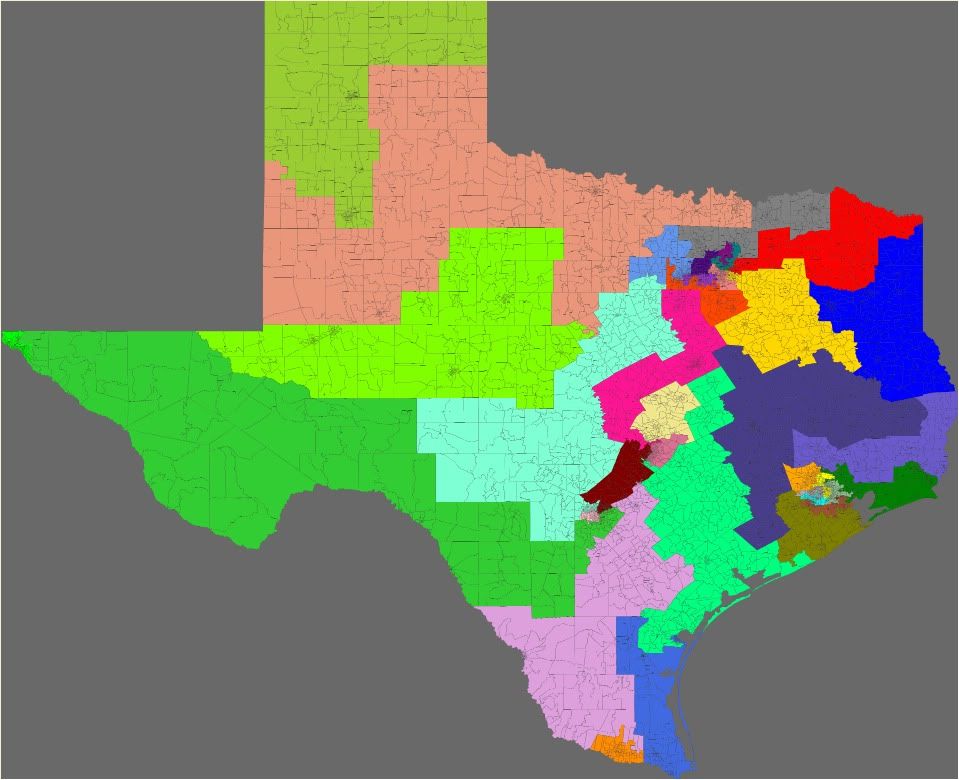
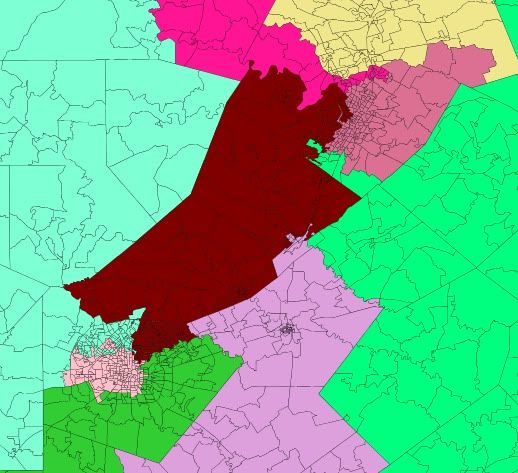
The state.

Photobucket

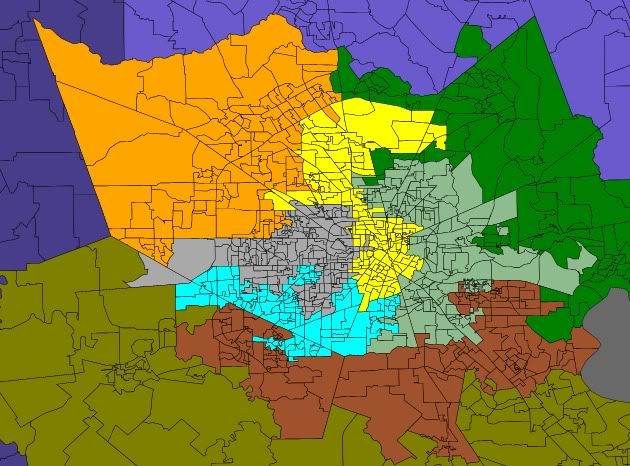
Greater Houston.

Photobucket

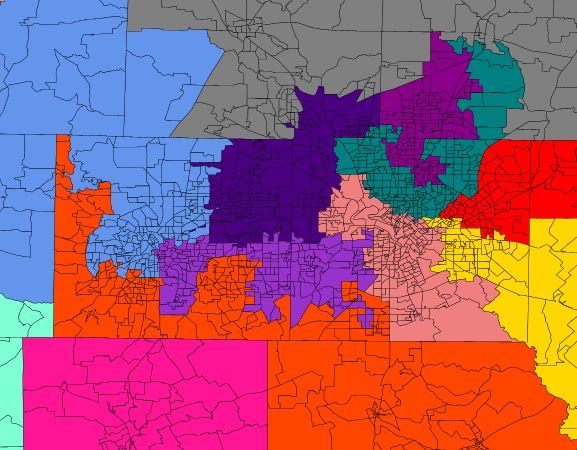
DFW.

Photobucket

Central Texas.

Photobucket

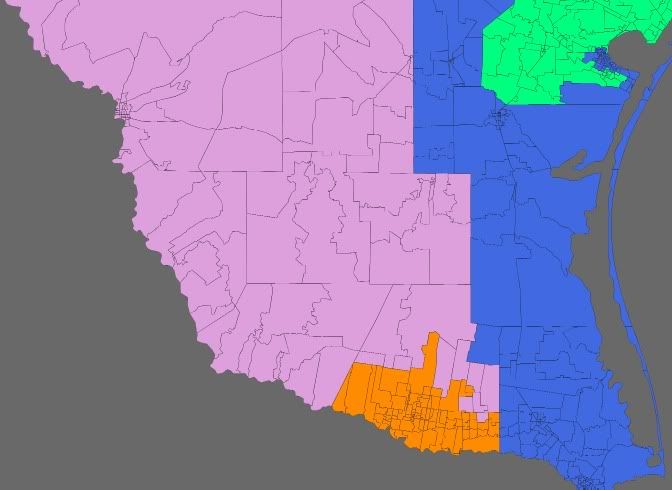
The Valley.

Photobucket

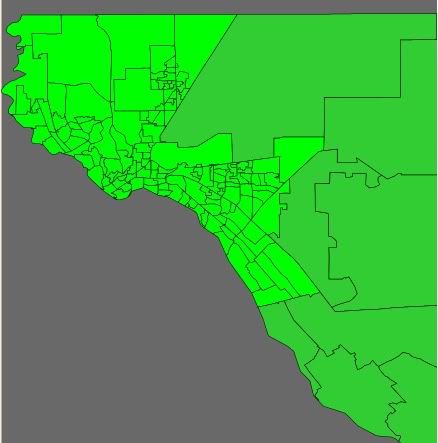
El Paso.

Photobucket

CD 1: (Blue) [31% Obama – 68% McCain, Wh 66%, Bl 19%, Nat 0%, Asn 1% Hisp 12%] Tyler based district for Gohmert.

CD 2: (Dark Green) [41% Obama – 58% McCain, Wh 54%, Bl 19%, Nat 0%, Asn 2% Hisp 24%] Northeast Harris based district for Poe.

CD 3: (Purple) [43% Obama – 56% McCain, Wh 59%, Bl 10%, Nat 0%, Asn 12% Hisp 17%] Plano based district for Sam Johnson.

CD 4: (Red) [35% Obama – 65% McCain, Wh 65%, Bl 12%, Nat 1%, Asn 2% Hisp 19%] Rockwall based district for Hall.

CD 5: (Yellow) [42% Obama – 57% McCain, Wh 55%, Bl 17%, Nat 0%, Asn 1% Hisp 25%] Dallas based district for Hensarling.

CD 6: (Teal) [43% Obama – 56% McCain, Wh 54%, Bl 9%, Nat 0%, Asn 7% Hisp 28%] Dallas based district for Sessions.  Sessions district now goes up into Collin County making him significantly safer. (I switched the numbers on 6 and 32, because the color contrast was poor with 4.  It’s strictly a visual effect, and I don’t expect the numbers to switch.)

CD 7: (Silver) [42% Obama – 57% McCain, Wh 50%, Bl 7%, Nat 0%, Asn 8% Hisp 34%] Houston based district for Culberson.  This district is a little safer than his current district.  

CD 8: (Violet) [25% Obama – 74% McCain, Wh 76%, Bl 7%, Nat 0%, Asn 1% Hisp 14%] Montgomery County based district from Brady.

CD 9: (Sky Blue) [76% Obama – 24% McCain, Wh 15%, Bl 39%, Nat 0%, Asn 10% Hisp 35%] Houston based district for Al Green.

CD 10: (Hot Pink). [39% Obama – 60% McCain, Wh 68%, Bl 9%, Nat 0%, Asn 3% Hisp 18%] Austin/Waco/Johnson Country district for McCaul. Really, the only challenge in this map was McCaul. He lives in liberal Austin, which is a few hundred miles away from his base voters in one of the conservative parts of Harris County.  Furthermore, because of population growth in both Harris County and Austin, there is no way to keep this district together for him.  In fact, I used that part of Harris to draw the new Republican district mentioned in objective (5). A congressperson does not have to live in his/her district, so McCaul could hypothetically run for the Harris district.  However, there are several state legislators in that district, who are looking up, and he could get hit with a primary.  So, I really don’t think living that far away from a district is practical.  Hence, I drew him in with Johnson County, which is very Republican and is not home to a congressperson.  With Waco in this district, there is a chance Chet Edwards could run against him, but I doubt it.

CD 11: (Lawn Green) [25% Obama – 75% McCain, Wh 59%, Bl 5%, Nat 0%, Asn 1% Hisp 34%] Midland based district for Conaway.

CD 12: (Steel Blue) [36% Obama – 63% McCain, Wh 59%, Bl 5%, Nat 1%, Asn 3% Hisp 32%] Fort Worth based district for Granger.

CD 13: (Dark Salmon) [25% Obama – 74% McCain, Wh 70%, Bl 5%, Nat 1%, Asn 1% Hisp 22%] West Texas based district for Thornberry.  This one though now spreads east and has a new conservative base in Wichita Falls.  

CD 14: (Olive) [39% Obama – 60% McCain, Wh 56%, Bl 13%, Nat 0%, Asn 3% Hisp 27%] Galveston based district for Paul.

CD 15: (Orange) [68% Obama – 31% McCain, Wh 9%, Bl 0%, Nat 0%, Asn 1% Hisp 89%] Hidalgo County based district for Hinojosa.  This district is much more compact.  [UPDATE: Several comments have noted that this district may be too Hispanic.  The 15 was after all one of the districts that the courts redrew in 2006.  That could very well be true.  This issue could easily be resolved by redrawing 15 and 28 (and possibly the new 33) similar to how they are drawn now to reduce the Hispanic influence in 15.  I considered doing this myself, but I decided against it.  One reason for my decision was that I ran out of time to work on this.  Two, I actually decided that the GOP could argue that (a) this district is compact and within a single community, (b) all of the neighboring districts are safely VRAs too, and (c) breaking up this district would break up a community, which is against the spirit of the VRA.  That’s not a great argument, but Justice Kennedy might buy it.  Since it gives the GOP a chance to weaken the Democrats in 28 almost down to a swing district, I wouldn’t be surprised if they made this argument. (See description of 28 below.)  Nonetheless, even if it doesn’t go as predicted, I suspect they will go with a fix by redrawing 15 and 28.]

CD 16: (Lime) [65% Obama – 34% McCain, Wh 14%, Bl 3%, Nat 0%, Asn 1% Hisp 81%] El Paso based district for Reyes.

CD 17: (Midnight Blue) [33% Obama – 66% McCain, Wh 64%, Bl 15%, Nat 0%, Asn 2% Hisp 18%] College Station based district for Flores. This district was moved out of Johnson County and McClennan County to make 10 friendlier for McCaul.

CD 18: (Yellow) [75% Obama – 24% McCain, Wh 17%, Bl 32%, Nat 0%, Asn 4% Hisp 46%] Houston based district for Jackson.

CD 19: (Yellow Green) [26% Obama – 74% McCain, Wh 59%, Bl 6%, Nat 1%, Asn 1% Hisp 32%] Lubbock based district for Neugebauer.

CD 20: (Pink) [65% Obama – 34% McCain, Wh 15%, Bl 4%, Nat 0%, Asn 1% Hisp 78%] San Antonio based district for Gonzalez.

CD 21: (Maroon) [42% Obama – 57% McCain, Wh 68%, Bl 4%, Nat 0%, Asn 3% Hisp 24%] San Antonio/Austin based district for Smith.

CD 22: (Chocolate) [39% Obama – 60% McCain, Wh 52%, Bl 8%, Nat 0%, Asn 12% Hisp 27%] Sugar Land based district for Olson.

CD 23: (Cyan) [33% Obama – 66% McCain, Wh 65%, Bl 3%, Nat 0%, Asn 2% Hisp 29%] North Bexar based district for Canseco.  As noted previously, this district is much more Anglo and Republican than the current VRA 23.

CD 24: (Indigo) [41% Obama – 58% McCain, Wh 63%, Bl 8%, Nat 1%, Asn 8% Hisp 18%] Southlake/Coppell based district for Marchant.

CD 25: (Violet Red) [69% Obama – 30% McCain, Wh 41%, Bl 10%, Nat 0%, Asn 5% Hisp 41%] Austin based district for Doggett.

CD 26: (Grey) [34% Obama – 65% McCain, Wh 72%, Bl 7%, Nat 1%, Asn 3% Hisp 16%] Flower Mound/Denton based district for Burgess.

CD 27: (Spring Green) [39% Obama – 60% McCain, Wh 53%, Bl 6%, Nat 0%, Asn 1% Hisp 38%] Greater Corpus Christi based district for Farenthold.  It is no longer a VRA district since it extends north.

CD 28: (Plum) [53% Obama – 46% McCain, Wh 24%, Bl 3%, Nat 0%, Asn 1% Hisp 72%] Laredo based district for Cuellar.  This district however is not nearly as safe as it is today even though is still safely a VRA.  It could be a Republican target, but Cuellar is a staple in Laredo, so I doubt he is going anywhere.

CD 29: (Dark Sea Green) [70% Obama – 30% McCain, Wh 13%, Bl 22%, Nat 0%, Asn 2% Hisp 63%] Houston based district for Gene Green.

CD 30: (Light Salmon) [76% Obama – 23% McCain, Wh 15%, Bl 29%, Nat 0%, Asn 2% Hisp 54%] Dallas based district for Eddie Bernice Johnson.

CD 31: (Khaki) [43% Obama – 55% McCain, Wh 61%, Bl 12%, Nat 1%, Asn 4% Hisp 21%] Williamson County based district for Carter.

CD 32: (Orange Red) [39% Obama – 60% McCain, Wh 64%, Bl 14%, Nat 0%, Asn 3% Hisp 18%] Ellis County based district for Barton.  (See comment about switching 6 and 32 above.)

CD 33: (Slate Blue) [58% Obama – 41% McCain, Wh 19%, Bl 2%, Nat 0%, Asn 1% Hisp 78%] Corpus Christi/South Padre Island based district for Ortiz, possibly Ortiz Junior if Ortiz Senior is ready to retire after losing.

CD 34: (Lime Green) [61% Obama – 38% McCain, Wh 21%, Bl 8%, Nat 0%, Asn 1% Hisp 69%] South Bexar/Border based VRA district for Rodriguez.

CD 35: (Orchid) [66% Obama – 33% McCain, Wh 29%, Bl 29%, Nat 0%, Asn 5% Hisp 36%] New Dallas-Fort Worth based VRA district for some Democrat like Royce West or Rafael Anchia. [UPDATE: curiousgeorge noted that this may not be a VRA district.  That is probably true.  After all, it looks a lot like Martin Frost’s old 24th district that the courts allowed DeLay to butcher in his mid-decade redistricting. Nonetheless, I still believe that there will be a new Democratic district in DFW.  Otherwise, at least one Republican would be seriously weakened.]

CD 36: (Dark Orange) [35% Obama – 65% McCain, Wh 61%, Bl 7%, Nat 0%, Asn 7% Hisp 24%] New Harris County based district for some Republican like Dan Patrick or Debbie Riddle.

Overall 24 R – 12 D.

[UPDATE: I corrected some minor typos, added racial percentages, and addressed the issue of 15 being too Hispanic.  There are some other minor issues with the map, but I think that the overview is about right.  Specifically, we’ll see a 24 R-12 D map with the Democrats representing the following: 3 from Greater Houston, 2 from DFW, 2 from the Valley, 1 from El Paso, 1 from Austin, 1 from San Antonio, 1 from Laredo, and 1 from South San Antonio to the border.]

Maryland: Effective 8-0 Plan

I have yet once again redone my Maryland map.  I’m using the “original” version of Dave’s Application here as I did the map a while back but just haven’t had the chance to do the write-up.

Bottom line: there’s no reason not to do an 8-0 map, knowing that the GOP will do something similar in a number of states.  Democrats still have the trifecta in Maryland (we actually picked up a few seats in the state Senate here in November, btw !)

I had several goals in mind for this map:

– VRA: Both African-American-majority districts must have black population that is at least 1.5 times the size of the white population in those districts (to ensure representation).  The map does really well in this respect.  The black population in both MD-4 and MD-7 goes down from 57% and 59%, respectively, under the existing 2002 map — to 51% and 57%, respectively, under the proposed map here.  HOWEVER, because of the way the districts are reconfigured (expanding to include a lot more GOP-leaning territory in the northern part of the state) the proportion of African-Americans as a percentage of the Democratic primary vote in both districts goes up from approximately 70% now to approximately 80% under the proposed plan.

– Incumbency: Keep at least 50% of each Democratic incumbent’s current territory (population-wise) in the new district.  The percentages that each district gets to keep are below:

MD-1 – 66%

MD-2 – 70%

MD-3 – 62%

MD-4 – 53%

MD-5 – 74%

MD-6 – 49%

MD-7 – 55%

MD-8 – 78%

As you can see, it looks pretty good.  Other than the two minority-majority districts, each Democratic incumbent would get to keep at least 62% of their constituents.  This is important in any realistic redistricting plan for Maryland.  Although their districts get to keep only 53% and 55% of their existing constituents, Donna Edwards and Elijah Cummings should still be quite happy with their new districts for the reason discussed under “VRA” above.  In the case of MD-7 it should be noted that many areas in the eastern part of Baltimore City which were previously part of the district (prior to 2002) are now “returned” back to the district. So, while Cummings does not currently represent those constituents, the areas would likely be quite receptive to having him as a representative.  (I should also note that Steny Hoyer’s new district also contains territory which he has represented prior to 2002 — accounting for another 6% of the population —  so, in effect, the proposed MD-5 here includes 80% of territory Hoyer is currently representing or has represented in the past).

– Keep different parts/regions of the state “intact”.  This includes keeping the Eastern Shore whole in one district (same goes for Southern Maryland), keeping MD-2, MD-3 and MD-7 in the Baltimore orbit, while keeping MD-4, MD-5 and MD-8 in the Washington, DC orbit.  Likewise, I wanted to keep more communities intact.  Under the map here, the only incorporated cities that are split are Baltimore City (for obvious reasons), Mount Airy (because it is already split between two counties), and Hyattsville (although now it would only be split between two districts and not three like under the existing map).

Also, wanted to minimize county fragments and ensure that each district “corresponds” to a region or county.  Listed below is the largest jurisdiction (percentage of  district’s population) that each district is comprised of (you can look up the whole break-down under each district further down):

MD-1 – 62% Eastern Shore

MD-2 – 62% Baltimore County

MD-3 – 64% Anne Arundel and Howard Counties

MD-4 – 68% Prince George’s County

MD-5 – 76% Southern Maryland and Prince George’s Co.

MD-6 – 55% Montgomery County

MD-7 – 59% Baltimore City

MD-8 – 78% Montgomery County

As you can see, Montgomery Co. (the state’s largest) would form the majority of two Congressional districts under this plan.

– Partisanship (last, but not least !): Each new district must ensure that a Democrat is elected.  The percentages are discussed below the maps:

Photobucket

Photobucket

Photobucket

Photobucket

Photobucket

District 1:

Current District:  Obama 40; McCain 58

Proposed District:  Obama 56; McCain 43

Proposed District Demographics: 68% white; 25% black

Population: Eastern Shore 62%, Prince George’s Co. 20%, Anne Arundel Co. 18%

The 56% Obama percentage here would more than ensure that Frank Kratovil could make a comeback in 2012.

District 2:  

Current District:  Obama 60; McCain 38

Proposed District:  Obama 59; McCain 39

Proposed District Demographics: 66% white; 25% black

Population: Baltimore Co. 62%, Baltimore City 22%, Harford Co. 17%

District 3:  

Current District:  Obama 59; McCain 39

Proposed District:  Obama 59; McCain 39

Proposed District Demographics: 68% white; 19% black

Population: Howard Co. 33%, Anne Arundel Co. 31%, Baltimore Co. 26%, Baltimore City 10%

District 4:

Current District:  Obama 85; McCain 14

Proposed District:  Obama 72; McCain 27

Proposed District Demographics: 51% black; 33% white; 12% Hispanic

Population: Prince George’s Co. 68%, Carroll Co. 24%, Howard Co. 6%, Montgomery Co. 2%

District 5:

Current District:  Obama 65; McCain 33

Proposed District:  Obama 60; McCain 39

Proposed District Demographics: 59% white; 29% black

Population: Southern Maryland 47%, Prince George’s Co. 29%, Anne Arundel Co. 24%

District 6:

Current District:  Obama 40; McCain 58

Proposed District:  Obama 59; McCain 40

Proposed District Demographics: 66% white, 14% black, 10% Hispanic

Population: Montgomery Co. 55%, Frederick Co. 29%, Washington Co. 16%

District 7:  

Current District:  Obama 79; McCain 20

Proposed District:  Obama 69; McCain 30

Proposed District Demographics: 57% black; 38% white

Population: Baltimore City 59%, Baltimore Co. 24%, Harford Co. 17%

District 8:  

Current District:  Obama 74; McCain 25

Proposed District:  Obama 65; McCain 34

Proposed District Demographics: 63% white; 13% hispanic; 11% black; 11% asian

Population: Montgomery Co. 78%, Western Maryland 19%, Frederick Co. 3%

Iowa: 2-1-1

Not always I want leave in 0 to the republicans. Iowa is not a state for want it. My map for Iowa find 2D-1Swing-1R.

Habitually I bid not for the states without political data, because still I have enough with California or Pennsylvania (maybe later) for think in other states, but I have a idea what make so easy the calculus and I think the result of the bid help for it.

This is the map:

Photobucket

CD-01: B Braley (D)

57.98% Obama => D+5 (Currently D+5)

Based in Davenport (3rd city in Iowa)

Includes all of: Scott, Clinton, Jackson, Dubuque, Delaware, Clayton, Allamakee, Buchanan, Fayette, Winneshiek, Black Howk, Bremer, Chickasaw, Howard, Grundy, Butler, Floyd, Mitchell, Worth, Cerro Gordo and Franklin counties.

CD-02: D Loebsack (D)

57.97% Obama => D+5 (Currently D+7)

Based in Cedar Rapids (2nd city in Iowa)

Includes all of: Jones, Cedar, Muscatine, Louisa, Des Moines, Linn, Johnson, Washington, Henry, Lee, Benton, Iowa, Keokuk, Jefferson, Van Buren, Tama, Poweshiek, Mahaska, Wapello, Davis, Monroe, Appanoose, Lucas and Wayne counties.

CD-03: L Boswell (D) and T Latham (R)

53.75% Obama => D+1 (Currently D+1 and EVEN)

Based in Des Moines (1st city in Iowa)

Includes all of: Hardin, Marshall, Jasper, Marion, Hamilton, Story, Polk, Warren, Clarke, Boone, Dallas and Madison.

CD-04: S King (R)

46.05% Obama => R+7 (Currently R+9)

Based in Sioux City (4th city in Iowa)

Includes all of: The rest of the counties.

They are compact districts what respect the boundaries of the counties and respect the unity of the metropolitan areas in the state.

The new CD-01 and CD-02 districts are in risk of lose some point in the Cook PVI rating because both districts must asume new areas from districts with less democratic rating. Still I think this model for redistricting Iowa keep booth enough safe. The same reason make the future CD-04 down from R+9 until R+6.

The new CD-03 can give a decent chance to L Boswell because every bid for make a new district here what keep all the Polk county inside the district will give a strong position to L Boswell against T Latham.

Maryland and Utah: Plausible Redistricting Maps

This writeup will be brief and will lack detail pictures. Dave’s app ate one of my save files for the Maryland map, and the Utah map I drew up on a public computer when I was bored.

Utah will gain one seat. Rep. Matheson, the only Democrat in the Beehive State’s congressional district, has resisted every effort to defeat him. With the Wasatch Front gobbling up so much of Utah’s voting population and Salt Lake County trending blue, I think Utah Republicans will be relieved to confine Matheson to the state’s most populous county and parcel out his redder rural and suburban territory to help create a new district. Rep. Chaffetz will probably run against Sen. Hatch in 2012, but if he doesn’t, he could run in the new UT-04, as he’s been drawn out of UT-03. It really doesn’t matter, as UT-01, UT-03, and UT-04 would probably vote for Attila the Hun as long as he could prove he was a naturalized U.S. citizen.

All of these districts but MD-06 (teal) are safe Democratic seats. I posted this map in the comments section of a now-buried diary, but I figured I’d repost it in a new diary. Rep. Kratovil can run for MD-01 (blue) from his Stevensville home in coastal Queen Anne’s County. Rep. Bartlett has been drawn out of MD-06, with the blueing city of Frederick (as well as its little cousin of Hagerstown, in Washington County) drawn into Rep. Van Hollen’s MD-08 (slate blue). Rep.-elect Harris would probably do just fine in MD-06. Just to give you an idea of exactly how Democratic this state is, MD-06 voted for Sen. McCain over Sen. Obama in 2008 by within a point of the same margin by which MD-05 (yellow) and MD-08 broke for Sen. Obama. MD-04 (red) and MD-07 (grey) are black-majority VRA districts (54% black, 22% white; and 53% black, 33% white respectively). I may have drawn Rep. Sarbanes out of MD-03 (purple), but moving across Baltimore is really not a big deal for a congressman.

SSP Daily Digest: 12/2

AK-Sen: You might recall that yesterday the state of Alaska asked to intervene in Joe Miller’s state-court case disputing the Senatorial election, demanding an expedited result. Now the judge is allowing Lisa Murkowski herself to intervene in the case as well; she says the state wouldn’t adequately represent her interests, and she’s still trying to get an additional 2,000 ballots out there (that weren’t counted for her) counted for her as icing on the cake.

FL-Sen: He isn’t even in the House yet, but there’s growing buzz for Daniel Webster for the 2012 Senate race, as a possible opponent to Bill Nelson. Of course, as far as I can tell from today’s article, that buzz seems to be coming from Webster’s own coterie, but it’s not the first time I’ve heard his name associated with the race. (Reading between the lines, it looks like Rep. Vern Buchanan — whose myriad lawsuits regarding campaign finance chicanery and his car dealership seem to have faded into the background — is another name to keep an eye on here.)

MO-Sen: Sarah Steelman already has one key backer, in the event the quest for the GOP nomination in Missouri turns into a heated primary. The Club for Growth is already lining up behind Steelman, not formally endorsing but sending around a press release touting her and also taking some swipes at Jim Talent for his earmark-lovin’ ways.

NM-Sen: More Some Dude news in New Mexico, where another random guy who lost a NM-02 primary is getting in the GOP Senate field: Greg Sowards (who lost the 2008 primary to succeed Steve Pearce). Further up the food chain, ex-Rep. Heather Wilson seems to be on GOPers’ wish list, but she says she isn’t focused on that. (I can’t see her running unless Jeff Bingaman decides to retire, and since he has fundraisers planned in coming months, he doesn’t seem to be acting like a retiree.)

NV-Sen: The big news yesterday was that John Ensign is no longer considered a target for investigation by the DOJ, in connection to that whole ooops-sorry-I-boned-your-wife-here-have-a-lobbying-job thing. He still faces internal Senate Ethics grilling, which could lead to discipline or even expulsion. How are we supposed to feel about this? A bad day for objective justice, perhaps… but probably a net plus for the Democrats, seeing as how this makes it likelier that Ensign runs again and survives a GOP primary (which a recent PPP poll, before this news, already showed him in position to do so) and enters the general election in weakened form. The local GOP seems to be reading this the same way, still feeling very leery about an Ensign run and very much preferring to see Rep. Dean Heller as their 2012 candidate.

VA-Sen: With Prince William Supervisor Corey Stewart already firing some potshots across George Allen’s bow in advance of 2012’s GOP Senate primary, now it seems like Allen’s camp is returning fire with some heavier-gauge guns. Stewart has to run for re-election to his current job in 2011, and Allen’s camp is supposedly vowing to encourage backers to pour in financial support to Stewart’s opposition in that race (whoever that might be), in order to decapitate a Stewart run before it can materialize.

MN-Gov: This is taking damned-if-you-do-damned-if-you-don’t to a new level: Tom Emmer’s team’s wave of frivolous (and when I say frivolous, I’m not being hyperbolic, as you can see here) ballot challenges in the Minnesota recount has mounted so high that officials have had to add more counting tables… and now Emmer is threatening to sue over the fact that they’ve added more counting tables, saying that that somehow indicates bias against Emmer. The SoS says that adding more tables can’t possibly violate any rules. At any rate, moving on to Day 4 of counting, the official tally now finds that the numbers have still barely budged: Mark Dayton has gained 17 votes since Election Day while Emmer has gained 14, with 84% of the vote recounted, meaning there’s really no path to victory here for Emmer.

VT-Gov: We mentioned yesterday that Peter Shumlin brought his GOP opponent, Brian Dubie, into his inner circle, and now he’s doing the Team of Rivals thing with his closest competitor from the Dem primary. Ex-Lt. Gov. Doug Racine, who Shumlin beat by 100-or-so votes, is being brought on board as Shumlin’s head of the Agency of Human Services, where his key task will be starting up the state’s planned single-payer health care system.

WV-Gov: Democratic SoS Natalie Tennant is making even more candidate-ish noises, saying she’s “strongly considering” a gubernatorial run, especially if it occurs in 2011, which would mean not having to give up her current job. Not only are acting Gov. Earl Ray Tomblin and state House speaker Richard Thompson expected to run for the Dems, but state Sen. Jeff Kessler and state Treasurer John Perdue are also interested.

MA-01, MA-02: The news from the Bay State is that veteran Democratic Reps. John Olver and Richard Neal are both publicly saying that they’re running for re-election. In any other year, that would be purely yawn-inducing, but this year, that’s fascinating, as it potentially sets them up on a collision course. My expectation was the Massachusetts redistricting conundrum would probably be solved by a retirement from the 74-year-old Olver, and parceling out pieces of the 1st into Neal’s 2nd and Jim McGovern’s 3rd. With Olver and Neal both sticking around, the subtraction is likelier come from the Boston area, where it seems likely that at least one Rep. will vacate in order to take on Scott Brown in 2012 (which would make sense since not only is Mike Capuano sounding the likeliest, but his Cambridge-based 8th is the state’s most depopulated district)… but if none of them take the plunge, the lost seat may come the state’s west. Complicating matters even further is that Pittsfield-based ex-state Sen. Andrea Nuciforo has already announced that he’s running in the MA-01 primary in 2012, Olver or not. (Would she he run in a primary against both Amherst-based Olver and Springfield-based Neal if they all get smooshed together?)

NY-01: As we mentioned yesterday, Tim Bishop’s team is urging Randy Altschuler to “give in to the math.” Yesterday’s gain from the first day of counting challenged ballots was a net gain of 27 more for Bishop.  

Redistricting: Here’s one more comprehensive redistricting resource to add to your pile, if you haven’t already seen it. The Brennan Center’s guide includes a rundown on who controls what and what procedures are used state-to-state.

New York: This is a staggeringly large number, that somehow seems disproportionate to the rather blasé NYT headline: “New York City Board of Elections Finds 200,000 Votes a Month After Election.” It’s a mishmash of affidavit, absentee, and military ballots that apparently were just now added to the totals. 80,000 of those ballots were from Queens alone, which is 31% more than that borough reported on Election Day. While there were some close races in Queens, the city says that this wasn’t enough to reverse the results in any election (and the one race that could have been worrisome, SD-11, actually saw a gain for Tony Avella, who beat GOP incumbent Frank Padavan, from 53-47 to 54.3-45.7).

Redistricting the New Jersey State Senate

New Jersey has 40 State Legislative districts. Each district elects 1 Senator and 2 Assemblymen. The State Legislature will be up for election in November 2011, so NJ will need to have its districts ready a year earlier than most other states. Currently the State Senate has 24 Democrats and 16 Republicans. Wikipedia has an excellent map of the State Senate makeup here. (The 14th just turned blue in a special election.) The districts are drawn by a bipartisan commission made of 5 Democrats and 5 Republicans appointed by their respective parties. Some Republicans including Governor Christie claim the current map is an unfair gerrymander favoring the Democrats. I disagree.

New Jersey has 8.7 million people (2007 estimate). Each of the 40 Senate Districts must be within 20% (43,413) of the ideal population (217,067). Municipalities can not be split unless they are more than 1/40 of the entire state’s population. Only 2 cities are that big: Newark and Jersey City. The restriction on splitting municipalities makes the 20% rule necessary.

I didn’t consider incumbents’ residency. I’ll let them figure out which district they want to run in, and if they get drawn out of a winnable district then too bad. I didn’t abuse the 20% rule to favor a political party. I tried to apply population discrepancy as fairly as possible.

The Democratic Gerrymander: 31 Democrats, 9 Republicans


1st District: Cape May Co, most of Cumberland Co. 53% Obama, +2998 people. 70% white

This is the weakest of the Democratic districts. It’s impossible to make a safe Democratic district with all of Cape May Co.

2nd District: eastern Atlantic Co. 59% Obama, -1908 people. 59% white

It got smaller (and more Democratic) due to population growth in the Atlantic City area.

3rd District: Deptfords to Bridgeton 57% Obama, +5596 people. 75% white

It’s a little bit sleeker and more Democratic.

4th District: interior Gloucester, Camden, Salem and Atlantic Co. 58% Obama, +6767 people. 75% white

Anchored by strongly Democratic towns such as Winslow and Monroe. The region between Camden and Atlantic City has grown enough to deserve its own district.

5th District: metro Camden 73% Obama, -3477 people. 51% white, 24% black, 21% Hispanic

6th District: Washington (Glo Co) to Evesham 59% Obama, +15839 people. 79% white

The outer townships are swingy, but the middle (Camden Co) part is strongly Democratic.

7th District: Pennsauken/Cherry Hill area 62% Obama, -254 people. 76% white

8th District: Delanco to Pemberton 67% Obama, -5403 people. 59% white, 27% black

Incumbent Republican Diane Allen lives here. This district should be too Democratic and too different for her to win.

9th District: southern Burlington and Ocean Co 42% Obama, +5336 people. 93% white

The biggest district on this map

10th District: Trenton, Hamilton, northern Burl Co 65% Obama, +2523 people. 54% white, 26% black, 16% Hispanic

Hamilton and Bordentown are Democratic at the presidential level but Republican the local level. Combining them with Trenton should stop them from causing trouble.

11th District: Toms River and western Ocean/Monmouth 42% Obama, +6048 people. 87% white

Almost all of the population is in the eastern part: Toms River and the shore towns.

12th District: Lakewood, Brick, Wall, and everything east 37% Obama, +15120 people. 84% white

Don’t let the small size fool you into thinking it’s urban and therefore liberal. It’s the most Republican district in NJ.

13th District: Tinton Falls and everything east except Rumson 57% Obama, -5642 people. 66% white

The Democrats’ best chance at winning part of Monmouth County. Frank Pallone lives here and you can appreciate why it’s hard to draw him into a Democratic congressional district.

14th District: Rumson/Middletown to Howell 42% Obama, -6983 people. 86% white

Republican Monmouth County in all its teabagging glory.

15th District: Old Bridge to Freehold 49% Obama, -587 people. 74% white

The Democrats’ second best chance at winning part of Monmouth County. I count it as a Republican district but maybe in a wave election it could be the Democrats’ 32nd district.

16th District: Robbinsville to East Brunswick 59% Obama, +23790 people. 66% white, 19% Asian

The current 14th but pushed further north.

17th District: Lawrence to Somerville to Frenchtown 62% Obama, +1033 people. 73% white

A Democratic district anchored in Princeton reaches into Hunterdon and Somerset Counties.

18th District: New Brunswick to Bridgewater 64% Obama, +10382 people. 48% white, 16% black, 13% Asian, 21% Hispanic

19th District: Edison to Middlesex Boro 62% Obama, +14589 people. 50% white, 29% Asian

20th District: Sayreville, South Amboy, Perth Amboy, Woodbridge 60% Obama, -9702 people. 47% white, 13% Asian, 30% Hispanic

Edison and Woodbridge are huge towns that each take up most of a Senate district so that limits where these districts can go. Sayreville and South Amboy are swingy but Woodbridge and especially Perth Amboy make it a strong Democratic district.

21st District: Warren Co and most of Hunterdon Co 42% Obama, +79 people. 87% white

1 of 4 Republican districts in the north

22nd District: southern Morris Co and northern Somerset Co 43% Obama, +5683 people. 82% white

23rd District: Plainfield to Morristown 60% Obama, -827 people. 55% white, 20% black, 19% Hispanic

1 of 2 Democratic districts that reaches into Morris Co.

24th District: Carteret to Summit 60% Obama, -4165 people. 64% white, 16% black, 14% Hispanic

This is Tom Kean Jr’s district and it’s probably too Democratic for him to win it. This map is meant to shut Republicans out of Union County.

25th District: Elizabeth, Roselle Park, Union Twp, Kenilworth 68% Obama, -9436 people. 35% white, 17% black, 43% Hispanic

26th District: West Orange to Parsippany 54% Obama, -24058 people. 71% white, 15% Asian

This is the second weakest of the Democratic districts. I hope the Democrats have the balls to go for it. This underpopulated district is balanced out by the 16th, a similar affluent suburban district that’s overpopulated.

27th District: Fairfield to Nutley 58% Obama, -10336 people. 69% white

Northern Essex county makes a clean compact district. This is the kind of district Republicans would have to win to take the State Senate under this map.

28th District: Hillside to East Orange 92% Obama, -1160 people. 70% black

Sure I could break this up and strengthen nearby suburban Democrats but that wouldn’t be fair to black voters. Even though there isn’t a VRA at the state level.

29th District: Newark except the East Ward 94% Obama, +9081 people. 58% black, 33% Hispanic

The East Ward is the part that’s most different from the rest of Newark.

30th District: Newark’s East Ward, Harrison, Kearny, northwest Jersey City 74% Obama, +7567 people. 37% white, 10% black, 15% Asian, 36% Hispanic

31st District: Bayonne, most of Jersey City, Hoboken 76% Obama, -5099 people. 43% white, 23% black, 11% Asian, 21% Hispanic

The part of New Jersey that’s facing Manhattan.

32nd District: northern Hudson Co 70% Obama, -9167 people. 26% white, 66% Hispanic

This is one of the densest places in America.

33rd District: Passaic to Prospect Park 61% Obama, -21711 people. 48% white, 39% Hispanic

34th District: Paterson to Wayne 68% Obama, +15509 people. 36% white, 19% black, 40% Hispanic

The 2 lower Passaic Co districts balance each other out in population and spread Democratic strength as evenly as possible.

35th District: North Arlington to Edgewater 55% Obama, -10610 people. 61% white, 16% Asian, 20% Hispanic

36th District: Hackensack to Wyckoff 57% Obama, +4722 people. 65% white, 19% Hispanic

37th District: Teaneck to Hillsdale 55% Obama, -6373 people. 63% white, 15% Asian, 13% Hispanic

38th District: Fort Lee to Upper Saddle River 55% Obama, -19114 people. 61% white, 21% Asian, 11% Hispanic

Democratic strength is spread evenly over 4 Bergen County districts. There is an incumbent Republican in one of these districts, Gerry Cardinale, who won’t go down without a fight. Sure it might be smarter to make Bergen Co 3-1, but 4-0 can be done if you accept the risk.

39th District: northern Morris and southeast Sussex 44% Obama, -436 people. 78% white

40th District: Sussex Co, upper Passaic Co, far west Bergen Co 42% Obama, +3767 people. 88% white

The Republican Gerrymander: 21 Republicans, 19 Democrats


1st District: Cape May Co, most of Cumberland Co, southern Atlantic Co. 49% Obama, -9122 people. 77% white

There is only so much you can do with a Cape May-Cumberland based district.

2nd District: Atlantic City to Millville 64% Obama, +15480 people. 49% white, 21% black, 24% Hispanic

A Democratic vote sink in southeast NJ.

3rd District: Salem Co, southern Gloucester Co 51% Obama, -11895 people. 84% white

2 Democratic districts grab Democratic pieces of Gloucester Co and this is what’s left. There are a lot of 51% Obama districts in this map and Republicans will have to hold all of them in order to control the State Senate.

4th District: Glassboro to Winslow to Gloucester Twp 65% Obama, +5349 people. 72% white

A Democratic vote sink in fast growing exurban Camden.

5th District: Paulsboro to Cherry Hill 73% Obama, +1310 people. 79% white

A bowtie-shaped district in suburban Camden taking the Deptfords in the west and Cherry Hill/Voorhees in the east.

6th District: metro Camden, Pennsauken 75% Obama, -1862 people. 46% white, 26% black, 24% Hispanic

7th District: northwest Burlington Co 66% Obama, -13652 people. 65% white, 24% black

A Republican district on borrowed time. Diane Allen’s district with super-Democratic Pennsauken removed and swingy Moorestown added.

8th District: mid Burlington Co 54% Obama, -5473 people, 78% white.

More Republican than the current 8th but it’s also on borrowed time.

9th District: Pinelands 45% Obama, +1626 people. 86% white

Maybe the biggest possible legislative district in NJ.

10th District: Manchester and everything east 42% Obama, +3374 people. 89% white

This is the best, most compact possible Toms River district.

11th District: Brick to Neptune/Asbury Park 47% Obama, +11385 people. 81% white

The Democratic stronghold in eastern Monmouth Co gets broken up.

12th District: Ocean Twp to Middletown 48% Obama, -2331 people. 79% white

13th District: Marlboro to Lakewood 42% Obama, +20025 people. 74% white

Lakewood makes it a very Republican district.

14th District: Bordentown to Jackson 49% Obama, +1427 people. 83% white

Hamilton, Robbinsville and Bordentown get combined with Republican territory in Monmouth and Ocean Co.

15th District: mid Mercer Co 77% Obama, -1260 people. 46% white, 28% black, 16% Hispanic

The most Democratic parts of Mercer Co get packed into 1 district.

16th District: East Windsor to North Brunswick 61% Obama, +18056 people. 63% white, 19% Asian

This is the least Democratic of the Democratic districts on this map. It has some swingy territory such as Monroe and Cranbury but it’s not practical to make another Republican district out of it.

17th District: Sayreville to Holmdel 50% Obama, -6665 people. 73% white

Holmdel is the Republican anchor in this district.

18th District: Franklin to Plainfield 73% Obama, -3410 people. 35% white, 29% black, 15% Asian, 19% Hispanic

It packs in Democrats so the rest of Somerset and western Union can go in Republican districts.

19th District: New Brunswick, Edison, South Plainfield 65% Obama, -5455 people. 45% white, 24% Asian, 19% Hispanic

20th District: Woodbridge, Perth Amboy, Carteret, Rahway 65% Obama, -9392 people. 42% white, 11% black, 12% Asian, 33% Hispanic

21st District: Hopewell to southern Warren Co 47% Obama, -14398 people. 87% white

It’s Republican enough to absorb Hopewell.

22nd District: most of Somerset Co 48% Obama, -4927 people. 74% white

23rd District: western Union Co, eastern Somerset Co, except the Plainfields 50% Obama, -15124 people. 81% white

Tom Kean Jr’s district becomes a little more Republican.

24th District: Linden, Roselle, Elizabeth, Hillside 76% Obama, +555 people. 27% white, 25% black, 43% Hispanic

Union County: the extremely Democratic 24th and barely Republican 23rd cancel each other out. Sounds fair, right?

25th District: western Essex Co, eastern Morris Co 45% Obama, +8071 people. 84% white

26th District: West Orange to Clifton 71% Obama, +24087 people. 54% white, 21% black, 16% Hispanic

This is the only white-majority Democratic district in northern NJ. Packing makes all the other Democratic districts majority-minority.

27th District: Union Twp to East Orange 85% Obama, -2308 people. 26% white, 60% black

28th District: Newark except the East Ward 94% Obama, +9081 people. 58% black, 33% Hispanic

29th District: Newark’s East Ward, Harrison, Kearny, northwest Jersey City 74% Obama, +7567 people. 37% white, 10% black, 15% Asian, 36% Hispanic

30st District: Bayonne, most of Jersey City, Hoboken 76% Obama, -5099 people. 43% white, 23% black, 11% Asian, 21% Hispanic

The Newark-to-Jersey-City districts are the same in both the Democratic and Republican gerrymanders. The region is solidly Democratic so partisan gerrymandering gets done elsewhere.

31st District: Northeast Hudson Co, Edgewater, Cliffside Park 71% Obama, +7678 people. 27% white, 64% Hispanic.

This district reaches into Bergen Co instead of Secaucus to make the Republican Meadowlands district possible.

32nd District: south Bergen Co, Secaucus, Belleville, Nutley 52% Obama, -460 people. 67% white, 12% Asian, 18% Hispanic

A tough district the Republicans have to win in order to take a majority in the State Senate.

33rd District: Passaic to Ridgefield 68% Obama, -7147 people. 38% white, 43% Hispanic

34th District: Paterson, Haledon, Fair Lawn, Elmwood Park 77% Obama, +2697 people. 29% white, 21% black, 46% Hispanic

35th District: Teaneck/Englewood area 64% Obama, +3610 people. 46% white, 12% black, 24% Asian, 17% Hispanic

36th District: northern Bergen Co to Saddle Brook 47% Obama, +3657 people. 78% white

37th District: mid Passaic Co, western Bergen Co 46% Obama, -3884 people. 85% white

38th District: southern Morris Co 47% Obama, -7357 people. 72% white

39th District: northern Morris Co and upper Passaic Co 46% Obama, -4254 people. 80% white

40th District: Sussex Co, most of Warren Co 39% Obama, -9579 people. 88% white

Conclusion

It’s possible to give the Democrats 19 to 31 seats. 25 is the logical compromise. I would suggest incumbent protection (24 Dems) plus the two Burlington County Republicans on borrowed time.

Wyoming Rule – Analysis

Over the past few weeks there has been a flurry of diaries about the Wyoming Rule (California, Texas, New York, Pennsylvania, Tennessee, Maryland, Oregon, New Mexico, and my Washington map below). Many of these diaries asked at the end what they thought about the Wyoming Rule, and the intent of this diary is to examine some of the benefits and drawbacks of the Ruie itself. 

The primary benefit of the Wyoming Rule is that the districts are smaller for many states – or about 75%-80% the size of the current projected district size. California would go from 52 seats to 68, Washington from 10 to 12, and Oklahoma from 5 to 7. Other states would stay the same – Hawaii, Nebraska, and Rhode Island.  (The number of districts for each state was researched by borodino21). The range between states would drop from about 400k (Rhode Island to Montana) to 300k (South Dakota to Alaska).

The smaller district sizes in most states means that there are more opportunities to preserve communities of interest. For some states like North Carolina, this means it may be possible to create additional minority-majority or minority-influence districts. In other states, it may be possible to draw more CDs that encompass only one county or city.

While I do not wish to subscrible to albguy's method of creating as many Democratic districts as possible (while I do enjoy his method of pushing the limits of a redistricting map), the smaller districts may make it harder to create all Democratic seat maps.

In Washington, a more realistic map under the Wyoming Rule likely means two safe(r) Republican seats in Western Washington and two or three safe Republican seats in Eastern Washington. Now perhaps one or two of those districts may be better considered swing districts (especially a Vancouver to Yakama district), but the result of the Wyoming Rule is a 7-5 delegation (compared with the current 5-4 delegation with the possibility of a 6-4 delegation after the 2011 redistricting).

The Wyoming'd New York faces a similar problem. In jsramek's New York – the delegation would be 30 Democrats and 6 Republicans. This map also includes the cracking of Staten Island, which would probably not be politically viable – even for a solidly Democratic state legislature. While this is better than the 8 Republicans representing NY in the 2011-2012 Congress, many of the maps made for the Redistricting Contest would contain 1 or 2 Republicans out of New York's 28 Congressional Districts. 

The resaons for these results is that the smaller district sizes make it more difficult to crack Republican strongholds – or areas without overwhelming the nearby Democratic area. So, back to New York, at least 4 upstate districts are created as Republican vote sinks, instead of the possibilty of spreading them out. In Western Washington, eastern King, Pierce, Thurston and Clark counties are Republican areas, as well as Lewis and most of Cowlitz counties. In some maps, it is possible to divide those populations and combine them with more Democratic areas such as Vancouver, Olympia, Tacoma, and Bellevue to allow for Democrats to win those districts (but as in the 2010 elections, Republicans held on in WA 8 [East King and Pierce County] and won in WA 3 [SW Washington including Olympia]). With smaller districts, you can create two safe Republican districts in those Republican areas in exchange for two additional safe Democratic districts (and possibly another swing district). 

So, where does that leave us?  I think the advantages of the Wymonig Rule outweigh the drawbacks. More representation is better from a democracy standpoint, but it also helps Democrats in the big picture. For all of the concerns about not being able to maximize Democratic seats, the Republicans would not be able to either. In addition, more Congressional seats will also help Democrats in the Electoral College.